

Significance
This paper proposes a simple theory, inspired by statistical mechanics, of the interplay of entropic forces and selective forces on dinucleotide frequencies in viral genomes that occur when a virus migrates to a new host. The theory is quantitatively developed, and leads to many predictions about statistical features of viral evolution. The approach is general, and could be easily extended to other genomic data and have wider applications. For example, an analysis of avian influenza entering the human genome has identified selection against CpG dinucleotides, which have been shown to trigger a response of the innate immune system and interferon production.
Abstract
We outline a theory to quantify the interplay of entropic and selective forces on nucleotide organization and apply it to the genomes of single-stranded RNA viruses. We quantify these forces as intensive variables that can easily be compared between sequences, outline a computationally efficient transfer-matrix method for their calculation, and apply this method to influenza and HIV viruses. We find viruses altering their dinucleotide motif use under selective forces, with these forces on CpG dinucleotides growing stronger in influenza the longer it replicates in humans. For a subset of genes in the human genome, many involved in antiviral innate immunity, the forces acting on CpG dinucleotides are even greater than the forces observed in viruses, suggesting that both effects are in response to similar selective forces involving the innate immune system. We further find that the dynamics of entropic forces balancing selective forces can be used to predict how long it will take a virus to adapt to a new host, and that it would take H1N1 several centuries to adapt to humans from birds, typically contributing many of its synonymous substitutions to the forcible removal of CpG dinucleotides. By examining the probability landscape of dinucleotide motifs, we predict where motifs are likely to appear using only a single-force parameter and uncover the localization of UpU motifs in HIV. Essentially, we extend the natural language and concepts of statistical physics, such as entropy and conjugated forces, to understanding viral sequences and, more generally, constrained genome evolution.
The nucleotide sequence of a genome is composed of a variety of sequence motifs whose organization is influenced by many forces. Most prominently, amino acid coding sequences are restricted by the genetic code and codon use patterns for a particular organism or tissue (1–3). Likewise, a variety of cis-acting nucleotide sequences control gene expression profiles, regulating factors such as timing, quantity, and responses to environmental cues.
Karlin et al. first showed that the relative abundance of dinucleotides in viral genomes could elucidate evolutionary relationships between groups of viruses, and viruses and their hosts (4). Likewise, Rabadan et al. (5) and Greenbaum et al. (6, 7) first demonstrated that in influenza genomes, nucleotide sequence-specific evolutionary changes occur over decades and reflect viral transitions from avian to human hosts. These changes are not driven by amino acid alterations or codon preference—they largely reduce CpG containing nucleotide sequence motifs by third codon position changes that have no impact on amino acid composition of the viral proteins. It was posited that this effect was due to differences between the human and avian innate immune systems, which would recognize (in humans) or not recognize (in birds) CpG dinucleotides in the RNA of these viruses, possibly via a Toll-like receptor (TLR) (8). Hence, influenza viruses moving into humans would adapt their genome sequence motifs to avoid detection and inhibition by the host immune system. Other patterns of host genome mimicry have been demonstrated between viruses and their hosts (9, 10). In viruses such as HIV, host enzyme activity creates biased nucleotide composition in viral RNA and DNA (11, 12). Additional examples, such as secondary structures of RNA genomes and bacterial restriction enzymes, exert analogous selective forces on sequence motifs (13–15). Thus, there are many different forces under which a genome’s information content may be optimized for a particular environmental advantage.
There has not been a general quantitative theory designed to characterize the forces that directly affect nucleotide sequence organization and how they can change over evolutionary time when a genome is introduced into a new environment. To accomplish this we use an approach from statistical physics (16, 17). We apply our method to the genomes of single-stranded RNA (ssRNA) viruses, quantifying the degree to which avoidance or enhancement of a nucleotide motif causes a virus to alter its sequence organization relative to a given background distribution. The magnitude of the effect is captured by a selective force, conjugated to the number of times a motif occurs. In much the same way as with thermodynamic forces, acting on the volume or the number of particles constrain a system, the presence of selective forces constrains the diversity of viral genomes. By contrast, the high rates of mutation and replication for these RNA viruses provide a great deal of sequence diversity, creating “entropic forces” opposing the selective forces minimizing sequence diversity. The larger of these two forces then drives the evolution of the virus until, eventually, the two forces balance each other and an evolutionary equilibrium state is reached.
Many viral genomes, such as those for ssRNA viruses, are largely devoted to protein coding. In the absence of selective forces on motifs, and fixing the amino acid sequence for a given protein, codon use patterns would dictate the diversity of genome sequences. An “ideal” virus, in the absence of other outside forces on motifs, would evolve to have the number of motifs one would expect given its amino acid sequence and a codon use bias for the tissue in which it replicates. We can then derive the selective force on a motif in a virus by calculating the degree to which the viral sequence is in a lower probability state than this ideal virus, given the number of times that motif occurs. In this work we examine these forces on dinucleotide motifs using both the codon use bias of the protein sequence under consideration and the average codon use bias of its host, interpreting the cases where they differ.
Materials and Methods
Sequence Data.
The influenza sequences used in this study were taken from the National Center for Biotechnology Information Influenza Database (18). Only those sequences containing complete coding regions were then used in the analysis. The HIV sequences were taken from the Los Alamos HIV database and the same controls were applied (19). The list of all sequences used appears in Dataset S1. The human genomes used for the codon bias calculation was Consensus-Coding DNA Sequence (CCDS) Build Hs36.3. The data were obtained from the University of California, Santa Cruz Genome Browser (20–22).
Distribution over Sequence Space.
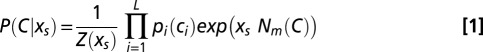
We want to quantify the constraints acting on a nucleotide motif m in a (viral) DNA or RNA sequence, hereafter called C0. We introduce a model over the set of all codon sequences C = (c1, c2, …, cL), differing from C0 through synonymous changes only. In the absence of constraints the probability of a sequence C in our model is simply the product of the probabilities of its codons,  , where
  is the codon bias of the ith codon in C0. In the presence of a constraint over a nucleotide motif m, the probability of a sequence C becomes
 |
where  is the number of occurrences of the motif m in C, and the denominator
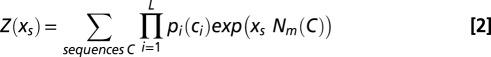 |
ensures that the probability P is correctly normalized. Parameter  , hereafter called the “selective” force, introduces a bias over P. Positive values for
  push the distribution toward sequences with large N, whereas negative
  favor sequences with a small N.
The choice of the exponential dependence on N in [1] is justified by information-theoretic arguments: P defined above is the least constrained distribution (with minimal information, or with maximal entropy), whose average number of motifs is
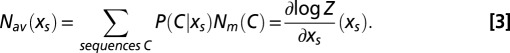 |
The value of the selective force  can then be chosen such that
  is equal to the number of motifs m in the original sequence,
  The formalism above can be easily extended to the case of multiple selective forces, acting on multiple motifs. Details can be found in SI Text.
Entropy of Sequences as a Function of the Number of Motifs.
Let  be the logarithm of the number of sequences C having N repetitions of m, hereafter called “entropy.”
  is bounded from above by
  , the total entropy of the distribution of sequences in the absence of selective force
  .
.  is equal to the sum over all 20 amino acids a of the number of codons coding for a in the sequence C0, multiplied by the entropy of the codon bias distribution for this amino acid a. See SI Text where bounds on its value are also derived.
Classical equilibrium thermodynamic relations show that  is the Legendre transform of
  (23):
(23):
The maximization condition over N expresses the balance between the selective force  and the “entropic” force
equal to the derivative of the entropy. At equilibrium,  and
and  sum to zero. However, selective and entropic force need not always compensate each other, as when out-of-equilibrium dynamical effects are present (Dynamical Modeling).
The Legendre formalism [4] provides a parametric representation of the entropy curve  under the form
  , which yields
  as given by [3], and
As  spans the set of real numbers, the entropy curve is obtained; its maximum is reached in
 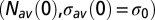 , corresponding to vanishing force,
  .
.
We illustrate the notions above with a very simple example of a sequence C0 coding for one alanine (L = 1). We assume for simplicity that all four codons c = GCn, with n = A, U, C, and G, coding for alanine have equal probabilities  (uniform codon bias). The entropy of sequences in the absence of selective force is
  , which is the logarithm of the degeneracy of alanine. In the presence of a selective force
  and for the motif m = CG, we readily obtain
 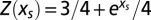 . The average number of motifs is
 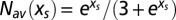 according to [3], and the entropy is
  according to [5]. The corresponding entropy curve is plotted parametrically in Fig. 1A (see legend for further explanations).
Fig. 1.

Entropy curve  as a function of the number N (Nb.) of occurrences of a motif. (A) Toy example of a single-codon sequence, coding for alanine (derived in Materials and Methods). The entropy for an influenza B isolate (B/Cordoba/2979/1991) is derived for motifs (B) ApA and (C) CpG. Green and red lines show, respectively, the zero-force and real values of the numbers of motifs, with the arrows indicating the balance of selective and entropic forces at the real value. The ApA (B) entropy is flatter than the CpG (C) entropy around the maximum
  .
.
In the generic case of a sequence C0 of length L, the sum defining  in [2] runs over an exponentially large-in-L number of sequences C. It can, however, be computed very efficiently, in a time growing linearly with L only. The method, called “transfer matrix” in statistical physics or “dynamic programming” in computer science, allows us to compute the entropy even for very long sequences in a short time. This method is useful for understanding the properties of a large system based on the interactions between its subsystems, which in our case are neighboring codons. Simple examples of the transfer matrix method (Figs. S1 and S2), and details about its implementation are found in SI Text.
Given the selective force  the number N of motifs m in a random sequence C fluctuates around the average value
  , with a variance
  . Reciprocally the value of the force such that
  is equal to the number N of motifs in the real sequence C0 may fluctuate around its average value with a variance
  . Both variances can be computed from the uncertainty relation
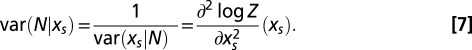 |
The variance in the force on a motif is useful to estimate whether two values of the forces computed for two sequences are statistically distinct.
Dynamical Modeling.
We model the time evolution of  from an initial value
  to its equilibrium value
  under the action of a selective force
  through a simple relaxation dynamics
where the entropic force,  , is defined in [5]. The value of N will evolve until the imposed selection force
  balances the entropic force
  , resulting from the loss of entropic diversity of the sequences. Parameter
  is a measure of the time scale on which the number of motifs diminishes by one unit, when the difference between the forces is of the order of the unity, e.g., at the beginning of the evolution. As the difference between the forces gets smaller and smaller with time, the relaxation time to equilibrium is much larger than
  .
.
Results
Forces Relative to Viral and Human Codon Biases.
Materials and Methods presents a procedure to compute the entropy, that is the logarithm of the number of sequences, as a function of the number of repetitions of a given motif. The background distribution is derived from either viral or human codon biases. We also work through a simple example of how to use these methods, which is illustrated in Fig. 1A.
When the H1N1 influenza A virus entered the human population from a likely avian host in 1918, the CpG dinucleotide content of the genome was lowered from levels typically associated with avian viruses toward levels more associated with human viruses (6–8). For the genomes of influenza B isolates, a virus for which humans have been a natural host for many centuries, the number of CpG dinucleotides varies little over time. Fig. 1B shows the entropy curve for ApA. The curve is flat and symmetric, and the slope of the curve at the value of ApA in the real virus is close to zero (the maximum entropy value). The occurrence of ApA dinucleotides to a large degree may therefore vary randomly. The number of CpG dinucleotides corresponds to a location on an entropy curve of high slope, as shown in Fig. 1C. We define the entropic force as the slope at the actual value of these motifs in the viral genome. Unlike ApA, the selective force acting on CpG, opposite to the entropic force, is very different from the zero value corresponding to maximum entropy. Both curves have the same maximum value, as they have the same entropy when no force is applied. An expression for the maximum value, and how it is bounded, appears in SI Text.
One can use either the virus or host codon bias to generate the sequence background distribution relative to which these forces may be inferred, and the resulting forces must therefore be interpreted relative to that choice. For the human codon bias, we use the coding regions of the whole human genome. This is an average codon use bias that may not reflect more restricted biases that occur in particular gene families or cell types. Fig. 2 compares the selective forces calculated for all 16 dinucleotides derived relative to both the host and virus segment codon use biases, for the longest genes of influenza polymerase basic 2 (PB2) and HIV polymerase (pol). In Fig. 2A the median force values are given for influenza A H1N1 in 1918 (green) and 2007 (blue), along with those for influenza B (red). Relative to the host codon use bias, and unlike the viral segment codon bias, the forces acting on dinucleotides are often nonzero, with CpG being the only large standout in magnitude. The dispersion of forces over many dinucleotide motifs, relative to the average host codon use bias, typically increases with time, and is greatest in influenza B, the virus adapted to humans for the longest time. UpG and CpA, the mutational outcomes of CpG avoidance, have a positive force relative to the host codon bias, and UpA has a negative force (two mutational events are a less likely path). Most of the forces on dinucleotides are smaller relative to the viral codon bias than relative to the human codon bias. Therefore, actual sequences in a viral genome are closer to ideal viruses generated by the viral codon use than those generated by human codon use. Thus, there is a limit to the host mimicry observed in these viruses. The influenza A PB1 and PA genes are similarly analyzed and can be found in Fig. S3.
Fig. 2.

Comparison of selective forces using both segment and human codon biases for all dinucleotides. Forces are derived for (A) influenza PB2 (showing the 1918 H1N1 segment, and the median values for all 2007 H1N1 and influenza B segments), and for (B) HIV pol (showing median values for HIV-1, SIVcpz, HIV-2, and SIVsm). Dinucleotides under large forces are indicated. For PB2, arrows indicate the direction from 1918 to influenza B. In the HIV and SIV, ellipses contain outlying dinucleotides. (C) Histogram of forces on CpG for all human CDS regions, with a Gaussian fit to the bulk of the distribution. Far left outliers contain many type I IFNs.
The polymerase gene (pol) from HIV-1 was analyzed in the same fashion and the results are shown in Fig. 2B, where the same quantities are calculated for the pol gene from HIV-1, SIV chimpanzee (SIVcpz), HIV-2, and SIV sooty mangabee (SIVsm), all related viruses. The selective force on dinucleotides for viruses changes less between these hosts, which are more closely related (humans and simians), than in influenza (humans and avians). One difference between HIV and influenza is that the dinucleotide ApG in HIV genomes stands out as having a positive force not observed with influenza virus segments. ApG motifs have been associated with the action of RNA-editing enzymes on the HIV genome (11, 12).
Despite their very different genome replication cycles, most motifs of dinucleotides from HIV and influenza have no force acting on them relative to the viral codon bias, whereas there are dinucleotide motifs with forces acting on them relative to the human codon bias. A parallel analysis of gag and env is presented in Fig. S4. The forces on HIV may reflect a functional significance, as shown by the studies of Vabret et al. (24, 25), who showed that the HIV-1 virus did not replicate as well when third position codon nucleotides were changed (with no amino acid changes) in the gag gene.
Host Gene Mimicry.
An intriguing result was obtained in Greenbaum et al. (7), when many of the genes that compose the innate immune system were examined, particularly type I IFN genes in the human genome. These genes also had very low numbers of CpG dinucleotides, as was observed with influenza viruses evolving in human populations. Based on those observations it was hypothesized that a subset of genes in the innate immune system are most subject to the forces acting on CpG motifs. The quantitative theory developed here now allows us to calculate and quantify those forces. It permits us to test the idea that forces acting to change CpG content are gene- or function-specific in the human genome. We show in Fig. 2C the histogram of the selective forces on CpG for all coding regions in the human genome. The distribution can be fitted with a Gaussian, with mean  = −0.7611 and SD
  = 0.8551 apart from genes falling well outside the distribution, with values less than −4. According to standard extreme value theory the expected minimum value from the normal distribution is equal to
 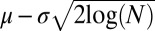 , where N is the number of normally drawn samples (26). For this case, the expected minimum value if −4.5674 and all outliers less than −4 also fall outside of that value. A table of the median values of the forces and their variances, another means of assessing outlier significance, is shown in Table S1.
Many type I IFN genes appear as outliers on the left of Fig. 2C. The value of the CpG forces these genes are under, along with other information is shown in Table S2. One would predict that the effect of such forces on these genes could be used as a discovery tool for human genes regulated in a similar fashion with similar functions. This would be a quantitative definition of a subset of genes that populate the human innate immune system. As an experiment, we explored all genes whose CpG force values were less than that observed in PB2 for influenza B. The results are depicted in Table S3. Strikingly, not only are the type I IFN genes depicted, but other innate immune genes are present in this group.
For the same force to be causing these effects on both a host and viral gene set, causing the virus to mimic the very genes that respond to it, many mutational events must occur. The force could be driven by a receptor that observes and interacts with the RNA CpG motif, leading to the transcription of genes that limit viral replication (8). The force would act on a set of host response genes, as well as viral genes, so the mRNA of the host genes would minimize CpG content to prevent a positive feedback loop from occurring. Innate immune recognition of CpG in DNA is known to occur via TLR9, and TLR7 and -8 recognize ssRNA (8, 27). CpG methylation occurs in the DNA of host genes protecting them from these innate responses, whereas methylation is not observed in RNA viral genomes lacking a DNA intermediate step.
A Dynamical Model for the Influenza A Virus.
In H1N1 human influenza viruses, the force on CpG levels declines over time approaching levels seen within influenza B viral genomes. The effect is strongest in the three longest genome segments, and is less noticeable in the HA gene, presumably due to strong selection from the adaptive immune system on the HA protein. As seen in the previous section, these dynamical changes which occur when influenza viruses switch from avian to human hosts, are not observed when HIV and SIV are compared, likely reflecting the fact that HIV came into the human population from a more closely related simian reservoir.
A dynamical model was used to better understand how forces and motifs evolve with H1N1 influenza viruses with time. In this model, the number of motifs evolves under a (negative) selective force, which increases the magnitude of the entropic force (reducing sequence complexity) until both the selective and entropic forces compensate one another, and equilibrium is reached (Materials and Methods). For PB2, PB1, and PA, we first determine the selective force under the assumption that the influenza B genome represents the equilibrium force value for that segment, as it has evolved in humans for many years. The equilibrium force  is estimated by the mean value of the selective forces computed for all influenza B sequences (Table 1). For the initial condition
  we choose the corresponding force value for the H1N1 sequence from 1918 when H1N1 was first introduced into humans (Table 1). Our dynamical model then gives the entropic force as a function of time,
  , where t measures years of evolution. The opposite of the entropic force interpolates between
  , and
, and  .
.
Table 1.
Dynamical parameters in H1N1 CpG force evolution
| Segment |
|||
| Parameters | PB2 | PB1 | PA |
| Equilibrium force xB | −1.99 | −2.04 | −2.2 |
| Initial force x0 | −1.21 | −1.34 | −1.15 |
Time scale 
|
2.3 | 2.4 | 6.0 |
The outcomes of this analysis are shown in Fig. 3. The model includes a single time scale, τ, which represents the elementary time for motif loss, and is fitted to make  best coincide with the H1N1 data over the available time range. Because the H1N1 virus disappeared from the human population in the early 1950s, and a nearly identical virus reappeared in 1977, the 27 y that H1N1 was not circulating in the human population are not included in the time that this virus evolved in humans (28). The three rates (1/τ) for evolutionary change range from 0.17 per year for PA, to about 0.4 per year for PB1 and PB2. Those estimates are 2–5 times larger than the average time for a synonymous substitution to happen in the corresponding genes (of comparable lengths), about 0.07 per year (29). This would imply that one in two synonymous substitutions in PA and one in five in PB1 and PB2 result in the loss of a CpG motif. In addition, according to the model it would take about five centuries for the PA segment to reach equilibrium (Fig. 3). Remarkably all of these sequence data fall within one SD (calculated according to [7] and [8]) forming a narrow strip around the model prediction as seen in Fig. 3.
Fig. 3.

Dynamical simulation of force equilibration using real values from H1N1 for PB2, PB1, and PA, with the human codon bias. PA has the longest time scale. Red dots show the selective force and year for one isolate; multiple isolates may come from a given year. The negative average entropic force in the model is shown as a function of time in blue (continuous line), with ±1 SD (dashed lines). Selective forces for influenza B for each segment are in green (each dot corresponds to a virus sequence). Dotted green lines indicate the equilibrium force  .
.
Motif Localization.
To visualize how these forces affect where the motifs are likely or unlikely to be found in a viral genome, we examined the local motif density, as described in SI Text. To do so, we calculated the probability that a motif appears at a given position along the genome, both with the viral sequence and human codon bias. Compared with the positions of dinucleotides from sequence data this then becomes a test of the validity of the approach. Locations with high probabilities can be directly compared with the real locations of motifs from the viral sequence data.
To get a sense of what these distributions might look like in an equilibrium setting, the case of influenza B was examined. Both CpG and UpG dinucleotides were calculated with the viral segment codon bias. In the former case the motif has a negative force, and is therefore suppressed. In the latter the force is positive and the motif is enhanced.
The local probability landscape for CpG dinucleotide motifs with C in the third codon position is shown in Fig. 4A. The locations of CpGs determined from sequence data clearly tend to coincide with peaks in the probability landscape. To better visualize this effect, in Fig. 4B, the occupation probability predicted by our model, averaged over the positions at which CpGs occur in the viral sequence, is plotted along with the same probability averaged over the positions where the motif is absent from the RNA sequence. The average probability associated with CpG occurrences from the sequence data are consistently higher than the one corresponding to locations with no CpG in the sequence data. Even though the values of the force on CpG dinucleotides declines over time (Dynamical Modeling), the ratio of the average probability associated with actual CpG occurrences in a sequence to the probabilities associated with sites where no real CpG occurs remains essentially fixed.
Fig. 4.

(A) Probability of finding a CpG motif at a given third position along a sequence for PB2 in an influenza B isolate (blue lines), whereas a red × indicates where a real motif occurs. (B) Occupation probability for third codon positions computed from our model as a function of year of evolution, averaged over sites where a real motif occurs (red) and sites with no real motif but a nonzero probability of occurrence (blue). The former is higher by a ratio of about 1.6. (C) Same as A for PB2 under a force on UpG and using its segment codon bias. (D) Same as A for gag with a force on UpU using the human codon bias.
Next, local probability landscapes for two examples of motifs under positive selective forces were examined. Fig. 4C examines the dinucleotide UpG, which undergoes a meaningful positive force with respect to the viral segment bias. Unlike with CpG, UpG is not a rare dinucleotide, so the fact that most sequence occurrences of the dinucleotide come at high probability “hotspots” is clear.
Finally, we note that in HIV-1, a retrovirus with a very different replication cycle than influenza, localization of motifs also occurs. Fig. 4D shows the HIV-1 gag dinucleotide probability landscape with respect to the human genome bias for the dinucleotide UpU. There is a clear cluster toward the end of the gag gene. This cluster is located in the region shown by Pavlakis and colleagues to be a regulatory feature for the timing of the gag gene expression, and is more precisely defined here (30, 31). Here the selective forces for optimal replication of the virus limits the sequence motif entropy. UpU motifs have also been associated with the activation of a TLR (TLR8) (32).
Discussion
We have developed a quantitative method for the analysis of the entropic and selective forces that act to shape the distribution of nucleotide motifs in a genome. Although the genetic code and codon use clearly shape nucleotide sequence motifs in a genome, forces such as motif specific receptors and enzymes also play a role. Our approach quantifies these forces, shows their effect on sequence entropy, and allows direct comparisons between genomes as intensive quantities, meaning that their value is not reflective of the size of the genome considered, and one can thus compare their value between sequences with different origins. In addition to providing a more formal theoretical framework, this approach is computationally far faster than other attempts to measure similar parameters (6), where a set of randomized viruses had to be created to infer the number of significant motifs.
By far the strongest repressive forces altering viral genome landscapes act on CpG dinucleotides. This can be observed in very diverse viral genomes such as human influenza strains, HIV, and SIV, taking as a reference both the viral codon bias and the human codon bias. The observation is consistent with previous observations (6), where CpG was found to be underrepresented in influenza with respect to the viruses own codon bias, as well as in all other mammalian ssRNA viruses.
Likewise, in the H1N1 strain of influenza A, UpG and CpA are enhanced and UpA is repressed. With respect to the viral codon bias, those forces are essentially zero for HIV, SIV, and influenza B, but they differ from zero for the large majority of dinucleotides when using the human codon bias as reference. The fact that this occurs in viruses that have been replicating in humans (or simians) for a very long time indicates that, at equilibrium, the entropic and selective forces described in this paper generically reflect a divergence away from the typical human codon bias and the viral codon bias, limiting genome sequence motif mimicry. However, in the human genome a subset of genes have evolved very similar motif distributions to those observed for the viruses studied here. Many genes with strongly negative forces on CpG, correspond to genes of the innate immune system, providing a quantitative definition for detecting a gene that is part of the innate immune response to infections by these viruses. Indeed it is likely that diverse classes of viruses trigger different innate immune responses and we will detect different host genes by mimicry using different viruses.
Although innate immunity is one source of explanation for the observed effects, it is not the only one. Common RNA structural motifs could also provide an explanation for why some nucleotide motifs are subject to positive and negative forces, as well as other protein–RNA interactions involved in other processes besides innate immunity. There is a growing body of evidence that codon use, tRNA concentrations, and other rate-limiting translational factors will impact the sequence motifs used by a virus (33–36). As these methods are applied to other genomes besides viruses, a wider set of phenomena may underlie these forces.
Moreover, there is the issue of the larger set of forces that appear relative to the human codon bias, as opposed to the viral bias. We offer two possible explanations for this effect. First, it may be that codon use for the different cell types in which a given virus replicates is not the same as the average human codon bias. Certainly, tRNA use may vary between cell types. To remedy this, one would ideally use a cell-specific codon bias in future applications. Moreover, some viruses are known to manipulate host tRNA use to their advantage, which would induce selective forces, and may be responsible for the general dispersion of forces relative to the human codon bias, but not the viral codon bias. For instance, HIV-1 was postulated to modulate actively the tRNA pool under which it replicates, to maximize replication efficiency for its A-rich genome (33). Indeed relative to the human codon bias, ApA is the motif in HIV-1 with the greatest positive force on it. An enhancement of A-rich dinucleotides relative to the human codon bias may well reflect such a tendency, and the observance of a similar dispersion of dinucleotide forces in influenza B may show that such phenomena are a common viral strategy.
The model permits one to predict locations where a dinucleotide is more or less likely to occur along a sequence due to a given force, and to demonstrate regions where many occurrences of a motif localize, as was the case for UpU motifs in gag, associated with the timing and levels its protein. In addition the model can be constructed to show how these forces evolve. With only a time-scale parameter, we can fit through the dynamical model the evolution of CpG forces during the history of influenza A H1N1 segments and use this parameter to predict how long it will take for the virus to attain the level of force found in influenza B. The model showed an excellent fit of the predicted data points to the actual results as the H1N1 virus evolved between 1918 and 2007. It therefore provides an estimate for how long it may take an avian strain to equilibrate in a human host, as well as provides an estimate for the degree to which CpG forces contribute to its overall evolutionary rate.
The ideas presented here give a language for taking into account nonprotein coding features in a quantitative evolutionary theory. The approach is very general, can be used to study longer motifs, and can be generalized for many other types of sequence constraints. In doing so we hope to uncover other forms of latent information hidden beneath known constraints in genomes, and use this information as a tool for biological discovery. The generality of the approach comes from statistical physics, where forces describing the ordering of a system have a natural framework for characterization.
Supplementary Material
Acknowledgments
B.D.G. thanks Nicholas F. Parrish (University of Pennsylvania) for his assistance in collecting the HIV and SIV sequence data used here and Olivier Manches (Icahn School of Medicine at Mount Sinai) for helpful discussions. S.C. and R.M. acknowledge the hospitality of the Simons Center for Systems Biology (Institute for Advanced Study) where this work was initiated, and the authors thank Suzanne Christen for her assistance. The authors thank the Rita Allen Foundation for its support of this work. B.D.G. was the Eric and Wendy Schmidt Member at the Simons Center for Systems Biology and thanks the Center for their support.
Footnotes
The authors declare no conflict of interest.
This article contains supporting information online at www.pnas.org/lookup/suppl/doi:10.1073/pnas.1402285111/-/DCSupplemental.
References
- 1.Sharp PM, Li WH. The codon Adaptation Index—a measure of directional synonymous codon usage bias, and its potential applications. Nucleic Acids Res. 1987;15(3):1281–1295. doi: 10.1093/nar/15.3.1281. [DOI] [PMC free article] [PubMed] [Google Scholar]
- 2.Powell JR, Moriyama EN. Evolution of codon usage bias in Drosophila. Proc Natl Acad Sci USA. 1997;94(15):7784–7790. doi: 10.1073/pnas.94.15.7784. [DOI] [PMC free article] [PubMed] [Google Scholar]
- 3.Rocha EP. Codon usage bias from tRNA’s point of view: Redundancy, specialization, and efficient decoding for translation optimization. Genome Res. 2004;14(11):2279–2286. doi: 10.1101/gr.2896904. [DOI] [PMC free article] [PubMed] [Google Scholar]
- 4.Karlin S, Doerfler W, Cardon LR. Why is CpG suppressed in the genomes of virtually all small eukaryotic viruses but not in those of large eukaryotic viruses? J Virol. 1994;68(5):2889–2897. doi: 10.1128/jvi.68.5.2889-2897.1994. [DOI] [PMC free article] [PubMed] [Google Scholar]
- 5.Rabadan R, Levine AJ, Robins H. Comparison of avian and human influenza A viruses reveals a mutational bias on the viral genomes. J Virol. 2006;80(23):11887–11891. doi: 10.1128/JVI.01414-06. [DOI] [PMC free article] [PubMed] [Google Scholar]
- 6.Greenbaum BD, Levine AJ, Bhanot G, Rabadan R. Patterns of evolution and host gene mimicry in influenza and other RNA viruses. PLoS Pathog. 2008;4(6):e1000079. doi: 10.1371/journal.ppat.1000079. [DOI] [PMC free article] [PubMed] [Google Scholar]
- 7.Greenbaum BD, Rabadan R, Levine AJ. Patterns of oligonucleotide sequences in viral and host cell RNA identify mediators of the host innate immune system. PLoS ONE. 2009;4(6):e5969. doi: 10.1371/journal.pone.0005969. [DOI] [PMC free article] [PubMed] [Google Scholar]
- 8.Jimenez-Baranda S, et al. Oligonucleotide motifs that disappear during the evolution of influenza virus in humans increase alpha interferon secretion by plasmacytoid dendritic cells. J Virol. 2011;85(8):3893–3904. doi: 10.1128/JVI.01908-10. [DOI] [PMC free article] [PubMed] [Google Scholar]
- 9.Pezda AC, Penn A, Barton GM, Coscoy L. Suppression of TLR9 immunostimulatory motifs in the genome of a gammaherpesvirus. J Immunol. 2011;187(2):887–896. doi: 10.4049/jimmunol.1003737. [DOI] [PMC free article] [PubMed] [Google Scholar]
- 10.Elde NC, Malik HS. The evolutionary conundrum of pathogen mimicry. Nat Rev Microbiol. 2009;7(11):787–797. doi: 10.1038/nrmicro2222. [DOI] [PubMed] [Google Scholar]
- 11.Liddament MT, Brown WL, Schumacher AJ, Harris RS. APOBEC3F properties and hypermutation preferences indicate activity against HIV-1 in vivo. Curr Biol. 2004;14(15):1385–1391. doi: 10.1016/j.cub.2004.06.050. [DOI] [PubMed] [Google Scholar]
- 12.Wood N, et al. HIV evolution in early infection: Selection pressures, patterns of insertion and deletion, and the impact of APOBEC. PLoS Pathog. 2009;5(5):e1000414. doi: 10.1371/journal.ppat.1000414. [DOI] [PMC free article] [PubMed] [Google Scholar]
- 13.Qian L, Kussell E. Evolutionary dynamics of restriction site avoidance. Phys Rev Lett. 2012;108(15):158105. doi: 10.1103/PhysRevLett.108.158105. [DOI] [PubMed] [Google Scholar]
- 14.Lin WH, Kussell E. Evolutionary pressures on simple sequence repeats in prokaryotic coding regions. Nucleic Acids Res. 2012;40(6):2399–2413. doi: 10.1093/nar/gkr1078. [DOI] [PMC free article] [PubMed] [Google Scholar]
- 15.Brower-Sinning R, et al. The role of RNA folding free energy in the evolution of the polymerase genes of the influenza A virus. Genome Biol. 2009;10(2):R18. doi: 10.1186/gb-2009-10-2-r18. [DOI] [PMC free article] [PubMed] [Google Scholar]
- 16.Nelson P. Biological Physics: Energy, Information, and Life. 1st Ed. New York: WH Freeman; 2007. Chap 7. [Google Scholar]
- 17.Baxter RJ. Exactly Solved Models in Statistical Mechanics. Amsterdam: Academic; 1982. Chap 1-2. [Google Scholar]
- 18.Bao Y, et al. The influenza virus resource at the National Center for Biotechnology Information. J Virol. 2008;82(2):596–601. doi: 10.1128/JVI.02005-07. [DOI] [PMC free article] [PubMed] [Google Scholar]
- 19. HIV Sequence Compendium (2012) eds Kuiken C, et al. (Theoretical Biology and Biophysics Group, Los Alamos National Laboratory, NM), LA-UR 12-24653.
- 20.Kent WJ, et al. The human genome browser at UCSC. Genome Res. 2002;12(6):996–1006. doi: 10.1101/gr.229102. [DOI] [PMC free article] [PubMed] [Google Scholar]
- 21.Karolchik D, et al. The UCSC Table Browser data retrieval tool. Nucleic Acids Res. 2004;32(Database issue):D493–D496. doi: 10.1093/nar/gkh103. [DOI] [PMC free article] [PubMed] [Google Scholar]
- 22.Lander ES, et al. International Human Genome Sequencing Consortium Initial sequencing and analysis of the human genome. Nature. 2001;409(6822):860–921. doi: 10.1038/35057062. [DOI] [PubMed] [Google Scholar]
- 23.Zia RKP, Redish EF, McKay SR. Making sense of the Legendre transform. Am J Phys. 2009;77:614. [Google Scholar]
- 24.Vabret N, et al. The biased nucleotide composition of HIV-1 triggers type I interferon response and correlates with subtype D increased pathogenicity. PLoS ONE. 2012;7(4):e33502. doi: 10.1371/journal.pone.0033502. [DOI] [PMC free article] [PubMed] [Google Scholar]
- 25.Vabret N, et al. Large-scale nucleotide optimization of simian immunodeficiency virus (SIV) reduces its capacity to stimulate type-I IFN in vitro. J Virol. 2014 doi: 10.1128/JVI.03223-13. [DOI] [PMC free article] [PubMed] [Google Scholar]
- 26.Gumbel EJ. Statistics of Extremes. 1st Ed. New York: Columbia Univ Press; 1958. [Google Scholar]
- 27.Hemmi H, et al. A Toll-like receptor recognizes bacterial DNA. Nature. 2000;408(6813):740–745. doi: 10.1038/35047123. [DOI] [PubMed] [Google Scholar]
- 28.Nakajima K, Desselberger U, Palese P. Recent human influenza A (H1N1) viruses are closely related genetically to strains isolated in 1950. Nature. 1978;274(5669):334–339. doi: 10.1038/274334a0. [DOI] [PubMed] [Google Scholar]
- 29.Hanada K, Suzuki Y, Gojobori T. A large variation in the rates of synonymous substitution for RNA viruses and its relationship to a diversity of viral infection and transmission modes. Mol Biol Evol. 2004;21(6):1074–1080. doi: 10.1093/molbev/msh109. [DOI] [PMC free article] [PubMed] [Google Scholar]
- 30.Schwartz S, Felber BK, Pavlakis GN. Distinct RNA sequences in the gag region of human immunodeficiency virus type 1 decrease RNA stability and inhibit expression in the absence of Rev protein. J Virol. 1992;66(1):150–159. doi: 10.1128/jvi.66.1.150-159.1992. [DOI] [PMC free article] [PubMed] [Google Scholar]
- 31.Schwartz S, et al. Mutational inactivation of an inhibitory sequence in human immunodeficiency virus type 1 results in Rev-independent gag expression. J Virol. 1992;66(12):7176–7182. doi: 10.1128/jvi.66.12.7176-7182.1992. [DOI] [PMC free article] [PubMed] [Google Scholar]
- 32.Chang JJ, Altfeld M. TLR-mediated immune activation in HIV. Blood. 2009;113(2):269–270. doi: 10.1182/blood-2008-10-184598. [DOI] [PubMed] [Google Scholar]
- 33.van Weringh A, et al. HIV-1 modulates the tRNA pool to improve translation efficiency. Mol Biol Evol. 2011;28(6):1827–1834. doi: 10.1093/molbev/msr005. [DOI] [PMC free article] [PubMed] [Google Scholar]
- 34.Mueller S, Papamichail D, Coleman JR, Skiena S, Wimmer E. Reduction of the rate of poliovirus protein synthesis through large-scale codon deoptimization causes attenuation of viral virulence by lowering specific infectivity. J Virol. 2006;80(19):9687–9696. doi: 10.1128/JVI.00738-06. [DOI] [PMC free article] [PubMed] [Google Scholar]
- 35.Coleman JR, et al. Virus attenuation by genome-scale changes in codon pair bias. Science. 2008;320(5884):1784–1787. doi: 10.1126/science.1155761. [DOI] [PMC free article] [PubMed] [Google Scholar]
- 36.Mueller S, et al. Live attenuated influenza virus vaccines by computer-aided rational design. Nat Biotechnol. 2010;28(7):723–726. doi: 10.1038/nbt.1636. [DOI] [PMC free article] [PubMed] [Google Scholar]
Associated Data
This section collects any data citations, data availability statements, or supplementary materials included in this article.