

Abstract
Studies in adolescents and adults have demonstrated that polymorphisms in putative psychiatric risk genes are associated with differences in brain structure, but cannot address when in development these relationships arise. To determine if common genetic variants in disrupted-in-schizophrenia-1 (DISC1; rs821616 and rs6675281), catechol-O-methyltransferase (COMT; rs4680), neuregulin 1 (NRG1; rs35753505 and rs6994992), apolipoprotein E (APOE; ɛ3ɛ4 vs. ɛ3ɛ3), estrogen receptor alpha (ESR1; rs9340799 and rs2234693), brain-derived neurotrophic factor (BDNF; rs6265), and glutamate decarboxylase 1 (GAD1; rs2270335) are associated with individual differences in brain tissue volumes in neonates, we applied both automated region-of-interest volumetry and tensor-based morphometry to a sample of 272 neonates who had received high-resolution magnetic resonance imaging scans. ESR1 (rs9340799) predicted intracranial volume. Local variation in gray matter (GM) volume was significantly associated with polymorphisms in DISC1 (rs821616), COMT, NRG1, APOE, ESR1 (rs9340799), and BDNF. No associations were identified for DISC1 (rs6675281), ESR1 (rs2234693), or GAD1. Of note, neonates homozygous for the DISC1 (rs821616) serine allele exhibited numerous large clusters of reduced GM in the frontal lobes, and neonates homozygous for the COMT valine allele exhibited reduced GM in the temporal cortex and hippocampus, mirroring findings in adults. The results highlight the importance of prenatal brain development in mediating psychiatric risk.
Keywords: catechol-O-methyltransferase, cortex, disrupted-in-schizophrenia-1, neonate, neuroimaging
Introduction
Decades of research have generated many putative psychiatric risk genes. Intriguingly, many of these genes are not specific to a particular diagnosis. For example, polymorphisms in DISC1 are associated with schizophrenia (Hennah et al. 2003; Ekelund et al. 2004; Qu et al. 2007), bipolar disorder (Hodgkinson et al. 2004; Hennah et al. 2009), major depression (Hashimoto et al. 2006), and autism spectrum conditions (Kilpinen et al. 2008). In addition, meta-analyses reveal extensive overlap in neuroanatomical changes associated with schizophrenia, bipolar disorder, and autism (Cheung et al. 2010; Yu et al. 2010). This strongly suggests that there are common, genetically determined neurodevelopmental pathways to risk for psychiatric illness in general, but the mechanisms by which genetic variants alter neurodevelopmental trajectories resulting in the eventual emergence of illness remain unclear.
Imaging genetics represents a powerful strategy for characterizing neural systems affected by risk variants (Meyer-Lindenberg et al. 2006; Tan et al. 2008; Bigos and Weinberger 2010). Studies in adolescents and adults demonstrate that polymorphisms in putative psychiatric risk genes predict individual differences in brain structure in healthy controls and in individuals with mental illness (Scharinger et al. 2010; Johnstone et al. 2011). However, studies, to date, are limited to adults and older children in whom gene–brain relationships may be confounded by medication, years of environmental and gene–environment interaction effects, and progression of disease. Such studies are also unable to address the reality that mental illnesses are unfolding developmental processes, which can have different consequences at different stages. Studies in infants would minimize these issues and allow a better understanding of age-specific effects, including prenatal effects. The perinatal period is an extremely dynamic stage of brain development, characterized by rapid synaptogenesis (Huttenlocher and Dabholkar 1997), exuberant dendritic (Petanjek et al. 2008) and axonal growth (Kasprian et al. 2008), and extensive myelination (Brody et al. 1987). These changes are reflected in dramatic increases in gray and white matter (WM) volumes as indexed by magnetic resonance imaging (MRI; Gilmore et al. 2007; Knickmeyer et al. 2008). This is a critical period for childhood-onset illnesses such as autism (Hazlett et al. 2005, 2011; Wolff et al. 2012). There is also extensive evidence that adult-onset diseases, such as schizophrenia, originate in early brain development (Rapoport et al. 2005; Fatemi and Folsom 2009). Early aberrations in neurodevelopment relevant to adult-onset disorders can be captured via MRI as evidenced by a recent study, showing that male neonates at high genetic risk for schizophrenia have larger intracranial, cerebrospinal fluid (CSF), total gray matter (GM), and lateral ventricle volumes than controls (Gilmore et al. 2010).
We tested whether variants in disrupted-in-schizophrenia-1 (DISC1), catechol-O-methyltransferase (COMT), neuregulin 1 (NRG1), apolipoprotein E (APOE), estrogen receptor alpha (ESR1), brain-derived neurotrophic factor (BDNF), and glutamate decarboxylase 1 (GAD1) are associated with neonatal brain structure using both automated region-of-interest (ROI) volumetry and tensor-based morphometry (TBM). In TBM, brain images are warped to a canonical template. The applied deformation is used as an index of volume differences between each subject and the template and, subsequently, between groups. The advantage of TBM over traditional voxel-based morphometry (VBM) is that false-positive findings due to systematic group differences in registration errors are less likely (Hua et al. 2008; Lepore et al. 2008). ROI volumetry and TBM approaches are complementary. Due to its summarizing nature, ROI volumetry captures overall size differences reliably, but cannot localize differences. TBM has the advantage of being able to identify group differences that are confined to small areas or that do not follow the anatomical boundaries segmented by the atlas. TBM analyses focused on localized GM changes. Localized WM changes are also of interest, but we felt that these would be best addressed through diffusion tensor imaging (DTI).
Selected genes have received significant research attention as putative psychiatric risk genes (Table 1) and have well-documented roles in brain development. DISC1 participates in neural migration, neurite outgrowth, and dendritic arborization (Porteous et al. 2011). COMT is a critical enzyme in the degradation of catecholamines, including dopamine (Yavich et al. 2007). NRG1 encodes protein isoforms that participate in neuronal migration and specification, oligodendrocyte differentiation and myelination, regulation of acetylcholine, and expression of glutamate and γ-aminobutyric acid (GABA) receptors (Mei and Xiong 2008). APOE is a very-low-density lipoprotein thought to have a key role in neuronal development, brain plasticity, and repair (Vance and Hayashi 2010). ESR1 mediates estrogen effects on synaptogenesis, growth factor production, and responses to oxidative stress (Sundermann et al. 2010). BDNF regulates cell survival, axonal outgrowth, dendritic growth, and synaptic plasticity (Reichardt 2006). GAD1 is one of the 2 major isoforms of the enzyme that converts glutamate to GABA, which plays diverse roles in corticogenesis (Wang and Kriegstein 2009). Selected variants are related to neuroimaging phenotypes in older samples and have minor allele frequencies (MAF) high enough to allow study. In light of the genotyping method employed, only single-nucleotide polymorphisms (SNPs) were included.
Table 1.
Selection criteria for genes and variants
ADHD, attention deficit hyperactivity disorder.
aMAF from the NIH single nucleotide polymorphism database (dbSNP) (European CEU samples).
bɛ4 frequency ranges from 0.052 to 0.310 in European populations, ɛ3 ranges from 0.640 to 0.898, and ɛ2 (excluded from this analysis) ranges from 0.050 to 0.119 (Corbo and Scacchi 1999).
Materials and Methods
Subjects
This study included two hundred and seventy-two neonates (152 males and 120 females, 144 singletons, 128 twins). Mothers were recruited during the second trimester of pregnancy from outpatient obstetrics and gynecology clinics at University of North Carolina (UNC) hospitals. Exclusion criteria at enrollment were the presence of abnormalities on ultrasound or major medical illness in the mother. Demographic data are found in Table 2. The sample is enriched for individuals with parental psychiatric history (Table 3). Imaging genetics studies often focus on healthy individuals to minimize potential contamination of signal from nongenetic illness-related factors. However, studying “healthy volunteers” exclusively runs the risk of identifying genetic effects with little or no relationship to illness (Rasetti and Weinberger 2011). This dilemma is more complex in the neonate as many “high-risk” neonates will never develop a psychiatric illness, and some proportion of “low-risk” neonates will. As the distribution of genotypes did not significantly differ between groups (Supplementary Table S1), we ran our main analyses without “risk” as a covariate. We also ran sensitivity analyses with risk as a covariate. Results were highly similar.
Table 2.
Demographic data for participants
| Variable | |
|---|---|
| Maternal age at start of study (years) | 30.19 (5.68) 17–47 |
| Mean (SD) range, n= 272 | |
| Maternal education level (years) | 15.55 (3.12) 8–25 |
| Mean (SD) range, n= 272 | |
| Total household income | $77 943 ($50 103) 0–288 000 |
| Mean (SD) range, n= 261 | |
| Gestational age at birth (days) | 261.4 (19.85) 205–295 |
| Mean (SD) range, n= 272 | |
| Birth weight (g) | 2916 (706.2) 1289–4701 |
| Mean (SD) range, n= 272 | |
| Gestational age at MRI (days) | 294.2 (17.93) 261–433 |
| Mean (SD) range, n= 272 | |
| Gender | |
| Female, n (%) | 120 (44%) |
| Male, n (%) | 152 (56%) |
| Singleton versus twins | |
| Singleton, n (%) | 144 (53%) |
| Twins, n (%) | 128 (47%) |
| Within twins | |
| Dizygotic, n (%) | 70 (58%) |
| Monozygotic, n (%) | 50 (42%) |
Table 3.
Parental psychiatric history for participants
| Diagnosis | Singletons | Twins |
|---|---|---|
| Bipolar disorder, n (%) | 30 (21%) | 4 (3%) |
| Schizophrenia, n (%) | 2 (1%) | 4 (3%) |
| Schizoaffective disorder, n (%) | 3 (2%) | 0 (0%) |
| Depression, n (%) | 30 (21%) | 24 (19%) |
| Alcohol dependence/abuse, n (%) | 21 (14%) | 4 (3%) |
| Drug dependence/abuse, n (%) | 21 (14%) | 6 (5%) |
| Anxiety/OCD, n (%) | 13 (9%) | 26 (20%) |
| ADD/ADHD, n (%) | 3 (2%) | 8 (6%) |
| Other, n (%) | 13 (9%) | 1 (1%) |
| Total in sample with parental psychiatric history, n (%) | 65 (45%) | 45 (35%) |
| Total in sample with no parental psychiatric history, n (%) | 79 (54%) | 83 (65%) |
| Psychotropic medications | ||
| Antidepressants, n (%) | 25 (17%) | 16 (13%) |
| Antipsychotics, n (%) | 14 (10%) | 4 (3%) |
| Mood stabilizers, n (%) | 12 (8%) | 0 (0%) |
| Antianxiety, n (%) | 3 (2%) | 2 (2%) |
| ADHD, n (%) | 1 (1%) | 0 (0%) |
| Total in sample with psychotropic medication use, n (%) | 38 (26%) | 16 (13%) |
ADD, attention deficit disorder; ADHD, attention deficit hyperactivity disorder; OCD, obsessive compulsive disorder.
Note: parental history was based on maternal report. Active drug or alcohol abuse/dependence was an exclusion criteria at the time of enrollment. However, 4 women did report drug use later in the pregnancy.
To minimize false positives due to population stratification, only individuals whose reported maternal ethnicity was white are included in this analysis. Ethnicity classification was by maternal report. We used maternal ethnicity as we expected it to be more reliable than paternal ethnicity (see Supplementary Table S2 for paternal ethnicity). Approximately 70% of mothers enrolled in the parent study report their ethnicity as white. This study was approved by the Institutional Review Board of the UNC School of Medicine. Written informed consent was obtained from the participants' mothers prior to the study.
Genotyping
DNA was extracted from buccal samples using standard methods described in the Puregene® DNA Purification Kit (Gentra Systems) using supplies from Qiagen. Genotyping was performed by Genome Quebec using Sequenom® iPLEX® Gold Genotyping Technology, which is based on a multiplex polymerase chain reaction followed by a template-directed single base extension using the probes of various sizes. The products are separated and detected by Matrix-assisted laser desorption-ionization time-of-flight mass spectrometry. Positive and negative controls are included on each 96-well plate. The genotyping call rate was >98%. The visual examination of intensity cluster plots supported high genotyping accuracy. The rate of concordant results between duplicate control samples was 100%. Genotype frequencies did not deviate from Hardy–Weinberg equilibrium (Table 4). The 2 SNPs in APOE were treated as a haplotype to permit direct comparisons to the existing literature. In the 3 other cases, where we examined 2 SNPs within the same gene (DISC1, NRG1, and ESR1), we treated the variants separately. Again this permitted a direct comparison with the existing literature. Linkage disequilibrium between the 2 variants as measured by r2 was <0.80 in all 3 cases (Gaunt et al. 2007).
Table 4.
| Variant | Homozygotes major allele | Heterozygotes | Homozygotes minor allele | Missing | Model |
|---|---|---|---|---|---|
| Genotype frequencies for participants, n (%) | |||||
| DISC1 rs821616 | TT 141 (52%) | AT 102 (38%) | AA 28 (10%) | 1 (>1%) | AA versus Other |
| DISC1 rs6675281 | CC 191 (70%) | TC 75 (28%) | TT 5 (2%) | 1 (>1%) | CC versus Other |
| COMT rs4680 | GG 69 (26%) | GA 137 (50%) | AA 61 (22%) | 5 (2%) | GG versus Other |
| NRG1 rs6994992 | CC 93 (34%) | CT 126 (46%) | TT 52 (19%) | 1 (>1%) | TT versus Other |
| NRG1rs35753505 | TT 112 (41%) | TC 115 (42%) | CC 44 (16%) | 1 (>1%) | TT versus Other |
| ESR1 rs9340799 | AA 110 (40%) | GA 129 (47%) | GG 32 (12%) | 1 (>1%) | AA versus Other |
| ESR1 rs2234693 | TT 76 (28%) | TC 143 (53%) | CC 52 (19%) | 1 (>1%) | Additiveb |
| BDNF rs6265 | GG 182 (67%) | GA 77 (28%) | AA 12 (4%) | 1 (>1%) | GG versus Other |
| GAD1 rs2270335 | GG 133 (49%) | GA 116 (43%) | AA 22 (8%) | 1 (>1%) | Additive |
| Haplotype Frequencies for participants, n (%) | |||||
| APOE | ɛ3ɛ3 | ɛ3ɛ4 | Othera | ||
| 156 (57%) | 66 (24%) | 47 (17%) | 3 (1%) | ɛ3ɛ3 versus ɛ3ɛ4 | |
aIncludes ɛ2ɛ2, ɛ2ɛ3, ɛ2ɛ4, and ɛ4ɛ4.
bFor genotypes with 3 levels an ordinal model was imposed.
Image Acquisition
MRI was performed at the UNC MRI Research Center on a Siemens head-only 3-T scanner (Allegra, Siemens Medical System, Inc., Erlangen, Germany), as previously described (Gilmore et al. 2007). All subjects were studied without sedation. Once a child was asleep, he/she was fitted with earplugs and placed in the MRI scanner with head in a vac-fix immobilization device, and additional foam padding to diminish the sounds of the scanner. Scans were performed with a neonatal nurse present, and a pulse oximeter was used to monitor the heart rate and oxygen saturation. T1-weighted images were obtained using a 3-dimensional (3-D) spoiled gradient [fast low angle shot (FLASH) repetition time (TR)/echo time (TE)/flip angle 15/7 ms/25°]. Proton density and T2-weighted images were obtained with a turbo spin-echo sequence [fast low angle shot (FLASH) repetition time (TR)/echo time (TE)/flip angle 6200/20/119 ms/150°). Spatial resolution was 1 × 1 × 1 mm3 voxel size for T1-weighted images and 1.25 × 1.25 × 1.5 mm3 voxel size with a 0.5-mm interslice gap for proton density/T2-weighted images.
Automated ROI Volumetry
Brain tissue was classified as GM, unmyelinated WM, myelinated WM (mWM), and CSF using an automatic, atlas-moderated expectation maximization segmentation tool as previously described (Prastawa et al. 2005; Gilmore et al. 2007). Parcellation of each subject's brain into regions was achieved by nonlinear warping of a parcellation atlas template as previously described (Hazlett et al. 2005; Gilmore et al. 2007; Knickmeyer et al. 2008). For the neonatal brain parcellation, left and right hemispheres were subdivided into 4 regions along the anterior–posterior axis (roughly corresponding to prefrontal, frontal, parietal, and occipital regions). The cerebellum, brainstem, and subcortical structures are represented separately (Supplementary Figure S1). Note that subcortical structures are combined into a single “exclusion” area as individual subcortical structures cannot be reliably defined at this age. After deformation, the parcellation template is combined with the tissue classification maps and results in estimates of GM, WM, mWM, and CSF for each region. The volume of mWM in the cortex was very small and likely represented partial-volume effects; therefore, we did not perform statistical tests on cortical mWM. The neonatal lateral ventricles are segmented using InsightSnap (SNAP), a semiautomated 3-D segmentation tool, which uses a level-set evolution method (Yushkevich et al. 2006). SNAP is controlled by a user-defined initialization and data-specific segmentation protocols with region-growing parameters that operate in conjunction with the probabilistic CSF map generated during tissue segmentation. Segmentation results were reviewed by an expert rater, and poor quality segmentations were excluded from the analysis (final n = 236).
TBM: Image Preprocessing
Brain tissue was extracted from the original T2-weighted images and corrected for intensity inhomogeneity using an expectation maximization segmentation algorithm (Prastawa et al. 2005). T2-weighted images were used as these had better signal-to-noise ratio in our neonatal sample. The skull stripped images were then rigidly aligned to match the center and orientation, and the average image was calculated afterwards, serving as the template of the following affine alignment. The rigid and affine registrations were employed with AFNI software (Cox 1996). Intensity histogram matching was then applied on the affine aligned images to prepare for nonrigid registration. The unbiased large deformation nonrigid group-wise registration method (Joshi et al. 2004) was used to construct the atlas and to estimate deformation fields mapping each input images to the atlas. To get the final transformation from the original image space to the atlas space, we composed both the affine transformation matrix and the nonrigid deformation field. The deformation fields were examined by an image processing expert and ones with unusually large distortions were excluded (final n = 248).
Data Analysis
For demographic and descriptive data, as well as the results of automated ROI volumetry, statistical analyses were performed using the SAS statistical software, version 9.2. Mixed models were used to study the relationship between brain volumes and genetic markers. Rather than exhaustively testing all possible genetic models, comparisons were selected based on published literature (Table 4). Because many of these variants are somewhat rare, in most cases, a presence/absence approach was used rather than a genotypic approach; this increases statistical power. Mixed models methodology was used to treat twins as repeated measures, whereas singletons had no repeated measures. In other words, twin pairs were treated as a single subject. This means that the effective sample size for ROI volumetry was 186 (119 singletons and 67 unique twin mothers). The compound symmetry covariance structure was used to capture the correlation between twins in a pair (with only 2 twins in a pair there is only 1 off-diagonal correlation) (Munoz et al. 1986). Models were adjusted for gender, intracranial volume (ICV), and gestational age at MRI. All statistical hypothesis tests were 2-tailed. Tests were conducted at a significance level of 0.005 (0.05/10; Bonferroni corrected for the number of genetic tests conducted). We did not perform additional corrections for the number of phenotypes examined. However, analysis was restricted to the following variables: ICV, total GM, total WM, total CSF, lateral ventricle volume, cerebellar volume, and lobar GM and WM (14 volumes total). For significant results, we also ran 3 sensitivity analyses; one with “psychiatric risk” as a covariate, one including only 1 individual from each monozygotic (MZ) pair, and one with birthweight as a covariate.
For TBM, associations between brain structure and genetic markers were examined by fitting a multiscale adaptive generalized estimation equation (MAGEE) model to the Jacobian determinant of the deformation matrix at each voxel of the template. The MAGEE method extends the multiscale adaptive regression model (MARM; Zhu et al. 2009; Li et al. 2011) method to the correlated sample setting. The MAGEE methodology treated the twins as repeated measures. The effective sample size for TBM analyses was 154 (94 singletons and 60 unique twin mothers). The MAGEE integrates a commonly used approach for analyzing the correlated data called generalized estimation equation (GEE; Liang and Zeger 1986) with adaptive smoothing methods. GEE models account for within-twin correlation among repeated measures via the specification of a “working” correlation structure in parameter estimation. Specifically, the compound symmetry covariance structure was used to capture the correlation between twins in a pair. An attractive feature of GEE models is that the estimated regression coefficients and their associated standard deviations are valid even if the correlation structure assumed for modeling the within-twin correlation is not precisely correct (e.g., correlations may differ between MZ and dizygotic twins). As a sensitivity analysis, we also ran these tests including only 1 individual from each MZ pair.
Our primary scientific interest was to localize GM regions that differ significantly between 2 groups (for the presence/absence models) and 3 groups (for additive models) for each variant, thus when testing for significant regions, WM was masked and only GM was examined. The final form of the estimating equations in MAGEE included genotype, while adjusting for gender, ICV, and gestational age at MRI. Sensitivity analyses controlling for birthweight were also run. To clarify the details, we interpret comparisons in statistical context. For example, for rs4680 and the comparison GG versus Other, we set up a linear model:
 |
where  and
and  . y(d) is the imaging measure at the dth voxel, 1(·) is an indication function, and ei(d) is the shared correlation between subjects within the ith twin pair. We are interested in the estimation of the coefficient β3 and testing whether β3 = 0 is statistically significant. The value of β3 can be negative or positive at a specific voxel, if it is positive, it indicates that the imaging measure in the GG group is statistically higher than that in other genotype groups, denoted as GG > Other; otherwise, GG is statistically lower than Other, denoted as GG < Other.
For all hypothesis tests, cluster-based inference was used to identify significant genetic effects on localized GM volumes (Cao 1999; Worsley et al. 1999; Hayasaka et al. 2004). Cluster-based inference is based on random field theory, a widely used multiple testing method for determining corrected significances while accounting for the high level of spatial dependencies between adjacent voxels (Worsley et al. 1996). First, we detected clusters of contiguous suprathreshold voxels using a cluster-forming threshold of P < 0.005. We used a threshold of 0.005 to adjust for the number of genetic tests conducted (0.005 = 0.05/10; Bonferroni corrected for the number of genetic tests conducted). Secondly, we calculated a P-value for each contiguous cluster on the basis of its size/mass to test whether a ROI size was significant or not using a conservative level of P < 0.001. To further minimize false positives, a conservative cluster size threshold of 100 was applied both before and after the clustering test. The manual and code of the nonstationarity correction toolbox for cluster size P-values are available at http://www.fmri.wfubmc.edu/. Anatomical locations of clusters were established using a 90 region parcellation template for the infant brain (Gilmore et al. 2011), and regions correspond to those in the Anatomical Automatic Labeling template (Tzourio-Mazoyer et al. 2002).
Results
In the automated lobar volumetry analyses, ESR1 (rs9340799) predicted ICV. AA homozygotes had 3.7% larger ICV than G allele carriers (P = 0.0028). This comparison remained significant when including only 1 individual from each MZ twin pair (P = 0.0011), and when including birthweight as a covariate (P = 0.0037). It approached significance when controlling for parental psychiatric history (P = 0.0057). No other variants were associated with global or regional brain tissue volumes (Supplementary Tables S3 and S4). However, TBM revealed significant local GM variation associations with DISC1 (rs821616), COMT, NRG1, APOE, ESR1 (rs9340799), and BDNF (Table 5).
Table 5.
Results of TBM analyses
| Variant and model | Cluster no. | Cluster size | Maximum t-value | Maximum P-value | Cluster P-value | Anatomical regions |
|---|---|---|---|---|---|---|
| DISC1 (rs821616) | ||||||
| AA(Ser/Ser) < Other | 1 | 1699 | 6.52 | <0.0001 | <0.0001 | Supp_motor_area_R (627) Supp_motor_area_L (543) Paracentral_lobule_L (238) Paracentral_lobule_R (198) Cingulum_mid_L (36) Cingulum_mid_R (35) Postcentral_L (22) |
| 2 | 881 | 5.27 | <0.0001 | <0.0001 | Occipital_mid_L (432) Temporal_mid_L (376) Occipital_inf_L (47) Temporal_inf_L (13) Angular_L (9) Temporal_sup_L (3) Supramarginal_L (1) |
|
| 3 | 244 | 5.69 | <0.0001 | <0.0001 | Temporal_inf_L (163) Temporal_pole_mid_L (49) Fusiform_L (32) |
|
| 4 | 202 | 4.41 | <0.0001 | <0.0001 | Frontal_sup_medial_R (119) Frontal_sup_R (80) Frontal_mid_R (3) |
|
| 5 | 150 | 6.13 | <0.0001 | <0.0001 | Precentral_R (141) Frontal_sup_R (9) |
|
| 6 | 115 | 4.22 | <0.0001 | 0.0001 | Frontal_inf_orb_R (114) Temporal_pole_sup_R (1) |
|
| 7 | 115 | 4.24 | <0.0001 | 0.0001 | Occipital_mid_R (87) Angular_R (28) |
|
| 8 | 112 | 4.89 | <0.0001 | <0.0001 | Temporal_Pole_Sup_L (112) | |
| 9 | 112 | 3.78 | 0.0001 | 0.0004 | Precentral_R (94) Frontal_sup_R (18) |
|
| 10 | 111 | 4.69 | <0.0001 | <0.0001 | Temporal_mid_R (57) Temporal_sup_R (54) |
|
| 11 | 102 | 4.77 | <0.0001 | <0.0001 | Temporal_sup_R (71) Supramarginal_R (31) |
|
| DISC1 (rs6675281) | None | |||||
| COMT (rs4680) | ||||||
| GG(Val/Val) > Other | 1 | 1611 | 4.12 | <0.0001 | 0.0001 | Supp_motor_area_L (63) Supp_motor_area_R (59) Frontal_sup_medial_L (18) Frontal_sup_medial_R (14) Cingulum_mid_R (7) |
| 2 | 462 | 4.10 | <0.0001 | 0.0001 | Cuneus_R (42) Occipital_sup_R (263) Occipital_mid_R (65) Parietal_sup_R (91) Angular_R (1) |
|
| 3 | 165 | 3.84 | 0.0001 | 0.0002 | Cuneus_L (21) Occipital_sup_L (120) Occipital_mid_L (19) Parietal_sup_L (1) Parietal_inf_L (4) |
|
| 4 | 159 | 3.63 | 0.0002 | 0.0004 | Angular_R (65) Parietal_inf_R (48) Parietal_sup_R (46) |
|
| GG(Val/Val) < Other | 5 | 536 | 4.60 | <0.0001 | <0.0001 | Temporal_sup_R (463) Temporal_mid_R (36) Insula_R (33) Heschl_R (4) |
| 6 | 220 | 3.89 | 0.0001 | 0.0001 | Calcarine_R (130) Lingual_R (83) Fusiform_R (6) Cuneus_R (1) |
|
| 7 | 206 | 4.29 | <0.0001 | <0.0001 | Precuneus_R (158) Cingulum_post_R (48) |
|
| 8 | 204 | 4.30 | <0.0001 | <0.0001 | Hippocampus_R (144) Parahippocampal_R (38) Fusiform_R (22) |
|
| 9 | 101 | 3.38 | 0.0004 | 0.0008 | Temporal_sup_L (98) Temporal_mid_L (3) |
|
| NRG1 (rs35753505) | ||||||
| TT < Other | 1 | 232 | 3.75 | 0.0001 | 0.0003 | Temporal_mid_L (110) Temporal_sup_L (83) Supramarginal_L (39) |
| 2 | 203 | 4.11 | <0.0001 | 0.0001 | Supramarginal_L (166) Temporal_sup_L (37) |
|
| 3 | 141 | 4.12 | <0.0001 | 0.0001 | Precuneus_R (131) Cuneus_R (9) Occipital_sup_R (1) |
|
| 4 | 108 | 4.15 | <0.0001 | 0.0001 | Precuneus_R (97) Cuneus_R (6) Calcarine_R (5) |
|
| 5 | 100 | 3.71 | 0.0001 | 0.0004 | Precuneus_L (96) Cuneus_L (2) Calcarine_L (2) |
|
| NRG1 (rs6994992) | ||||||
| TT > Other | 1 | 746 | ∞ | <0.0001 | <0.0001 | Temporal_sup_R (430) Temporal_mid_R (301) Temporal_pole_sup_R (12) Heschl_R (2) Temporal_pole_mid_R (1) |
| 2 | 598 | 8.91 | <0.0001 | <0.0001 | Temporal_mid_L (367) Temporal_sup_L (184) Supramarginal_L (33) Temporal_inf_L (14) |
|
| 3 | 550 | ∞ | <0.0001 | <0.0001 | Frontal_mid_L (406) Frontal_sup_L (144) |
|
| 4 | 251 | 7.69 | <0.0001 | <0.0001 | Rolandic_oper_R (197) Heschl_R (51) Insula_R (3) |
|
| 5 | 131 | 6.22 | <0.0001 | <0.0001 | Paracentral_lobule_R (109) Supp_motor_area_R (17) Precuneus_R (5) |
|
| 6 | 126 | 5.72 | <0.0001 | <0.0001 | Temporal_sup_L (57) Temporal_mid_L (56) Insula_L (12) Temporal_pole_sup_L (1) |
|
| 7 | 124 | 5.13 | <0.0001 | <0.0001 | Temporal_mid_L (112) | |
| TT < Other | 8 | 4192 | ∞ | <0.0001 | <0.0001 | Temporal_inf_L (1577) Temporal_mid_L (1479) Temporal_pole_sup_L (312) Temporal_sup_L (294) Temporal_pole_mid_L (262) Frontal_inf_orb_L (192) Fusiform_L (74) Rolandic_oper_L (2) |
| 9 | 2564 | ∞ | <0.0001 | <0.0001 | Temporal_inf_R (1004) Temporal_mid_R (568) Temporal_sup_R (290) Rolandic_oper_R (149) Temporal_pole_mid_R (136) Precentral_R (99) Frontal_inf_oper_R (88) Fusiform_R (83) Temporal_pole_sup_R (69) Postcentral_R (64) Frontal_inf_tri_R (11) Heschl_R (3) |
|
| 10 | 2163 | ∞ | <0.0001 | <0.0001 | Parahippocampal_L (656) Hippocampus_L (394) Lingual_L (329) Caudate_L (215) Olfactory_L (118) Fusiform_L (77) Putamen_L (71) Precuneus_L (69) Insula_L (57) Amygdala_L (50) Pallidum_L (44) Cingulum_post_L (35) Frontal_inf_orb_L (30) Thalamus_L (6) Frontal_sup_orb_L (6) Rectus_L (6) |
|
| 11 | 576 | ∞ | <0.0001 | <0.0001 | Cuneus_R (180) Calcarine_L (166) Calcarine_R (103) Lingual_R (57) Cuneus_L (40) Occipital_sup_R (30) |
|
| 12 | 394 | 6.65 | <0.0001 | <0.0001 | Cuneus_L (140) Cuneus_R (129) Occipital_sup_R (51) Occipital_sup_L (46) Precuneus_L (28) |
|
| 13 | 385 | 7.59 | <0.0001 | <0.0001 | Insula_L (219) Frontal_inf_tri_L (126) Frontal_inf_oper_L (36) Frontal_inf_orb_L (4) |
|
| 14 | 346 | 5.84 | <0.0001 | <0.0001 | Supp_motor_area_R (127) Supp_motor_area_L (104) Frontal_sup_R (51) Frontal_sup_medial_L (31) Frontal_sup_medial_R (26) Cingulum_mid_R (7) |
|
| 15 | 310 | 6.84 | <0.0001 | <0.0001 | Frontal_inf_orb_R (99) Putamen_R (86) Insula_R (81) Temporal_pole_sup_R (23) Caudate_R (21) |
|
| 16 | 265 | ∞ | <0.0001 | <0.0001 | Insula_R (199) Frontal_inf_oper_R (65) Rolandic_oper_R (1) |
|
| 17 | 259 | 6.96 | <0.0001 | <0.0001 | Parietal_inf_L (105) Parietal_sup_L (104) Occipital_mid_L (29) Angular_L (21) |
|
| 18 | 183 | ∞ | <0.0001 | <0.0001 | Parahippocampal_R (133) Amygdala_R (30) Hippocampus_R (20) |
|
| 19 | 181 | ∞ | <0.0001 | <0.0001 | Precentral_R (158) Frontal_mid_R (20) Postcentral_R (3) |
|
| 20 | 179 | 7.33 | <0.0001 | <0.0001 | Occipital_mid_R (93) Occipital_sup_R (77) Angular_R (9) |
|
| 21 | 155 | 5.16 | <0.0001 | <0.0001 | Cingulum_ant_L (82) Cingulum_ant_R (52) Frontal_sup_medial_L (18) Cingulum_mid_R (3) |
|
| 22 | 148 | ∞ | <0.0001 | <0.0001 | Frontal_inf_orb_R (106) Temporal_pole_sup_R (33) Frontal_inf_tri_R (6) Frontal_inf_oper_R (3) |
|
| 23 | 148 | 7.25 | <0.0001 | <0.0001 | Occipital_mid_R (133) Occipital_inf_R (12) Temporal_mid_R (3) |
|
| 24 | 141 | 7.62 | <0.0001 | <0.0001 | Precentral_R (120) Postcentral_R (21) |
|
| 25 | 122 | 5.62 | <0.0001 | <0.0001 | Paracentral_lobule_L (65) Postcentral_L (49) Precuneus_L (8) |
|
| 26 | 115 | 7.09 | <0.0001 | <0.0001 | Parietal_inf_L (108) Angular_L (7) |
|
| 27 | 110 | 6.91 | <0.0001 | <0.0001 | Supramarginal_R (110) | |
| APOE | ||||||
| ɛ3ɛ3 < ɛ3ɛ4 | 1 | 2795 | ∞ | <0.0001 | <0.0001 | Parietal_sup_L (1088) Parietal_inf_L (646) Precuneus_L (347) Occipital_sup_L (205) Occipital_mid_L (191) Postcentral_L (182) Angular_L (80) Cingulum_post_L (47) Cuneus_L (9) |
| 2 | 960 | ∞ | <0.0001 | <0.0001 | Postcentral_R (731) Parietal_inf_R (143) Paracentral lobule_R (27) Parietal_sup_R (22) Supramarginal_R (20) Precentral_R (16) Precuneus_R (1) |
|
| 3 | 449 | 7.52 | <0.0001 | <0.0001 | Angular-R (199) Occipital_sup_R (106) Parietal_sup_R (120) Parietal_inf_R (9) Precuneus_R (3) Occipital_mid_R (9) Cuneus_R (3) |
|
| 4 | 376 | ∞ | <0.0001 | <0.0001 | Precentral_R (298) Frontal_mid_R (76) Postcentral_R (2) |
|
| 5 | 240 | ∞ | <0.0001 | <0.0001 | Postcentral_L (220) Precentral_L (20) |
|
| 6 | 237 | ∞ | <0.0001 | <0.0001 | Frontal_inf_oper_R (207) Frontal_mid_R (15) Frontal_inf_tri_R (12) Precentral_R (3) |
|
| 7 | 155 | 8.75 | <0.0001 | <0.0001 | Frontal_sup_orb_L (89) Rectus_L (57) Frontal_mid_orb_L (8) Frontal_med_orb_L (1) |
|
| 8 | 135 | 6.85 | <0.0001 | <0.0001 | Paracentral_lobule_R (34) Paracentral_lobule_L (28) Supp_motor_area_R (22) Precuneus_L (22) Precuneus_R (12) Cingulum_mid_R (12) Cingulum_mid_L (5) |
|
| 9 | 134 | 7.41 | <0.0001 | <0.0001 | Rolandic_oper_R (48) Supramarginal_R (42) Postcentral_R (37) Temporal_sup_R (6) Heschl_R (1) |
|
| 10 | 114 | 5.46 | <0.0001 | <0.0001 | Precuneus_R (63) Parietal_sup_R (48) Precuneus_L (3) |
|
| 11 | 102 | 8.13 | <0.0001 | <0.0001 | Frontal_sup_R (101) Frontal_mid_R (1) |
|
| 12 | 100 | 7.27 | <0.0001 | <0.0001 | Temporal_inf_R (55) Occipital_inf_R (45) |
|
| ɛ3ɛ3 > ɛ3ɛ4 | 13 | 514 | ∞ | <0.0001 | <0.0001 | Fusiform_L (125) Hippocampus_L (117) Temporal_inf_L (90) Temporal_mid_L (71) Temporal_sup_L (68) Parahippocampal_L (43) |
| 14 | 188 | ∞ | <0.0001 | <0.0001 | Frontal_mid_L (143) Frontal_sup_L (39) Precentral_L (6) |
|
| 15 | 133 | ∞ | <0.0001 | <0.0001 | Frontal_inf_oper_R (118) Frontal_inf_tri_R (10) Frontal_mid_R (5) |
|
| 16 | 123 | ∞ | <0.0001 | 0.0002 | Fusiform_R (67) Parahippocampal_R (48) Hippocampus_R (8) |
|
| 17 | 109 | ∞ | <0.0001 | <0.0001 | Parietal_sup_R (107) Precuneus_R (2) |
|
| ESR1 (rs9340799) | ||||||
| AA > Other | 1 | 195 | 6.52 | <0.0001 | <0.0001 | Parietal_sup_L (119) Parietal_inf_L (47) Occipital_mid_L (19) Angular_L (10) |
| 2 | 184 | 5.16 | <0.0001 | <0.0001 | Postcentral_R (178) Parietal_inf_R (6) |
|
| 3 | 162 | 6.48 | <0.0001 | <0.0001 | Frontal_mid_R (16) Frontal_inf_oper_R (138) Frontal_inf_tri_R (8) |
|
| 4 | 111 | 4.56 | <0.0001 | <0.0001 | Precentral_R (106) Frontal_Mid_R (5) |
|
| 5 | 102 | ∞ | <0.0001 | <0.0001 | Postcentral_R (35) Temporal_sup_R (30) Rolandic_oper_R (27) Precentral_R (8) Heschl_R (2) |
|
| AA < Other | 6 | 3549 | ∞ | <0.0001 | <0.0001 | Frontal_sup_R (1260) Frontal_mid_R (1154) Supp_motor_area_R (558) Precentral_R (294) Frontal_inf_oper_R (136) Frontal_sup_medial_R (128) Frontal_inf_tri_R (14) Postcentral_R (5) |
| 7 | 2400 | ∞ | <0.0001 | <0.0001 | Frontal_mid_L (876) Frontal_sup_L (738) Supp_motor_area_L (542) Frontal_sup_medial_L (194) Precentral_L (50) |
|
| 8 | 499 | 8.62 | <0.0001 | <0.0001 | Supramarginal_R (317) Parietal_inf_R (77) Postcentral_R (61) Angular_R (36) Rolandic_oper_R (8) |
|
| 9 | 385 | 8.03 | <0.0001 | <0.0001 | Paracentral_lobule_R (235) Precentral_R (83) Postcentral_R (60) Precuneus_R (7) |
|
| 10 | 287 | 6.34 | <0.0001 | <0.0001 | Postcentral_L (188) Supramarginal_L (51) Parietal_inf_L (46) Precentral_L (2) |
|
| 11 | 229 | 8.75 | <0.0001 | <0.0001 | Precentral_L (148) Postcentral_L (81) |
|
| 12 | 198 | ∞ | <0.0001 | <0.0001 | Postcentral_L (133) Precentral L (41) Paracentral_lobule_L (21) Precuneus_L (3) |
|
| 13 | 153 | 6.97 | <0.0001 | <0.0001 | Supramarginal_R (99) Postcentral_R (54) |
|
| 14 | 139 | ∞ | <0.0001 | <0.0001 | Postcentral_L (120) Parietal_inf_L (15) Precentral_L (4) |
|
| 15 | 120 | ∞ | <0.0001 | <0.0001 | Frontal_sup_L (74) Precentral_L (46) |
|
| 16 | 104 | 6.44 | <0.0001 | <0.0001 | Precentral_R (53) Postcentral_R (51) |
|
| ESR1 (rs2234693) | None | |||||
| BDNF (rs6265) | ||||||
| GG(Val/Val) > Other | 1 | 262 | 7.73 | <0.0001 | <0.0001 | Occipital_inf_R (156) Occipital_mid_R (102) Calcarine_R (4) |
| 2 | 172 | ∞ | <0.0001 | <0.0001 | Parahippocampal_L (66) Fusiform_L (62) Hippocampus_L (37) Temporal_inf_L (7) |
|
| GG(Val/Val) < Other | 3 | 682 | 8.91 | <0.0001 | <0.0001 | Postcentral_R (450) Parietal_inf_R (183) Supramarginal_R (26) Parietal_sup_R (21) Angular_R (2) |
| 4 | 298 | 7.60 | <0.0001 | <0.0001 | Precentral_R (243) Frontal_mid_R (46) Postcentral_R (9) |
|
| 5 | 200 | 6.91 | <0.0001 | <0.0001 | Parietal_sup_L (126) Parietal_inf_L (40) Angular_L (20) Occipital_mid_L (14) |
|
| 6 | 169 | 6.83 | <0.0001 | <0.0001 | Frontal_inf_oper_R (141) Frontal_inf_tri_R (14) Frontal_mid_R (14) |
|
| 7 | 147 | 5.61 | <0.0001 | <0.0001 | Postcentral_L (147) | |
| 8 | 146 | 6.45 | <0.0001 | <0.0001 | Parietal_inf_L (89) Parietal_sup_L (34) Postcentral_L (23) |
|
| 9 | 113 | 6.02 | <0.0001 | <0.0001 | Frontal_inf_tri_R (62) Frontal_inf_oper_R (49) Frontal_mid_R (2) |
|
| GAD1 (rs2270335) | None | |||||
Note: numbers in parentheses represent the number of voxels in that particular region.
For DISC1 (rs821616), TBM identified multiple areas of reduced volume in Ser/Ser homozygotes in the frontal lobes, particularly in supplementary motor areas, paracentral lobules, and the right medial superior frontal gyrus, and to a lesser extent, in the occipital lobes and lateral temporal cortex (Table 5 and Fig. 1).
Figure 1.
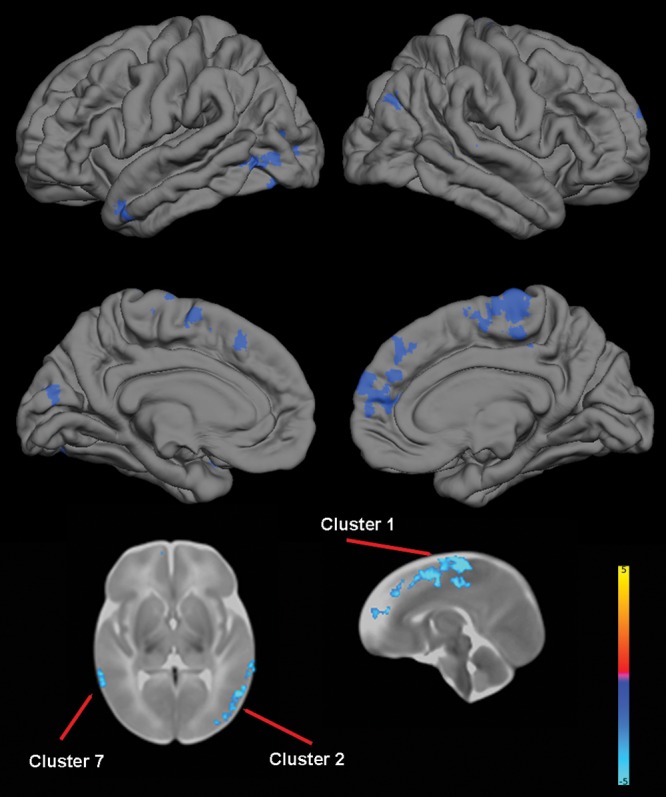
The effect of DISC1 (rs821616) genotype on brain structure. Upper images show the locations of significant GM decreases (blue) in Ser/Ser homozygotes when compared with Cys carriers projected onto surface-rendered views of the left and right hemispheres; lateral view (top) and medial view (middle). Bottom images are selected 2-dimensional (2-D) slices (axial and sagittal) with significant clusters displayed on the T2 atlas of the neonate brain. Color bar gives the t-value at each voxel. Blue/green indicates Ser/Ser <Cys carrier.
For COMT, TBM revealed multiple clusters of reduced volume in Val/Val homozygotes in the temporal cortex that included portions of the right hippocampus, right parahippocampus, right fusiform, and bilateral middle and superior temporal gyri. One cluster of reduced volume was identified in the right occipital lobe and consisted primarily of calcarine and lingual areas, and another cluster of reduced volume was identified in the right parietal lobe (precuneus) and overlapped with the posterior cingulate. TBM also revealed multiple clusters of increased volumes in Val/Val homozygotes, including the supplementary motor areas and parietal and occipital cortex (Table 5 and Fig. 2).
Figure 2.
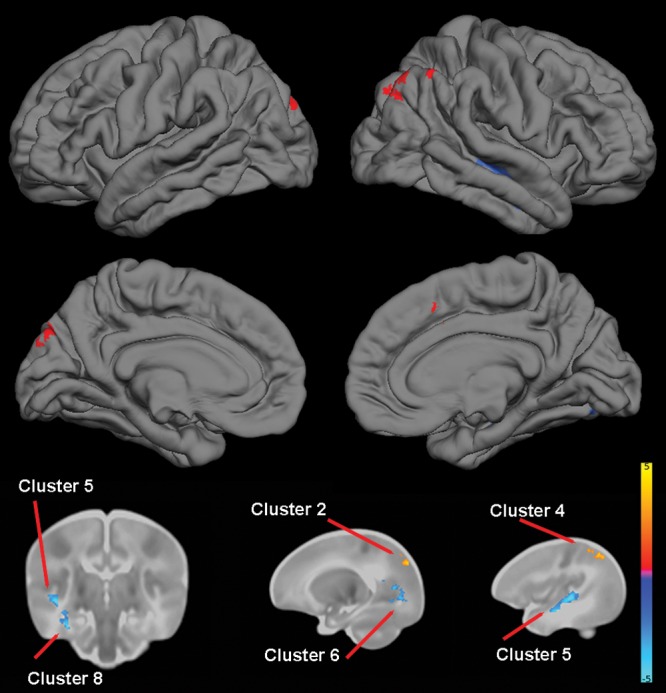
The effect of COMT (rs4680) genotype on brain structure. Upper images show the locations of GM increases (red) and decreases (blue) in Val/Val homozygotes when compared with Met carriers projected onto surface-rendered views of the left and right hemispheres; lateral view (top) and medial view (middle). Bottom images are selected 2D slices (1 coronal and 2 sagittal) with significant clusters displayed on the atlas of the neonate brain. Color bar gives the t-value at each voxel. Red/yellow indicates Val/Val > other. Blue/green indicates Val/Val < other.
For NRG1 (rs35753505), TBM identified 5 clusters where TT homozygotes had reduced volumes, which encompassed temporal, parietal, and occipital regions. For NRG1 (rs6994992), TBM identified 7 clusters where TT homozygotes had greater volume than other genotypes, primarily in the frontal and temporal lobes. TBM also identified 20 clusters of reduced volumes in TT homozygotes, which were widely distributed across the brain with 2 large clusters in the left temporal cortex (Table 5 and Fig. 3).
Figure 3.
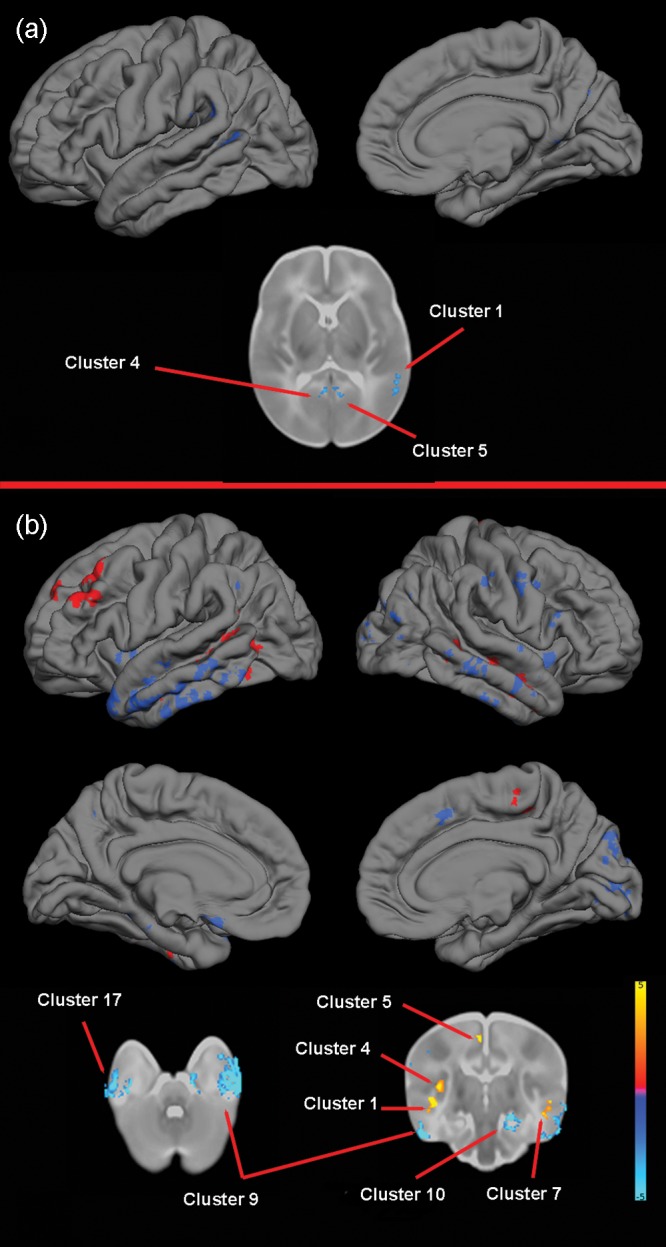
The effect of NRG1 (rs35753505 and rs6994992) genotype on brain structure. (a) rs35753505. Upper images show the locations of GM decreases (blue) in TT homozygotes when compared with C carriers projected onto surface-rendered views of the left lateral and right medial hemispheres, and a selected 2D axial slice with significant clusters displayed on the atlas of the neonate brain. Color bar gives the t-value at each voxel. Blue/green indicates TT < Other. (b) rs6994992. Upper images show the locations of GM increases (red) and decreases (blue) in TT homozygotes when compared with C carriers projected onto surface-rendered views of the left and right hemispheres; lateral view (top) and medial view (middle). Bottom images are selected 2D slices (axial and coronal) with significant clusters displayed on the atlas of the neonate brain. Color bar gives the t-value at each voxel. Red/yellow indicates TT > other. Blue/green indicates TT < Other.
For APOE, TBM revealed that ɛ3ɛ4 heterozygotes had significant reductions in volumes in temporal regions, including bilateral hippocampus, parahippocampus, and fusiform, and middle and inferior temporal gyri when compared with ɛ3 homozygotes and reductions in frontal and parietal lobes. ɛ3ɛ4 heterozygotes had significantly greater volumes in extensive areas of the parietal lobe and, to a lesser extent, in frontal and occipital cortex (Table 5 and Fig. 4).
Figure 4.
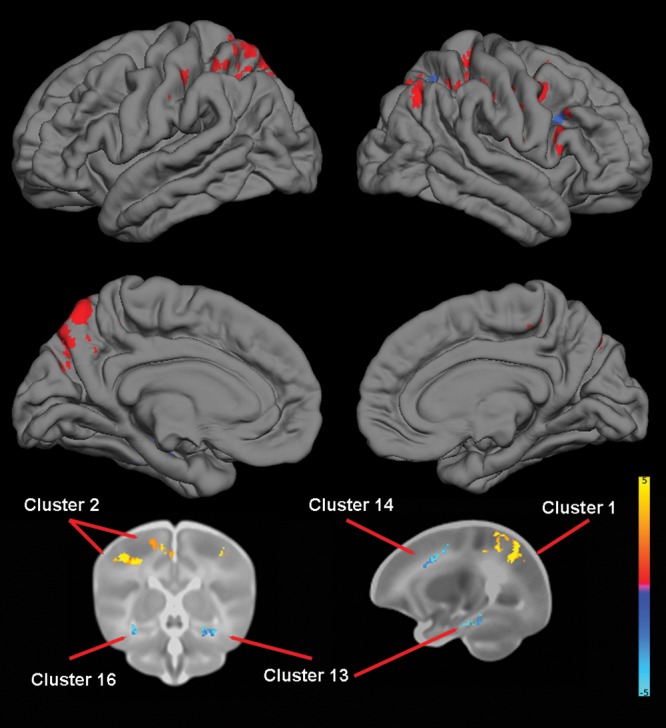
The effect of APOE genotype on brain structure. Upper images show the locations of GM increases (red) and decreases (blue) in ɛ3ɛ4 heterozygotes when compared with ɛ3ɛ3 homozygotes projected onto surface-rendered views of the left and right hemispheres; lateral view (top) and medial view (middle). Bottom images are selected 2D slices (coronal and sagittal) with significant clusters displayed on the atlas of the neonate brain. Color bar gives the t-value at each voxel. Red/yellow indicates ɛ3ɛ4 > ɛ3ɛ3. Blue/green indicates ɛ3ɛ4 < ɛ3ɛ3.
For ESR1 (rs9340799), TBM identified multiple regions of decreased volume in AA homozygotes in the frontal lobes (bilaterally), particularly in the frontal superior and middle gyri. Another large cluster was located in the right parietal cortex and consisted primarily of supramarginal gyrus. There were also a number of smaller clusters, broadly distributed across the brain, where AA homozygotes showed increased volumes (Table 5 and Fig. 5).
Figure 5.
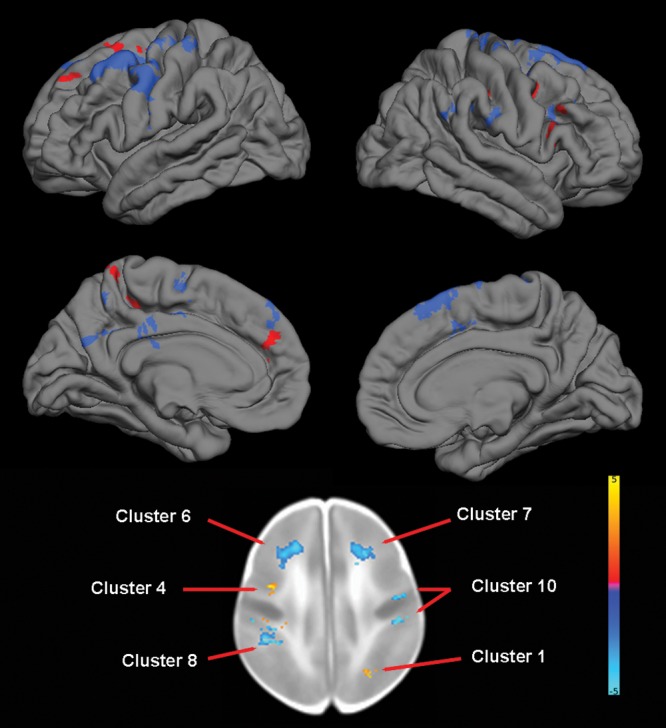
The effect of ESR1 (rs9340799) genotype on brain structure. Upper images show the locations of GM increases (red) and decreases (blue) in AA homozygotes when compared with G carriers projected onto surface-rendered views of the left and right hemispheres; lateral view (top) and medial view (middle). Bottom image is a selected 2D axial slice with significant clusters displayed on the atlas of the neonate brain. Color bar gives the t-value at each voxel. Red/yellow indicates AA homozygotes > G carriers. Blue/green indicates AA homozygotes < G carriers.
For BDNF, TBM identified 2 clusters of increased volume in Val/Val homozygotes, 1 primarily consisting of the right occipital cortex and 1 consisting of the portions of left hippocampus, parahippocampus, fusiform gyrus, and inferior temporal gyrus. TBM also revealed multiple clusters of decreased volume in Val/Val homozygotes, particularly in the primary motor and somatosensory cortex (Table 5 and Fig. 6).
Figure 6.
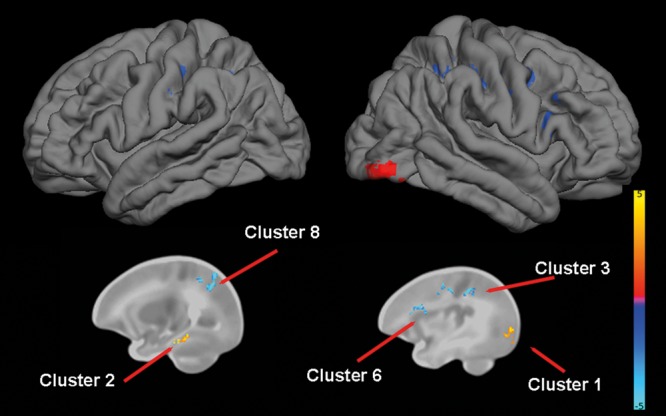
The effect of BDNF genotype on brain structure. Upper images show the locations of GM increases (red) and decreases (blue) in Val/Val homozygotes when compared with Met carriers projected onto surface-rendered views of the left and right hemispheres, lateral view. Bottom images are selected 2D sagittal slices with significant clusters displayed on the atlas of the neonate brain. Color bar gives the t-value at each voxel. Red/yellow indicates Val/Val > other. Blue/green indicates Val/Val < other.
No associations were identified for DISC1 (rs6675281), ESR1 (rs2234693), or GAD1.
Results are highly similar when controlling for parental psychiatric history, when including only 1 individual from each MZ pair [with the exception of ESR1 (rs9340799, AA > Other) and BDNF], and when controlling for birthweight (Supplementary Tables S5–S7).
Discussion
This study demonstrates that common genetic polymorphisms in putative psychiatric risk genes predict individual differences in brain structure shortly after birth. Some effects are highly similar to those reported in adults. As genetic variation interacts with experiential and environmental factors dynamically, varying across developmental stages, this represents a surprising and important finding. These variants and the associated neuroimaging phenotypes likely represent stable markers of risk and highlight the critical role of the perinatal period in the etiology of mental illness. Other findings are unique to this developmental period and may represent transient biomarkers of risk. Finally, by comparing our results with the existing literature, we can identify relationships that have been reported in adolescents/adults, which were not present in neonates. We hypothesize that these variants influence brain development and psychiatric risk in later childhood or adolescence and as such may be particularly promising targets for intervention.
As regards DISC1, Ser/Ser homozygotes (rs821616) exhibited reduced volumes in the frontal lobes, particularly in the medial superior frontal gyrus and supplementary motor areas, as well as in the lateral temporal cortex including the superior and middle temporal gyri. Reduced volumes and cortical thickness in the superior medial frontal gyrus (Takahashi et al. 2009; Brauns et al. 2011) have been reported in young adults, and reduced cortical thickness in supplementary motor and lateral temporal cortices has been reported in adolescents (Raznahan, Lee, et al. 2011) in Ser/Ser homozygotes. It is notable that multiple meta-analyses have shown GM reductions in the medial frontal cortex and superior temporal gyri in schizophrenia (Fornito et al. 2009; Ellison-Wright and Bullmore 2010; Bora et al. 2011). Abnormalities in the medial frontal cortex may be related to negative symptoms, while that in superior temporal gyri may be related to positive symptoms (Bora et al. 2011). Meta-analyses also suggest that middle temporal gyri are reduced in bipolar disorder (Yu et al. 2010; Selvaraj et al. 2012) with possible consequences for the experience of emotion (Selvaraj et al. 2012). We also observed local reductions in the occipital lobes in this group, which have not been previously reported. We did not observe increased volumes in the cingulate cortex of Ser/Ser homozygotes, which have been reported in middle-aged adults (Hashimoto et al. 2006). We did not observe any effects of rs6675281 despite reports in adolescents and adults that Phe carriers demonstrate multiple areas of reduced volume and/or cortical thickness (Szeszko et al. 2008; Brauns et al. 2011; Raznahan, Lee, et al. 2011). Intriguingly, studies in adolescents suggest very little overlap in cortical regions whose maturation is associated with rs821616 and rs6675281 (Raznahan, Lee, et al. 2011). As DISC1 interacts with numerous proteins implicated in neurodevelopment (Porteous et al. 2011), the divergent impact of these polymorphisms in terms of their regional and temporal effects may reflect regional and temporal differences in key signaling pathways. There is evidence that rs821616 exerts its effects through altered binding to centrosomal-associated nuclear distribution element-like 1 (NDEL1) and its homolog, NDE1 (Burdick et al. 2008), while rs6675281 disrupts nuclear targeting and regulation of activating transcription factor 4 (ATF4)-mediated transcription (Malavasi et al. 2012).
For COMT, our findings of reduced volumes in the temporal lobes, including right hippocampus, are highly similar to previous reports in adolescents and adults (Ohnishi et al. 2006; Taylor et al. 2007; Cerasa et al. 2008; Mechelli et al. 2009; Shaw et al. 2009). Our finding of increased parietal volumes in Val/Val homozygotes is also consistent with a previous report (Dumontheil et al. 2011). As noted previously, alterations in the temporal lobes are frequently observed in schizophrenia. Parietal alterations have also been reported, albeit less consistently (Fornito et al. 2009). In addition, functional neuroimaging studies suggest that key cognitive impairments in schizophrenia, including working memory deficits, might reflect fronto-parietal and frontal-temporal disconnections (Peled et al. 2001; Karlsgodt et al. 2008; Henseler et al. 2010). Our results suggest that variation in COMT effects neural systems implicated in the pathophysiology of schizophrenia before birth. We did not observe effects on dorsolateral prefrontal cortex, which is implicated in functional MRI studies of COMT and which has been implicated in several structural studies (Cerasa et al. 2008; Shaw et al. 2009). In addition, TBM revealed significant effects in the occipital cortex that have not been reported in older samples. Age-specific effects may reflect developmental changes in the distribution of catecholamines and their receptors in the brain and/or emerge as a result of genotype modulating the tempo of cortical maturation. In regard to the former, postmortem studies suggest that dopamine concentration and dopamine receptor 2 levels are higher in neonates than in older individuals (Weickert et al. 2007). In regard to the latter, COMT genotype is associated with cortical thickness changes in prefrontal, temporal, and superior parietal regions across adolescence (Raznahan, Greenstein, et al. 2011).
Four studies have examined whether SNPs in NRG1 are associated with brain tissue volumes. Winterer et al. (2008) found no effect of rs35753505 on brain tissue volumes using VBM, although they reported a relationship with subcortical medial frontal WM microstructure as indexed by DTI. Mata et al. (2009) reported an association of rs6994992 with ventricle volume in adult schizophrenics, but did not observe effects on frontal or parietal volumes in schizophrenics or a small sample of controls (n = 16). Addington et al. (2007) reported that a microsatellite in NRG1 was associated with total GM volume in children with childhood-onset schizophrenia, but not in controls. Tosato et al. (2012) reported an association between rs4623364 and volume of the left superior temporal gyrus, but not the right superior temporal gyrus, in chronic schizophrenia (other regions were not examined and no controls were included). In contrast, we observed several clusters where TT homozygotes (rs35753505) had reduced volumes. We also observed extensive effects of rs6994992. Additional comparative studies in adolescents and adults are needed to clarify whether these are developmentally limited effects or stable ones. However, these variants may be of particular relevance to the perinatal period. rs35753505 has recently been associated with NRG1 mRNA levels in human umbilical venous endothelial cells, and the C allele has been implicated as a protective factor against cerebral palsy and developmental delay in children born preterm (Hoffmann et al. 2011). rs6994992 may impact on type IV NRG1 expression, a transcript which is abundantly expressed in fetal brain (Tan et al. 2007).
For APOE, our findings of reduced volumes in the temporal cortex of ɛ4 carriers are highly similar to those reported in the elderly (Plassman et al. 1997; Lemaitre et al. 2005; Hua et al. 2008; Biffi et al. 2010). Reduced cortical thickness in the medial temporal cortex has also been reported in adults (Burggren et al. 2008), children, and adolescents (Shaw et al. 2007) carrying the ɛ4 variant, with the most consistent results reported for the thickness of entorhinal cortex (here included in the parahippocampal region). Our results indicate that the ɛ4 variant's contribution to brain phenotypes associated with Alzheimer's risk is likely present before birth and represents a stable risk factor. The mechanisms underlying the particular sensitivity of medial temporal cortex to the ɛ4 variant are not fully understood. Presynaptic derangements in APOE-deficient mice are a function of the distance between nerve terminals and their cell bodies and of neuronal class (Chapman and Michaelson 1998), and experiments in transgenic mice have demonstrated that the ɛ4 variant inhibits synaptogenesis following environmental enrichment in hippocampus and entorhinal cortex, but not in motor or auditory cortex (Levi et al. 2005). It should be noted that, despite its relation to cognitive decline in the elderly (Schiepers et al. 2012), APOE genotype does not affect intelligence quotient or school attainment test scores in late childhood (Taylor et al. 2011), and some studies have documented early cognitive benefits of the ɛ4 allele (Wright et al. 2003). While the relationship between regional cortical volume and cognitive performance at early ages remains to be clarified, it is possible that the increased volumes we observed in ɛ3ɛ4 infants represent compensatory changes or beneficial effects that result in balancing selection.
Regarding ESR1, a study of rs9340799 in postmenopausal women reported increased volume in AA homozygotes in the middle temporal cortex, occipital cortex, and cerebellum (Boccardi et al. 2008), which do not appear to overlap with the regions in which we observed increased volumes, although the A allele of rs9340799 was associated with increased ICV. The same study reported no regions of decreased volume in AA homozygotes, whereas we observed extensive regions of decreased volume in AA homozygotes, suggesting that this polymorphism exerts distinct effects dependent on age and/or hormonal status. rs2234693 has been reported to predict amygdala volume in elderly women, but not in elderly men (den Heijer et al. 2004). We observed no effects of this variant in neonates. We did not stratify our analyses by sex as the fetal ovary is generally considered inactive until late in development and, both male and female fetuses are exposed to high levels of estrogen produced by the placenta (Grumbach et al. 2003). Sex-specific effects are certainly of research interest, but would best be tested in a larger sample.
Regarding BDNF, adult studies of rs6265 have shown reduced volumes in Met carriers in diverse cortical regions (Ho et al. 2006; Takahashi et al. 2008; Montag et al. 2009), though results are inconsistent across studies with the exception of the hippocampus (Pezawas et al. 2004; Bueller et al. 2006; Frodl et al. 2007; Montag et al. 2009). We observed 2 clusters of reduced volume in Met carriers, one in the right occipital cortex and another in the temporal cortex, which did overlap with the hippocampus. Hippocampal dysfunction is thought to play a key role in a broad range of psychiatric conditions including depression, schizophrenia, and Alzheimer's (Small et al. 2011). We also observed multiple clusters of decreased volume in Val/Val homozygotes. The lack of consistency between studies could arise from age differences in the effect of BDNF genotype on brain structure. Participating children are returning for the follow-up neuroimaging scans and detailed developmental assessments at 1, 2, 4, and 6 years of age, which will ultimately allow us to test for age by genotype interactions and to determine the functional impact of variants on positive and problematic behaviors.
The G allele of GAD1 (rs2270335) has been associated with frontal GM volume loss in childhood-onset schizophrenia (Addington et al. 2005). We did not see any association of this variant with neonatal brain structure.
In conclusion, we have shown that variation in putative psychiatric risk genes affects neural systems implicated in the pathophysiology of psychiatric disorders prior to birth. As this is the first study to test this possibility, replication in independent samples and in other ethnic groups is critical. Larger studies would also provide more power for the detection of additive effects and gene–gene and gene–environment interactions. In addition, a better understanding of the mechanisms through which these variants impact cortical development in a localized and temporally specific manner would provide important context for the current results and could be achieved through innovative animal models. We also note that the targeted imaging genetics strategy used in this study, which focuses on a discrete set of common functional variants, is limited in that the variants we investigated likely represent a very small fraction of all variants involved in the development of human brain. Testing additional candidate variants would clearly be of interest, but it could also be extremely fruitful to directly relate genetic variants to early brain development on a genome-wide scale without being constrained by current biological knowledge. Neuroimaging of infants with rare and highly penetrant genetic variants associated with psychiatric disorders would also be of interest, given recent studies demonstrating that such variants make a larger contribution to psychiatric risk than previously recognized (Hosak et al. 2012). Nevertheless, the targeted imaging genetics strategy continues to be a powerful method for elucidating how genetic variants impact brain structure, function, and vulnerability to disease (Meyer-Lindenberg and Weinberger 2006; Tan et al. 2008; Bigos and Weinberger 2010). Our findings contribute to our understanding of how risk genes alter neurodevelopmental trajectories and provide new biological evidence for how early on in life the roots of adolescent/adult emergent disorders might lie.
Supplementary Material
Supplementary material can be found at: http://www.cercor.oxfordjournals.org/
Funding
This work was supported by the National Institutes of Health (MH064065 and MH070890 to J.H.G., MH083045 and MH092335 to R.C.K., HD03110 and MH091645 to M.S., and RR025747, P01CA142538, MH086633, EB005149, and AG033387 to H.Z.).
Supplementary Material
Notes
We thank the participating families who made this project possible as well as the staff of the UNC MRI Research Center, the UNC Neuro Image Research and Analysis Laboratories, and the UNC Early Brain Development Program. Conflict of Interest: None declared
References
- Addington AM, Gornick M, Duckworth J, Sporn A, Gogtay N, Bobb A, Greenstein D, Lenane M, Gochman P, Baker N, et al. GAD1 (2q31.1), which encodes glutamic acid decarboxylase (GAD67), is associated with childhood-onset schizophrenia and cortical gray matter volume loss. Mol Psychiatry. 2005;10:581–588. doi: 10.1038/sj.mp.4001599. [DOI] [PubMed] [Google Scholar]
- Addington AM, Gornick MC, Shaw P, Seal J, Gogtay N, Greenstein D, Clasen L, Coffey M, Gochman P, Long R, et al. Neuregulin 1 (8p12) and childhood-onset schizophrenia: susceptibility haplotypes for diagnosis and brain developmental trajectories. Mol Psychiatry. 2007;12:195–205. doi: 10.1038/sj.mp.4001906. [DOI] [PubMed] [Google Scholar]
- Akbarian S, Huang HS. Molecular and cellular mechanisms of altered GAD1/GAD67 expression in schizophrenia and related disorders. Brain Res Rev. 2006;52:293–304. doi: 10.1016/j.brainresrev.2006.04.001. [DOI] [PubMed] [Google Scholar]
- Ayalew M, Le-Niculescu H, Levey DF, Jain N, Changala B, Patel SD, Winiger E, Breier A, Shekhar A, Amdur R, et al. Convergent functional genomics of schizophrenia: from comprehensive understanding to genetic risk prediction. Mol Psychiatry. 2012;17:887–905. doi: 10.1038/mp.2012.37. [DOI] [PMC free article] [PubMed] [Google Scholar]
- Biffi A, Anderson CD, Desikan RS, Sabuncu M, Cortellini L, Schmansky N, Salat D, Rosand J ADNI. Genetic variation and neuroimaging measures in Alzheimer disease. Arch Neurol. 2010;67:677–685. doi: 10.1001/archneurol.2010.108. [DOI] [PMC free article] [PubMed] [Google Scholar]
- Bigos K, Weinberger D. Imaging genetics—days of future past. Neuroimage. 2010;53:804–809. doi: 10.1016/j.neuroimage.2010.01.035. [DOI] [PubMed] [Google Scholar]
- Boccardi M, Scassellati C, Ghidoni R, Testa C, Benussi L, Bonetti M, Bocchio-Chiavetto L, Gennarelli M, Binetti G, Frisoni GB. Effect of the XbaI polymorphism of estrogen receptor alpha on postmenopausal gray matter. Neurosci Lett. 2008;434:304–309. doi: 10.1016/j.neulet.2008.01.076. [DOI] [PubMed] [Google Scholar]
- Bora E, Fornito A, Radua J, Walterfang M, Seal M, Wood SJ, Yucel M, Velakoulis D, Pantelis C. Neuroanatomical abnormalities in schizophrenia: a multimodal voxelwise meta-analysis and meta-regression analysis. Schizophr Res. 2011;127:46–57. doi: 10.1016/j.schres.2010.12.020. [DOI] [PubMed] [Google Scholar]
- Brauns S, Gollub RL, Roffman JL, Yendiki A, Ho BC, Wassink TH, Heinz A, Ehrlich S. DISC1 is associated with cortical thickness and neural efficiency. Neuroimage. 2011;57:1591–1600. doi: 10.1016/j.neuroimage.2011.05.058. [DOI] [PMC free article] [PubMed] [Google Scholar]
- Brody BA, Kinney HC, Kloman AS, Gilles FH. Sequence of central nervous system myelination in human infancy. I. An autopsy study of myelination. J Neuropathol Exp Neurol. 1987;46:283–301. doi: 10.1097/00005072-198705000-00005. [DOI] [PubMed] [Google Scholar]
- Bueller JA, Aftab M, Sen S, Gomez-Hassan D, Burmeister M, Zubieta JK. BDNF val(66) met allele is associated with reduced hippocampal volume in healthy subjects. Biol Psychiatry. 2006;59:812–815. doi: 10.1016/j.biopsych.2005.09.022. [DOI] [PubMed] [Google Scholar]
- Buonanno A. The neuregulin signaling pathway and schizophrenia: from genes to synapses and neural circuits. Brain Res Bull. 2010;83:122–131. doi: 10.1016/j.brainresbull.2010.07.012. [DOI] [PMC free article] [PubMed] [Google Scholar]
- Burdick KE, Kamiya A, Hodgkinson CA, Lencz T, DeRosse P, Ishizuka K, Elashvili S, Arai H, Goldman D, Sawa A, et al. Elucidating the relationship between DISC1, NDEL1 and NDE1 and the risk for schizophrenia: evidence of epistasis and competitive binding. Hum Mol Genet. 2008;17:2462–2473. doi: 10.1093/hmg/ddn146. [DOI] [PMC free article] [PubMed] [Google Scholar]
- Burggren AC, Zeineh MM, Ekstrom AD, Braskie MN, Thompson PM, Small GW, Bookheimer SY. Reduced cortical thickness in hippocampal subregions among cognitively normal apolipoprotein E e4 carriers. Neuroimage. 2008;41:1177–1183. doi: 10.1016/j.neuroimage.2008.03.039. [DOI] [PMC free article] [PubMed] [Google Scholar]
- Cannon TD, Hennah W, van Erp TG, Thompson PM, Lonnqvist J, Huttunen M, Gasperoni T, Tuulio-Henriksson A, Pirkola T, Toga AW, et al. Association of DISC1/TRAX haplotypes with schizophrenia, reduced prefrontal gray matter, and impaired short- and long-term memory. Arch Gen Psychiatry. 2005;62:1205–1213. doi: 10.1001/archpsyc.62.11.1205. [DOI] [PubMed] [Google Scholar]
- Cao J. The size of the connected components of excursion sets of chi(2), t and F fields. Adv Appl Probab. 1999;31:579–595. [Google Scholar]
- Cerasa A, Gioia MC, Labate A, Liguori M, Lanza P, Quattrone A. Impact of catechol-O-methyltransferase Val(108/158) Met genotype on hippocampal and prefrontal gray matter volume. Neuroreport. 2008;19:405–408. doi: 10.1097/WNR.0b013e3282f5f784. [DOI] [PubMed] [Google Scholar]
- Chapman S, Michaelson DM. Specific neurochemical derangements of brain projecting neurons in apolipoprotein E-deficient mice. J Neurochem. 1998;70:708–714. doi: 10.1046/j.1471-4159.1998.70020708.x. [DOI] [PubMed] [Google Scholar]
- Chen JS, Lipska BK, Halim N, Ma QD, Matsumoto M, Melhem S, Kolachana BS, Hyde TM, Herman MM, Apud J, et al. Functional analysis of genetic variation in catechol-O-methyltransferase (COMT): effects on mRNA, protein, and enzyme activity in postmortem human brain. Am J Hum Genet. 2004;75:807–821. doi: 10.1086/425589. [DOI] [PMC free article] [PubMed] [Google Scholar]
- Cherlyn SY, Woon PS, Liu JJ, Ong WY, Tsai GC, Sim K. Genetic association studies of glutamate, GABA and related genes in schizophrenia and bipolar disorder: a decade of advance. Neurosci Biobehav Rev. 2010;34:958–977. doi: 10.1016/j.neubiorev.2010.01.002. [DOI] [PubMed] [Google Scholar]
- Cheung C, Yu K, Fung G, Leung M, Wong C, Li Q, Sham P, Chua S, McAlonan G. Autistic disorders and schizophrenia: related or remote? An anatomical likelihood estimation. Plos One. 2010;5:e12233. doi: 10.1371/journal.pone.0012233. [DOI] [PMC free article] [PubMed] [Google Scholar]
- Corbo RM, Scacchi R. Apolipoprotein E (APOE) allele distribution in the world. Is APOE*4 a ‘thrifty’ allele? Ann Hum Genet. 1999;63:301–310. doi: 10.1046/j.1469-1809.1999.6340301.x. [DOI] [PubMed] [Google Scholar]
- Corder EH, Saunders AM, Strittmatter WJ, Schmechel DE, Gaskell PC, Small GW, Roses AD, Haines JL, Pericakvance MA. Gene dose of apolipoprotein-E type-4 allele and the risk of Alzheimers-disease in late-onset families. Science. 1993;261:921–923. doi: 10.1126/science.8346443. [DOI] [PubMed] [Google Scholar]
- Cox RW. AFNI: software for analysis and visualization of functional magnetic resonance neuroimages. Comput Biomed Res. 1996;29:162–173. doi: 10.1006/cbmr.1996.0014. [DOI] [PubMed] [Google Scholar]
- den Heijer T, Schuit SC, Pols HA, van Meurs JB, Hofman A, Koudstaal PJ, van Duijn CM, Uitterlinden AG, Breteler MM. Variations in estrogen receptor alpha gene and risk of dementia, and brain volumes on MRI. Mol Psychiatry. 2004;9:1129–1135. doi: 10.1038/sj.mp.4001553. [DOI] [PubMed] [Google Scholar]
- Dong LM, Weisgraber KH. Human apolipoprotein E4 domain interaction. Arginine 61 and glutamic acid 255 interact to direct the preference for very low density lipoproteins. J Biol Chem. 1996;271:19053–19057. doi: 10.1074/jbc.271.32.19053. [DOI] [PubMed] [Google Scholar]
- Dumontheil I, Roggeman C, Ziermans T, Peyrard-Janvid M, Matsson H, Kere J, Klingberg T. Influence of the COMT genotype on working memory and brain activity changes during development. Biol Psychiatry. 2011;70:222–229. doi: 10.1016/j.biopsych.2011.02.027. [DOI] [PubMed] [Google Scholar]
- Eastwood SL, Hodgkinson CA, Harrison PJ. DISC-1 Leu607Phe alleles differentially affect centrosomal PCM1 localization and neurotransmitter release. Mol Psychiatry. 2009;14:556–557. doi: 10.1038/mp.2009.13. [DOI] [PubMed] [Google Scholar]
- Ekelund J, Hennah W, Hiekkalinna T, Parker A, Meyer J, Lonnqvist J, Peltonen L. Replication of 1q42 linkage in Finnish schizophrenia pedigrees. Mol Psychiatry. 2004;9:1037–1041. doi: 10.1038/sj.mp.4001536. [DOI] [PubMed] [Google Scholar]
- Ellison-Wright I, Bullmore E. Anatomy of bipolar disorder and schizophrenia: a meta-analysis. Schizophr Res. 2010;117:1–12. doi: 10.1016/j.schres.2009.12.022. [DOI] [PubMed] [Google Scholar]
- Fatemi SH, Folsom TD. The neurodevelopmental hypothesis of schizophrenia, revisited. Schizophr Bull. 2009;35:528–548. doi: 10.1093/schbul/sbn187. [DOI] [PMC free article] [PubMed] [Google Scholar]
- Fornito A, Yucel M, Patti J, Wood SJ, Pantelis C. Mapping grey matter reductions in schizophrenia: an anatomical likelihood estimation analysis of voxel-based morphometry studies. Schizophr Res. 2009;108:104–113. doi: 10.1016/j.schres.2008.12.011. [DOI] [PubMed] [Google Scholar]
- Frodl T, Schuele C, Schmitt G, Born C, Baghai T, Zill P, Bottlender R, Rupprecht R, Bondy B, Reiser M, et al. Association of the brain-derived neurotrophic factor Val66Met polymorphism with reduced hippocampal volumes in major depression. Arch Gen Psychiatry. 2007;64:410–416. doi: 10.1001/archpsyc.64.4.410. [DOI] [PubMed] [Google Scholar]
- Fukumoto N, Fujii T, Combarros O, Kamboh MI, Tsai SJ, Matsushita S, Nacmias B, Comings DE, Arboleda H, Ingelsson M, et al. Sexually dimorphic effect of the Val66Met polymorphism of BDNF on susceptibility to Alzheimer's disease: new data and meta-analysis. Am J Med Genet B Neuropsychiatr Genet. 2010;153B:235–242. doi: 10.1002/ajmg.b.30986. [DOI] [PubMed] [Google Scholar]
- Gaunt TR, Rodriguez S, Day I. Cubic exact solutions for the estimation of pairwise haplotype frequencies: implications for linkage disequilibrium analyses and a web tool ‘CubeX. BMC Bioinformatics. 2007;8:428. doi: 10.1186/1471-2105-8-428. [DOI] [PMC free article] [PubMed] [Google Scholar]
- Georgieva L, Dimitrova A, Ivanov D, Nikolov I, Williams NM, Grozeva D, Zaharieva I, Toncheva D, Owen MJ, Kirov G, et al. Support for neuregulin 1 as a susceptibility gene for bipolar disorder and schizophrenia. Biol Psychiatry. 2008;64:419–427. doi: 10.1016/j.biopsych.2008.03.025. [DOI] [PubMed] [Google Scholar]
- Gibbons AS, Udawela M, Jeon WJ, Seo MS, Brooks L, Dean B. The neurobiology of APOE in schizophrenia and mood disorders. Front Biosci. 2011;16:962–979. doi: 10.2741/3729. [DOI] [PubMed] [Google Scholar]
- Gilmore JH, Kang C, Evans DD, Wolfe HM, Smith JK, Lieberman JA, Lin W, Hamer RM, Styner M, Gerig G. Prenatal and neonatal brain structure and white matter maturation in children at high risk for schizophrenia. Am J Psychiatry. 2010;167:1083–1091. doi: 10.1176/appi.ajp.2010.09101492. [DOI] [PMC free article] [PubMed] [Google Scholar]
- Gilmore JH, Lin W, Prastawa MW, Looney CB, Vetsa YSK, Knickmeyer RC, Evans DD, Smith JK, Hamer RM, Lieberman JA, et al. Regional gray matter growth, sexual dimorphism, and cerebral asymmetry in the neonatal brain. J Neurosci. 2007;27:1255–1260. doi: 10.1523/JNEUROSCI.3339-06.2007. [DOI] [PMC free article] [PubMed] [Google Scholar]
- Gilmore JH, Shi F, Woolson SL, Knickmeyer RC, Short SJ, Lin W, Zhu H, Hamer RM, Styner M, Shen D. Longitudinal development of cortical and subcortical gray matter from birth to 2 years. Cereb Cortex. 2011;22:2478–2485. doi: 10.1093/cercor/bhr327. [DOI] [PMC free article] [PubMed] [Google Scholar]
- Gratacos M, Gonzalez JR, Mercader JM, de Cid R, Urretavizcaya M, Estivill X. Brain-derived neurotrophic factor Val66Met and psychiatric disorders: meta-analysis of case-control studies confirm association to substance-related disorders, eating disorders, and schizophrenia. Biol Psychiatry. 2007;61:911–922. doi: 10.1016/j.biopsych.2006.08.025. [DOI] [PubMed] [Google Scholar]
- Grumbach MM, Hughes IA, Conte FA. Williams textbook of endocrinology. In: Larsen P, Kronenberg H, Melmed S, Polonsky K, editors. Williams textbook of endocrinology. 10th ed. Philadelphia: Saunders; 2003. pp. 842–969. [Google Scholar]
- Hashimoto R, Numakawa T, Ohnishi T, Kumamaru E, Yagasaki Y, Ishimoto T, Mori T, Nemoto K, Adachi N, Izumi A, et al. Impact of the DISC1 Ser704Cys polymorphism on risk for major depression, brain morphology and ERK signaling. Hum Mol Genet. 2006;15:3024–3033. doi: 10.1093/hmg/ddl244. [DOI] [PubMed] [Google Scholar]
- Hayasaka S, Phan KL, Liberzon I, Worsley KJ, Nichols TE. Nonstationary cluster-size inference with random field and permutation methods. Neuroimage. 2004;22:676–687. doi: 10.1016/j.neuroimage.2004.01.041. [DOI] [PubMed] [Google Scholar]
- Hazlett HC, Poe M, Gerig G, Smith RG, Provenzale J, Ross A, Gilmore J, Piven J. Magnetic resonance Imaging and head circumference study of brain size in autism—birth through age 2 years. Arch Gen Psychiatry. 2005;62:1366–1376. doi: 10.1001/archpsyc.62.12.1366. [DOI] [PubMed] [Google Scholar]
- Hazlett HC, Poe MD, Gerig G, Styner M, Chappell C, Smith RG, Vachet C, Piven J. Early brain overgrowth in autism associated with an increase in cortical surface area before age 2 years. Arch Gen Psychiatry. 2011;68:467–476. doi: 10.1001/archgenpsychiatry.2011.39. [DOI] [PMC free article] [PubMed] [Google Scholar]
- Hennah W, Thomson P, McQuillin A, Bass N, Loukola A, Anjorin A, Blackwood D, Curtis D, Deary IJ, Harris SE, et al. DISC1 association, heterogeneity and interplay in schizophrenia and bipolar disorder. Mol Psychiatry. 2009;14:865–873. doi: 10.1038/mp.2008.22. [DOI] [PubMed] [Google Scholar]
- Hennah W, Varilo T, Kestila M, Paunio T, Arajarvi R, Haukka J, Parker A, Martin R, Levitzky S, Partonen T, et al. Haplotype transmission analysis provides evidence of association for DISC1 to schizophrenia and suggests sex-dependent effects. Hum Mol Genet. 2003;12:3151–3159. doi: 10.1093/hmg/ddg341. [DOI] [PubMed] [Google Scholar]
- Henseler I, Falkai P, Gruber O. Disturbed functional connectivity within brain networks subserving domain-specific subcomponents of working memory in schizophrenia: relation to performance and clinical symptoms. J Psychiatr Res. 2010;44:364–372. doi: 10.1016/j.jpsychires.2009.09.003. [DOI] [PubMed] [Google Scholar]
- Ho BC, Milev P, O'Leary DS, Librant A, Andreasen NC, Wassink TH. Cognitive and magnetic resonance imaging brain morphometric correlates of brain-derived neurotrophic factor Val66Met gene polymorphism in patients with schizophrenia and healthy volunteers. Arch Gen Psychiatry. 2006;63:731–740. doi: 10.1001/archpsyc.63.7.731. [DOI] [PMC free article] [PubMed] [Google Scholar]
- Hodgkinson CA, Goldman D, Jaeger J, Persaud S, Kane JM, Lipsky RH, Malhotra AK. Disrupted in schizophrenia 1 (DISC1): association with schizophrenia, schizoaffective disorder, and bipolar disorder. Am J Hum Genet. 2004;75:862–872. doi: 10.1086/425586. [DOI] [PMC free article] [PubMed] [Google Scholar]
- Hoffmann I, Bueter W, Zscheppang K, Brinkhaus MJ, Liese A, Riemke S, Dork T, Dammann O, Dammann CEL. Neuregulin-1, the fetal endothelium, and brain damage in preterm newborns (vol 24, pg 784, 2010) Brain Behav Immun. 2011;25:1044. doi: 10.1016/j.bbi.2009.08.012. [DOI] [PMC free article] [PubMed] [Google Scholar]
- Hong CJ, Liou YJ, Tsai SJ. Effects of BDNF polymorphisms on brain function and behavior in health and disease. Brain Res Bull. 2011;86:287–297. doi: 10.1016/j.brainresbull.2011.08.019. [DOI] [PubMed] [Google Scholar]
- Hosak L, Silhan P, Hosakova J. Genomic copy number variations: a breakthrough in our knowledge on schizophrenia etiology? Neuroendocrinol Lett. 2012;33:183–190. [PubMed] [Google Scholar]
- Hua X, Leow AD, Parikshak N, Lee S, Chiang MC, Toga AW, Jack CR, Jr, Weiner MW, Thompson PM. Tensor-based morphometry as a neuroimaging biomarker for Alzheimer's disease: an MRI study of 676 AD, MCI, and normal subjects. Neuroimage. 2008;43:458–469. doi: 10.1016/j.neuroimage.2008.07.013. [DOI] [PMC free article] [PubMed] [Google Scholar]
- Huttenlocher PR, Dabholkar AS. Regional differences in synaptogenesis in human cerebral cortex. J Comp Neurol. 1997;387:167–178. doi: 10.1002/(sici)1096-9861(19971020)387:2<167::aid-cne1>3.0.co;2-z. [DOI] [PubMed] [Google Scholar]
- Johnstone M, Thomson PA, Hall J, McIntosh AM, Lawrie SM, Porteous DJ. DISC1 in schizophrenia: genetic mouse models and human genomic imaging. Schizophr Bull. 2011;37:14–20. doi: 10.1093/schbul/sbq135. [DOI] [PMC free article] [PubMed] [Google Scholar]
- Joshi S, Davis B, Jomier M, Gerig G. Unbiased diffeomorphic atlas construction for computational anatomy. Neuroimage. 2004;23(1):S151–160. doi: 10.1016/j.neuroimage.2004.07.068. [DOI] [PubMed] [Google Scholar]
- Karlsgodt KH, van Erp TG, Poldrack RA, Bearden CE, Nuechterlein KH, Cannon TD. Diffusion tensor imaging of the superior lo6ngitudinal fasciculus and working memory in recent-onset schizophrenia. Biol Psychiatry. 2008;63:512–518. doi: 10.1016/j.biopsych.2007.06.017. [DOI] [PubMed] [Google Scholar]
- Kasprian G, Brugger PC, Weber M, Krssak M, Krampl E, Herold C, Prayer D. In utero tractography of fetal white matter development. Neuroimage. 2008;43:213–224. doi: 10.1016/j.neuroimage.2008.07.026. [DOI] [PubMed] [Google Scholar]
- Kilpinen H, Ylisaukko-Oja T, Hennah W, Palo OM, Varilo T, Vanhala R, Wendt TNV, von Wendt L, Paunio T, Peltonen L. Association of DISC1 with autism and Asperger syndrome. Mol Psychiatry. 2008;13:187–196. doi: 10.1038/sj.mp.4002031. [DOI] [PubMed] [Google Scholar]
- Knickmeyer R, Gouttard S, Kang C, Evans D, Wilber K, Smith JK, Hamer RM, Lin W, Gerig G, Gilmore JH. A structural MRI study of human brain development from birth to 2 years. J Neurosci. 2008;28:12176–12182. doi: 10.1523/JNEUROSCI.3479-08.2008. [DOI] [PMC free article] [PubMed] [Google Scholar]
- Law AJ, Lipska BK, Weickert CS, Hyde TM, Straub RE, Hashimoto R, Harrison PJ, Kleinman JE, Weinberger DR. Neuregulin 1 transcripts are differentially expressed in schizophrenia and regulated by 5′ SNPs associated with the disease. Proc Natl Acad Sci USA. 2006;103:6747–6752. doi: 10.1073/pnas.0602002103. [DOI] [PMC free article] [PubMed] [Google Scholar]
- Leliveld SR, Hendriks P, Michel M, Sajnani G, Bader V, Trossbach S, Prikulis I, Hartmann R, Jonas E, Willbold D, et al. Oligomer assembly of the C-terminal DISC1 domain (640–854) is controlled by self-association motifs and disease-associated polymorphism S704C. Biochemistry (Mosc) 2009;48:7746–7755. doi: 10.1021/bi900901e. [DOI] [PubMed] [Google Scholar]
- Lemaitre H, Crivello F, Dufouil C, Grassiot B, Tzourio C, Alperovitch A, Mazoyer B. No epsilon(4) gene dose effect on hippocampal atrophy in a large MRI database of healthy elderly subjects. Neuroimage. 2005;24:1205–1213. doi: 10.1016/j.neuroimage.2004.10.016. [DOI] [PubMed] [Google Scholar]
- Lepore N, Brun C, Chou YY, Chiang MC, Dutton RA, Hayashi KM, Luders E, Lopez OL, Aizenstein HJ, Toga AW, et al. Generalized tensor-based morphometry of HIV/AIDS using multivariate statistics on deformation tensors. IEEE Trans Med Imaging. 2008;27:129–141. doi: 10.1109/TMI.2007.906091. [DOI] [PMC free article] [PubMed] [Google Scholar]
- Levi O, Jongen-Relo AL, Feldon J, Michaelson DM. Brain area- and isoform-specific inhibition of synaptic plasticity by apoE4. J Neurol Sci. 2005;229–230:241–248. doi: 10.1016/j.jns.2004.11.035. [DOI] [PubMed] [Google Scholar]
- Lewandowski KE. Relationship of catechol-O-methyltransferase to schizophrenia and its correlates: evidence for associations and complex interactions. Harv Rev Psychiatry. 2007;15:233–244. doi: 10.1080/10673220701650409. [DOI] [PubMed] [Google Scholar]
- Li D, Collier DA, He L. Meta-analysis shows strong positive association of the neuregulin 1 (NRG1) gene with schizophrenia. Hum Mol Genet. 2006;15:1995–2002. doi: 10.1093/hmg/ddl122. [DOI] [PubMed] [Google Scholar]
- Li YM, Zhu HT, Shen DG, Lin WL, Gilmore JH, Ibrahim JG. Multiscale adaptive regression models for neuroimaging data. J Roy Stat Soc B. 2011;73:559–578. doi: 10.1111/j.1467-9868.2010.00767.x. [DOI] [PMC free article] [PubMed] [Google Scholar]
- Liang KY, Zeger SL. Longitudinal data-analysis using generalized linear-models. Biometrika. 1986;73:13–22. [Google Scholar]
- Mahley RW, Huang Y. Apolipoprotein (apo) E4 and Alzheimer's disease: unique conformational and biophysical properties of apoE4 can modulate neuropathology. Acta Neurol Scand Suppl. 2006;185:8–14. doi: 10.1111/j.1600-0404.2006.00679.x. [DOI] [PubMed] [Google Scholar]
- Malavasi EL, Ogawa F, Porteous DJ, Millar JK. DISC1 variants 37W and 607F disrupt its nuclear targeting and regulatory role in ATF4-mediated transcription. Hum Mol Genet. 2012;21:2779–2792. doi: 10.1093/hmg/dds106. [DOI] [PMC free article] [PubMed] [Google Scholar]
- Maruyama H, Toji H, Harrington CR, Sasaki K, Izumi Y, Ohnuma T, Arai H, Yasuda M, Tanaka C, Emson PC, et al. Lack of an association of estrogen receptor alpha gene polymorphisms and transcriptional activity with Alzheimer disease. Arch Neurol. 2000;57:236–240. doi: 10.1001/archneur.57.2.236. [DOI] [PubMed] [Google Scholar]
- Mata I, Perez-Iglesias R, Roiz-Santianez R, Tordesillas-Gutierrez D, Gonzalez-Mandly A, Vazquez-Barquero JL, Crespo-Facorro B. A neuregulin 1 variant is associated with increased lateral ventricle volume in patients with first-episode schizophrenia. Biol Psychiatry. 2009;65:535–540. doi: 10.1016/j.biopsych.2008.10.020. [DOI] [PubMed] [Google Scholar]
- McIntosh AM, Baig BJ, Hall J, Job D, Whalley HC, Lymer GK, Moorhead TW, Owens DG, Miller P, Porteous D, et al. Relationship of catechol-O-methyltransferase variants to brain structure and function in a population at high risk of psychosis. Biol Psychiatry. 2007;61:1127–1134. doi: 10.1016/j.biopsych.2006.05.020. [DOI] [PubMed] [Google Scholar]
- Mechelli A, Tognin S, McGuire PK, Prata D, Sartori G, Fusar-Poli P, De Brito S, Hariri AR, Viding E. Genetic vulnerability to affective psychopathology in childhood: a combined voxel-based morphometry and functional magnetic resonance imaging study. Biol Psychiatry. 2009;66:231–237. doi: 10.1016/j.biopsych.2009.01.033. [DOI] [PubMed] [Google Scholar]
- Mei L, Xiong WC. Neuregulin 1 in neural development, synaptic plasticity and schizophrenia. Nat Rev Neurosci. 2008;9:437–452. doi: 10.1038/nrn2392. [DOI] [PMC free article] [PubMed] [Google Scholar]
- Meyer-Lindenberg A, Nichols T, Callicott JH, Ding J, Kolachana B, Buckholtz J, Mattay VS, Egan M, Weinberger DR. Impact of complex genetic variation in COMT on human brain function. Mol Psychiatry. 2006;11:867–877, 797. doi: 10.1038/sj.mp.4001860. [DOI] [PubMed] [Google Scholar]
- Meyer-Lindenberg A, Weinberger DR. Intermediate phenotypes and genetic mechanisms of psychiatric disorders. Nat Rev Neurosci. 2006;7:818–827. doi: 10.1038/nrn1993. [DOI] [PubMed] [Google Scholar]
- Montag C, Weber B, Fliessbach K, Elger C, Reuter M. The BDNF Val66Met polymorphism impacts parahippocampal and amygdala volume in healthy humans: incremental support for a genetic risk factor for depression. Psychol Med. 2009;39:1831–1839. doi: 10.1017/S0033291709005509. [DOI] [PubMed] [Google Scholar]
- Munoz A, Rosner B, Carey V. Regression-analysis in the presence of heterogeneous intraclass correlations. Biometrics. 1986;42:653–658. [PubMed] [Google Scholar]
- Ohnishi T, Hashimoto R, Mori T, Nemoto K, Moriguchi Y, Iida H, Noguchi H, Nakabayashi T, Hori H, Ohmori M, et al. The association between the Val158Met polymorphism of the catechol-O-methyl transferase gene and morphological abnormalities of the brain in chronic schizophrenia. Brain. 2006;129:399–410. doi: 10.1093/brain/awh702. [DOI] [PubMed] [Google Scholar]
- Patel SD, Le-Niculescu H, Koller DL, Green SD, Lahiri DK, McMahon FJ, Nurnberger JI, Jr, Niculescu AB., III. Coming to grips with complex disorders: genetic risk prediction in bipolar disorder using panels of genes identified through convergent functional genomics. Am J Med Genet B Neuropsychiatr Genet. 2010;153B:850–877. doi: 10.1002/ajmg.b.31087. [DOI] [PubMed] [Google Scholar]
- Peled A, Geva AB, Kremen WS, Blankfeld HM, Esfandiarfard R, Nordahl TE. Functional connectivity and working memory in schizophrenia: an EEG study. Int J Neurosci. 2001;106:47–61. doi: 10.3109/00207450109149737. [DOI] [PubMed] [Google Scholar]
- Petanjek Z, Judas M, Kostovic I, Uylings HBM. Lifespan alterations of basal dendritic trees of pyramidal neurons in the human prefrontal cortex: a layer-specific pattern. Cereb Cortex. 2008;18:915–929. doi: 10.1093/cercor/bhm124. [DOI] [PubMed] [Google Scholar]
- Pezawas L, Verchinski BA, Mattay VS, Callicott JH, Kolachana BS, Straub RE, Egan MF, Meyer-Lindenberg A, Weinberger DR. The brain-derived neurotrophic factor val66met polymorphism and variation in human cortical morphology. J Neurosci. 2004;24:10099–10102. doi: 10.1523/JNEUROSCI.2680-04.2004. [DOI] [PMC free article] [PubMed] [Google Scholar]
- Plassman BL, WelshBohmer KA, Bigler ED, Johnson SC, Anderson CV, Helms MJ, Saunders AM, Breitner JCS. Apolipoprotein E epsilon 4 allele and hippocampal volume in twins with normal cognition. Neurology. 1997;48:985–989. doi: 10.1212/wnl.48.4.985. [DOI] [PubMed] [Google Scholar]
- Porteous DJ, Millar JK, Brandon NJ, Sawa A. DISC1 at 10: connecting psychiatric genetics and neuroscience. Trends Mol Med. 2011;17:699–706. doi: 10.1016/j.molmed.2011.09.002. [DOI] [PMC free article] [PubMed] [Google Scholar]
- Prastawa M, Gilmore JH, Lin WL, Gerig G. Automatic segmentation of MR images of the developing newborn brain. Med Image Anal. 2005;9:457–466. doi: 10.1016/j.media.2005.05.007. [DOI] [PubMed] [Google Scholar]
- Prata DP, Breen G, Osborne S, Munro J, St Clair D, Collier DA. An association study of the neuregulin 1 gene, bipolar affective disorder and psychosis. Psychiatr Genet. 2009;19:113–116. doi: 10.1097/YPG.0b013e32832a4f69. [DOI] [PubMed] [Google Scholar]
- Qu M, Tang FL, Yue WH, Ruan Y, Lu TL, Liu ZH, Zhang HD, Han YH, Zhang DR, Wang F, et al. Positive association of the disrupted-in-schizophrenia-1 gene (DISC1) with schizophrenia in the Chinese Han Population. Am J Med Genet B. 2007;144B:266–270. doi: 10.1002/ajmg.b.30322. [DOI] [PubMed] [Google Scholar]
- Rapoport JC, Addington AM, Frangou S. The neurodevelopmental model of schizophrenia: update 2005. Mol Psychiatry. 2005;10:614. [Google Scholar]
- Rasetti R, Weinberger DR. Intermediate phenotypes in psychiatric disorders. Curr Opin Genet Dev. 2011;21:340–348. doi: 10.1016/j.gde.2011.02.003. [DOI] [PMC free article] [PubMed] [Google Scholar]
- Raznahan A, Greenstein D, Lee Y, Long R, Clasen L, Gochman P, Addington A, Giedd JN, Rapoport JL, Gogtay N. Catechol-O-methyl transferase (COMT) val158met polymorphism and adolescent cortical development in patients with childhood-onset schizophrenia, their non-psychotic siblings, and healthy controls. Neuroimage. 2011;57:1517–1523. doi: 10.1016/j.neuroimage.2011.05.032. [DOI] [PMC free article] [PubMed] [Google Scholar]
- Raznahan A, Lee Y, Long R, Greenstein D, Clasen L, Addington A, Rapoport JL, Giedd JN. Common functional polymorphisms of DISC1 and cortical maturation in typically developing children and adolescents. Mol Psychiatry. 2011;16:917–926. doi: 10.1038/mp.2010.72. [DOI] [PMC free article] [PubMed] [Google Scholar]
- Reichardt LF. Neurotrophin-regulated signalling pathways. Philos T R Soc B. 2006;361:1545–1564. doi: 10.1098/rstb.2006.1894. [DOI] [PMC free article] [PubMed] [Google Scholar]
- Scharinger C, Rabl U, Sitte HH, Pezawas L. Imaging genetics of mood disorders. Neuroimage. 2010;53:810–821. doi: 10.1016/j.neuroimage.2010.02.019. [DOI] [PMC free article] [PubMed] [Google Scholar]
- Schiepers OJ, Harris SE, Gow AJ, Pattie A, Brett CE, Starr JM, Deary IJ. APOE E4 status predicts age-related cognitive decline in the ninth decade: longitudinal follow-up of the Lothian Birth Cohort 1921. Mol Psychiatry. 2012;17:315–324. doi: 10.1038/mp.2010.137. [DOI] [PubMed] [Google Scholar]
- Selvaraj S, Arnone D, Job D, Stanfield A, Farrow TF, Nugent AC, Scherk H, Gruber O, Chen X, Sachdev PS, et al. Grey matter differences in bipolar disorder: a meta-analysis of voxel-based morphometry studies. Bipolar Disord. 2012;14:135–145. doi: 10.1111/j.1399-5618.2012.01000.x. [DOI] [PubMed] [Google Scholar]
- Shaw P, Lerch JP, Pruessner JC, Taylor KN, Rose AB, Greenstein D, Clasen L, Evans A, Rapoport JL, Giedd JN. Cortical morphology in children and adolescents with different apolipoprotein E gene polymorphisms: an observational study. Lancet Neurol. 2007;6:494–500. doi: 10.1016/S1474-4422(07)70106-0. [DOI] [PubMed] [Google Scholar]
- Shaw P, Wallace GL, Addington A, Evans A, Rapoport J, Giedd JN. Effects of the Val(158)Met catechol-O-methyltransferase polymorphism on cortical structure in children and adolescents. Mol Psychiatry. 2009;14:348–349. doi: 10.1038/mp.2008.121. [DOI] [PMC free article] [PubMed] [Google Scholar]
- Shibuya M, Komi E, Wang R, Kato T, Watanabe Y, Sakai M, Ozaki M, Someya T, Nawa H. Measurement and comparison of serum neuregulin 1 immunoreactivity in control subjects and patients with schizophrenia: an influence of its genetic polymorphism. J Neural Transm. 2010;117:887–895. doi: 10.1007/s00702-010-0418-3. [DOI] [PubMed] [Google Scholar]
- Small SA, Schobel SA, Buxton RB, Witter MP, Barnes CA. A pathophysiological framework of hippocampal dysfunction in ageing and disease. Nat Rev Neurosci. 2011;12:585–601. doi: 10.1038/nrn3085. [DOI] [PMC free article] [PubMed] [Google Scholar]
- Sundermann EE, Maki PM, Bishop JR. A review of estrogen receptor alpha gene (ESR1) polymorphisms, mood, and cognition. Menopause. 2010;17:874–886. doi: 10.1097/gme.0b013e3181df4a19. [DOI] [PMC free article] [PubMed] [Google Scholar]
- Szeszko PR, Hodgkinson CA, Robinson DG, DeRosse P, Bilder RM, Lencz T, Burdick KE, Napolitano B, Betensky JD, Kane JA, et al. DISC1 is associated with prefrontal cortical gray matter and positive symptoms in schizophrenia. Biol Psychol. 2008;79:103–110. doi: 10.1016/j.biopsycho.2007.10.011. [DOI] [PMC free article] [PubMed] [Google Scholar]
- Takahashi T, Suzuki M, Tsunoda M, Kawamura Y, Takahashi N, Tsuneki H, Kawasaki Y, Zhou SY, Kobayashi S, Sasaoka T, et al. Association between the brain-derived neurotrophic factor Val66Met polymorphism and brain morphology in a Japanese sample of schizophrenia and healthy comparisons. Neurosci Lett. 2008;435:34–39. doi: 10.1016/j.neulet.2008.02.004. [DOI] [PubMed] [Google Scholar]
- Takahashi T, Suzuki M, Tsunoda M, Maeno N, Kawasaki Y, Zhou SY, Hagino H, Niu L, Tsuneki H, Kobayashi S, et al. The disrupted-in-schizophrenia-1 Ser704Cys polymorphism and brain morphology in schizophrenia. Psychiat Res-Neuroim. 2009;172:128–135. doi: 10.1016/j.pscychresns.2009.01.005. [DOI] [PubMed] [Google Scholar]
- Takeda M, Martinez R, Kudo T, Tanaka T, Okochi M, Tagami S, Morihara T, Hashimoto R, Cacabelos R. Apolipoprotein E and central nervous system disorders: reviews of clinical findings. Psychiatr Clin Neurosci. 2010;64:592–607. doi: 10.1111/j.1440-1819.2010.02148.x. [DOI] [PubMed] [Google Scholar]
- Tan HY, Callicott JH, Weinberger DR. Intermediate phenotypes in schizophrenia genetics redux: is it a no brainer? Mol Psychiatry. 2008;13:233–238. doi: 10.1038/sj.mp.4002145. [DOI] [PubMed] [Google Scholar]
- Tan W, Wang Y, Gold B, Chen J, Dean M, Harrison PJ, Weinberger DR, Law AJ. Molecular cloning of a brain-specific, developmentally regulated neuregulin 1 (NRG1) isoform and identification of a functional promoter variant associated with schizophrenia. J Biol Chem. 2007;282:24343–24351. doi: 10.1074/jbc.M702953200. [DOI] [PubMed] [Google Scholar]
- Taylor AE, Guthrie PAI, Smith GD, Golding J, Sattar N, Hingorani AD, Deanfield JE, Day INM. IQ, educational attainment, memory and plasma lipids: associations with apolipoprotein E genotype in 5995 children. Biol Psychiatry. 2011;70:152–158. doi: 10.1016/j.biopsych.2010.10.033. [DOI] [PMC free article] [PubMed] [Google Scholar]
- Taylor WD, Zuchner S, Payne ME, Messer DF, Doty TJ, MacFall JR, Beyer JL, Krishnan KRR. The COMT Val 158Met polymorphism and temporal lobe morphometry in healthy adults. Psychiat Res-Neuroim. 2007;155:173–177. doi: 10.1016/j.pscychresns.2007.01.005. [DOI] [PMC free article] [PubMed] [Google Scholar]
- Tosato S, Bellani M, Bonetto C, Ruggeri M, Perlini C, Lasalvia A, Marinelli V, Rambaldelli G, Cristofalo D, Bertani M, et al. Is neuregulin1 involved in determining cerebral volumes in schizophrenia? Preliminary results showing a decrease in superior temporal gyrus volume. Neuropsychobiology. 2012;65:119–125. doi: 10.1159/000330584. [DOI] [PubMed] [Google Scholar]
- Tzourio-Mazoyer N, Landeau B, Papathanassiou D, Crivello F, Etard O, Delcroix N, Mazoyer B, Joliot M. Automated anatomical labeling of activations in SPM using a macroscopic anatomical parcellation of the MNI MRI single-subject brain. Neuroimage. 2002;15:273–289. doi: 10.1006/nimg.2001.0978. [DOI] [PubMed] [Google Scholar]
- Vance JE, Hayashi H. Formation and function of apolipoprotein E-containing lipoproteins in the nervous system. Bba-Mol Cell Biol L. 2010;1801:806–818. doi: 10.1016/j.bbalip.2010.02.007. [DOI] [PubMed] [Google Scholar]
- Verhagen M, van der Meij A, van Deurzen PA, Janzing JG, Arias-Vasquez A, Buitelaar JK, Franke B. Meta-analysis of the BDNF Val66Met polymorphism in major depressive disorder: effects of gender and ethnicity. Mol Psychiatry. 2010;15:260–271. doi: 10.1038/mp.2008.109. [DOI] [PubMed] [Google Scholar]
- Wang DD, Kriegstein AR. Defining the role of GABA in cortical development. J Physiol Lond. 2009;587:1873–1879. doi: 10.1113/jphysiol.2008.167635. [DOI] [PMC free article] [PubMed] [Google Scholar]
- Wang F, Jiang T, Sun Z, Teng SL, Luo X, Zhu Z, Zang Y, Zhang H, Yue W, Qu M, et al. Neuregulin 1 genetic variation and anterior cingulum integrity in patients with schizophrenia and healthy controls. J Psychiatry Neurosci. 2009;34:181–186. [PMC free article] [PubMed] [Google Scholar]
- Weickert CS, Webster MJ, Gondipalli P, Rothmond D, Fatula RJ, Herman MM, Kleinman JE, Akil M. Postnatal alterations in dopaminergic markers in the human prefrontal cortex. Neuroscience. 2007;144:1109–1119. doi: 10.1016/j.neuroscience.2006.10.009. [DOI] [PubMed] [Google Scholar]
- Westberg L, Eriksson E. Sex steroid-related candidate genes in psychiatric disorders. J Psychiatry Neurosci. 2008;33:319–330. [PMC free article] [PubMed] [Google Scholar]
- Williams HJ, Owen MJ, O'Donovan MC. Is COMT a susceptibility gene for schizophrenia? Schizophr Bull. 2007;33:635–641. doi: 10.1093/schbul/sbm019. [DOI] [PMC free article] [PubMed] [Google Scholar]
- Winterer G, Konrad A, Vucurevic G, Musso F, Stoeter P, Dahmen N. Association of 5′ end neuregulin-1 (NRG1) gene variation with subcortical medial frontal microstructure in humans. Neuroimage. 2008;40:712–718. doi: 10.1016/j.neuroimage.2007.12.041. [DOI] [PubMed] [Google Scholar]
- Wolff JJ, Gu H, Gerig G, Elison JT, Styner M, Gouttard S, Botteron KN, Dager SR, Dawson G, Estes AM, et al. Differences in white matter fiber tract development present from 6 to 24 months in infants with autism. Am J Psychiatry. 2012;169:589–600. doi: 10.1176/appi.ajp.2011.11091447. [DOI] [PMC free article] [PubMed] [Google Scholar]
- Worsley KJ, Andermann M, Koulis T, MacDonald D, Evans AC. Detecting changes in nonisotropic images. Hum Brain Mapp. 1999;8:98–101. doi: 10.1002/(SICI)1097-0193(1999)8:2/3<98::AID-HBM5>3.0.CO;2-F. [DOI] [PMC free article] [PubMed] [Google Scholar]
- Worsley K, Marrett S, Neelin P, Vandal AC, Friston K, Evans AC. A unified statistical approach for determining significant voxels in images of cerebral activation. Hum Brain Mapp. 1996;4:58–73. doi: 10.1002/(SICI)1097-0193(1996)4:1<58::AID-HBM4>3.0.CO;2-O. [DOI] [PubMed] [Google Scholar]
- Wright RO, Hu H, Silverman EK, Tsaih SW, Schwartz J, Bellinger D, Palazuelos E, Weiss ST, Hernandez-Avila M. Apolipoprotein E genotype predicts 24-month Bayley scales infant development score. Pediatr Res. 2003;54:819–825. doi: 10.1203/01.PDR.0000090927.53818.DE. [DOI] [PubMed] [Google Scholar]
- Yavich L, Forsberg MM, Karayiorgou M, Gogos JA, Mannisto PT. Site-specific role of catechol-O-methyltransferase in dopamine overflow within prefrontal cortex and dorsal striatum. J Neurosci. 2007;27:10196–10209. doi: 10.1523/JNEUROSCI.0665-07.2007. [DOI] [PMC free article] [PubMed] [Google Scholar]
- Yu K, Cheung C, Leung M, Li Q, Chua S, McAlonan G. Are bipolar disorder and schizophrenia neuroanatomically distinct? An anatomical likelihood meta-analysis. Front Hum Neurosci. 2010;4:189. doi: 10.3389/fnhum.2010.00189. [DOI] [PMC free article] [PubMed] [Google Scholar]
- Yushkevich PA, Piven J, Hazlett HC, Smith RG, Ho S, Gee JC, Gerig G. User-guided 3D active contour segmentation of anatomical structures: significantly improved efficiency and reliability. Neuroimage. 2006;31:1116–1128. doi: 10.1016/j.neuroimage.2006.01.015. [DOI] [PubMed] [Google Scholar]
- Zhu HT, Li Y, Ibrahim JG, Lin W, Shen DG. MARM: multiscale adaptive regression for neuroimaging data. Inf Process Med Imaging. 2009;21:314–325. doi: 10.1007/978-3-642-02498-6_26. [DOI] [PMC free article] [PubMed] [Google Scholar]
Associated Data
This section collects any data citations, data availability statements, or supplementary materials included in this article.