Abstract
Ordered deposition of elongated DNA molecules was achieved by the forced dewetting of a DNA solution droplet over a microstructured substrate. This technique allows trapping, uncoiling, and deposition of DNA fragments without the need of a physicochemical anchoring of the molecule and results in the combing of double stranded DNA from the edge of microwells on a polydimethylsiloxane (PDMS) substrate. The technique involves scanning a droplet of DNA solution caught between a movable blade and a PDMS substrate containing an array of microwells. The deposition and elongation appears when the receding meniscus dewets microwells, the latter acting here as a perturbation in the dewetting line forcing the water film to break locally. Thus, DNA molecules can be deposited in an ordered manner and elongated conformation based solely on a physical phenomenon, allowing uncoiled DNA molecules to be observed in all their length. However, the exact mechanism that governs the deposition of DNA strands is not well understood. This paper is an analysis of the physical phenomenon occurring in the deposition process and is based on observations made with the use of high frame/second rate video microscopy.
INTRODUCTION
Long double stranded DNA (dsDNA) molecules in solution adopt a compact random-coil conformation imposed by their short persistence length, typically in the order of 50 nm, which prohibits the observation of fluorescence markers along all of the DNA length. Uncoiling and immobilization of dsDNA become mandatory for observing the molecule. This can be made by translocating dsDNA into nanochannels1, 2 having dimensions in the range of the persistence length, or by depositing the molecule onto a solid substrate by using capillary force deposition techniques.
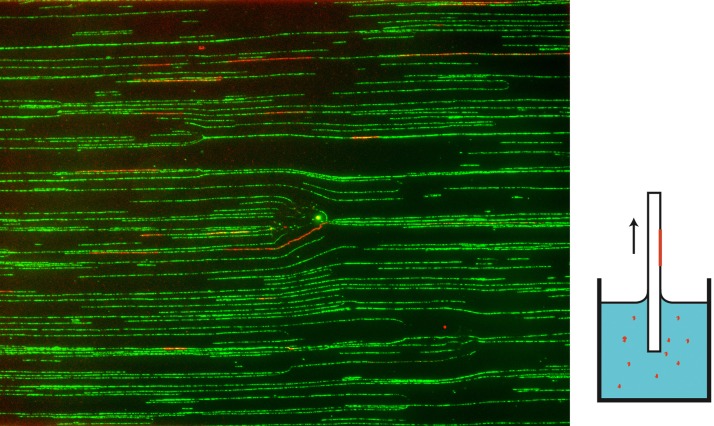
Molecular combing3, 4, 5 is a method used to uncoil and deposit DNA strands on substrates in order to visualize them in an elongated conformation. This technique allows observing events occurring along DNA fragment, such as the number and position of DNA replication sites with ad hoc fluorescent markers. The standard technique for DNA combing uses the dewetting of a silanized glass from an aqueous solution of DNA. The latter is made at pH5.4, which allows the ends of dsDNA to bind specifically to vinyl groups (-CH=CH2) of the silanized glass. This physicochemical binding6, 7, 8 is strong enough to maintain one DNA end anchored to the substrate while the molecule is uncoiled by the capillary force produced by the receding meniscus. The DNA backbone, being negatively charged, will then adsorb on the surface. This results in stretched DNA molecules being deposited in a random position over the surface and combed in the direction of dewetting,9 as seen in Figure 1.
Figure 1.
Fluorescence image of combed human genomic DNA. Green, YOYO-1; red, EdU pulse, 237 × 177 μm (473 × 354 kb).
The drawbacks of this method are the randomness of molecule deposition at the glass surface, the co-deposition of several molecules at the same place, or the U-shaped deposition that occurs when both DNA molecule ends are simultaneously anchored at different positions.
More recently, a method was developed for DNA10, 11, 12, 13 or chromatin14 combing, which uses the capillary force assembly that occurs when a DNA solution is dewetted from a microstructured substrate. The technique discussed in this paper, involves the scanning of a dsDNA solution over a hydrophobic polydimethylsiloxane (PDMS) substrate. This substrate can be made by an array of microwells or micropillars.15 A glass blade attached to a linear motor drives a liquid droplet caught between it and the substrate. A receding meniscus appears and drives the dewetting line along the substrate. Microwells, regularly spaced in the PDMS substrate create perturbation in the dewetting process and induce the trapping and uncoiling of DNA strands on the edges of microwells. This technique allows the ordered deposition of elongated DNA molecules, combed parallel to the dewetting direction and by a process that involves only a physical phenomenon, e.g., with no physicochemical anchoring of the molecules. The exact process that leads to the trapping and uncoiling of the molecule is not yet clearly understood and will be discussed in the paper.
Capillary force assembly is one of several techniques that were developed for self-assembly of nanoobjects.16 It has been successfully used for the assembly of nanoparticles17, 18, 19 or carbon nanotubes,21 as well as cells20 or vesicles22 within arrays of microwells.23 These techniques often use micro- or nanostructured substrates that perturb the dewetting process. The benefit of micropatterned substrate has been demonstrated24 for filling liquid into an array of microwells in PDMS.
Beside the use of dewetting line perturbation, several techniques employ guiding rails throughout the dewetting in conjunction with capillary uncoiling for the combing of DNA.26 The technique involves a pattern of small dimension parallel lines having different surface properties. One of these surfaces allows physicochemical anchoring of DNA pellets. The dewetting of DNA solution in the same direction as these lines impose the constrained deposition of DNA enclosed by these patterns. It has been done using silanization made in conjunction with photoresist lift off process25 or with an equivalent process involving Diamond Like Carbon layer acting like a passivation layer.27
Klein et al.28 uses a variation of the standard DNA combing technique, with polystyrene lines patterned on gold surface. These lines are used as selective sites of attachment for DNA ends. On the same principle, e.g., surface with patterns of different surface energies, Björk et al.29 use hydrophobic patterns obtained by PDMS stamping techniques to localize the placement of combed DNA.
Another technique to extend and deposit DNA fragment has been developed by Oshige et al.31 The technique uses the dragging of a moving droplet containing DNA in solution down a sloped glass moving above a fixed substrate. The fluid flow pattern produces an extension of the molecule that subsequently deposited and combed on the fixed substrate.
DNA capillary deposition can be made more simple by using either the translation of a droplet30 containing a solution of DNA or the evaporation32 of the latter that creates a naturally moving meniscus and radial patterns of elongated molecules. More recently, Payne et al.36 have shown the combing and deposition of long DNA molecules with the use of a micropipet and the capillary force for uncoiling molecules one at a time.
EXPERIMENT
We used the technique of capillary force deposition to build an array of elongated DNA molecules with the use of a microstructured substrate. A solution of λ phage dsDNA (48 kb) has been prepared at 5 ng·μl−1 in a 10 mM Tris-Cl pH7.5, 1 mM EDTA solution. YOYO-1, a fluorescent DNA intercalating dye was added to the solution in order to label the molecule for fluorescence imaging once adsorbed on the substrate. Finally 0.1% Triton X100 surfactant was included to lower the surface tension and increase the dewetting tail length.
A 30 μl droplet of this DNA solution was caught between the PDMS substrate and a glass blade with a controlled gap of 800 μm. The glass blade has a small inclination angle toward the dewetting line in order to maintain the droplet near the edge of the glass. The glass blade was then moved horizontally at a controlled speed ranging between 20 μm·s−1 and 1 mm·s−1. The motion of the droplet can be achieved either by moving the substrate with motorized stage or by moving the blade with a linear motor (Physik Instrument Nexact), which is the case in the present work. The substrate is a PDMS bloc containing an array of micro wells: 6 μm diameter, 5 μm deep, and regularly spaced with a pitch ranging from 20 to 200 μm, manufactured by replica molding of a SU8 photoresist pattern on a silicon wafer.
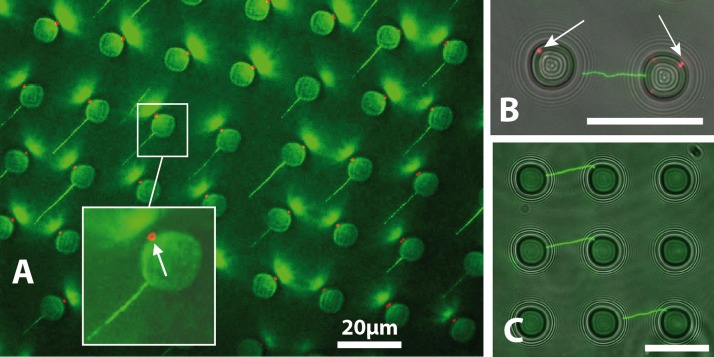
After moving the droplet over the entire surface (1cm2) of the PDMS substrate, a glass cover was placed on top of the PDMS bloc for direct observation with an epifluorescence microscope. Figure 2 shows composite images of fluorescence observation (DNA-YOYO 1 complex) and transmitted light. We can observe DNA molecules deposited on the edges of microwells, oriented toward the direction of dewetting and of length dispersed around 20 μm.
Figure 2.
Composite fluorescence imaging of capillary force DNA combing on a patterned PDMS substrate. In green, the Green Fluorescent Protein (GFP) fluorescence of YOYO tagged λ phage DNA, and in red, the DNA pellets trapped in the bottom of microwells (5 μm below the surface).
We found that, for a given concentration (5 ng·μl−1), initial contact angle (50°), and temperature (25 °C constant), the deposition starts to be efficient for a given dragging speed (200 μm·s−1 in our case). The efficiency of the deposition process has been found around 20% in total with local variations, e.g., zones with a high concentration of elongated DNA and zones with lower concentration. In a very few wells, we found bundles of molecules, deposited at the same location, most of the wells being the origin of the elongation of a unique molecule.
Figure 2 superposes fluorescence image of the stretched DNA on top of the PDMS (green) and a red image focused 5 μm below the surface, at the bottom of the micro wells. We can observe fluorescence dots (white arrow in left image) that are actually DNA pellets trapped in the microwells after the dewetting and that have been pushed down by capillary force happening with the evaporation of the liquid captured in the microwells. Surprisingly, the position of the pellet at the bottom of the wells, i.e., where the liquid evaporates last, is not randomly distributed all around the periphery of the disc but at certain preferred locations. This may be caused by the fact that the microwells are not perfectly circular.
DEPOSITION MECHANISM
Forced dewetting
Before investigating the deposition mechanism of DNA molecule by a perturbed dewetting line, let us consider the forced dewetting on a flat hydrophobic substrate. A liquid droplet with a given surface tension γSG is poured on a hydrophobic substrate. The droplet partially wets the substrate with a static contact angle θ between the liquid and the surface plane defined by the Young-Dupré law. The wetting angle is then defined by the surface tensions between solid, liquid, and air
This static contact angle is around 110° for pure water on PDMS and decreases down to 60° when the surface tension is decreased by the addition of surfactant, 0.1% Triton X100 non-ionic surfactant in our case. The droplet is then caught between a glass blade and the fixed substrate with a 800 μm gap, this distance is being kept constant with a mechanical setup. The glass blade is attached to a piezoelectric linear motor that moves parallel to the substrate plane. The liquid is then dragged by the movement of the blade, as depicted in Figure 3. The capillary length is defined by the following relation:
where ρ is the density of the liquid, and g the earth acceleration. This length is about 1.7 mm in our case and is larger than the gap between the substrate and the driving blade.
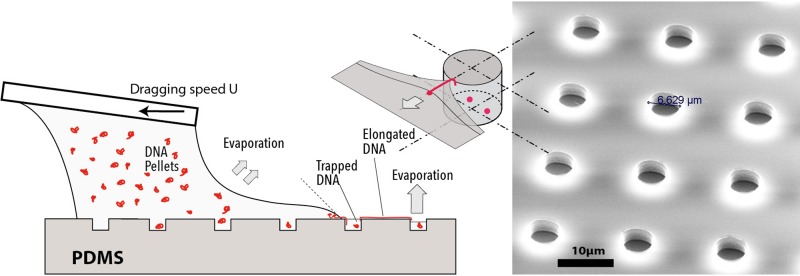
Figure 3.
Schematic representation of capillary force deposition of DNA on microstructured substrate and SEM image of the PDMS substrate showing an array of microwells with a pitch of 20 μm.
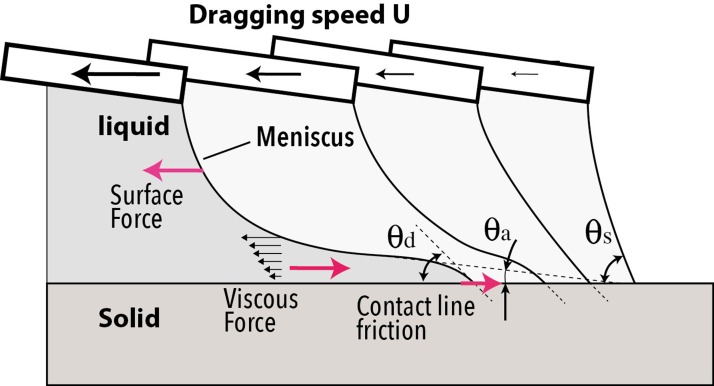
When the droplet is moved at a speed U, a dynamic equilibrium settles, resulting from the competition between forces acting on the liquid. The surface between the liquid and the air will be deformed and a meniscus will appear. This happens both on the side of the wetting front and on the side of the dewetting front where curvature of the surface is reversed compared to the static position. On the dewetting side, the air/liquid surface increases, the apparent contact angle decreases and the liquid body forms a tail ending on a thin liquid film (Figure 4c). The real contact angle that appears at the contact line is called the microscopic contact angle (θd in Figure 5) and is different from the apparent contact angle. Its value regarding the static contact angle θs is still under investigation.33
Figure 4.

Static contact angle of (a) colored DI water on PDMS, (b) 0.1% Triton X100 surfactant added to colored DI water, and (c) dynamic contact angle of a droplet dragged by a glass blade at a speed of 100 μm·s−1 over a PDMS bloc. We can notice the long tail of the receding meniscus and a small apparent dewetting contact angle.
Figure 5.
Side view schematic of the principle of the evolution of the receding meniscus as function of dragging speed.
In order to have an idea of the thickness of the liquid film, we can consider the Landau–Levich–Derjaguin (LLD)33, 37 model. This model has been built in the case of a hydrophilic solid, e.g., when the liquid completely wets the solid. The model is valid for a solid being pulled out vertically of a liquid (dip coating) leaving a uniform layer of liquid. The thickness h of the liquid film is given by where the capillary number , η the viscosity, U the dragging speed (400 μm·s−1), and γ the surface tension (30 · 10−3N·m−1). This liquid film thickness of 0.88 μm can be considered as an estimate of what it can be in our configuration since the model is valid for fully wetting liquids, which is not the case here. It is however in the order of magnitude of what has been observed. This model differs from our case in the fact that we use a partially wetting fluid (hydrophobic substrate) and that in our case the driving force is not the gravity but a sliding glass blade positioned at a distance lower than the meniscus length.
In the dynamic equilibrium, viscous forces in the liquid body will counterbalance the driving force transmitted though the air/liquid interface. With the thin liquid film, there is a high velocity change between the liquid/solid surface and the liquid/air surface on a very short distance. The shear stress is high so as the resulting hydrodynamic resistance. In the frame of the Couette model, e.g., no slip at the interface and neglecting inertial terms, the velocity profile in the fluid is linear, and the viscous force is
Finally, the third source of energy dissipation in the dewetting problem is located at the dewetting line and is call the contact line friction.35 It is dependent on the work of adhesion between the liquid and the solid.
Regime transition
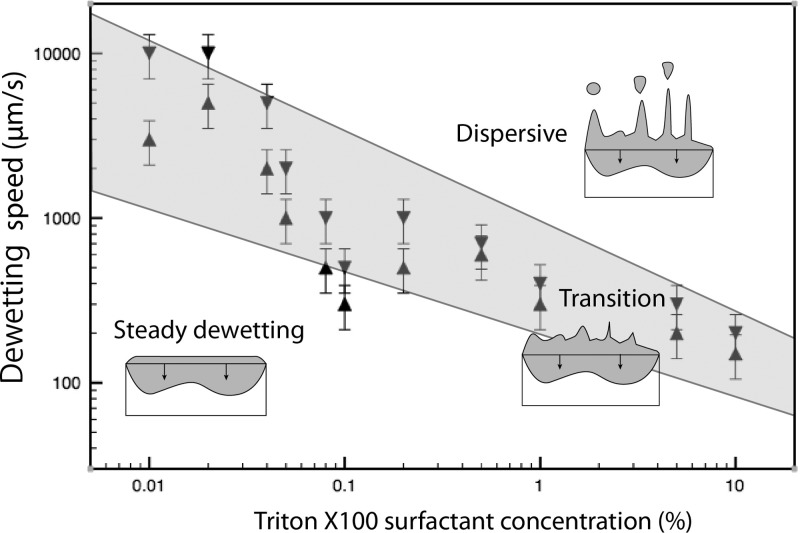
When a liquid is slowly dragged and dewets a solid, an equilibrium settles that leads to a deformed droplet shape with a steady dewetting line. When the driving speed increases up to a criterion speed, the dewetting front becomes serrated in order to maintain the dewetting angle to its criterion value. This effect is the cause of sharp tails appearing on droplets when they are force to creep on a surface (droplets on a car window for example). When the speed increases again, the contact line friction that is proportional to the square of the speed becomes too large and surface forces connot compete with it. The result is a transition33, 34, 38 from a steady dewetting regime to a dispersive regime where liquid rivulets are entrained from trailing vertices which break into droplets due to Raleigh–Taylor instabilities.39 This transition, and the criterion speed that defines it, is function of the balance between surface forces and contact line friction forces. It is then dependent on the surface tension and on the presence of surfactants. Fig. 6 shows the transition between a steady dewetting and a dispersive regime. We can observe the shape of the dewetting line below the criterion speed (100 μm·s−1) and above (150 μm·s−1). When the dragging speed is above the criterion speed, we can observe rivulets and droplets generated by the receding meniscus. Any perturbation of the dewetting line, such as dusts or holes will be the place of droplet dispersion. These images have been taken with water on PDMS with a large quantity of surfactants (10%Triton X100) that decreases largely the surface tension.
Figure 6.

Different dewetting regimes of low surface tension liquid (10% Triton X100): Uniform, serrated and dispersive (creation of satellite droplets).
By observing the shape of the dewetting line in the course of dewetting it is then possible to evaluate the criterion speed for different concentration of surfactant as reported in Figure 7. The curve shows the type of dewetting regime classified as steady (linear contact line), in transition (serrated line, apparition of rivulets) and dispersive (generation of satellite droplets).
Figure 7.
Dewetting regime as function of dewetting speed and surfactant concentration.
By using a small amount of surfactants around 0.01%, it is possible to maintain a steady dewetting for speed up to 800 μm·s−1 whereas large concentration of surfactant leads to a transition appearing for speed around 150 μm·s−1 as shown in Figure 6.
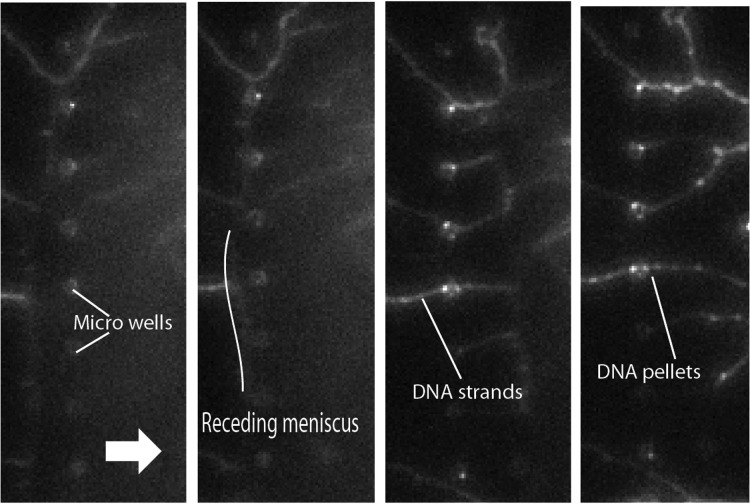
DNA capillary force assembly made with dragging speed above the transition speed produces dendritic shape patterns made of DNA bundles. This dispersive deposition process is even enhanced if the temperature is increased. The evaporation rate in this case, plays also a role in the deposition as can be seen in the Figure 8 that shows a sequence of pictures extracted from a video capture made with a fluorescence inverted microscope during the capillary deposition. The dendritic DNA deposition pattern shown in the picture is not satisfactory since several molecules are deposited at the same place forming bundles of DNA.
Figure 8.
Partial screenshot of fluorescence (GFP) video capture of the deposition of DNA strands on a microstructured substrate with a dispersive regime.
Trapping and uncoiling
In the goal of producing an ordered deposition pattern, the liquid is then forced to dewet over an array of micron-sized wells that will locally perturb the dewetting line and force the liquid to break. In our configuration, we have a liquid movement driven by the air/liquid surface and a fluid flow distribution that is governed by the Couette model, e.g., with a linear distribution of the velocity from null at the solid surface (non slip condition) to the dragging speed at the liquid air interface.
In the case of the steady dewetting, e.g., below the transition speed, the dewetting line is non-distorted when it reaches a microwell row. It can be seen in Figure 9a taken with a high–speed camera (1000 fps) that shows the evolution of the dewetting line when it passes over microwells at different time (40 ms between first and last frame). The images showed that the pinching, e.g., the place of the liquid breaking, appears always near the edge of wells with no formation of liquid channel or satellite droplets. We can see that the dewetting line breaks just after leaving the microwells. This has to be compared with fluid flow simulations made by Lin et al.40 that present a more deformed shape. However, their deposition condition being different since they use larger dragging speed and no surfactant.
Figure 9.
(a) Partial screenshot of 1000 fps microscope video capture of the movement of the dewetting line at the surface of patterned PDMS, the liquid is drained at 300 μm·s−1, 40 ms between first and last frame. (b) Dewetting of a solution of diamond nanoparticles (250 nm mean diameter) for observation of fluid flow.
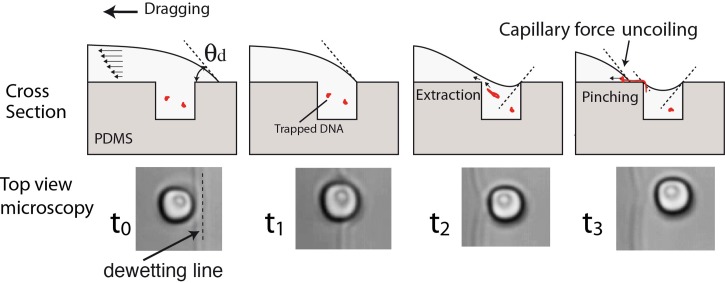
The exact mechanism that leads to the trapping and uncoiling of a molecule on the edge of a microwell is not demonstrated yet. This mechanism, first described by Guan and Lee,10 is summarized in Figure 10. When the dewetting line reaches the edge of one microwell (t1), the contact angle will follow the curvature of the edge and impose an additional movement of liquid that will tend to drain the well (t2). A DNA pellet, located in the well at this moment will then be extracted from the well, pre elongated by the shear stress and finally pinched near the edge of the well. The breaking of the liquid (t3) leaves one part of the liquid in the well, the other part being drawn by the surface force. One side of the DNA molecule is then attached to the edge of the well, the other being uncoiled and stretched by the capillary force. In addition, some DNA pellets can be left captured in microwells, as can be seen in Figure 2. The molecule is then deposited at the surface of the PDMS, one part of it standing vertically on the edge of the microwell. This explanation imposes that a DNA molecule is present at the exact location of the liquid break for being captured and uncoiled by the capillary force. With high concentration DNA solutions, several molecules are trapped together forming bundles on every microwells. If DNA concentration is lower (5 ng·μl−1 in our case), it is possible to capture single molecules but with a lower percentage of molecules being elongated. This is, for example, in our case around 20% of microwells showing a molecule deposited on their edge.
Figure 10.
Sequence of liquid dewetting on a microwell, cross sectional schematic representation of the liquid solid interface, and high speed videomicroscopy of the dewetting front taken from below.
Evaporation plays an important role in capillary force assembly. In systems where the movement is slow, the evaporation rate near the triple line creates a retrograde flow that populates the dewetting line with particles,41 the latter being pushed by the capillary force and force to assemble. In our case, the device is set at ambient temperature, so that fluidic movement due to evaporation is slow compared with the driving speed. By adding diamond nanoparticles with a concentration equivalent to that of DNA solution, we were able to observe by fast videomicroscopy the movement of these particles in the thin film liquid during the dewetting (Figure 9b). Particles have different velocities depending on their position regarding the surface. Particles near the substrate move slowly whereas particles neat the air/liquid interface are entrained at the dewetting speed, the velocity distribution being linear as in a Couette model. It appears also that no retrograde flow occurs in the process as it happens when evaporation, convection, and diffusion are the source of particle movement.41 In the latter case, the dewetting line is populated with particles that are fed by fluid flows driven by convection and evaporation. This retrograde movement, e.g., particle moving in the direction of the dewetting line has been observed with A DNA solution caught between glass blades without any movement other than convection and evaporation.
We also found that the number of particles decreases near the dewetting line. This is due to the thinning of the liquid film near the dewetting line. In addition, no accumulation of particles were found at the region near the triple line, this fact lead us to think that in the case of low DNA concentration, only molecules trapped in the microwell, in the region of slow fluid motion, are actually extracted, captured, and deposited. Some additional observation in fluorescence during the dewetting should show the real movement of molecules during the capillary assembly.
CONCLUSIONS
This paper has shown an analysis of the phenomenon occurring during the capillary force assembly of 48 kb long DNA molecules onto a microstructured PDMS substrate. This method allows the ordered deposition of unique DNA molecules without any physicochemical anchoring of the molecule. We show that the deposition mechanism is efficient for a droplet dragging speed below the transition speed and with a lowering of the surface tension that allows a thin film tail to extend with a thin liquid film with high shear stress. The exact fluid movement inside the microwell during the dewetting needs to be analyzed more in detail. In particular, some questions still remain in this process: Are the molecules involved are trapped in the wells or in the thin film liquid. and what is their conformation prior to the capture, are they already elongated by the shear forces occurring in the region of liquid pinching or are they in pellets. The extension of this work will be the deposition of longer DNA molecules, with the additional constraint of combing unique molecules.
References
- Westerlund F., Persson F., Kristensen A., and Tegenfelt J. O., Lab Chip 10, 2049 (2010). 10.1039/c004878j [DOI] [PubMed] [Google Scholar]
- Petit C. A. P. and Carbeck J. D., Nano Lett. 3, 1141 (2003). 10.1021/nl034341x [DOI] [Google Scholar]
- Marheineke K., Goldar A., Krude T., and Hyrien O., Methods Mol. Biol. 521, 575 (2009). 10.1007/978-1-60327-815-7_33 [DOI] [PubMed] [Google Scholar]
- Schwob E., de Renty C., Coulon V., Gostan T., Boyer C., Camet-Gabut L., and Amato C., Methods Mol. Biol. 521, 673 (2009). 10.1007/978-1-60327-815-7_36 [DOI] [PubMed] [Google Scholar]
- Czajkowsky D. M., Liu J., Hamlin J. C., and Shao Z., J. Mol. Biol. 375, 12 (2008). 10.1016/j.jmb.2007.10.046 [DOI] [PMC free article] [PubMed] [Google Scholar]
- Allemand J. F., Bensimon D., Jullien L., Bensimon A., and Croquette V., Biophys. J. 73(4), 2064 (1997). 10.1016/S0006-3495(97)78236-5 [DOI] [PMC free article] [PubMed] [Google Scholar]
- Bensimon A., Simon A., Chiffaudel A., Croquette V., Heslot F., and Bensimon D., Science 265, 2096 (1994). 10.1126/science.7522347 [DOI] [PubMed] [Google Scholar]
- Michalet X., Ekong R., Fougerousse F., Rousseaux F. S., Schurra C., Hornigold N., van Slegtenhorst M., Wolfe J., Povey S., Beckmann J. S., and Bensimon A., Science 277, 1518 (1997). 10.1126/science.277.5331.1518 [DOI] [PubMed] [Google Scholar]
- Benke A., Mertig M., and Pompe W., Nanotechnology 22, 035304 (2011). 10.1088/0957-4484/22/3/035304 [DOI] [PubMed] [Google Scholar]
- Guan J. and Lee L. J., Proc. Natl. Acad. Sci. U. S. A. 102, 18321 (2005). 10.1073/pnas.0506902102 [DOI] [PMC free article] [PubMed] [Google Scholar]
- Cerf A., Dollat X., Chalmeau J., Coutable A., and Vieu C., J. Mater. Res. 26, 336 (2011). 10.1557/jmr.2010.12 [DOI] [Google Scholar]
- Cerf A., Thibault C., Geneviève M., and Vieu C., Microelectron. Eng. 86, 1419 (2009). 10.1016/j.mee.2009.01.057 [DOI] [Google Scholar]
- Yasaki H.et al. , Proc. 17th International Conference on Miniaturized Systems for Chemistry and Life Sciences MicroTAS, 27–31 October 2013, Freiburg, Germany, 2013.
- Cerf A., Tian H. C., and Craighead H. G., ACS Nano 6(9), 7928 (2012). 10.1021/nn3023624 [DOI] [PMC free article] [PubMed] [Google Scholar]
- Lin C. H., Guan J. G., Chau S. W., Chen S. C., and Lee L. J., Biomicrofluidics 4, 034103 (2010). 10.1063/1.3474639 [DOI] [PMC free article] [PubMed] [Google Scholar]
- Khoo H. S., Lin C., Huang S. H., and Tseng F. G., Micromachines 2, 17 (2011). 10.3390/mi2010017 [DOI] [Google Scholar]
- Gentili D., Foschi G., Valle F., Cavallini M., and Biscarini F., Chem. Soc. Rev. 41, 4430 (2012). 10.1039/c2cs35040h [DOI] [PubMed] [Google Scholar]
- Malaquin L., Kraus T., Schmid H., Delamarche E., and Wolf H., Langmuir 23, 11513 (2007). 10.1021/la700852c [DOI] [PubMed] [Google Scholar]
- Velev O. D. and Gupta S., Adv. Mater. 21, 1897 (2009). 10.1002/adma.200801837 [DOI] [Google Scholar]
- Park M. C., Hur J. Y., Kwon K. W., Park S. H., and Suh K. Y., Lab Chip 6, 988 (2006). 10.1039/b602961b [DOI] [PubMed] [Google Scholar]
- Xiong X., Jaberansari L. L., Hahm M. G., Busnaina A., and Jung Y. J., Small 3(12), 2006 (2007). 10.1002/smll.200700292 [DOI] [PubMed] [Google Scholar]
- Broguière N., Rivera T. P., Pépin-Donat B., Nicolas A., and Peyrade D., Microelectron. Eng. 88, 1821 (2011). 10.1016/j.mee.2010.12.053 [DOI] [Google Scholar]
- Park M. C., Hur J. H., Cho H. S., Park S. H., and Suh K. Y., Lab Chip 11, 79 (2011). 10.1039/c0lc00114g [DOI] [PubMed] [Google Scholar]
- Jackman R. J., Duffy D. C., Ostuni E., Willmore N. D., and Whitesides G. M., Anal. Chem. 70, 2280 (1998). 10.1021/ac971295a [DOI] [PubMed] [Google Scholar]
- Kim H. J., Roh Y., and Hong B., IEEE Trans. Nanotechnol. 9(2), 254 (2010). 10.1109/TNANO.2009.2025130 [DOI] [Google Scholar]
- Kudo H., Suga K., and Fujihira M., Colloids Surf., A 313–314, 651 (2008). 10.1016/j.colsurfa.2007.04.126 [DOI] [Google Scholar]
- Kim H. J., Yun D. Y., Choi W. S., and Hong B., Diamond Relat. Mater. 18, 1015 (2009). 10.1016/j.diamond.2009.02.027 [DOI] [Google Scholar]
- Klein D. C. G., Gurevich L., Janssen J. W., Kouwenhoven L. P., and Carbeck J. D., Appl. Phys. Lett. 78, 2396 (2001). 10.1063/1.1365099 [DOI] [Google Scholar]
- Björk P., Holmström S., and Inganäs O., Small 2, 1068 (2006). 10.1002/smll.200600126 [DOI] [PubMed] [Google Scholar]
- Nazari Z. E. and Gurevich L., Beilstein J. Nanotechnol. 4, 72–76 (2013). 10.3762/bjnano.4.8 [DOI] [PMC free article] [PubMed] [Google Scholar]
- Oshige M., Yamaguchi K., Matsuura S., Kurita H., Mizuno A., and Katsura S., Anal. Biochem. 400, 145 (2010). 10.1016/j.ab.2010.01.021 [DOI] [PubMed] [Google Scholar]
- Liu Y. Y., Wang P. Y., Dou S. X., Zhang W. W., Wang X. J., and Sang H. Y., Chin. Sci. Bull. 56(12), 1234 (2011). 10.1007/s11434-011-4422-2 [DOI] [Google Scholar]
- Bertrand E., Blake T. D., and De Coninck J., Colloids Surf., A 369, 141 (2010). 10.1016/j.colsurfa.2010.08.006 [DOI] [Google Scholar]
- de Gennes P. G., Brochard-Wyart De. F., and Quere D., Capillarity and Wetting Phenomena: Drops, Bubbles, Pearls, Waves (Springer, 2004). [Google Scholar]
- Carlson A. et al. , EPL 97, 44004 (2012). 10.1209/0295-5075/97/44004 [DOI] [Google Scholar]
- Payne A. C. et al. , PLOS ONE 8, e69058 (2013). 10.1371/journal.pone.0069058 [DOI] [PMC free article] [PubMed] [Google Scholar]
- Landau L. and Levich B., Acta Physicochim. URSS 17, 42 (1942). [Google Scholar]
- Vasilchina H., Tzonova I., and Petrov J. G., Colloids Surf., A 250, 317 (2004). 10.1016/j.colsurfa.2004.03.037 [DOI] [Google Scholar]
- Mulji N. and Chandra S., J. Colloid Interface Sci. 352, 194 (2010). 10.1016/j.jcis.2010.08.020 [DOI] [PubMed] [Google Scholar]
- Lin C. H., Guan J., Chau S. W., and Lee L. J., J. Phys. D: Appl. Phys. 42, 025303 (2009). 10.1088/0022-3727/42/2/025303 [DOI] [Google Scholar]
- Deegan R. D. et al. , Nature 389, 827–829 (1997). 10.1038/39827 [DOI] [Google Scholar]


