Abstract
Various single-cell retention structures (SCRSs) were reported for analysis of single cells within microfluidic devices. Undesirable flow behaviors within micro-environments not only influence single-cell manipulation and retention significantly but also lead to cell damage, biochemical heterogeneity among different individual cells (e.g., different cell signaling pathways induced by shear stress). However, the fundamentals in flow behaviors for single-cell manipulation and shear stress reduction, especially comparison of these behaviors in different microstructures, were not fully investigated in previous reports. Herein, flow distribution and induced shear stress in two different single-cell retention structures (SCRS I and SCRS II) were investigated in detail to study their effects on single-cell trapping using computational fluid dynamics (CFD) methods. The results were successfully verified by experimental results. Comparison between these two SCRS shows that the wasp-waisted configuration of SCRS II has a better performance in trapping and manipulating long cylinder-shaped cardiac myocytes and provides a safer “harbor” for fragile cells to prevent cell damage due to the shear stress induced from strong flows. The simulation results have not only explained flow phenomena observed in experiments but also predict new flow phenomena, providing guidelines for new chip design and optimization, and a better understanding of the cell micro-environment and fundamentals of microfluidic flows in single-cell manipulation and analysis.
INTRODUCTION
Microfluidics (or lab-on-a-chip) technologies offer new approaches for cell assays and have also been used for the study of cell biology.1, 2, 3, 4, 5 They have the capabilities of handling a volume of liquid as small as picoliters and obtaining ideal conditions for well-defined cell micro-environments by regulating different factors such as the flow rate and shear stress.6, 7 With these advantages, a number of different microfluidic devices have been developed for single-cell analysis, which has attracted great attention recently for studies of cellular heterogeneity.1, 2, 3, 4, 5, 6, 7, 8 Significant biochemical heterogeneity can exist among cells of the same type, which may arise via many mechanisms, including mutations, localized damage, chemical gradients, and flow behaviors.9 Shear stress of flows on cell surfaces can also affect cell culture and analysis, since cell pathways can be activated by high shear stress, leading to weird cell behaviors.10 Because cells can be easily affected by the surrounding environment,11 investigations of the flow mechanism are important to obtain a better understanding of cell biology in a controlled micro-environment.
Furthermore, a critical step in single-cell analysis is to separate and trap individual cell at a precise location within a shear-protective cell retention chamber (or other microstructures) using the microfluidics technology. Physical trapping structures (e.g., microwells trapping,12, 13, 14 patterns trapping,15 cup-shaped cell isolation arrays,16, 17, 18 microgroove trapping,19, 20 micrometer-size sieves trapping,21 small side channels trapping,22 and V-shaped cell retention structure23, 24, 25, 26, 27, 28) were commonly used to trap and manipulate cells for single-cell analysis, in conjunction with microfluidic flow. Microfluidic flow plays an important role in these processes of single-cell manipulation. Generally, the main focus of these researches was the success of cell trapping and other manipulations, but the fundamentals of the flow behaviors and flow shear stress around different microstructures were not fully explored.
Computational fluid dynamics (CFD) is particularly useful for the study of microfluidic flow behaviors, ranging from basic research to device design.29, 30, 31 The computation has many advantages, including robust device design and the ability to simulate complex and coupled physics rapidly and at low cost.32 Researchers have used the CFD simulation to study the hydrodynamic trapping mechanism and cell mechanical environments.16, 33, 34, 35, 36 For instance, Di Carlo et al.16 developed a microfluidic-based hydrodynamic single cell culture array and simulated the flow velocity and shear stress around their U-shaped hydrodynamic cell trapping structures using the finite element method (FEMLAB 3.0, Comsol, Inc.). They found that the average shear stress outside and inside the trapping structure are 6 × 10⁻²dyn·cm−2 and 2.5 × 10⁻³ dyn·cm−2, respectively. Both numbers are much below physiological shear stress of ∼10 dyn·cm−2 that vascular endothelial cells experience.37 Cells within the trapping structures are shielded from the higher shear stress in the main flow. Using ANSYS 2D Navier-Stokes solver, Yazdi and Ardekani33 numerically simulated the flow behaviors of a pure fluid around a horseshoe structure in a microchannel to better understand the underlying bacteria collection mechanism. Liu et al.34 used ANSYS FLUID software for CFD simulation to estimate the shear stress in microchannels with circular and triangular posts for circulating tumor cells (CTC) separation. Sun et al.35 investigated the mechanism of hydrodynamic separation of rare tumor cells in spiral channels by a numerical model. Among these studies, most work is focused on the study of flow behaviors around a batch of cells and particles, and the fundamental flow behaviors in a micro-environment around individual cells, especially comparison of different flow behaviors between two different physical single-cell retention structure (SCRS), need to be further explored and compared for better single-cell manipulation and analysis.
In the previous studies by Li et al.,24, 25, 26, 27, 28 two different chambers for single-cell trapping and analysis were developed and they found that the flow behaviors in the chambers have significant influence on single-cell trapping and analysis, but fundamentals of flow behaviors were not investigated. To improve reproducibility for better single-cell manipulation and analysis, herein, the effects of flow behaviors on single-cell trapping and shear stress distributions in the chambers of those two microfluidic chips are studied and compared using CFD simulation. The effects of the inlet Reynolds number (Re) on the flow streamline patterns, velocity distributions, and the shear stress distributions were thoroughly simulated and experimentally verified by some flow visualization experiments using micro-beads. From these, the experimental flow phenomena were explained and new flow phenomena were predicted.
MICROFLUIDIC CHIPS AND EXPERIMENT DESCRIPTION
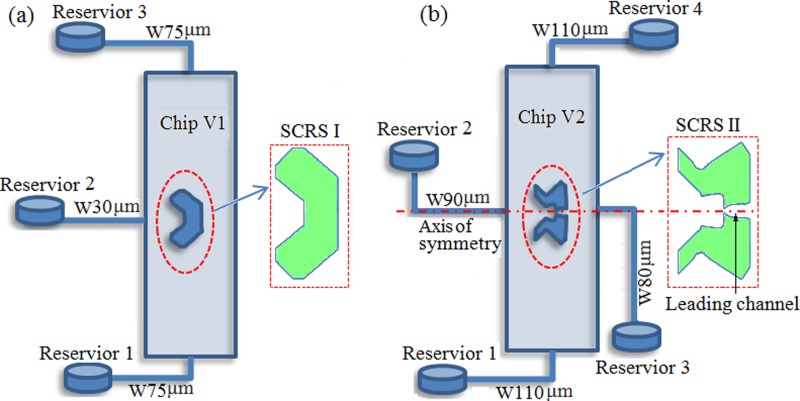
Microfluidic chips with two different SCRSs fabricated in the previous studies24, 25, 26, 27, 28 are shown in Fig. 1. The chip V1 has three inlet and outlet reservoirs, one single cell retention structure, SCRS I (94 μm in width) in a large chamber (1015 × 6015 μm, depth of 35 μm), as shown in Fig. 1a. The chip V2 with SCRS II is shown in Fig. 1b. The main difference of these two SCRSs is that there is a leading channel in the chip V2, which results in quite different flow behaviors. After an etching process for the chip V2, the large chamber dimension is 1023 × 6023 μm with depth about 43 μm, the internal width of SCRS II is about 143 μm, and the width of the leading channel is ∼80 μm with a small gap (∼18 μm in width).
Figure 1.
Schematic of microfluidic chips with (a) SCRS I in chip V1 and (b) SCRS II in chip V2. The widths of different channels are shown by the figure legends starting with “W” (e.g., W75 μm).
Flow experiments were visualized using an inverted microscope (TE300, Nikon, Mississauga, ON, Canada) as previously described.28 Small particles (average diameter of 6 μm) were used as the tracer particles. The inlet flow rate was about 9.30 μl/min. The particle images were processed using a published particle tracking velocimetry (PTV) algorithm.38
COMPUTATIONAL MODELS
Mathematical formulation
The aim of this simulation is to investigate the flow behavior and shear stress distribution in microfluidic chips with two different microstructures for single-cell trapping and analysis. The flow field is divided into three regions, i.e., the inlet flow channel, the flow in cell retention structures which we care about the most, and the flow outside of SCRS. In these three flow regions, the equations that govern the steady-state flow of a two-dimensional incompressible fluid are the differential equations for mass and momentum conservation. These equations are given by39
| (1) |
| (2) |
| (3) |
where ρ, p, and υ are the density, pressure, and kinematic viscosity, respectively. Also, u and v are the velocity components in x- and y-directions.
The inlet Reynolds number is defined as39
| (4) |
where vin is the inlet velocity, d is the hydraulic diameter of the inlet channel, and μ is the dynamic viscosity of the fluid.
Numerical method and mesh
ANSYS FLUENT 14 (ANSYS, Inc.)40 was used to carry out the simulation in this study. FLUENT provides comprehensive modeling capabilities for a wide range of incompressible (or compressible), laminar (or turbulent) fluid flow problems. In this study, the flow in these two microfluidic chips is laminar (Re ≪ 2100), and the aqueous reagents are considered as incompressible liquids. Flows in these two microfluidic chips are assumed to be two dimensional (2D) to simplify modeling. The flow models with enlarged SCRSs are shown in Fig. 2. The meshes were created in FLUENT's mesh generator GAMBIT. Because the boundary conditions and geometry of the chip V2 are symmetric around the axis of symmetry, only a half of chip V2 above the symmetry axis was modeled (as shown in Figure 2b; see Figure 1b for full chip layout) to reduce the computation work without losing accuracy in computational results. The grids around and inside of the SCRSs were condensed to ensure more accurate simulation. The computational domain was discretized with quadrilateral element meshes. Mesh independence was tested by refining the mesh until the change in results was within 0.5%. The optimized meshes for chip V1 and chip V2 consisted of 38 430 cells and 31 580 cells, respectively.
Figure 2.
Meshes and details of chip V1 (a) and a half of chip V2 above the symmetry axis (b) using FLUENT 14.
The working fluid was assumed to be water (a homogeneous, incompressible, Newtonian fluid; ρ = 998.2 kg/m3, μ = 1.03 × 10⁻³ kg/m·s). For boundary conditions, no-slip boundary conditions were utilized. Inlet velocities (vin) ranging from 1 × 10⁻⁴ m/s to 1 m/s were simulated (Re, 8.957 × 10⁻³ ∼ 89.57). A segregated solver algorithm was used to solve the governing equations sequentially and the implicit scheme was used to linearize the equations. The segregated algorithm associated with the implicit linearization diagram offers a considerable advantage in less memory requirement and reduced computing time. All simulations were conducted by using an iterative, segregated solution method where the variables were solved sequentially and repeatedly until a converged solution was obtained. The Semi-Implicit Method for Pressure-Linked Equations (SIMPLE) scheme was used for pressure-velocity decoupling.41 The second order accurate scheme was selected to discretize the governing equations. Navier-Stokes simulation was carried out using the FLUENT software, and iterations were performed until the residual sums for the x-velocity, y-velocity, and z-velocity components became less than 1 × 10⁻⁵.
RESULTS AND DISCUSSION
Based on the aforementioned models, the streamlines, velocity distribution, and wall shear stress (τ) of both chips were studied in detail using CFD simulation. The simulation results of streamlines for chip V2 were compared with experimental data.
Simulation of microfluidic chip V1
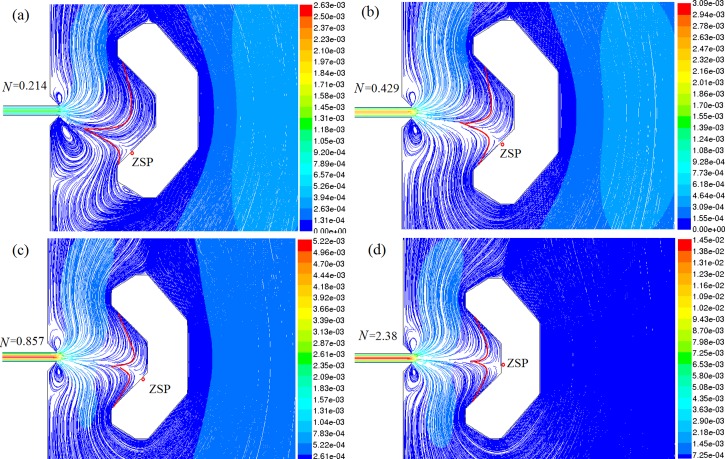
The procedure for single-cell selection and retention in chip V1 is described briefly. First, a desired cell is introduced from reservoir 1 to reservoir 3 and slowed down near the entrance of SCRS I. Second, another flow is introduced from reservoir 2 to push the cell into SCRS I. The simulated flow behaviors for the cell trapping process are shown in Fig. 3. A dimensionless parameter N is introduced as an index of the Re ratio between these two different flows
| (5) |
where Rereagent is the inlet Re of the reagent channel connected with reservoir 2 and Recell is the inlet Re of the cell introduction channel connected with reservoir 1. Figure 3 shows the influence of the change of N on the cell-trapping locations at the zero-speed points (ZSPs), which have been proved useful in the retention of single yeast cells.23 With the value of N increase from 0.214 to 2.38, the ZSP position moves upward, as shown in Fig. 3. When N increases to 2.38, the ZSP moves to around the center of the cell retention chamber along the back wall (shown in Fig. 3d). Thus, cells can be trapped at different positions along the chamber wall and the selected cell can be manipulated to different locations within the retention zones by changing flows from those channels as we reported previously.23 Generally, the flow control process for cell trapping is complicated and requires well-controlled operations. The CFD simulation results from Fig. 3 can provide valuable information to describe this complicated process.
Figure 3.
Relationship between N and ZSP (colored by velocity magnitude (m/s)) from CFD simulation.
The wall shear stress (τ) that cells suffer at different locations was also investigated. According to the Newton fluid friction law, τ is defined as39
| (6) |
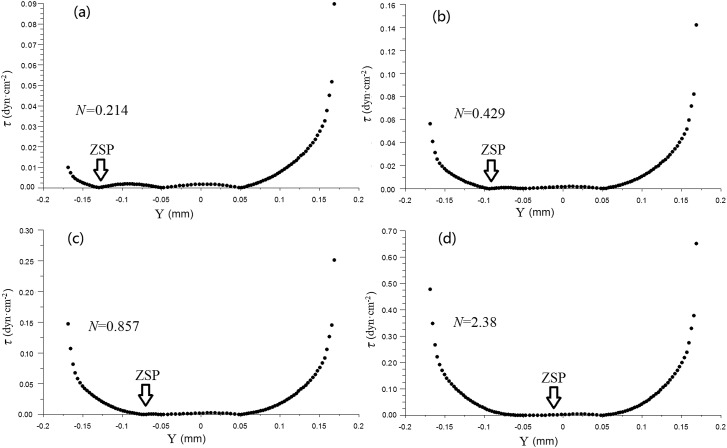
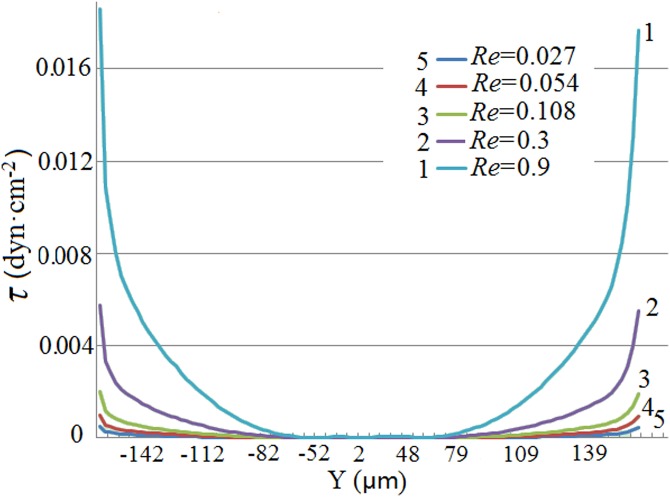
where μ is the dynamic viscosity of the fluid. The wall shear stress τ along the chamber wall changes with different Ns, as shown in Fig. 4. It is found that the wall shear stresses at ZSPs and along the flat back wall of SCRS I are lower than those in other locations. So that is why we could retain individual cells in those ZSPs, and the cells would not experience high shear stress. It was reported by Cooper and coworkers42 that high shear stress can cause intracellular calcium flux and thus it may lead to misleading results from drugs or other stimulus. Those ZSPs can provide a good harbor to protect the cells from severe shear stress without worrying about the false-positive results due to the effect of shear stress.
Figure 4.
Wall shear stress along the SCRS I wall with different Ns.
However, based on the simulation results, the ZSP are tiny locations, which are good for round-shaped cells like yeast cells. But it is challenging to trap long cylinder-shaped cells like cardiac myocytes, because it is difficult to get the center of cardiac myocytes to sit exactly within the ZSP. The consequence that the center of a cardiac myocyte does not remain stationary at the ZSP is that different parts of the cardiac myocyte will receive different shear stresses, which could lead to the difficult retention of a single cardiac myocyte in the SCRS or lead to cell deformation as observed in chip V1.24 That is why the second-generation microfluidic chip V2 was developed for individual cardiac myocyte study.28
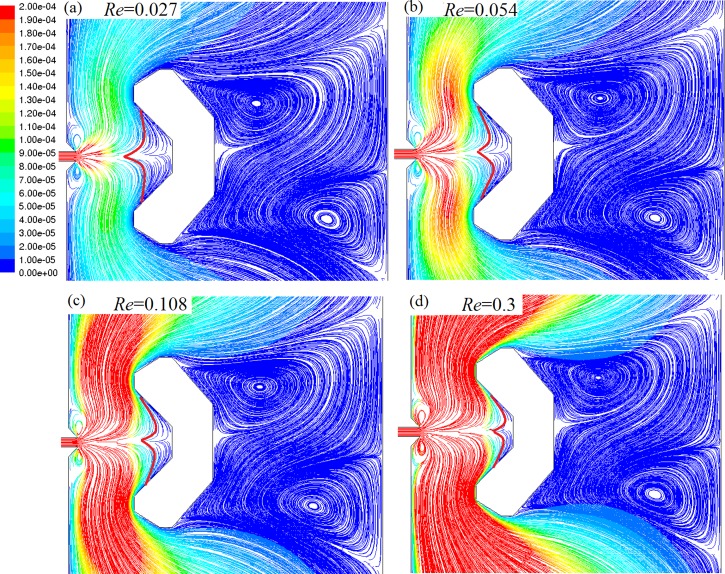
After cell trapping, reagents were introduced from reservoir 2 for drug testing. Therefore, the flow pattern and shear stress from the reagent flow induced from reservoir 2 were also studied, with results shown in Figs. 56, respectively. The cell retention area becomes smaller with the increase of Re. If a cell was not trapped at ZSPs near the SCRS wall, it would suffer a stronger unbalanced force and could be flushed away more easily. Two micro vortices appear behind the cell retention chamber and the reason is still unknown. It is also observed from Fig. 6 that the shear stress along the chamber wall becomes greater with the increase of Re. The average shear stress τ at the SCRS wall is 4.5 × 10⁻³ dyn·cm−2 (Re = 0.9), which is nearly ten folds of the chip V2 as discussed in a latter section.
Figure 5.
Streamline patterns at different inlet Reynolds numbers (Res) (colored by velocity magnitude (m/s)).
Figure 6.
Shear stresses along the SCRS I wall at different inlet Reynolds numbers.
In summary, the simulation and previously reported experimental results confirm that the tiny ZSPs are good for capturing small round cells,24, 26 but challenging for long cylinder-shaped cardiac myocytes, which would suffer a stronger unbalanced force and could be flushed away easily. Moreover, cells in SCRS I receive high flow shear stress. For these reasons, the second generation of the single cell chip (SCRS II) with a leading channel was fabricated for better cell trapping and protection.
Streamline patterns of microfluidic chip V2
Chip V2 differs from chip V1 mainly in the gap within a weir structure in the SCRS, as shown in Fig. 1. The introduction of the gap and a leading channel at the back of SCRS II resulted in a significant change to the pattern of liquid flow, leading to the success of cell capture and reduction of shear stress, as discussed in the subsequent simulation and experimental results.
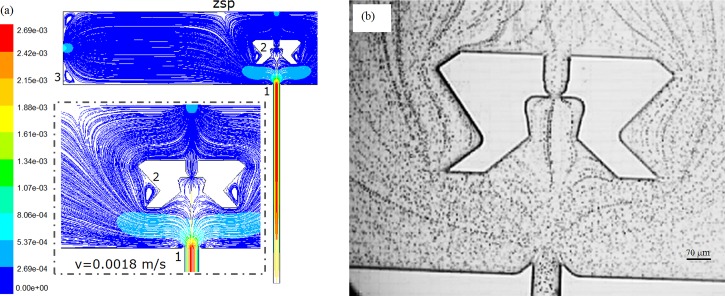
The numerical simulation result of streamline patterns (colored by velocity magnitude) is shown in Fig. 7a at the inlet Re of 0.1612. Due to the introduction of the leading channel, the inlet flow from reservoir 2 is split into three streams, one of which passes the SCRS and the leading channel. Both the simulation results and experimental results indicate that flow velocity in the leading channel is higher than that inside the SCRS II. According to the Bernoulli equation,39 it can be concluded that pressure in the leading channel is lower than that inside the SCRS II. Therefore, the pressure difference can help bring a cell passing the entrance of SCRS II into the cell retention structure. Once a cell enters SCRS, it slows down, as shown by the slow flow velocity in the subsequent flow speed simulation results. Given the large size of cardiomyocytes (∼120 μm in length for adult rabbit cardiomyocytes) and the corresponding gravitation, it was observed that cardiomyocytes were usually stopped before the weir structure−the flow mechanism of cell trapping using SCRS II. This flow pattern facilitates the single cell selection and capture and makes it easier for single cell capture than chip V1. Additionally, the physical weir structure can provide better cell retention than chip V1. We further confirmed the flow pattern using beads. Figure 7b shows the experimental result of streamline patterns (in steady laminar flow, the streamlines are the same as the pathlines) processed by using particle tracking method,38 with an inlet velocity (vin) of about 1.8 × 10⁻³ m/s (Re = 0.1612). The experimental results in Fig. 7b show similar streamline pattern as the simulation result, which confirms that the simulation results are consistent with the experimental results.
Figure 7.
Results of streamline patterns at Re = 0.1612. (a) Simulation result colored by velocity magnitude (m/s). The inset shows flow details around the chamber. (b) Experimental result processed by PTV algorithm.
Another difference between chips V2 and V1 is that we designed a fourth channel to a waste reservoir (reservoir 3) at the back of the cell retention structure. Because of the new channel, the flow in the large chamber also becomes different. More detailed flow behaviors were studied and the results are shown in Fig. 7a. Three pairs of micro vortices exist around the waist of SCRS and near four corners of the large chamber. Because of the low velocity and small size of the vortices, the vortices are not clearly observed in the experimental result. Furthermore, two ZSPs are observed at the back wall of the large chamber, though they are not utilized in our experiments.
Influence of Re on flow behaviors in microfluidic chip V2
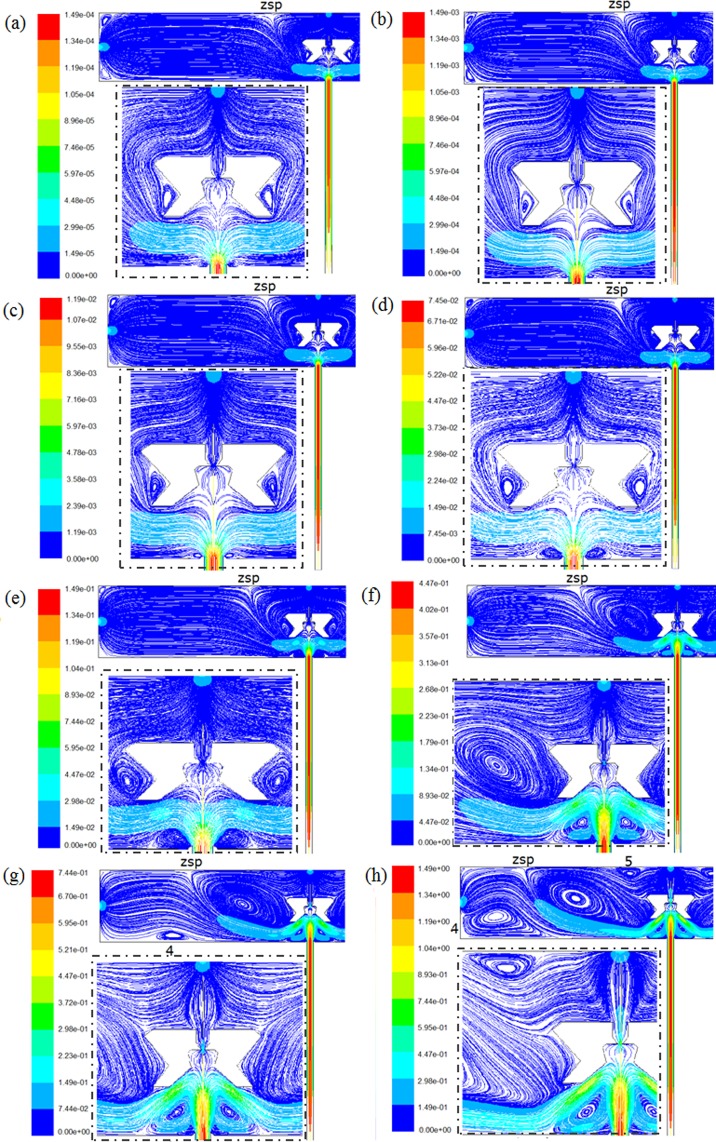
More detailed flow behaviors were investigated by simulating the influence of the change of inlet Re over a broad range (0.008957–89.57). New flow behaviors were predicted, as shown in Fig. 8. When Re is below 0.7166 (vin < 0.008 m/s), the micro vortices are small, as shown in Figs. 8a, 8b, 8c. With Re increasing (0.7166 < Re < 8.97, vin < 0.1 m/s), these vortices grow bigger, especially the vortices beside SCRS, as shown in Figs. 8d, 8e. When Re reaches 26.87 (vin = 0.3 m/s), the vortices beside SCRS become much bigger and make the ZSP move to the left, as shown in Fig. 8f. When Re becomes 44.785 (vin = 0.5 m/s) and 89.57 (vin = 1 m/s), respectively, the flow patterns in the chamber become more complicated (Figures 8g, 8h). Some larger vortices appear, and their positions have changed. The flow in larger areas of the chamber becomes non-laminar. However, the flow velocity in SCRS II is still very low and not much influenced by the change of Re, even at the highest Re of 89.57. The results prove that SCRS II can provide cardiac myocytes and other fragile cells a safe “harbor” protected from strong turbulence or “tsunami” due to high-velocity flows from the reagent inlet.
Figure 8.
Influence of Re on streamline patterns colored by velocity magnitude (m/s). (a) Re = 0.00897. (b) Re = 0.0897. (c)Re = 0.7166. (d) Re = 4.485 (e) Re = 8.97. (f) Re = 26.87. (g) Re = 44.785. (h) Re = 89.57. The insets show flow details around SCRS II.
Velocity and wall shear stress in SCRS II
In order to gain insight into the flow behavior details of the micro-environment in the SCRS around a retained single cell, the velocity vector field and detailed streamline patterns in the SCRS II were also simulated, as shown in Fig. 9. Because the interaction between contractible cardiac myocytes with microchannel surface is very complicated,12 to simplify the simulation, we assumed that the influence of cell motion on the fluid velocity profiles could be ignored and the fluid behaviors could be evaluated in a cell-free chamber.
Figure 9.
Simulated flow behaviors in the SCRS II at Re = 0.1612 colored by velocity magnitude (m/s). (a) Velocity vector field. (b) Streamline patterns.
In Fig. 9a, SCRS II can be divided into three regions according to the magnitude of the flow velocity. From regions 1 to 3, the flow velocity ranges from high to low. In region 3 where flow velocity is very slow, two micro recirculation flows exist in this region. This is why small bubbles could be trapped in this area, as observed in the previous experiments.28 It can also be predicted that small round single cell (or particle) could also be trapped in this region if this microfluidic chip is used for small round cell trapping. Figures 9a, 9b also show that average magnitude of the flow velocity in SCRS II (except the gap) is below 9 × 10⁻⁶ m/s, which is much lower than that of the outside of SCRS II (>3 × 10⁻⁵ m/s). According the Newton fluid friction law as given in Eq. 6,39 it can be concluded that the flow shear stress inside the SCRS II is much lower than that outside of the SCRS II, thus resulting in lower shear stress on the cell in SCRS II. This will prevent damage to fragile cells or disturbance to cell signaling from strong flows.
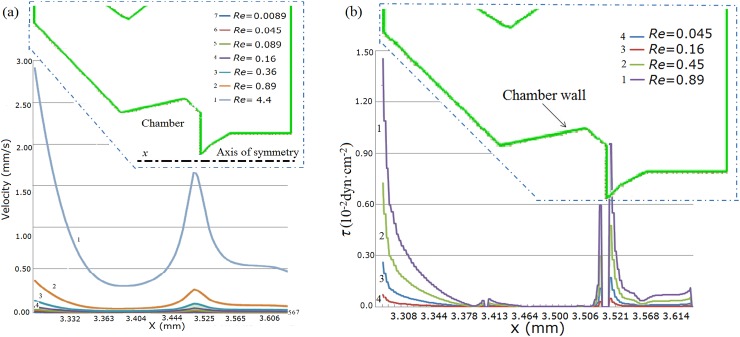
Moreover, the influences of inlet Re on flow velocity along the axis of symmetry (x-axis) (Fig. 10a, inset) was investigated. Similarly, it is found that the velocity in the chamber is much lower than the inlet velocity from Fig. 10a, even at Re = 4.4 (inlet velocity of 0.5 m/s). When a flow enters the SCRS chamber, the velocity becomes smaller and then increases lightly. The velocity near the gap achieves a peak value (about 1.65 × 10⁻³ m/s at Re = 4.4) in SCRS II due to the geometric change from a large SCRS chamber to a small gap.
Figure 10.
Influence of Re on (a) the flow velocity along the axis of symmetry (x) and (b) wall shear stress along the SCRS wall.
Flow-induced shear stress computed along the SCRS wall can be considered as an index of the shear stress applied to the cell surface when a cell is trapped in the SCRS. Wall shear stress within the SCRS II along the SCRS wall at different Res was computed and presented in Fig. 10b. As expected, even at high inlet flow velocity (Re = 0.89), the maximum wall shear stress τ in the chamber (3.400 mm < x < 3.510 mm) is 4.46 × 10⁻⁴ dyn·cm−2, which is far lower than that of foreside of the chamber (1.45 × 10⁻² dyn·cm−2 at x = 3.291 mm). As mentioned earlier that the average shear stress τ along the SCRS I wall is 4.5 × 10⁻³dyn·cm−2, the maximum wall shear stress τ (4.46 × 10⁻⁴dyn·cm−2) in the chamber of chip V2 is about 10 fold less than that of chip V1. Therefore, the low velocity and shear stress in the SCRS chamber further confirm the shear-protective micro-environment for cell investigation even at high inlet velocity.
CONCLUSIONS
This study provides a computational platform to investigate flow mechanism within two different SCRSs for single-cell trapping, manipulation, and shear stress protection in microfluidic chips. Comparison between two single-cell retention structures shows wasp-waisted configuration of SCRS II with a leading channel has better performance in trapping and manipulating long cylinder-shaped cardiac myocytes and provides a safer “harbor” for fragile cells for subsequent single-cell analysis. This microstructure can be adopted in future microfluidic chip design for single-cell cell trapping and analysis. The simulation results are not only able to help explain experimental flow phenomena but also predict new flow phenomena, providing a better understanding of cell micro-environment and fundamentals of microfluidic flows in single-cell manipulation and analysis. CFD simulations are believed to attract increasing attention to investigate optimal chip design, flow fundamentals, and applications of microfluidic lab-on-a-chip systems in the future.
ACKNOWLEDGMENTS
This work was supported by the National Institute of General Medical Sciences of the National Institutes of Health (NIH) under Award No. SC2GM105584, the Interdisciplinary Research (IDR level 2) and URI grant Program from the University of Texas at El Paso (UTEP), Multidisciplinary Research Pilot Grant from College of Science at UTEP, the STARS award from University of Texas (UT) System, Funding of Youth Teachers Internal Communication of Beijing University of Technology (No. 001000543111512), and the National Natural Science Foundation of China (Nos. 11002007 and 11072011).
References
- Karimi A., Yazdi S., and Ardekani A. M., Biomicrofluidics 7, 021501 (2013). 10.1063/1.4799787 [DOI] [PMC free article] [PubMed] [Google Scholar]
- Stone H. A., Stroock A. D., and Ajdari A., Annu. Rev. Fluid. Mech. 36, 381 (2004). 10.1146/annurev.fluid.36.050802.122124 [DOI] [Google Scholar]
- Whitesides G. M., Nature 442(7101), 368 (2006). 10.1038/nature05058 [DOI] [PubMed] [Google Scholar]
- Li X. J., Valadez A. V., Zuo P., and Nie Z., Bioanalysis 4, 1509 (2012). 10.4155/bio.12.133 [DOI] [PMC free article] [PubMed] [Google Scholar]
- Zuo P., Li X., Dominguez D. C., and Ye B. C., Lab Chip 13, 3921 (2013). 10.1039/c3lc50654a [DOI] [PMC free article] [PubMed] [Google Scholar]
- Salieb-Beugelaar G. B., Simone G., Arora A., Philippi A., and Manz A., Anal. Chem. 82, 4848 (2010). 10.1021/ac1009707 [DOI] [PubMed] [Google Scholar]
- Zare R. N. and Kim S., Annu. Rev. Biomed. Eng. 12, 187 (2010). 10.1146/annurev-bioeng-070909-105238 [DOI] [PubMed] [Google Scholar]
- Lindstrom S. and Andersson-Svahn H., Lab Chip 10, 3363 (2010). 10.1039/c0lc00150c [DOI] [PubMed] [Google Scholar]
- Brandman O., Ferrell J. E., Li R., and Meyer T., Science 310, 496 (2005). 10.1126/science.1113834 [DOI] [PMC free article] [PubMed] [Google Scholar]
- Li S., Huang N. F., and Hsu S., Cell. Biochem. 96, 1110 (2005). 10.1002/jcb.20614 [DOI] [PubMed] [Google Scholar]
- Roman G. T., Chen Y., Viberg P., Culbertson A. H., and Culbertson C. T., Anal. Bioanal. Chem. 387, 9 (2007). 10.1007/s00216-006-0670-4 [DOI] [PubMed] [Google Scholar]
- Cioffi M., Moretti M. et al. , Biomed. Microdevices 12, 619 (2010). 10.1007/s10544-010-9414-5 [DOI] [PMC free article] [PubMed] [Google Scholar]
- Luo C. X., Li H., Xiong C. Y. et al. , Biomed. Microdevices 9, 573 (2007). 10.1007/s10544-007-9066-2 [DOI] [PubMed] [Google Scholar]
- Lindström S., Hammond M., Brismar H., Andersson-Svahn H., and Ahmadian A., Lab Chip 9, 3465 (2009). 10.1039/b912596e [DOI] [PubMed] [Google Scholar]
- Chen C. S., Mrksich M., Huang S., Whitesides G. M., and Ingber D. E., Science 276, 1425 (1997). 10.1126/science.276.5317.1425 [DOI] [PubMed] [Google Scholar]
- Di Carlo D., Wu L. Y., and Lee L. P., Lab Chip 6, 1445 (2006). 10.1039/b605937f [DOI] [PubMed] [Google Scholar]
- Skelley A. M., Kirak O., Suh H., Jaenisch R., and Voldman J., Nat. Methods 6, 147 (2009). 10.1038/nmeth.1290 [DOI] [PMC free article] [PubMed] [Google Scholar]
- Khoury M., Bransky A., Korin N. et al. , Biomed. Microdevices 12, 1001 (2010). 10.1007/s10544-010-9454-x [DOI] [PubMed] [Google Scholar]
- Khabiry M., Chung B. G., Hancock M. J. et al. , Small 5(10), 1186 (2009). 10.1002/smll.200801644 [DOI] [PMC free article] [PubMed] [Google Scholar]
- Manbachi A., Shrivastava S., Cioffi M. et al. , Lab Chip 8, 747 (2008). 10.1039/b718212k [DOI] [PMC free article] [PubMed] [Google Scholar]
- Kim M., Isenberg B. C., Sutin J., Meller A., Wong J. Y., and Klapperich C. M., Lab Chip 11, 1089 (2011). 10.1039/c0lc00362j [DOI] [PubMed] [Google Scholar]
- Lee P. J., Hung P. J., Shaw R., Jan L., and Lee L. P., Appl. Phys. Lett. 86, 223902 (2005). 10.1063/1.1938253 [DOI] [Google Scholar]
- Peng X. Y. and Li P. C. H., Anal. Chem. 76, 5273 (2004). 10.1021/ac049384s [DOI] [PubMed] [Google Scholar]
- Li X. J. and Li P. C. H., Anal. Chem. 77, 4315 (2005). 10.1021/ac048240a [DOI] [PubMed] [Google Scholar]
- Li X. J., Ling V., and Li P. C. H., Anal. Chem. 80, 4095 (2008). 10.1021/ac800231k [DOI] [PubMed] [Google Scholar]
- Li X. J., Chen Y. C., and Li P. C. H., Lab Chip 11, 1378 (2011). 10.1039/c0lc00626b [DOI] [PubMed] [Google Scholar]
- Li X. J., Xue X., and Li P. C. H., Integr. Biol. 1, 90 (2009). 10.1039/b812987h [DOI] [PubMed] [Google Scholar]
- Li X. J., Huang J. B., Tibbits G. F., and Li P. C. H., Electrophoresis 28, 4723 (2007). 10.1002/elps.200700312 [DOI] [PubMed] [Google Scholar]
- Boy D. A., Gibou F., and Pennathur S., Lab Chip 8, 1424 (2008). 10.1039/b812596c [DOI] [PubMed] [Google Scholar]
- Hegab H. M., ElMekawy A., and Stakenborg T., Biomicrofluidics 7, 021502 (2013). 10.1063/1.4799966 [DOI] [PMC free article] [PubMed] [Google Scholar]
- Kim M.-C., Wang Z. H., Lam R. H. W., and Thorsen T., J. Appl. Phys. 103, 044701 (2008). 10.1063/1.2840059 [DOI] [Google Scholar]
- Green J. V., Kniazeva T., Abedi M. et al. , Lab Chip 9, 677 (2009). 10.1039/b813516a [DOI] [PubMed] [Google Scholar]
- Yazdi S. and Ardekani A. M., Biomicrofluidics 6, 044114 (2012). 10.1063/1.4771407 [DOI] [PMC free article] [PubMed] [Google Scholar]
- Liu Z. B., Huang F., Du J. H., Shu W. L., Feng H. T., Xu X. P., and Chen Y., Biomicrofluidics 7, 011801 (2013). 10.1063/1.4774308 [DOI] [PMC free article] [PubMed] [Google Scholar]
- Sun J. S., Liu C., Li M. M., Wang J. D., Xianyu Y. L., Hu G. Q., and Jiang X. Y., Biomicrofluidics 7, 011802 (2013). 10.1063/1.4774311 [DOI] [PMC free article] [PubMed] [Google Scholar]
- Xu X. X., Sarder P., Li Z. Y., and Nehorai A., Biomicrofluidics 7, 014112 (2013). 10.1063/1.4793713 [DOI] [PMC free article] [PubMed] [Google Scholar]
- Griffith L. G. and Swartz M. A., Nat. Rev. Mol. Cell Biol. 7, 211 (2006). 10.1038/nrm1858 [DOI] [PubMed] [Google Scholar]
- Kieft R. N., Schreel K. R. A. M., van der Plas G. A. J., and Rindt C. C. M., Exp. Fluids 33, 603 (2002). 10.1007/s00348-002-0513-9 [DOI] [Google Scholar]
- Kundu P. K. and Cohen I. M., Fluid Mechanics, 4th ed. (Elsevier, Oxford, 2008), pp. 81–121. [Google Scholar]
- ANSYS FLUENT Theory Guide Release 14.0, ANSYS, Inc., Southpointe, 2011.
- Van Doormaal J. P. and Raithby G. D., Numer. Heat Transfer 7(2), 147 (1984). 10.1080/01495728408961817 [DOI] [Google Scholar]
- Yin H. B., Pattrick N., Zhang X. L., Klauke N., Cordingley H. C., Haswell S. J., and Cooper J. M., Anal. Chem. 80, 179 (2008). 10.1021/ac701958z [DOI] [PubMed] [Google Scholar]


