

Abstract
Long thought to function only as an inert energy storage depot, the role of adipose tissue in breast tumorigenesis has been largely ignored. In light of increasing rates of obesity and use of breast conserving therapy and autologous fat grafting, improved understanding of the role of adipose tissue in tumor etiology is crucial. Thus, adipose tissue adjacent to and distant from invasive breast tumors (n = 20), or adjacent to non-malignant diagnoses (n = 20) was laser microdissected from post-menopausal women. Gene expression data were generated using microarrays and data analyzed to identify significant patterns of differential expression between adipose tissue groups at the individual gene and molecular pathway level. Pathway analysis revealed significant differences in immune response between non-malignant, distant, and tumor-adjacent adipose tissue, with the highest response in tumor-adjacent and lowest in non-malignant adipose tissue. Adipose tissue from invasive breasts exhibits increased expression of anti-inflammatory genes such as MARCO and VSIG4 while genes differentially expressed between tumor-adjacent and distant adipose tissue such as SPP1, RRM2, and MMP9, are associated with increased cellular proliferation, invasion, and angiogenesis. These data suggest that molecular profiles of adipose tissue differ depending on presence of or proximity to tumor cells. Heightened immunotolerance in adipose tissue from invasive breasts provides a microenvironment favorable to tumorigenesis. In addition, tumor-adjacent adipose tissue demonstrates expression of genes associated with tumor growth and progression. Thus, adipose tissue is not an inert component of the breast microenvironment but plays an active role in tumorigenesis.
Keywords: adipose, gene expression, breast cancer, microenvironment
Introduction
Research in the past decade has increased our understanding of how the tumor microenvironment influences tumor development. Breast stroma, which comprises 80% of the normal breast, encompasses fibroblasts, endothelial, smooth muscle, inflammatory and nerve cells, adipocytes, and macromolecules of the extracellular matrix (ECM) and serves a supportive role to epithelial cells.1 The stroma undergoes a series of phenotypic and functional changes to become activated, providing a permissive environment for the advancement of tumor epithelial cells.2 Each cell type of the stroma contributes to tumorigenesis differently: cancer-associated fibroblasts produce growth factors that stimulate angiogenesis and cell growth, increased stiffness of the ECM facilitates invasion, and tumor-associated macrophages facilitate tumor cell migration, angiogenesis, and ECM remodeling.3 Gene expression analysis of epithelial, myoepithelial, and endothelial cells, leukocytes, myofibroblasts, and fibroblasts from normal, ductal carcinoma in situ and invasive breast tissues revealed differential gene expression patterns between normal and cancerous breasts in each cell type.4
Despite this progress in understanding how the stroma contributes to breast tumor etiology, the possible role of adipose tissue, having long been thought to function only as an inert energy storage depot, in tumorigenesis has been largely ignored.5 Adipose tissue is comprised of a diverse array of cell types including adipocytes, adipose-derived stem cells, preadipocytes, lymphocytes, macrophages, fibroblasts, and vascular endothelial cells. Research over the last decade has demonstrated that adipose is, in fact, an active endocrine organ secreting adipokines, pro-inflammatory molecules, chemokines, hormones, and growth factors.6 In co-culture experiments and animal models, adipose tissue has been shown to contribute to the development and progression of mammary tumors.7
Adipose tissue comprises ~50% of the human breast,8 thus a complete understanding of how the breast microenvironment contributes to tumorigenesis cannot be achieved without improved understanding of how adipose tissue may contribute to tumor development and progression. Clinically, the rate of obesity is increasing in the United Sates, breast conservation leaves potentially tumorigenic adipose tissue behind, and autologous fat transfer may stimulate growth of residual tumor cells, all leading to increased recurrence and poor outcomes in breast cancer patients. To this end, we have performed gene expression analysis on tumor-adjacent and distant adipose tissue from invasive breasts and on adipose tissue from non-malignant breasts from postmenopausal women to (1) compare expression of genes from adipose tissue from invasive and non-invasive breasts thus identifying genes associated with increased risk and (2) compare molecular signatures of adipose tissue adjacent to and distant from invasive tumors to identify genes actively supporting tumor development and progression.
Results
Patient samples
To generate microarray data using RNA isolated after laser microdissection, minimal yields of 1.8 ng and RIN ≥6.0 were required. Each of the specimens, adjacent and distant, from 30 sequential postmenopausal patients who underwent mastectomy for invasive breast cancer produced RNA of sufficient quantity and quality for gene expression studies. In contrast, from 46 postmenopausal women with non-malignant diagnoses, 14 specimens generated RNA of insufficient yield and one of poor quality, resulting in 31 usable RNA samples. The majority of patients from both groups were self-described as white, while more of the non-malignant patients were surgically menopausal (31%) and fewer were obese (25%) compared with invasive patients (3% and 33%, respectively).
Differential gene expression in adjacent compared with distant adipose tissue
When gene expression patterns from adjacent and distant adipose tissue from the same breasts were compared, 391 genes were differentially expressed with 20 genes having ≥2.0-fold difference in expression (Table S1). The probability of getting at least 391 genes significant by chance (at the 0.01 level) if there were no real differences between the classes was 0.002. Genes with the highest fold difference included secreted phosphoprotein 1 (SPP1), ribonucleotidereductase M2 subunit (RRM2), matrix metalloproteinase 9 (MMP9), and phospholipase A2, group VII (PLA2G7), which were each expressed >3-fold higher in adipose tissue adjacent to compared with distant from the tumor. When pathway analysis was performed, molecular pathways involving the immune system, including both B- and T-cell immunity, were differentially regulated between tumor adjacent and distant adipose tissue (Table 1).
Table 1. Differentially regulated BioCarta pathways between paired specimens of adjacent and distant adipose tissue.
| BioCarta pathway | Pathway description | Number of genes | LS permutation P value | KS permutation P value | Efron–Tibshirani GSA test P value |
|---|---|---|---|---|---|
| h_tcytotoxic pathway | T cytotoxic cell surface molecules | 12 | 0.00001 | 0.00001 | 0.005 (−) |
| h_thelper pathway | T helper cell surface molecules | 11 | 0.00001 | 0.00001 | 0.005 (−) |
| h_blymphocyte pathway | B lymphocyte cell surface molecules | 15 | 0.00037 | 0.00001 | 0.015 (−) |
| h_erad pathway | ER-associated degradation (ERAD) [athway | 29 | 0.00046 | 0.00277 | 0.02 (−) |
| h_ctla4 pathway | The co-stimulatory signal during T-cell activation | 17 | 0.00079 | 0.00013 | 0.01 (−) |
| h_CSK pathway | Activation of Csk by cAMP-dependent protein kinase inhibits signaling through the T cell receptor | 19 | 0.00256 | 0.0014 | 0.01 (−) |
| h_comp pathway | Complement pathway | 11 | 0.0047 | 0.0019 | 0.045 (−) |
| h_tcra pathway | Lck and Fyn tyrosine kinases in initiation of TCR activation | 10 | 0.00536 | 0.0001 | 0.02 (−) |
| h_d4gdi pathway | D4-GDI signaling pathway | 18 | 0.01137 | 0.00093 | 0.035 (−) |
| h_eosinophils pathway | The role of eosinophils in the chemokine network of allergy | 7 | 0.01189 | 0.00008 | 0.045 (−) |
| h_mhc pathway | Antigen processing and presentation | 16 | 0.01284 | 0.00025 | 0.115 (−) |
| h_caspase pathway | Caspase cascade in apoptosis | 31 | 0.01588 | 0.00252 | 0.04 (−) |
| h_actinY pathway | Y branching of actin filaments | 13 | 0.05174 | 0.04233 | <0.005 (−) |
| h_fbw7 pathway | Cyclin E destruction pathway | 11 | 0.07594 | 0.06453 | <0.005 (+) |
| h_il18 pathway | IL 18 signaling pathway | 6 | 0.0853 | 0.00441 | 0.105 (−) |
Differential gene expression in adjacent compared with non-malignant adipose
Comparison of tumor-adjacent adipose tissue and adipose tissue from non-malignant breasts identified 928 differentially expressed genes (Table S2), 180 of which demonstrated ≥2.0-fold expression differences. The probability of getting at least 928 genes significant by chance (at the 0.01 level) if there were no real differences between the classes was <0.0001. Three genes, macrophage receptor with collagenous structure (MARCO), v-set and immunoglobulin domain containing 4 (VSIG4), and complement component 1, q subcomponent, B-chain (C1QB), were expressed at >5-fold higher levels in tumor-adjacent adipose tissue while major histocompatibility complex, class II, DQ-α 1 (HLA-DQA1), major histocompatibility complex, class II, DQ-β 1 (HLA-DQB1), prolactin-inducible protein (PIP), and claudin 8 (CLDN8) were expressed at ≥5-fold higher levels in adipose tissue from non-malignant breasts. Pathway analysis revealed that many elements of B and T-cell immunity are active in the adjacent adipose tissue (Table 2).
Table 2. BioCarta pathways with significant differential expression between adjacent and non-malignant adipose.
| BioCarta pathway | Pathway description | Number of genes | LS permutation P value | KS permutation P value | Efron–Tibshirani GSA test P value |
|---|---|---|---|---|---|
| h_blymphocyte pathway | B lymphocyte cell surface molecules | 15 | 0.00001 | 0.00012 | 0.005 (−) |
| h_ctla4 pathway | The co-stimulatory signal during T-cell activation | 17 | 0.00001 | 0.00001 | 0.005 (−) |
| h_eosinophils pathway | The role of eosinophils in the chemokine network of allergy | 7 | 0.00001 | 0.00001 | 0.005 (−) |
| h_tcra pathway | Lck and Fyn tyrosine kinases in initiation of TCR activation | 10 | 0.00001 | 0.00026 | 0.005 (−) |
| h_tcytotoxic pathway | T cytotoxic cell surface molecules | 12 | 0.00001 | 0.00046 | 0.005 (−) |
| h_th1th2 pathway | Th1/Th2 differentiation | 18 | 0.00001 | 0.01519 | 0.005 (−) |
| h_thelper pathway | T helper cell surface molecules | 11 | 0.00001 | 0.00045 | <0.005 (−) |
| h_classic pathway | Classical complement pathway | 9 | 0.00002 | 0.17593 | 0.01 (−) |
| h_pepi pathway | Proepithelin conversion to epithelin and wound repair control | 5 | 0.00003 | 0.2185 | 0.005 (−) |
| h_il10 pathway | IL-10 anti-inflammatory signaling pathway | 15 | 0.00004 | 0.08935 | <0.005 (−) |
| h_mhc pathway | Antigen processing and presentation | 16 | 0.00005 | 0.00056 | 0.03 (−) |
| h_comp pathway | Complement pathway | 11 | 0.00009 | 0.2182 | 0.02 (−) |
| h_CSK pathway | Activation of Csk by cAMP-dependent protein kinase inhibits signaling through the T cell receptor | 19 | 0.00013 | 0.0119 | 0.03 (−) |
| h_bbcell pathway | Bystander B cell activation | 12 | 0.00014 | 0.08138 | 0.005 (−) |
| h_asbcell pathway | Antigen dependent B cell activation | 13 | 0.00018 | 0.08074 | 0.005 (−) |
| h_il5 pathway | IL 5 signaling pathway | 8 | 0.00018 | 0.0853 | 0.02 (−) |
| h_plateletApp pathway | Platelet amyloid precursor protein pathway | 12 | 0.00025 | 0.01714 | 0.01 (+) |
| h_plc pathway | Phospholipase C signaling pathway | 13 | 0.00043 | 0.11754 | 0.005 (−) |
| h_sppa pathway | Aspirin blocks signaling pathway involved in platelet activation | 17 | 0.00045 | 0.15905 | 0.015 (−) |
Differential gene expression in distant compared with non-malignant adipose
Of the 562 genes differentially expressed between distant and non-malignant adipose tissue (Table S3), 259 (46%) were also differentially expressed between tumor-adjacent and non-malignant adipose tissue, including SPP1, RRM2, MMP9, and PLA2G7, which are all expressed at >2.0-fold higher levels in distant compared with non-malignant adipose tissue. Relative expression levels of RRM2 between the three adipose tissue types are shown in Figure 1. The probability of getting at least 562 genes significant by chance (at the 0.01 level) if there were no real differences between the classes was <0.0001. Sixty-eight of the differentially expressed genes had fold-differences ≥2.0, with MARCO having >3-fold higher expression in distant adipose tissue and fatty acid-binding protein 7 (FABP7), E74-like factor 5 (ELF5), myosin binding protein C, slow type (MYBPC1), matrix metalloproteinase 7 (MMP7), CLDN8, HLA-DQA1, and HLA-DQB1 having >3-fold higher expression in non-malignant adipose tissue. Pathway analysis revealed that pathways involved in DNA replication, transcription, B-cell immunity, and the inflammatory response are differentially regulated between adipose tissue distant to a breast tumor and non-malignant adipose tissue (Table 3).

Figure 1. Relative gene expression levels of RRM2 in tumor-adjacent, distant, and non-malignant adipose tissue. Data was generated by qRT-PCR in 10 pairs of independent tumor-adjacent and distant adipose tissue samples as well as nine independent non-malignant adipose tissue samples. Median relative expression levels were 3979 in tumor-adjacent, 1428 in distant, and 307 in non-malignant adipose tissue. Blue diamonds, tumor-adjacent tissue; red triangles, distant tissue; green triangles, non-malignant tissue.
Table 3. Results from Biocarta pathway comparison between distant and non-malignant breast adipose tissue.
| Biocarta pathway | Pathway description | Number of genes | LS permutation P value | KS permutation P value | Efron–Tibshirani GSA test P value |
|---|---|---|---|---|---|
| h_prc2 pathway | The PRC2 complex sets long-term gene silencing through modification of histone tails | 19 | 0.00148 | 0.02119 | <0.005 (+) |
| h_eosinophils pathway | The role of eosinophils in the chemokine network of allergy | 7 | 0.00297 | 0.04015 | 0.035 (−) |
| h_blymphocyte pathway | B lymphocyte cell surface molecules | 15 | 0.00401 | 0.20009 | 0.01 (−) |
| h_il10 pathway | IL-10 anti-inflammatory signaling pathway | 15 | 0.02285 | 0.03816 | <0.005 (−) |
| h_antisense pathway | RNA polymerase III transcription | 10 | 0.08858 | 0.02193 | <0.005 (+) |
Discussion
The importance of the tumor microenvironment to carcinogenesis was recognized as early as 1944 when Slaughter stated that “cancer does not arise as an isolated cellular phenomenon, but rather as an anaplastic tendency involving many cells at once”.9 Tumor progression is promoted by stromal components such as fibroblasts, endothelial cells, and ECM, which undergo morphological and molecular alterations to actively support tumorigenesis. These changes, however, are not uniform throughout the breast, but rather depend on proximity to the tumor. For example, cancer cells induce oxidative stress in neighboring cancer-associated fibroblasts (CAFs), which results in production of nutrients such as lactate from the CAFs that then promote survival of cancer cells; these effects are most concentrated in tumor adjacent CAFs but may be able to diffuse to more distant stromal cells.10 Here, we demonstrate that gene expression profiles of adipose tissue differ based on distance from the tumor.
Pathway analysis suggests that the immune response is highest in tumor-adjacent adipose tissue and lowest in adipose tissue from non-malignant breasts. Adipose tissue is not only involved in processes such as endocrine signaling, energy expenditure, and bone metabolism but also inflammation and immunity. While adipocytes are the most abundant cell type, macrophages comprise ~10% of white adipose tissue. Adipocytes secrete a variety of factors that can influence immune and inflammatory responses such as leptin, which is pro-inflammatory, and adiponectin, which is anti-inflammatory.11 Gene expression profiling of MDA-MB-231 breast cancer cells cultured with adipocyte-cultured medium found increased expression of genes involved in immune and wound-healing responses.12 These data demonstrate that the immune response of the adipose tissue itself is dependent on presence of or proximity to breast tumor cells.
Adjacent and distant adipose tissues co-exist within a malignant breast and thus may be subjected to similar local influences from the tumor. Both types of adipose tissues demonstrate a heightened immune response compared with adipose tissues from non-malignant breasts and share a number of differentially expressed genes that are involved in immunity and/or inflammation. Expression levels of MARCO were 6.33-fold higher in adjacent adipose tissue and 3.39-fold higher in distant adipose tissue compared with adipose tissue from non-malignant breasts. MARCO is located on the surface of macrophages where it mediates phagocytosis, removing apoptotic cells, pathogens, and other foreign substances. Expression of MARCO and corresponding rates of phagocytosis have been found to be increased in immune-tolerant macrophages displaying anti-inflammatory responses.13 Similarly, VSIG4, which is expressed at 5.72- and 2.85-fold higher levels in tumor adjacent and distant adipose tissues compared with non-malignant adipose, is highly expressed on resting macrophages where it prevents T-cell activation and maintains T-cell tolerance.14 VSIG4 is co-expressed with other macrophage genes such as MARCO, C1QB, complement component 1, q subcomponent, A-chain (C1QA), and CD163 antigen (CD163), each of which is expressed at significantly higher levels in adipose tissue from invasive breasts compared with non-malignant adipose tissue.15 In contrast, HLA-DQA1 and HLA-DQB1 are expressed at >7.0-fold lower levels in tumor-adjacent and distant adipose tissue compared with non-malignant adipose tissue. HLA-DQA1 and HLA-DQB1 bind antigenic peptides and present them to T cells; lower expression may reduce the ability to elicit an appropriate immune response.16 Thus, adipose tissue from breasts harboring invasive tumors demonstrates immunotolerance, which may allow tumor cells to evade immune recognition and ensuing destruction. Although the differential immune response is lower in distant than in tumor-adjacent adipose tissue, both types of adipose tissue demonstrate an altered immune response compared with non-malignant adipose tissue suggesting that immunological changes are present throughout the diseased breast.
Gene expression differences in tumor-adjacent and distant adipose tissue reflect distance to, rather than presence of, a breast tumor. SPP1, also known as osteopontin, is involved in the migration of macrophages to adipose tissue17,18 and is expressed at 3.93 higher levels in tumor-adjacent compared with distant adipose tissue. Increased expression of SPP1 in mammary cancer cells results in changes in gene expression associated with evasion of apoptosis, invasion and metastasis, and angiogenesis.19 RRM2 is involved in deoxyribonucleotide synthesis, is expressed only in dividing cells, and its expression is required for cell division.20 Overexpression of RRM2 has been associated with increased invasion, angiogenesis, and metastasis.21 In addition, overexpression of RRM2 in pancreatic adenocarcinoma has been found to induce MMP9,22 which demonstrated a 3.33-fold increase in expression in tumor-adjacent compared with distant adipose tissue. Increased levels of MMP9 have been found on M2 macrophages and are induced in promonocytes when co-cultured with breast cancer cells.23 Together, these genetic changes not only suggest that tumor-adjacent adipose tissue has a heightened anti-inflammatory response when compared with distant fat but also that genes expressed in tumor-adjacent adipose tissue may promote cellular division, angiogenesis, and invasion, thus providing favorable conditions for breast tumor progression.
Crosstalk between tumor and adipose has been previously reported: co-culturing of human cancer lines with mature adipocytes demonstrated increased invasive potential of the tumor cells, while in the adipocytes, a number of phenotypic changes were detected including decreased lipid accumulation, loss of terminal differentiation, and increased expression of inflammatory markers. These altered, or “cancer-associated adipocytes” (CAAs) have been detected not only in primary human tumors but distant to the primary tumor in mouse mammary glands.24 Although the cause of these phenotypic changes is not well understood, increased levels of matrix metalloproteinase 11 (MMP11) have been found in CAAs at the invasive edge of the tumor, where they are thought to affect adipogenesis by decreasing pre-adipocyte differentiation and stimulating dedifferentiation of mature adipocyte cells, leading to accumulation of fibroblast-like cells, which has been associated with tumor progression.25,26 In addition, studies have shown that adipocytes within peritumoral adipose tissue undergo necrosis, leading to recruitment of macrophages and an altered inflammatory environment associated with immunosuppression and tumor progression.27,28 In conjunction with these studies, our data investigating gene expression patterns in tumor-adjacent, rather than peritumoral, and distant adipose tissues revealed altered expression of a number macrophage-associated genes, leading to an altered inflammatory response and increased immunotolerance.
The third hallmark of CAAs is decreased lipid content. Proliferating tumor cells require a source of energy to divide as well as lipids for membrane production. Lipolysis of adjacent adipocytes by mammary epithelial cells occurs during lactation29; this may be coopted by tumor epithelial cells to provide tumors with a source of energy.30 The role of adipose tissue as not only fuel for tumor growth, but also in recruiting macrophages and stimulating an inflammatory response, may contribute to the less favorable outcomes of obese breast cancer patients. Levels of adipose tissue macrophages were 3-fold higher in adipose tissue from obese compared with lean individuals31 and reductive mammoplasty specimens from obese women demonstrated increased number of macrophages and inflammatory response.32 Thus, obesity may be a risk factor for breast cancer by creating an inflammatory response in the mammary gland. In this study, 33% of invasive patients were obese compared with 25% of patients with non-malignant disease. Gene expression differences and the immunotolerant response seen in adipose tissue of patients with invasive breast cancer, therefore, may reflect a combination of higher rates of obesity as well as disease state.
Gene expression changes in adipose tissues from invasive breasts may affect clinical outcomes. For example, recent data demonstrate that presence of tumor-associated macrophages, which have a M2, anti-inflammatory response, in the tumor stroma but not the tumor proper is associated with poor prognosis.33 In patients undergoing breast conserving therapy (BCT), distant adipose tissue, which may have an immunotolerant phenotype, will persist, and a subset of patients who have BCT with close margins may harbor tumor-adjacent adipose tissue with its tumor promoting properties. The presence of residual tumor cells or the re-seeding of the breast with metastatic primary breast tumor cells into a tumorigenic microenvironment may thus favor recurrence.
In conclusion, mammary adipose tissue demonstrates different gene expression profiles dependent on presence of and proximity to breast tumors. Altered immune responses in both tumor-adjacent and distant adipose tissue from invasive breasts compared with non-malignant breasts suggest that the presence of tumor epithelial cells within the mammary gland is sufficient to drive an anti-inflammatory response throughout the breast. Genes expressed at higher levels in tumor-adjacent compared with distant adipose tissue are associated with increased cellular proliferation, invasion, migration, angiogenesis and metastasis, suggesting that tumor-adjacent adipose tissue promotes the growth and progression of the tumor. Together, these data suggest that adipose tissue is not an inert component of the breast microenvironment but plays an active role in tumorigenesis.
Patients/Methods/Materials
Human tissue samples
Enrollment of patients into the Clinical Breast Care Project (CBCP) began in 2001. For inclusion in the CBCP, all patients met the following criteria: (1) adult over the age of 18 y, (2) mentally competent and willing to provide informed consent, and (3) presenting to the breast centers with evidence of possible breast disease, for routine screening mammograms or elective reductive mammoplasty. Tissue specimens were collected with approval from the Walter Reed National Military Medical Center Human Use Committee and Institutional Review Board. All subjects enrolled in the CBCP voluntarily agreed to participate and gave written informed consent.
Tissue was collected from patients undergoing surgical procedures including lumpectomy or mastectomy. Within 5–15 min of surgical removal, breast tissue was taken on crushed, wet ice to the pathology laboratory where a licensed pathologist or pathologist’s assistant performed routine pathology analyses (gross characterization, margin status assessment, and other indicated purposes). Excess tissues were frozen in optimal cutting temperature medium (Sakura Finetek, 4583) on dry ice. Once preserved, frozen tissue samples were stored in liquid nitrogen freezers.
The CBCP database was queried to identify all female patients who were ≥50 y or surgically menopausal who (1) underwent mastectomy for invasive breast cancer or (2) had excisional biopsies that resulted in non-malignant diagnoses with frozen specimens containing adipose tissue adjacent to the benign lesion. Non-malignant diagnoses included no detectable abnormalities, fibrocystic changes, or stromal fibrosis; patients with columnar cell or atypical hyperplasias were excluded. Patients with BRCA1 or BRCA2 mutations or multi-focal or multi-centric tumors, or who underwent neoadjuvant therapy or had a previous history of cancer were excluded. For the patients with invasive breast cancer, only those with specimens harboring adipose tissue immediately adjacent to (“tumor adjacent”) and >4 cm distant (“distant”) from the invasive tumor were included.
Gene expression analysis
For each adipose tissue specimen, one hematoxylin and eosin (H&E) stained slide was made following standard procedures (Fig. 2) and then 10–20 serial sections (10 μm thick) were cut, mounted on glass PEN foil slides (Leica Microsystems, 11505158), and stained using the LCM staining kit (Life Technologies Corporation, AM1935) as previously described.34 Using microscopic evaluation of the H&E, areas of adipose tissue free of tumor or pre-malignant lesions, blood vessels, and other stromal components were chosen for laser microdissection. Laser microdissection was performed using an ASLMD laser microdissection system. Slide preparation, staining and microdissection of each section were performed within 15 min to preserve RNA integrity. RNA for microarray analysis was processed as previously described.35 Labeled RNA was hybridized to HG U133A 2.0 arrays (Affymetrix, 900469) according to manufacturer’s protocols.
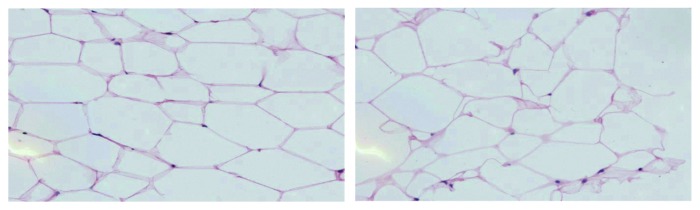
Figure 2. H&E stained images of tumor-adjacent and distant adipose tissue from a patient with invasive breast cancer. The image on the left is adipose tissue adjacent to an ER+/PR−/HER2−, moderately-differentiated IDCA. The image on the right is distant adipose tissue located 4 cm from the tumor.
For gene expression analysis, CEL files were processed using the MAS5.0 algorithm. Individual gene expression values below a normalized value of 10.0 were set to 10.0 and any probe missing from 80% or more of all samples was excluded from further analysis. Normalized profiles were median-centered across the data set to minimize any technical bias. Probe redundancy (i.e., genes represented by >1 probeset) was reduced by selecting the individual probe with the highest mean intensity across all samples, resulting in 9490 normalized gene expression values per sample. Using a randomized block design, expression of these 9490 genes was compared between non-malignant adipose tissue and either adipose tissue adjacent to or distant from the tumor. Because the adjacent and distant adipose tissue specimens were obtained from the same patients, a paired t test was used to identify differentially expressed genes between these classes. A P value threshold of <0.01 was used as the cutoff to determine differential expression. Pathway comparison was used to analyze pre-defined gene sets for differential expression among pre-defined classes. The BioCarta pathway database (http://www.biocarta.com/genes/index.asp) was selected and individual pathways differentially regulated between classes below P = 0.005 were identified. Permutation analysis was used to determine the significance of the differential expression.
Quantitative real-time PCR (qRT-PCR) was used to validate the microarray results for selected genes with ≥2-fold expression difference between adipose tissue types. RNA collected after laser microdissection from the original cases plus an additional 10 women with invasive disease and 9 women with non-neoplastic disease were reverse transcribed using the High-Capacity cDNA Reverse Transcription kit (Life Technologies, 4368814). qRT-PCR was performed using commercially available TaqMan gene expression assays (Life Technologies, Inc., 4331182). PCR amplification was performed in duplicate using TaqMan Universal PCR Master Mix (Life Technologies, Inc., 4305719). GAPDH was used as the endogenous control for normalization of all assays. Relative quantification of gene expression levels was determined using the Comparative Ct method.36 A Mann–Whitney U-test was used to calculate expression level differences with P < 0.05 defining significance.
Supplementary Material
Disclosure of Potential Conflicts of Interest
No potential conflicts of interest were disclosed.
Acknowledgments
The opinion and assertions contained herein are the private views of the authors and are not to be construed as official or as representing the views of the Department of the Army or the Department of Defense.
Grant Support
This research was supported by the United States Department of Defense (Congressionally Directed Medical Research Program, BC102819, and Breast Cancer Research Program W81XWH-11-2-0135).
Glossary
Abbreviations:
- C1QB
complement component 1, q subcomponent, B-chain
- CAFs
cancer associated fibroblasts
- CBCP
Clinical Breast Care Project
- CLDN8
claudin 8
- ECM
extracellular matrix
- ELF5
E74-like factor 5
- FABP7
fatty acid-binding protein 7
- HLA-DQA1
major histocompatibility complex, class II, DQ-alpha 1
- HLA-DQB1
major histocompatibility complex, class II, DQ-beta 1
- H&E
hematoxylin and eosin
- MARCO
macrophage receptor with collagenous structure
- MMP7
matrix metalloproteinase 7
- MMP9
matrix metalloproteinase 9
- MYBPC1
myosin binding protein C, slow type
- PIP
prolactin-inducible protein
- PLA2G7
phospholipase A2, group VII
- RRM2
ribonucleotidereductase M2 subunit
- SPP1
secreted phosphoprotein 1
- VSIG4
v-set and immunoglobulin domain containing 4
Footnotes
Previously published online: www.landesbioscience.com/journals/adipocyte/article/28250
References
- 1.Shekhar MP, Pauley R, Heppner G. Host microenvironment in breast cancer development: extracellular matrix-stromal cell contribution to neoplastic phenotype of epithelial cells in the breast. Breast Cancer Res. 2003;5:130–5. doi: 10.1186/bcr580. [DOI] [PMC free article] [PubMed] [Google Scholar]
- 2.Cukierman E. A visual-quantitative analysis of fibroblastic stromagenesis in breast cancer progression. J Mammary Gland Biol Neoplasia. 2004;9:311–24. doi: 10.1007/s10911-004-1403-y. [DOI] [PubMed] [Google Scholar]
- 3.Place AE, Jin Huh S, Polyak K. The microenvironment in breast cancer progression: biology and implications for treatment. Breast Cancer Res. 2011;13:227. doi: 10.1186/bcr2912. [DOI] [PMC free article] [PubMed] [Google Scholar]
- 4.Allinen M, Beroukhim R, Cai L, Brennan C, Lahti-Domenici J, Huang H, Porter D, Hu M, Chin L, Richardson A, et al. Molecular characterization of the tumor microenvironment in breast cancer. Cancer Cell. 2004;6:17–32. doi: 10.1016/j.ccr.2004.06.010. [DOI] [PubMed] [Google Scholar]
- 5.Iyengar P, Espina V, Williams TW, Lin Y, Berry D, Jelicks LA, Lee H, Temple K, Graves R, Pollard J, et al. Adipocyte-derived collagen VI affects early mammary tumor progression in vivo, demonstrating a critical interaction in the tumor/stroma microenvironment. J Clin Invest. 2005;115:1163–76. doi: 10.1172/JCI23424. [DOI] [PMC free article] [PubMed] [Google Scholar]
- 6.Ouchi N, Parker JL, Lugus JJ, Walsh K. Adipokines in inflammation and metabolic disease. Nat Rev Immunol. 2011;11:85–97. doi: 10.1038/nri2921. [DOI] [PMC free article] [PubMed] [Google Scholar]
- 7.Wang YY, Lehuédé C, Laurent V, Dirat B, Dauvillier S, Bochet L, Le Gonidec S, Escourrou G, Valet P, Muller C. Adipose tissue and breast epithelial cells: a dangerous dynamic duo in breast cancer. Cancer Lett. 2012;324:142–51. doi: 10.1016/j.canlet.2012.05.019. [DOI] [PubMed] [Google Scholar]
- 8.Lejour M. Evaluation of fat in breast tissue removed by vertical mammaplasty. Plast Reconstr Surg. 1997;99:386–93. doi: 10.1097/00006534-199702000-00012. [DOI] [PubMed] [Google Scholar]
- 9.Slaughter DP. The multiplicity of origin of malignant tumors: collective review. Int Abstr Surg. 1944;79:89–98. [Google Scholar]
- 10.Martinez-Outschoorn UE, Balliet RM, Rivadeneira DB, Chiavarina B, Pavlides S, Wang C, Whitaker-Menezes D, Daumer KM, Lin Z, Witkiewicz AK, et al. Oxidative stress in cancer associated fibroblasts drives tumor-stroma co-evolution: A new paradigm for understanding tumor metabolism, the field effect and genomic instability in cancer cells. Cell Cycle. 2010;9:3256–76. doi: 10.4161/cc.9.16.12553. [DOI] [PMC free article] [PubMed] [Google Scholar]
- 11.Fantuzzi G. Adipose tissue, adipokines, and inflammation. J Allergy Clin Immunol. 2005;115:911–9, quiz 920. doi: 10.1016/j.jaci.2005.02.023. [DOI] [PubMed] [Google Scholar]
- 12.Kim JH, Kim KY, Jeon JH, Lee SH, Hwang JE, Lee JH, Kim KK, Lim JS, Kim KI, Moon EY, et al. Adipocyte culture medium stimulates production of macrophage inhibitory cytokine 1 in MDA-MB-231 cells. Cancer Lett. 2008;261:253–62. doi: 10.1016/j.canlet.2007.11.020. [DOI] [PubMed] [Google Scholar]
- 13.Jing J, Yang IV, Hui L, Patel JA, Evans CM, Prikeris R, Kobzik L, O’Connor BP, Schwartz DA. Role of macrophage receptor with collagenous structure in innate immune tolerance. J Immunol. 2013;190:6360–7. doi: 10.4049/jimmunol.1202942. [DOI] [PMC free article] [PubMed] [Google Scholar]
- 14.Vogt L, Schmitz N, Kurrer MO, Bauer M, Hinton HI, Behnke S, Gatto D, Sebbel P, Beerli RR, Sonderegger I, et al. VSIG4, a B7 family-related protein, is a negative regulator of T cell activation. J Clin Invest. 2006;116:2817–26. doi: 10.1172/JCI25673. [DOI] [PMC free article] [PubMed] [Google Scholar]
- 15.Walker MG. Z39Ig is co-expressed with activated macrophage genes. Biochim Biophys Acta. 2002;1574:387–90. doi: 10.1016/S0167-4781(01)00358-X. [DOI] [PubMed] [Google Scholar]
- 16.Spacing between # 16 and Author name Janeway CA, Travers P, Walport M, Schlomchik MJ. The Immune System in Health and Disease. Immunobiology. 5th ed. New York: Garland Science; 2001. [Google Scholar]
- 17.Nomiyama T, Perez-Tilve D, Ogawa D, Gizard F, Zhao Y, Heywood EB, Jones KL, Kawamori R, Cassis LA, Tschöp MH, et al. Osteopontin mediates obesity-induced adipose tissue macrophage infiltration and insulin resistance in mice. J Clin Invest. 2007;117:2877–88. doi: 10.1172/JCI31986. [DOI] [PMC free article] [PubMed] [Google Scholar]
- 18.Giachelli CM, Lombardi D, Johnson RJ, Murry CE, Almeida M. Evidence for a role of osteopontin in macrophage infiltration in response to pathological stimuli in vivo. Am J Pathol. 1998;152:353–8. [PMC free article] [PubMed] [Google Scholar]
- 19.Cook AC, Tuck AB, McCarthy S, Turner JG, Irby RB, Bloom GC, Yeatman TJ, Chambers AF. Osteopontin induces multiple changes in gene expression that reflect the six “hallmarks of cancer” in a model of breast cancer progression. Mol Carcinog. 2005;43:225–36. doi: 10.1002/mc.20105. [DOI] [PubMed] [Google Scholar]
- 20.Kittler R, Putz G, Pelletier L, Poser I, Heninger AK, Drechsel D, Fischer S, Konstantinova I, Habermann B, Grabner H, et al. An endoribonuclease-prepared siRNA screen in human cells identifies genes essential for cell division. Nature. 2004;432:1036–40. doi: 10.1038/nature03159. [DOI] [PubMed] [Google Scholar]
- 21.Zhang K, Hu S, Wu J, Chen L, Lu J, Wang X, Liu X, Zhou B, Yen Y. Overexpression of RRM2 decreases thrombspondin-1 and increases VEGF production in human cancer cells in vitro and in vivo: implication of RRM2 in angiogenesis. Mol Cancer. 2009;8:11. doi: 10.1186/1476-4598-8-11. [DOI] [PMC free article] [PubMed] [Google Scholar]
- 22.Duxbury MS, Whang EE. RRM2 induces NF-kappaB-dependent MMP-9 activation and enhances cellular invasiveness. Biochem Biophys Res Commun. 2007;354:190–6. doi: 10.1016/j.bbrc.2006.12.177. [DOI] [PubMed] [Google Scholar]
- 23.Chimal-Ramírez GK, Espinoza-Sánchez NA, Utrera-Barillas D, Benítez-Bribiesca L, Velázquez JR, Arriaga-Pizano LA, Monroy-García A, Reyes-Maldonado E, Domínguez-López ML, Piña-Sánchez P, et al. MMP1, MMP9, and COX2 expressions in promonocytes are induced by breast cancer cells and correlate with collagen degradation, transformation-like morphological changes in MCF-10A acini, and tumor aggressiveness. Biomed Res Int. 2013;2013:279505. doi: 10.1155/2013/279505. [DOI] [PMC free article] [PubMed] [Google Scholar]
- 24.Dirat B, Bochet L, Dabek M, Daviaud D, Dauvillier S, Majed B, Wang YY, Meulle A, Salles B, Le Gonidec S, et al. Cancer-associated adipocytes exhibit an activated phenotype and contribute to breast cancer invasion. Cancer Res. 2011;71:2455–65. doi: 10.1158/0008-5472.CAN-10-3323. [DOI] [PubMed] [Google Scholar]
- 25.Motrescu ER, Rio MC. Cancer cells, adipocytes and matrix metalloproteinase 11: a vicious tumor progression cycle. Biol Chem. 2008;389:1037–41. doi: 10.1515/BC.2008.110. [DOI] [PubMed] [Google Scholar]
- 26.Andarawewa KL, Motrescu ER, Chenard MP, Gansmuller A, Stoll I, Tomasetto C, Rio MC. Stromelysin-3 is a potent negative regulator of adipogenesis participating to cancer cell-adipocyte interaction/crosstalk at the tumor invasive front. Cancer Res. 2005;65:10862–71. doi: 10.1158/0008-5472.CAN-05-1231. [DOI] [PubMed] [Google Scholar]
- 27.Grivennikov SI, Greten FR, Karin M. Immunity, inflammation, and cancer. Cell. 2010;140:883–99. doi: 10.1016/j.cell.2010.01.025. [DOI] [PMC free article] [PubMed] [Google Scholar]
- 28.Wagner M, Bjerkvig R, Wiig H, Dudley AC. Loss of adipocyte specification and necrosis augment tumor-associated inflammation. Adipocyte. 2013;2:176–83. doi: 10.4161/adip.24472. [DOI] [PMC free article] [PubMed] [Google Scholar]
- 29.Hovey RC, Aimo L. Diverse and active roles for adipocytes during mammary gland growth and function. J Mammary Gland Biol Neoplasia. 2010;15:279–90. doi: 10.1007/s10911-010-9187-8. [DOI] [PMC free article] [PubMed] [Google Scholar]
- 30.Tan J, Buache E, Chenard MP, Dali-Youcef N, Rio MC. Adipocyte is a non-trivial, dynamic partner of breast cancer cells. Int J Dev Biol. 2011;55:851–9. doi: 10.1387/ijdb.113365jt. [DOI] [PubMed] [Google Scholar]
- 31.Weisberg SP, McCann D, Desai M, Rosenbaum M, Leibel RL, Ferrante AW., Jr. Obesity is associated with macrophage accumulation in adipose tissue. J Clin Invest. 2003;112:1796–808. doi: 10.1172/JCI200319246. [DOI] [PMC free article] [PubMed] [Google Scholar]
- 32.Sun X, Casbas-Hernandez P, Bigelow C, Makowski L, Joseph Jerry D, Smith Schneider S, Troester MA. Normal breast tissue of obese women is enriched for macrophage markers and macrophage-associated gene expression. Breast Cancer Res Treat. 2012;131:1003–12. doi: 10.1007/s10549-011-1789-3. [DOI] [PMC free article] [PubMed] [Google Scholar]
- 33.Medrek C, Pontén F, Jirström K, Leandersson K. The presence of tumor associated macrophages in tumor stroma as a prognostic marker for breast cancer patients. BMC Cancer. 2012;12:306. doi: 10.1186/1471-2407-12-306. [DOI] [PMC free article] [PubMed] [Google Scholar]
- 34.Field LA, Deyarmin B, Shriver CD, Ellsworth DL, Ellsworth RE. Laser microdissection for gene expression profiling. Methods Mol Biol. 2011;755:17–45. doi: 10.1007/978-1-61779-163-5_2. [DOI] [PubMed] [Google Scholar]
- 35.Field LA, Love B, Deyarmin B, Hooke JA, Shriver CD, Ellsworth RE. Identification of differentially expressed genes in breast tumors from African American compared with Caucasian women. Cancer. 2012;118:1334–44. doi: 10.1002/cncr.26405. [DOI] [PubMed] [Google Scholar]
- 36.Livak KJ, Schmittgen TD. Analysis of relative gene expression data using real-time quantitative PCR and the 2(-Delta Delta C(T)) Method. Methods. 2001;25:402–8. doi: 10.1006/meth.2001.1262. [DOI] [PubMed] [Google Scholar]
Associated Data
This section collects any data citations, data availability statements, or supplementary materials included in this article.