

Abstract
Spinal muscular atrophy (SMA) is a fatal autosomal recessive disease caused by survival motor neuron (SMN) protein insufficiency due to SMN1 mutations. Boosting SMN2 expression is a potential therapy for SMA. SMN2 has identical coding sequence as SMN1 except for a silent C-to-T transition at the 6th nucleotide of exon 7, converting a splicing enhancer to a silencer motif. Consequently, most SMN2 transcripts lack exon 7. More than ten putative splicing regulatory elements (SREs) were reported to regulate exon 7 splicing. To investigate the relative strength of each negative SRE in inhibiting exon 7 inclusion, antisense oligonucleotides (AONs) were used to mask each element, and the fold increase of full-length SMN transcripts containing exon 7 were compared. The most potent negative SREs are at intron 7 (in descending order): ISS-N1, 3′ splice site of exon 8 (ex8 3′ss) and ISS+100. Dual-targeting AONs were subsequently used to mask two nonadjacent SREs simultaneously. Notably, masking of both ISS-N1 and ex8 3′ss induced the highest fold increase of full-length SMN transcripts and proteins. Therefore, efforts should be directed towards the two elements simultaneously for the development of optimal AONs for SMA therapy.
Introduction
Spinal muscular atrophy (SMA) is characterized by progressive voluntary muscle atrophy resulting from the degeneration of α-motor neurons in the anterior horns of the spinal cord. This is due to insufficient amount of survival motor neuron (SMN) protein which is expressed primarily by SMN1 but is mutated in SMA patients, and marginally by SMN2 genes.1 Both genes are mapped to Chromosome 5q13 as inverted repeats whose 1.7 kb full-length cDNAs are identical except for a silent C-to-T transition at the 6th nucleotide (C6T) of SMN2′s exon 7,2 and another one at exon 8. The transition converts the SF2/ASF splicing factor-specific exonic splicing enhancer (ESE) motif to a heterogeneous nuclear ribonucleoprotein (hnRNP) A1 repressor protein-specific exonic splicing silencer (ESS) motif, and generates an extended inhibitory context against exon 7 retention.3,4,5 Generally, ~90% of SMN2 mRNA transcripts lack exon 7 whose truncated gene products are unstable and nonfunctional.6 As SMA patients retain at least one copy of SMN2, the expression of full-length SMN transcripts can be restored by correcting aberrant exon 7 splicing. The plausibility of this strategy to reverse or ameliorate the phenotype is supported from clinical observations that phenotype severity correlates inversely with SMN2 copy number;7,8,9 more SMN2 copies suggests more endogenous full-length SMN transcripts and thus larger compensatory effect.
The regulation of SMN2 exon 7 splicing involves more than 10 putative splicing regulatory elements (SREs) located from intron 6 to exon 8 (Figure 1). They encompass four positive SREs (enhance exon 7 inclusion; shaded in gray), six negative SREs (inhibit exon 7 inclusion; shaded in black), and splice sites of which the latter two are of particular relevance for the induction of exon 7 inclusion. In the case of negative SREs, two are at intron 6 (Element 1 and a putative one downstream of Element 1), two are at exon 7 (ESS A and ESS B), two at intron 7 (ISS-N1 and ISS+100). Both the splice sites at exon 7's 5′ and exon 8 3′ are hypothesized to inhibit exon 7 inclusion. The proposed terminal stem loop 2 (TSL2) nascent mRNA structure at the former was hypothesized to inhibit U1 snRNP from binding to the splice site and subsequent exon 7 processing.10 The latter splice site was proposed to compete with 3′ splice site of exon 7 in joining to 5′ splice site of exon 6 during splicing.11 Exon 8 was hypothesized to be preferentially paired with exon 6 as the C6T transition, proposed TSL2 and exon 7's weak splice sites6 contributed to the attenuation of splicing factors' affinity towards exon 7. Refer to Figure 1 legend for more details.
Figure 1.
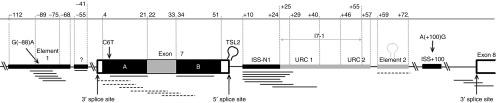
Positive and negative splicing regulatory elements (SREs) modulating SMN2 exon 7 splicing. SMN2 gene depicted from part of intron 6 to partial exon 8 (not drawn to scale). Positive SREs which promotes exon 7 inclusion are shaded in gray whereas negative SREs which inhibit exon 7 inclusion are shaded in black. Published antisense oligonucleotide (AON) target sites are indicated as either full (augmented exon 7 retention) or broken (induced exon 7 skipping) lines below the gene; Element 1,25,42 putative ISS at intron 6,43 exonic splicing silencer (ESS) A,12 exonic splicing enhancer (ESE) at exon 7,12,13 ESS B,12 ISS-N1,13,19,20,21,22,23,24 URC1,19 Element 2,18 and 3′ splice site of exon 8.11,14,44 The relative positions of the polymorphisms are indicated. Numbering of nucleotide position is relative from the first nucleotide: at 3′ of exon 7 in both intron 6 and exon 7, and at 3′ of intron 7 in intron 7 (“+” is appended to differentiate it from exonic sequence). Positive SREs: The exonic positive SRE, which is contiguously flanked by two splicing silencer elements, has been reported to be associated with several serine-rich (SR) or SR-like proteins including Tra2β1, SRp30c, RBMY, and hnRNP-G.12,27,28,29 Correspondingly, antisense oligonucleotides (AONs) bound to this element (depicted as dashed lines) further enhanced exon 7 exclusion in SMN2 transcripts. On the other hand, the three intronic positive SREs are clustered together. Two U-rich clusters (URC1 and URC2) have been reported to be TIA1 binding sites which recruits U1 snRNP needed for splicing.26 Both URC1 and URC2 motifs overlap with I7-1, a 31 nt-segment reported to promote exon 7 inclusion.31 Element 2 was found to be critical for exon 7 inclusion where its stem-loop RNA structure is required to recruit an unidentified splicing protein.18 Indeed, an AON bound to Element 2 promoted exon 7 skipping. Negative SREs: ESSs A and B sandwich the lone positive SRE in exon 7.12 Notably, the C6T transition that occurred within ESS A augments hnRNP A1 binding.4 Element 1, located at intron 6 that encompassed the G(-88)A transition, was reported to be binding sites for hnRNP1 and FUSEBP.25,42 A putative negative SRE was also reported at intron 6 downstream of Element 1.13 Lastly, the remaining two negative SREs, ISS-N1 and ISS+100, flanked all the three intronic positive SREs at intron 7. In fact, ISS-N1 consisted of two weak hnRNAP A1/A2 motifs19 that cooperate to make up a strong splicing inhibitory effect.13 The A(+100)G transition generated a silencer motif at ISS+100 and was reported to have high affinity towards hnRNP A1.33
The regulation of SRE on exon 7 splicing can be validated by masking the element via antisense oligonucleotides (AONs) as steric hindrance between the SRE and its associated regulatory protein(s).12,13 Indeed, AONs masking positive SREs augmented exon 7 skipping whereas the converse was observed for AONs masking either negative SREs or 3′ splice site of exon 8; AON target sites depicted in Figure 1. With the list of reported SREs, it is natural to ask the following questions in the context of applying AON as a possible therapy for SMA. What is the relative importance of each negative SRE in inhibiting exon 7 inclusion? That is, is it possible to differentiate critical SREs from noncritical or redundant ones? This cannot be inferred readily from prior studies wherein not more than two elements were compared at a time, and due to the use of different cell lines (with varying SMN2 copy number) or SMN2 minigenes of varying length, and different AON chemistry and concentration. Furthermore, not all negative SREs were targeted (e.g., ISS+100). In addition, are the inhibitory effects on exon 7 inclusion from the various negative SREs cooperative or additive? Both effects have not been observed thus far in SMN2 exon 7 splicing regulation.14
Three aims were attempted. First, novel AONs were designed rationally to mask each intronic SRE and 3′ splice site of exon 8 optimally. Second, the extent of full-length SMN transcripts induced upon masking each negative SRE (intronic and exonic) or 3′ splice site of exon 8 was measured under identical experimental system and compared. Third, dual-targeting AONs, in which an AON masks two nonadjacent SREs simultaneously, were used to infer possible cooperative or additive effects among SREs. Notably, the dual masking of ISS-N1 and 3′ splice site of exon 8 resulted in the highest fold increase in full-length SMN transcripts over all tested single- or dual masking of other elements, which suggests they are the most important SREs to mask for maximizing the expression of full-length SMN transcripts for SMA therapy.
Results
Design of AONs to mask intronic negative SREs and 3′ splice site of exon 8
9 novel AONs were synthesized to mask Element 1, ISS-N1, ISS+100 or 3′ splice site of exon 8 (Table 1). The target sites were rationally selected for optimal AON binding by taking into consideration the accessibility of cotranscriptional secondary structures of the nascent mRNA, and favorable biophysical and thermodynamic properties of the binding of the AON and target site, as described previously.15,16 A minimum target length of 17 nucleotides was chosen as an additional criterion to minimize unspecific binding to the human genome. Note that ISS+100 have not been targeted by AON.
Table 1. List of novel and published single-targeting AONs tested in this study.

Comparative study of AONs in inducing full-length SMN transcripts
For comparison as well as positive controls, AONs were also synthesized for previously published target sites that were shown to be effective in mediating full-length SMN transcripts production (Table 1). For negative controls, a scrambled AON and Lipofectamine2000 only were used. All AONs were synthesized with 2′-O-methyl and phosphorothioate backbone modifications and were transfected at 100 nmol/l into GM03813 cells17 (primary cultures of fibroblast cells derived from a Type I SMA patient, SMN1−/−). Their efficacy was determined by reverse transcription-PCR analysis and followed by bidirectional sequencing analysis to confirm exon 7 inclusion in SMN transcripts. Their efficiency was estimated by densitometry of the gel electrophoresis images that semiquantified the amplicons with or without exon 7. AON efficiency is presented as a percentage of the amplicon copies with exon 7 to total amplicon copies. Figure 2a shows the raw gel electrophoresis data of RT-PCR products from efficient AONs that can induce high level of exon 7 inclusion. The ImageJ analysis of the same data presenting the AON efficiencies is given in Figure 2b. Notably, the masking of each negative SRE at intron 6 or at exon 7 was less effective in inducing exon 7 inclusion (Supplementary Figure S1) than the masking of each of the three SREs at intron 7 (ISS-N1, ISS+100 and 3′ splice site of exon 8).
Figure 2.

Gel electrophoresis images of SMN amplicons. (a) RT-PCR products were amplified using forward primer at exon 6 and reverse primer at exon 8. Bands: upper: amplicons with exon 7; lower: amplicons without exon 7. SCRM: scrambled AON. NC: negative control where cells were transfected with Lipofectamine 2000 only. Lane labels prefixed with “Dual” refer to dual-targeting AONs (see text below). (b) The same gel electrophoresis image with inverted color. The efficiency of each AON in inducing exon 7 inclusion, measured by densitometer comparing upper band and lower band, are presented in % under each corresponding lane. AON, antisense oligonucleotide.
To investigate the relative strength of the negative SREs at intron 7, efficient AONs masking these elements were further tested at various AON transfection concentrations using qRT-PCR. The fold increase (of exon 7 inclusion) induced by each AON was normalized with the internal control (GAPDH) and the data was further normalized to the level of the corresponding transcript in the normal control (Lipofectamine2000 only; labeled as NT). For each AON, duplicate transfections were performed each at the concentration of 25 nmol/l, 50 nmol/l, 100 nmol/l, and 200 nmol/l, followed by triplicates of qRT-PCR analyses per AON transfection. The mean and standard deviation of fold increase of full-length SMN transcripts are plotted in Figures 3a–d respectively.
Figure 3.

Fold increase of full-length SMN transcripts measured at various antisense oligonucleotide (AON) transfection concentrations. (a) 25 nmol/l. (b) 50 nmol/l. (c) 100 nmol/l. (d) 200 nmol/l. The fold increase of exon 7 inclusion induced by each AON was normalized with the internal control (GAPDH) and the data was further normalized to the level of the corresponding transcript in the normal control (Lipofectamine2000 only; labeled as NT).
Masking ISS+100 resulted in the highest fold increase of full-length SMN transcripts at 200 nmol/l of AON concentration. At lower concentrations, masking ISS-N1 consistently resulted in the highest fold increase while masking 3′ splice site of exon 8 induced similar or higher fold increase than masking ISS+100.
Masking of two negative SREs simultaneously via dual-targeting AONs
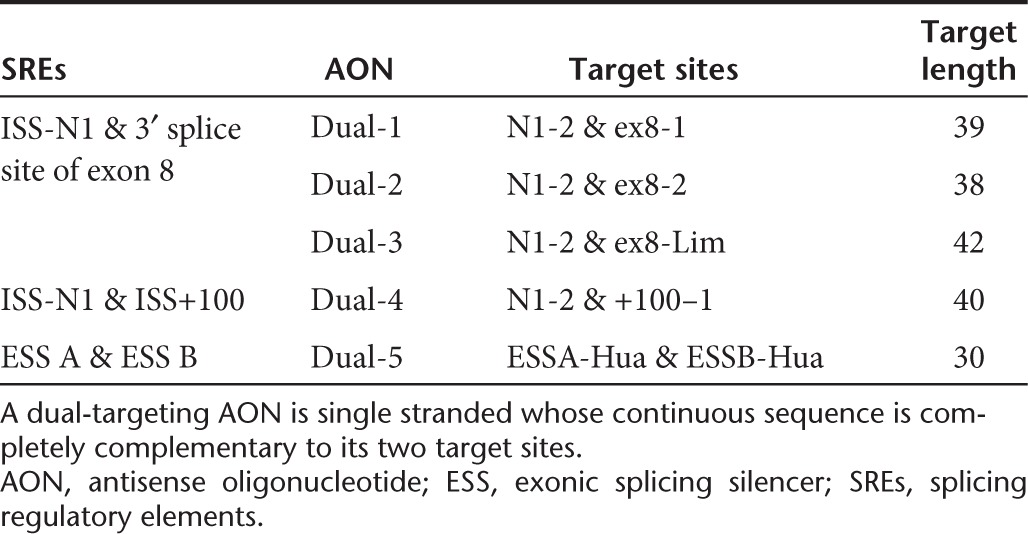
As masking ISS-N1, ISS+100, or 3′ splice site of exon 8 was most effective in augmenting exon 7 inclusion, four dual-targeting AONs were synthesized to mask two elements simultaneously. Since ISS-N1 is the most potent element (Figure 3), it was targeted in tandem with either ISS+100 or 3′ splice site of exon 8. As both N1-1 and N1-2 are the most potent AONs targeting ISS-N1 (Figure 3), the latter's target site was chosen in the dual-targeting AONs for its shorter sequence. On the other hand, both ex8-1 and ex8-2 were chosen for their shorter sequences whereas ex8-Lim was chosen for its efficiency. Table 2 tabulates the sequences and their respective target positions of the dual-targeting AONs.
Table 2. List of dual-targeting AONs.
Similarly, the efficiency of the dual-targeting AONs at various AON concentrations was first estimated by densitometry analysis of the RT-PCR products (Figure 2 and Supplementary Figure S1), and subsequently determined by qRT-PCR (Figure 4). Figure 5a compares the percentage difference in fold increase of full-length SMN transcripts induced by Dual-1 (the most efficient dual-targeting AON masking ISS-N1 and 3′ splice site of exon 8) relative to the most efficient single-targeting AONs masking the corresponding elements. Analogously, the performance of Dual-4 was compared with N1-2 and +100–1 (Figure 5b); note: at 200 nmol/l of AON dosage, the drastic loss of performance gain of Dual-4 over +100–1 was a result of the substantial increase in the efficiency of the latter (Figure 3d), as the efficiency of Dual-4 increases with AON dosage (Figure 4). Three observations were discerned. Generally, simultaneous masking of two elements leads to higher fold increase, and that the gain in performance increases with AON dosage. Second, the performance gain of dual masking over separate ISS+100 or 3′ splice site of exon 8 masking was more than ISS-N1 masking. Third, at low AON dosage (25 nmol/l), dual masking is not more effective than masking only ISS-N1.
Figure 4.

Fold increase of full-length SMN transcripts measured at various dual-targeting antisense oligonucleotide (AON) transfection concentrations.
Figure 5.

Fold increase of full-length survival motor neuron (SMN) transcripts induced by dual masking as compared to individual masking of two splicing regulatory elements (SREs). Relative percentage difference in fold increase of full-length SMN transcript is computed as 100% × Fold increase (Dual − Single)/Fold increase (Single). (a) Performance gains of Dual-1 (masking ISS-N1 and 3′ splice site of exon 8) over the most efficient single-masking antisense oligonucleotides (AONs) masking ISS-N1 (N1-2, black) or 3′ splice site of exon 8 (ex8-Lim, gray). (b) Performance gains of Dual-4 (masking ISS-N1 and ISS+100) over its single-masking counterparts i.e., N1-2 (black) and +100–1 (gray).
Furthermore, Dual-5 was synthesized to mask both ESS A and ESS B (Table 2). However, it promoted some exon 7 skipping instead (Supplementary Figure S1).
Protein and functional studies
Western blot analyses for SMN protein were performed after incubation with either 100 nmol/l or 200 nmol/l of AON. Figure 6a shows the representative results and the mean fold increase of SMN protein detected for various efficient AONs as compared to the untreated control (Lipofectamine2000 only). Notably, the relative efficiency of the AONs in inducing full-length SMN transcripts is in accordance with the relative fold increase of protein detected (Figure 6b). Hence, the increased full-length SMN transcripts resulted in a corresponding upregulation of full-length SMN protein.
Figure 6.

Semiquantitative studies of survival motor neuron (SMN) protein detected upon antisense oligonucleotide (AON) treatment. (a) For each AON transfection, duplicates of western blot analyses were performed. The mean fold increase of SMN protein from induced by each AON treatment is relative to Lipofectamine2000 only treatment (denoted as NT). (b) Fold increase of full-length SMN transcripts (from Figures 3 and 4) superimposed with fold increase of full-length SMN protein (from Figure 6a) at 100 nmol/l or 200 nmol/l of AON dosage.
The ability of the restored SMN proteins to form nuclear Gemini of coiled bodies (GEMs) was determined in the AON treated cells. The number of nuclear GEMs in each of the 120 consecutive cells, which were stained via immunofluorescence for SMN protein upon treatment with 100 nm of AON, was counted manually. As shown in Figure 7, the fraction of cells with GEMs and the number of cells with three or more GEMs both correlate generally with the relative AON efficiency in inducing full-length SMN transcripts (Figure 3 and Figure 4). Representative immunofluorescence stained slides for each AON tested in Figure 7 are given in Supplementary Figure S2. For the breakdown of the cell counts with specific numbers of nuclear GEMs induced by each AON, please refer to Supplementary Figure S3.
Figure 7.

Fraction of cells with GEMs. Fraction of cells observed to have at least one or three nuclear GEMs upon treatment with 100 nmol/l of a specific antisense oligonucleotide (AON) were counted and plotted. A total of 120 cells were used for GEMs counting.
Discussion
By masking negative SREs of the SMN2 nascent mRNA either separately or in pairs under identical experimental parameters, their relative inhibitory strengths on exon 7 inclusion, which was not addressed in previous studies, can be compared. Six previously reported negative SREs were masked—Element 1 at intron 6, ESS A and ESS B at exon 7, ISS-N1 and ISS+100 at intron 7, and 3′ splice site of exon 8. Each of the 20 novel or previously published efficient AONs targeting the elements was tested for their relative efficiency in augmenting exon 7 inclusion in the mature transcripts. The increased expression of the full-length SMN transcripts resulted in a corresponding upregulation of the protein whose ability to form nuclear GEMs in the treated cells was validated. Notably, AON efficiency quantified at the mRNA level generally correlated with the quantity of functional SMN protein measured. Taking the results of the molecular and cellular studies together, masking ISS-N1 and 3′ splice site of exon 8 simultaneously elicited the highest fold increase of full-length SMN transcripts and proteins, and highest fraction of cells with nuclear GEMs (Figures 4, 6 and 7). Therefore, efforts should be directed towards the two elements for the development of optimal AONs for SMA therapy.
Intron 7 is considered a regulatory hot spot in exon 7 splicing18 as it harbors three negative SREs (ISS-N1, ISS+100, and 3′ splice site of exon 8) and three positive SREs (URC1, URC2, and Element 2) (Figure 1). While ISS-N1 has been observed to effect strong inhibition on exon 7 inclusion,13,19,20,21,22,23,24 the results here indicate that its effect is the strongest (Figures 3 and 5). While the relative strength between ISS+100 and 3′ splice site of exon 8 is less marked, the latter seems to be the stronger element—higher fold of full-length SMN transcripts was observed when the splice site was masked at low AON dosage (≤100 nmol/l) (Figure 3), and higher fold of full-length SMN transcripts and proteins, and more cells with nuclear GEMs were observed when the splice site was masked simultaneously with ISS-N1 than when ISS+100 was masked simultaneously with ISS-N1 (Figures 4–7). AON masking of ISS+100, which has not been reported hitherto, further validates its inhibitory effect on exon 7 inclusion.
Results from this study suggest that negative SREs at either intron 6 (Element 1) or exon 7 (ESS A and ESS B) are less potent (Supplementary Figure S1). Masking Element 1 by three different AONs (two novel and one previously published) failed to match the fold increase of full-length SMN transcripts induced when either elements in intron 7 or 3′ splice site of exon 8 was masked. The weak inhibitory effect of Element 1 corroborates earlier reports that AONs targeting Element 1 failed to augment full-length SMN transcripts,25 and that TIA1 bound to URC (positive SRE at intron 7; Figure 1) can easily counteracts the inhibitory effect of hnRNP 1 bound to Element 1.26 At exon 7 on the other hand, sandwiching of the ESE by ESS A and ESS B (Figure 1) could facilitate steric hindrance between splicing enhancer and inhibitor proteins27,28,29 for which the net effect on exon 7 splicing is counterintuitive. For examples, several AONs masking ESS A unexpectedly augmented exon 7 skipping,12 and as well as Dual-5 that masks ESS A and ESS B simultaneously. Hence, masking negative SREs in exon 7 may not be an optimal therapeutic strategy for the following reasons. An AON annealed to exon 7 may interfere with the protein translation of full-length SMN2 transcripts in the cytoplasm. Secondly, the sole positive SRE in exon 7 seems to be more critical in mediating exon 7 inclusion than those in intron 7—AONs whose target sites overlapped the ESE and either ESS A or ESS B augmented exon 7 skipping12,13 whereas target sites overlapping URC1 and ISS-N1 at intron 7 enhanced exon 7 inclusion19 (Figure 1). Due to close proximity, an AON bound to one of the negative SREs may interfere with the recruitment of splicing factors to the ESE, which could be a rate limiting step since Tra2β1 is downregulated in SMA patients.30 When Dual-5 binds to ESS A and ESS B, it possibly exerts steric hindrance against Tra2β1 recruitment and/or modifies the ESE motif secondary structure to an unfavorable conformation for Tra2β1 binding. Consequently, these factors greatly limit the space for further optimization of AONs. Finally, as a further evidence of the relative weak inhibitory strengths of negative SREs at intron 6 and exon 7, masking Element 1 or ESS A/B together with 3′ splice site of exon 8 failed to improve the fold increase of full-length SMN transcripts when only the latter was masked.14
Results from prior and current studies showed that simultaneous masking of two negative SREs either by dual-targeting or two separate AONs is not always more effective in inducing full-length SMN transcripts. In contrast, simultaneous masking of ISS-N1 and either ISS+100 or 3′ splice site of exon 8 further augmented the fold increase of full-length SMN transcripts and proteins over single masking of each element. The observed magnitudes of the augmentation are substantial which increased with AON dosage generally (Figure 5). Hence, this suggests that ISS-N1 albeit the strongest SRE could cooperate with the other two negative SREs, and does not solely dominate the net inhibitory effect on exon 7 inclusion(Supplementary Figure S4). This can explain the higher yield of full-length SMN transcripts induced from dual over single masking of SREs.
The inclination for ISS-N1 to cooperate with ISS+100 could be due to proximity and also structural arrangements where they enclose three positive SREs (Figure 1). That is, through the cooperation of specific proteins recruited to ISS-N1 or ISS+100, they could better counteract the positive SREs possibly by steric hindrance against splicing factors recruited to positive SREs,13,31,32 or by modifying the higher order structure of the positive SREs to impede recruitment of splicing factors18,32 such as via the hypothesized loop-out model.33 On the other hand, masking of ISS-N1 and 3′ splice site of exon 8 simultaneously could promote exon 7 inclusion via two complementary mechanisms – reducing competition from exon 6 in adjoining to exon 811,12,24 during the slow kinetics of exon 7 5′ splice site recognition by U1 snRNP,10,34 and promoting exon 7 recognition by splicing factors through the inhibition of ISS-N1. The observation that higher fold increase of full-length SMN transcripts was induced when ISS-N1 is masked together with 3′ splice site of exon 8 than with ISS+100 suggest that the poor definition of SMN2 exon 7, as a consequence of the C6T transition and the rate limiting recruitment of U1 snRNP to its 5′ splice site, as the underlying cause of endogenous exon 7 skipping. This could explain why pairing of N1-2 to either ex8-1 or ex8-2, which is not efficient individually (Supplementary Figure S1), can significantly augment exon 7 inclusion. Nevertheless, as AON efficiency correlates with target length,15,16 it is possible that the substantial increase in efficiency when either ex8-1 or ex8-2 is paired to N1-2 could be partially attributed to the extension of the formers' short sequences (≤18 bp).
In this study, a novel strategy in designing AON to mask two nonadjacent SREs simultaneously was explored and was subsequently demonstrated to be effective. The choice of synthesizing a dual-targeting AON over two AONs each masking a specific site is based on the consideration for clinical application. At a given AON dose, a dual-targeting AON can target twice the number of nascent mRNA than two single-targeting AONs; for e.g., 100 nmol/l of dual-targeting AONs is equivalent to 50 nmol/l of each single-targeting AON. Moreover, a dual-targeting AON is shorter (and thus cheaper) than the total length of two single-targeting AONs as the latter must adhered to a minimum length to avoid unspecific binding in the human genome. Although the two target sites of a dual-targeting AON are not adjacent, full complementary binding to the two sites is possible. This is because as the elongating nascent mRNA forms dynamic secondary structures, it can bring nonadjacent local segments of a RNA in proximity.35,36,37,38 In the case here, the sequence lengths between the two target sites are relatively short as compared to the nascent mRNA length of more than 28,000 bases; target sites from ISS-N1 to ISS+100 ≤ 65 bases and from ISS-N1 to 3′ splice site of exon 8 ≤ 410 bases. Therefore, a dual-targeting AON may increase the likelihood of masking both target elements simultaneously due to cooperative binding. That is, binding to the first target site could bring the dual-targeting AON near the other target site for the second binding event. This possibility is not apparent in single-targeting AONs. Nevertheless, not every molecule of the dual-targeting AONs will bind to two target sites simultaneously and some transcripts may have one AON bound to each target site. In this scenario, the advantages of dual-targeting AONs are negated. At 200 nmol/l, Dual-2 is 19% more efficient than the combination of N1-2 and ex8-2 (Supplementary Figure S5). It will be interesting and of translational value to validate the superiority of dual-targeting AONs in future studies through comparisons of more dual-targeting AONs with their corresponding mixture of single-targeting AONs over a wide range of AON concentrations.
As there are more than 100,000 splicing decisions occurring in a human cell,39 the complexity in the regulation of SMN2 exon 7 splicing is likely to be a common phenomenon.40,41 The use of AON to mask a specific SRE is an apt approach to investigate the influence of each SRE on the modulation of exon splicing. The key advantage over mutational studies using minigenes and competitive dosing of splicing proteins is it minimizes disruptions to the gene of study and the whole cell's splicing process. In particular, negative SREs can be masked by AONs to study inhibition of exon inclusion whereas positive SREs can be targeted to study inhibition of exon skipping.
Methods and Materials
Cell culture. Fibroblast cell line (GM03813) derived from a human donor with SMA type I and having two copies of the SMN2 gene, hereafter termed as SMA fibroblast cells, was obtained from Coriell (Camden, NJ) and used in transfection studies of the AONs. The SMA fibroblast cells were grown in Basal Fibroblast Medium (Promocell, Heidelberg, Germany) containing basic fibroblast growth factor and insulin, with 15% feral calf serum, 2 mmol/l L-Glutamine, 10% Penicillin/Streptomycin.
Transfection. AON transfection was performed using reagents according to the manufacturer's recommendations. In brief, 5 µl of Lipofectamine2000 (Invitrogen, Carlsbad, CA) was added to a round bottom tube and 95 µl of Opti-Mem reduced serum medium (Invitrogen). Ninety-eight microlitre of Opti-Mem reduced serum medium was mixed with 2 µl of AON in an eppendorf tube and allowed to stand for 5 minutes. This mixture was then added to the contents of the round bottom tube, mixed and allowed to stand for 30 minutes. This solution was topped up to 2 ml with Opti-Mem I reduced serum medium with 5% serum (i.e., the “transfection mixture”). To evaluate AON dose effect, transfection was carried out with AON concentrations of 25 nmol/l, 50 nmol/l, 100 nmol/l, and 200 nmol/l in the total of transfection mixture.
Twenty-four hours prior to transfection, the SMA fibroblast cells were seeded into 6 well plates. On the day of transfection, the cells were at a density of ~80%. After removal of culture medium, 2 ml aliquots of the transfection mixture containing the AON were added to separate wells and incubated for 5 hours. Thereafter, the transfection mixture was replaced by cell culture medium. Cells were harvested for RNA extraction at 24 hours, followed by total RNA extraction, reverse transcription polymerase chain reaction (RT-PCR) and Quantitative Real-time PCR (qPCR) to quantitate exon 7 inclusion.
RNA extraction. RNA was extracted using the Nucleospin RNA II kit (Macherey-Nagel, Düren, Germany) according to the manufacturer's recommendations. RNA concentration was measured with Nanodrop (Thermo Scientific, Wilmington, DE).
Reverse transcription polymerase chain reaction. Reverse transcription was performed with a SuperScript III cDNA synthesis kit (Invitrogen) according to the manufacturer's protocol, using an oligo(dT) primer. Primers for the PCR were: exon 6 forward primer 5′-accacctcccatatgtccag-3′ and exon 8 reverse primer 5′-tttgaagaaatgaggccagtt-3′. PCR cycling conditions were: 94 °C for 5 minutes; 35 cycles of 94 °C for 30 seconds (denaturation); 60 °C for 30 seconds (annealing); 72 °C for 1 minute (extension); 72 °C for 10 minutes and hold at 4 °C. The PCR amplicons were separated by standard gel electrophoresis. Image software was used for densitometry analysis of the separated PCR amplicons.
Quantitative Real-time PCR (qPCR) to evaluate dose effect of AON transfection concentration. Primers for the qPCR were: forward primer 5′-aatcaaaaagaaggaaggtgct-3′ corresponding a segment in exon 7 and reverse primer 5′- tttgaagaaatgaggccagtt-3′ corresponding to a segment in exon 8. The qPCR reaction mixture was prepared in optical tubes using the Roche Light Cycler DNA Master Plus Mix (Indianapolis, IN). The PCR was performed on a BioRad CFX96 Real Time PCR machine (Hercules, CA) with the cycling conditions: 94 °C 4 minutes; 38 cycles of 95 °C for 10 seconds (denaturation); 60 °C for 10 seconds (annealing), primer extension at 72 °C for 10 seconds (extension). Melting curve was performed from 65 °C to 95 °C. qPCR specificity was confirmed by 2% agarose gel using 10 μl of qPCR product. qPCRs were performed in triplicates for each AON treatment trial.
Protein extraction and western blotting. Upon AON transfection, cells were lysed with lysis buffer containing protease inhibitor cocktail (Promega, Fitchburg, WI) according to the manufacturer's instructions. The average concentration of protein in each sample was determined using the Bradford protein quantification method. The proteins in the samples were separated on 12% SDS-PAGE and electroblotted onto nitrocellulose membranes.
The membranes were probed for SMN protein with monoclonal anti-SMN antibody (BD Transduction Laboratories, San Jose, CA) at 1:1,000 dilution as the primary antibody. Monoclonal anti-α-tubulin antibody (Sigma, St Louis, MO) at 1:10,000 dilution was used to probe α-tubulin as a control. The secondary antibody was horseradish peroxidase-conjugated goat anti-mouse polyclonal antibody (BioRad, Hercules, CA) at a dilution of 1:5,000. Detection was performed with the ECL western blotting detection reagents (GE Healthcare, Pittsburgh, PA) and ECL Hyper film (GE Healthcare). Densitrometry analysis of the protein bands was performed using ImageJ software.
Immunofluorescence and Nuclear GEM quantification. SMA fibroblast cells were plated onto four chamber slides and transfected separately with various 100 nmol/l of AONs as described above. At 48 hours after addition of the transfection mixture, the cells were washed in phosphate-buffered saline, fixed with 4% paraformaldehyde for 15 minutes, blocked with 1 mg/ml bovine serum albumin and incubated with monoclonal anti-SMN antibody (BD Transduction Laboratories) as the primary anti-SMN antibody at a dilution of 1:50 or 1:100. The cells were washed to remove unbound antibody before incubation with secondary antibody Alexa Fluor 594 conjugated goat anti-mouse antibody (Invitrogen) at a dilution of 1:1,000. Nuclei were counterstained with DAPI. The cells were washed again and examined under confocal laser-scanning microscope Nikon A1 (Japan) for Gemini of coiled body (GEMs) counting. For each AON transfection, 120 consecutive cells were counted to determine the number of nuclear GEMs per cell while disregarding cytoplasmic GEMs.
A fibroblast cell line from a healthy SMA carrier individual (GM05758), also from Coriell, was also cultured for use as a control in the immunohistochemical studies. The cells were grown in DMEM with 15% feral calf serum, 2 mmol/l L-Glutamine, 10% Penicillin/Streptomycin.
SUPPLEMENTARY MATERIAL Figure S1. Percentage of amplicons with exon 7 inclusion estimated by densitometry analysis of inefficient AONs Figure S2. Representative immunofluorescence stained cells Figure S3. Table for nuclear GEMs counts Figure S4. Comparison of fold increase of full-length SMN transcripts induced by dual-targeting AONs with their respective single-targeting AONs Figure S5. Comparison of the efficiency of Dual-2 versus mixture of N1-2 and ex8-2
Supplementary Material
References
- Lefebvre S, Bürglen L, Reboullet S, Clermont O, Burlet P, Viollet L, et al. Identification and characterization of a spinal muscular atrophy-determining gene. Cell. 1995;80:155–165. doi: 10.1016/0092-8674(95)90460-3. [DOI] [PubMed] [Google Scholar]
- Lorson CL, Hahnen E, Androphy EJ, Wirth B. A single nucleotide in the SMN gene regulates splicing and is responsible for spinal muscular atrophy. Proc Natl Acad Sci USA. 1999;96:6307–6311. doi: 10.1073/pnas.96.11.6307. [DOI] [PMC free article] [PubMed] [Google Scholar]
- Cartegni L, Krainer AR. Disruption of an SF2/ASF-dependent exonic splicing enhancer in SMN2 causes spinal muscular atrophy in the absence of SMN1. Nat Genet. 2002;30:377–384. doi: 10.1038/ng854. [DOI] [PubMed] [Google Scholar]
- Kashima T, Manley JL. A negative element in SMN2 exon 7 inhibits splicing in spinal muscular atrophy. Nat Genet. 2003;34:460–463. doi: 10.1038/ng1207. [DOI] [PubMed] [Google Scholar]
- Singh NN, Androphy EJ, Singh RN. In vivo selection reveals combinatorial controls that define a critical exon in the spinal muscular atrophy genes. RNA. 2004;10:1291–1305. doi: 10.1261/rna.7580704. [DOI] [PMC free article] [PubMed] [Google Scholar]
- Lorson CL, Androphy EJ. An exonic enhancer is required for inclusion of an essential exon in the SMA-determining gene SMN. Hum Mol Genet. 2000;9:259–265. doi: 10.1093/hmg/9.2.259. [DOI] [PubMed] [Google Scholar]
- Feldkötter M, Schwarzer V, Wirth R, Wienker TF, Wirth B. Quantitative analyses of SMN1 and SMN2 based on real-time lightCycler PCR: fast and highly reliable carrier testing and prediction of severity of spinal muscular atrophy. Am J Hum Genet. 2002;70:358–368. doi: 10.1086/338627. [DOI] [PMC free article] [PubMed] [Google Scholar]
- McAndrew PE, Parsons DW, Simard LR, Rochette C, Ray PN, Mendell JR, et al. Identification of proximal spinal muscular atrophy carriers and patients by analysis of SMNT and SMNC gene copy number. Am J Hum Genet. 1997;60:1411–1422. doi: 10.1086/515465. [DOI] [PMC free article] [PubMed] [Google Scholar]
- Wirth B, Brichta L, Schrank B, Lochmüller H, Blick S, Baasner A, et al. Mildly affected patients with spinal muscular atrophy are partially protected by an increased SMN2 copy number. Hum Genet. 2006;119:422–428. doi: 10.1007/s00439-006-0156-7. [DOI] [PubMed] [Google Scholar]
- Singh NN, Singh RN, Androphy EJ. Modulating role of RNA structure in alternative splicing of a critical exon in the spinal muscular atrophy genes. Nucleic Acids Res. 2007;35:371–389. doi: 10.1093/nar/gkl1050. [DOI] [PMC free article] [PubMed] [Google Scholar]
- Lim SR, Hertel KJ. Modulation of survival motor neuron pre-mRNA splicing by inhibition of alternative 3' splice site pairing. J Biol Chem. 2001;276:45476–45483. doi: 10.1074/jbc.M107632200. [DOI] [PubMed] [Google Scholar]
- Hua Y, Vickers TA, Baker BF, Bennett CF, Krainer AR. Enhancement of SMN2 exon 7 inclusion by antisense oligonucleotides targeting the exon. PLoS Biol. 2007;5:e73. doi: 10.1371/journal.pbio.0050073. [DOI] [PMC free article] [PubMed] [Google Scholar]
- Hua Y, Vickers TA, Okunola HL, Bennett CF, Krainer AR. Antisense masking of an hnRNP A1/A2 intronic splicing silencer corrects SMN2 splicing in transgenic mice. Am J Hum Genet. 2008;82:834–848. doi: 10.1016/j.ajhg.2008.01.014. [DOI] [PMC free article] [PubMed] [Google Scholar]
- Madocsai C, Lim SR, Geib T, Lam BJ, Hertel KJ. Correction of SMN2 Pre-mRNA splicing by antisense U7 small nuclear RNAs. Mol Ther. 2005;12:1013–1022. doi: 10.1016/j.ymthe.2005.08.022. [DOI] [PubMed] [Google Scholar]
- Pramono ZA, Wee KB, Wang JL, Chen YJ, Xiong QB, Lai PS, et al. A prospective study in the rational design of efficient antisense oligonucleotides for exon skipping in the DMD gene. Hum Gene Ther. 2012;23:781–790. doi: 10.1089/hum.2011.205. [DOI] [PMC free article] [PubMed] [Google Scholar]
- Wee KB, Pramono ZA, Wang JL, MacDorman KF, Lai PS, Yee WC. Dynamics of co-transcriptional pre-mRNA folding influences the induction of dystrophin exon skipping by antisense oligonucleotides. PLoS ONE. 2008;3:e1844. doi: 10.1371/journal.pone.0001844. [DOI] [PMC free article] [PubMed] [Google Scholar]
- Coovert DD, Le TT, McAndrew PE, Strasswimmer J, Crawford TO, Mendell JR, et al. The survival motor neuron protein in spinal muscular atrophy. Hum Mol Genet. 1997;6:1205–1214. doi: 10.1093/hmg/6.8.1205. [DOI] [PubMed] [Google Scholar]
- Miyaso H, Okumura M, Kondo S, Higashide S, Miyajima H, Imaizumi K. An intronic splicing enhancer element in survival motor neuron (SMN) pre-mRNA. J Biol Chem. 2003;278:15825–15831. doi: 10.1074/jbc.M209271200. [DOI] [PubMed] [Google Scholar]
- Singh NK, Singh NN, Androphy EJ, Singh RN. Splicing of a critical exon of human Survival Motor Neuron is regulated by a unique silencer element located in the last intron. Mol Cell Biol. 2006;26:1333–1346. doi: 10.1128/MCB.26.4.1333-1346.2006. [DOI] [PMC free article] [PubMed] [Google Scholar]
- Porensky PN, Mitrpant C, McGovern VL, Bevan AK, Foust KD, Kaspar BK, et al. A single administration of morpholino antisense oligomer rescues spinal muscular atrophy in mouse. Hum Mol Genet. 2012;21:1625–1638. doi: 10.1093/hmg/ddr600. [DOI] [PMC free article] [PubMed] [Google Scholar]
- Osman EY, Yen PF, Lorson CL. Bifunctional RNAs targeting the intronic splicing silencer N1 increase SMN levels and reduce disease severity in an animal model of spinal muscular atrophy. Mol Ther. 2012;20:119–126. doi: 10.1038/mt.2011.232. [DOI] [PMC free article] [PubMed] [Google Scholar]
- Passini MA, Bu J, Richards AM, Kinnecom C, Sardi SP, Stanek LM, et al. Antisense oligonucleotides delivered to the mouse CNS ameliorate symptoms of severe spinal muscular atrophy. Sci Transl Med. 2011;3:72ra18. doi: 10.1126/scitranslmed.3001777. [DOI] [PMC free article] [PubMed] [Google Scholar]
- Hua Y, Sahashi K, Rigo F, Hung G, Horev G, Bennett CF, et al. Peripheral SMN restoration is essential for long-term rescue of a severe spinal muscular atrophy mouse model. Nature. 2011;478:123–126. doi: 10.1038/nature10485. [DOI] [PMC free article] [PubMed] [Google Scholar]
- Singh NN, Shishimorova M, Cao LC, Gangwani L, Singh RN. A short antisense oligonucleotide masking a unique intronic motif prevents skipping of a critical exon in spinal muscular atrophy. RNA Biol. 2009;6:341–350. doi: 10.4161/rna.6.3.8723. [DOI] [PMC free article] [PubMed] [Google Scholar]
- Baughan TD, Dickson A, Osman EY, Lorson CL. Delivery of bifunctional RNAs that target an intronic repressor and increase SMN levels in an animal model of spinal muscular atrophy. Hum Mol Genet. 2009;18:1600–1611. doi: 10.1093/hmg/ddp076. [DOI] [PMC free article] [PubMed] [Google Scholar]
- Singh NN, Seo J, Ottesen EW, Shishimorova M, Bhattacharya D, Singh RN. TIA1 prevents skipping of a critical exon associated with spinal muscular atrophy. Mol Cell Biol. 2011;31:935–954. doi: 10.1128/MCB.00945-10. [DOI] [PMC free article] [PubMed] [Google Scholar]
- Hofmann Y, Lorson CL, Stamm S, Androphy EJ, Wirth B. Htra2-beta 1 stimulates an exonic splicing enhancer and can restore full-length SMN expression to survival motor neuron 2 (SMN2). Proc Natl Acad Sci USA. 2000;97:9618–9623. doi: 10.1073/pnas.160181697. [DOI] [PMC free article] [PubMed] [Google Scholar]
- Hofmann Y, Wirth B. hnRNP-G promotes exon 7 inclusion of survival motor neuron (SMN) via direct interaction with Htra2-beta1. Hum Mol Genet. 2002;11:2037–2049. doi: 10.1093/hmg/11.17.2037. [DOI] [PubMed] [Google Scholar]
- Young PJ, DiDonato CJ, Hu D, Kothary R, Androphy EJ, Lorson CL. SRp30c-dependent stimulation of survival motor neuron (SMN) exon 7 inclusion is facilitated by a direct interaction with hTra2 beta 1. Hum Mol Genet. 2002;11:577–587. doi: 10.1093/hmg/11.5.577. [DOI] [PubMed] [Google Scholar]
- Helmken C, Hofmann Y, Schoenen F, Oprea G, Raschke H, Rudnik-Schöneborn S, et al. Evidence for a modifying pathway in SMA discordant families: reduced SMN level decreases the amount of its interacting partners and Htra2-beta1. Hum Genet. 2003;114:11–21. doi: 10.1007/s00439-003-1025-2. [DOI] [PubMed] [Google Scholar]
- Gladman JT, Chandler DS. Intron 7 conserved sequence elements regulate the splicing of the SMN genes. Hum Genet. 2009;126:833–841. doi: 10.1007/s00439-009-0733-7. [DOI] [PMC free article] [PubMed] [Google Scholar]
- Mayeda A, Krainer AR. Regulation of alternative pre-mRNA splicing by hnRNP A1 and splicing factor SF2. Cell. 1992;68:365–375. doi: 10.1016/0092-8674(92)90477-t. [DOI] [PubMed] [Google Scholar]
- Kashima T, Rao N, Manley JL. An intronic element contributes to splicing repression in spinal muscular atrophy. Proc Natl Acad Sci USA. 2007;104:3426–3431. doi: 10.1073/pnas.0700343104. [DOI] [PMC free article] [PubMed] [Google Scholar]
- Singh RN. Evolving concepts on human SMN pre-mRNA splicing. RNA Biol. 2007;4:7–10. doi: 10.4161/rna.4.1.4535. [DOI] [PubMed] [Google Scholar]
- Eperon LP, Graham IR, Griffiths AD, Eperon IC. Effects of RNA secondary structure on alternative splicing of pre-mRNA: is folding limited to a region behind the transcribing RNA polymerase. Cell. 1988;54:393–401. doi: 10.1016/0092-8674(88)90202-4. [DOI] [PubMed] [Google Scholar]
- Nowakowski J, Shim PJ, Prasad GS, Stout CD, Joyce GF. Crystal structure of an 82-nucleotide RNA-DNA complex formed by the 10-23 DNA enzyme. Nat Struct Biol. 1999;6:151–156. doi: 10.1038/5839. [DOI] [PubMed] [Google Scholar]
- Kramer FR, Mills DR. Secondary structure formation during RNA synthesis. Nucleic Acids Res. 1981;9:5109–5124. doi: 10.1093/nar/9.19.5109. [DOI] [PMC free article] [PubMed] [Google Scholar]
- Repsilber D, Wiese S, Rachen M, Schröder AW, Riesner D, Steger G. Formation of metastable RNA structures by sequential folding during transcription: time-resolved structural analysis of potato spindle tuber viroid (-)-stranded RNA by temperature-gradient gel electrophoresis. RNA. 1999;5:574–584. doi: 10.1017/s1355838299982018. [DOI] [PMC free article] [PubMed] [Google Scholar]
- Nilsen TW, Graveley BR. Expansion of the eukaryotic proteome by alternative splicing. Nature. 2010;463:457–463. doi: 10.1038/nature08909. [DOI] [PMC free article] [PubMed] [Google Scholar]
- Pagani F, Raponi M, Baralle FE. Synonymous mutations in CFTR exon 12 affect splicing and are not neutral in evolution. Proc Natl Acad Sci USA. 2005;102:6368–6372. doi: 10.1073/pnas.0502288102. [DOI] [PMC free article] [PubMed] [Google Scholar]
- López-Bigas N, Audit B, Ouzounis C, Parra G, Guigó R. Are splicing mutations the most frequent cause of hereditary disease. FEBS Lett. 2005;579:1900–1903. doi: 10.1016/j.febslet.2005.02.047. [DOI] [PubMed] [Google Scholar]
- Miyajima H, Miyaso H, Okumura M, Kurisu J, Imaizumi K. Identification of a cis-acting element for the regulation of SMN exon 7 splicing. J Biol Chem. 2002;277:23271–23277. doi: 10.1074/jbc.M200851200. [DOI] [PubMed] [Google Scholar]
- Monani UR, Lorson CL, Parsons DW, Prior TW, Androphy EJ, Burghes AH, et al. A single nucleotide difference that alters splicing patterns distinguishes the SMA gene SMN1 from the copy gene SMN2. Hum Mol Genet. 1999;8:1177–1183. doi: 10.1093/hmg/8.7.1177. [DOI] [PubMed] [Google Scholar]
- Dickson A, Osman E, Lorson CL. A negatively acting bifunctional RNA increases survival motor neuron both in vitro and in vivo. Hum Gene Ther. 2008;19:1307–1315. doi: 10.1089/hum.2008.067. [DOI] [PMC free article] [PubMed] [Google Scholar]
Associated Data
This section collects any data citations, data availability statements, or supplementary materials included in this article.