Abstract
Integrin signaling network is responsible for regulating a wide variety of fundamental biological processes ranging from cell survival to cell death. While individual components of the network have been studied through experimental and computational methods, the network robustness and the flow of information through the network have not been characterized in a quantitative framework. Using a probability based model implemented through GRID computing, we approach the reduced signaling network and show that the network is highly robust and the final stable steady state is independent of the initial configurations. However, the path from the initial and the final state is intrinsically dependent on the state of the input nodes. Our results demonstrate a rugged funnel-like landscape for the signaling network where the final state is unique, but the paths are dependent on initial conditions.
INTRODUCTION
Integrins are bidirectional signaling and adhesion receptors that not only act as both antennas and receptors but also influence fundamental cell biological processes ranging from development to disease.1, 2, 3, 4, 5, 6, 7 The role of integrins in altered adhesion, migration, and metastasis during cancer has been well established through a variety of in vivo, in vitro, and in silico models.8, 9, 10, 11, 12 The formation of integrin clusters and the mechanical and biochemical consequences of forming focal adhesions and focal contacts have also resulted in improved understanding of cell-matrix interactions.13, 14, 15, 16, 17, 18, 19 Together the biochemical characterization of integrins and the transduction of mechanical signals through these heterodimeric receptors have resulted in integrins becoming a key target for regulation of fundamental biological processes.
The activity of integrins results from both mechanical and chemical stimulations. In addition, their ability to convert mechanical and chemical information from inside and outside the cell to measurable responses rests on the function of the complex signaling network.20 While a number of individual components of this network have been characterized, the complexity of the entire network has only been appreciated recently.21 With the advent of high throughput assays and systems biological approaches, quasithermodynamics of large networks has been characterized to some extent.22 However, a number of key questions regarding the flow of information and the robustness of the integrin network remain elusive. These aspects of the signaling pathway are critical for two main reasons. First, they will provide information on the organization and structure of the network and its ability to transmit information as a function of its nodes and links. Second, analyzing the network will allow for identification of potential targets and bottlenecks that will create opportunities for specific targeting, which are desirable for specific therapeutic, biotechnological, or intervention purposes.
In this paper, we utilize a computational model rooted in previous studies of robustness of other biological networks,22, 23, 24, 25, 26 implemented via distributed computing (via Berkeley Open Infrastructure for Network Computing or BOINC) and executed over the internet to characterize the robustness of the integrin signaling network. The main goal of our study is to study the input output relationship between various nodes to better characterize the flow of information through the network. Our results quantitatively address how the availability or unavailability of individual nodes affects this flow and what information can be derived from analyzing the flux through the network.
PROBABILITY MODEL
The integrin signaling network has been characterized in various recent studies. In this paper, however, we focus on a reduced network due to computational limitations. While our focus is on a smaller core network, given sufficient computational resources, our method can be applied to a larger network. In addition, our results are quite general and would not be affected by the addition of additional nodes and links.
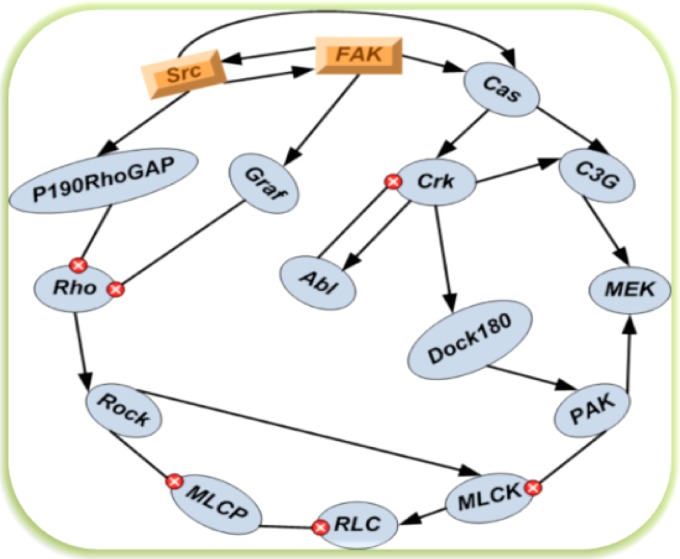
We considered a network graph with nodes, each of which could has positive or negative influences on each other. The network contains the nodes Abl, C3G, Cas, Crk, DOCK180, Graf, MEK, MLCK, MLCP, P190RhoGAP, PAK, RLC, ROCK, Rho, Src, and FAK, labeled in that order, and the graph of this network is shown in Fig. 1. This network is based on previously published networks of integrin signaling.
Figure 1.

The 16 nodes integrin signaling network scheme. The relationship between each pair shows either the positive activating regulations (represented by arrow) or the negative suppressing regulations (represented by inhibition symbol  ). The 3D nodes FAK and Src are significant nodes demonstrated by the experiments.
The network graph consists of a set of directed connections, from one node to another, representing the influence of each node on the others. We considered the possibility of this influence being only either positive , negative (−1), or none (0). This network graph can then be described by an relationship matrix A, where each element describes the influence on node i by node j and can have a value of , −1, or 0.
As a simplification, we considered that each node could only be either fully on or off and considered a set of states representing each possibility of each node being either on or off. Thus, there are then distinct states of the network, where N is the number of the interacting nodes in the cell signaling network. Then the bit pattern of the binary expansion of the state index indicates the on/off status of each node in that state.
We consider the probability of each possible state. These can be represented by a element vector P with the constraint of the normalized condition . In order to study the evolution of this probability vector, we thus need to describe the probability of each state transitioning to each other state. These probabilities are expressed as a matrix T, where each element represents the probability rate of state i transitioning to state j. The evolution of the probabilities can then be written as
| (1) |
The change in probability of being in state i is the sum of the probabilities of all other states transitioning to state i minus the sum of the probabilities of state i transitioning to all other states. Equation 1 is discretized in time steps and rewritten as the matrix equation
| (2) |
Here the superscript and n denote the adjacent time steps. The evolution matrix M reduced from general Eq. 1 represents in the diagonal and off-diagonal elements
| (3) |
where is the discrete time step.
To determine the transition probabilities , we make the simplifying assumption that each node transitions independently. As the bit patterns of the state indices correspond to the on/off status of the nodes, we can then express as a product of N terms for the probability of the corresponding change (or no change) in the node status implied by the indices. Next, we consider the input for each node in the source state to determine the probability for each individual bit change (or not) based on the network diagram. We consider two cases for evaluating the bit change probability: One where there is some input for the node and one where there is not.
To determine the input for each node, for each source state, we considered the nodes that are on for the state based on the bit pattern of the state index, and summed the network influence for these nodes, so
where is the bit in the binary expansion of the state index and is the element in the network relationship matrix A. When there is input for the node, we use a transition probability of for the bit i change probability. The sign is determined by the bit of the final state, + when the bit i is on and − when the bit i is off. This results in positive inputs tending to turn the node on and negative inputs tending to turn the node off. μ is a parameter that controls the width of the switching function, which models as the reaction rate. Some care is required in evaluating this switching function, as the arguments to tanh may be so large that to machine precision, it equals exactly 1.0, and the subtraction can lose all precision. Therefore, this function is expressed in terms of , which can be computed without precision problems as .
When there is no input for the node, instead of using the transition probability of 0.5 implied by the switching function, we take that the node will flip with probability c, where c is a parameter. Depending on whether the values implied a change in the bit state, the transition probability could be either c (for a change in bit state) or (for no change in bit state).
Before the numerical computation, some rigid mathematical notes need careful scrutiny based on this probability model. In the following section, we will show that the iterations are always convergent to one unique final steady state no matter what initial conditions we take.
Gershgorin circle theorem
Let A be a complex matrix with entries . For write , where denotes the absolute value of . Let be the closed disk centered at with radius . Every eigenvalue of A lies within at least one of the Gershgorin disks .
For evolution matrix in Eq. 3, and . So every eigenvalue λ of M lies within at least one of , which is located within the unit disks. Then only a real eigenvalue one is on the unit circle, and all other eigenvalues constrain inside the circle.
Every initial probability vector can be expressed as the linear combination of the eigenvectors of matrix M. After n time iterations on the initial states, we derive the probability vector on ,
| (4) |
Apparently, if the absolute value of the eigenvalues is smaller than one, all the terms involved with will disappear. So only the term with the eigenvalue one is left,
the normalized condition on P values α. Actually, we take all the eigenvectors are normalized, then . The final steady state is always convergent to the eigenvector with the eigenvalue equal to one.
COMPUTATIONAL METHOD
We considered several sets of parameters, one set with and various values of μ and one with and various values of c. In addition, we considered 17 different initial conditions, one with all states having equal probability and 16, one for each node, with the state with the node on and all other nodes off having probability 1.0 and all other states having probability 0.0.
Each parameter set and initial condition were an independent calculation that could be run in parallel. However the creation of the matrix M costs 16 Gbytes of memory for our 16 nodes cell signaling network; thus it is a memory-intensive computational task. To overcome this challenge, we set up a volunteer distributed computing system to execute the set of jobs using the open-source BOINC system. We called the system “CELS@Home” or “cellular environment in living systems at home.” Volunteers connected to our server CELS@Home and downloaded an executable program to run the job along with input data files. When the program was complete, the resulting output file was uploaded back to the server, and the volunteer was assigned a number of credits for the completed job.
As the entire computation was too large for a practical job for volunteers, the full set of iterations was split into pieces of 20 iterations, followed by a computation of the entropy production rate. Each such set of iterations, for particular parameter values and initial condition, was assigned to multiple volunteers, typically at least four. The duplication allowed both the verification of results, which was necessary as we could not control the environment on which each job was run and so guarantee correctness, and also the enhanced overall rate of the calculation, as the first two valid returned results were sufficient to start the next set of iterations.
Periodically, the duplicate returned jobs were checked for results that were equivalent. If multiple equivalent jobs were found, one was randomly selected as the canonical result and used to spawn another set of iterations. To determine equivalency, we required that the relative error between all components of the state vector be or less, and we also required that the recorded execution time be different. The execution time check was intended to stop any attempt at fraudulently submitting the same result file twice.
Some specific issues presented themselves as a result of the use of volunteer distributed computing. Since we could not control the environment on which the program executed, we could not absolutely trust the results. Besides the possibility of simple errors, it was also possible that a volunteer might intentionally submit false results. This necessitated the redundancy and validation steps. Also, since we depended on volunteers for computing power, it was important to maintain interest in continuing to work on the project. Some important aspects of this were equitable assignment of credits for jobs, that the client program be able to save its state periodically so that it could be suspended and restarted without a large loss of work, that we provided a graphics program that showed the status of the computation, and that the server provided message boards that the volunteers could use to communicate with the project developers and each other.
The client program to execute the iterations was written in C++ for MICROSOFT WINDOWS, while programs to process the result files on the server were written in Python and used MATPLOTLIB to generate graphs of the results in order to monitor the progress of the iteration. Random selection was done with the MERSENNE TWISTER pseudorandom number generator, seeded by default with the system clock.
Our data files were structured as text XML files compressed with ZLIB. The bulk of the data was the representation of the state vector, but the file also included various statistics about each completed iteration, the parameters and network graph used, a history of the iterations performed, and other comments. Both input and output files used the same file format. The use of compressed files made it easy to detect and reject corrupted files, as these usually could not be uncompressed and so was clearly identifiable.
RESULTS AND DISCUSSION
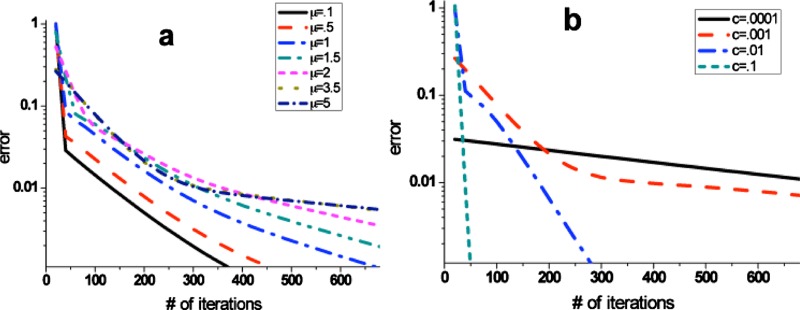
Because the BOINC infrastructure bases on diversified computers, the convergence check is important to guarantee the algorithm and computational results reasonable. The matrix Eq. 2 iterates for large c values (0.1, 0.01) until convergence to machine precision and for smaller c values for 1900 iterations at which point had not yet converged to machine precision. Figure 2 illustrates the convergence of the algorithm running over the bundles of different parameters μ and c. It shows that the convergence rate depends highly on c; the calculation converges quickly for large c and slowly for small c, while the convergence depends weakly on μ with faster convergence for small μ, but the effect is not nearly as strong as with c. The strong dependence on parameter c reflects the states without input determine the convergent rate. The probability on these states is reluctant to change when c is small, so it spends a longer time to convert these states to the final steady states.
Figure 2.
The error norm between two adjacent iterations gradually decays into zero when it comes close to the final steady state. (a) The smaller switching speed μ increases the convergent rate a little. (b) The value of c greatly changes the convergent behavior.
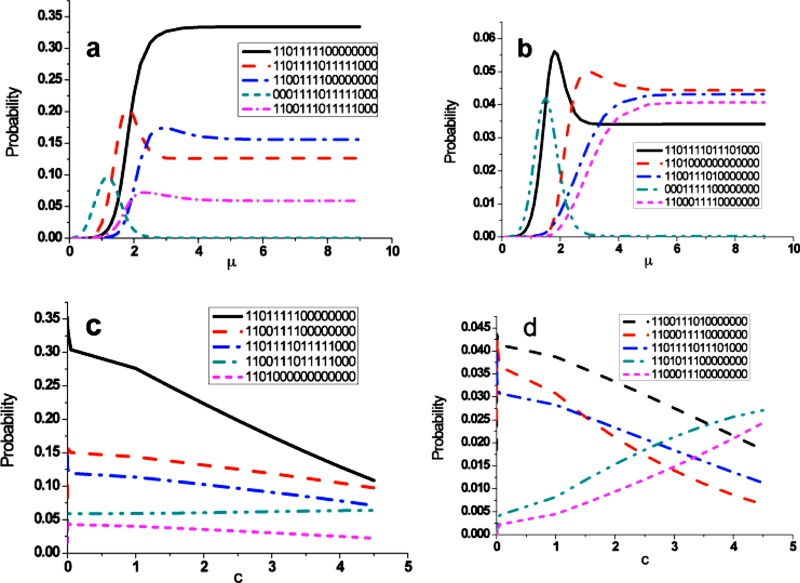
The ability of the model to understand the typical pattern in the final states in response to the model-specific parameters μ and c is a key point in this paper. The μ in the formula of transition probability represents the transition rate from on(off) to off(on), which is the function of the rate constants. Because the limited information for the model-specific parameter μ, we focus on the relative effects of different values on kinetics and magnitude so that the conclusions drawn are valid regardless of the specific phenomenological constants used. Here the parameter c models the effect of self-degradation, which normally is a very small positive number. All other states transit into the nondegradation states and are stable in these states in the final states without the self-degradation effect, which makes the iteration really slow as we demonstrated in Fig. 2b. The parameter dependent behavior of the most likely probabilities (top ten) in the final steady states is concluded in Fig. 3. The nodes in cell signaling network flip-flops in order to evolve the whole network into the optimal performance. Too frequent switching nodes from 1(0) to 0(1) zeros the transitions for 1(0) to 1(0), while the slow switching nodes do the opposite way. So we expect there are peak probabilities. Before that, the probabilities exponentially grow due to the large transition time . After that the probabilities approach the optimal values. Comparing to μ saturation and accumulation effect, there is no obvious evidence that c will approach to the saturation or accumulation in our simulation. Our work demonstrated that adjusting μ can control the activation/deactivation dynamics for different nodes. However, we also notice that pattern of nodes in likely states exists for c variation under the following scenarios:
-
(1)
Abl, C3G, Cas, Graf, MEK P190RhoGap, Src, FAK—all “on;”
-
(2)
Rho—“off;” and
-
(3)
Crk, Dock180, MLCK, MLCP, PAK, RLC, ROCK—“indeterminate.”
Figure 3.
The most likely probability states demonstrate their characteristics under the exogenous conditions c and μ. In (a) and (b) μ peaks the probability curve at an intermediary value, then decays into the stable states. The μ accumulation and saturation affect the parameter dependent behavior of the cell signaling greatly. (c) and (d) show the parameter c dependent. Unlike dependence on μ, the probabilities monotonously decrease or increase a bit.
The robust pattern survives the cell signaling network against self-degradation, which is important property under certain physiology environments. In addition to the probability evolution, we calculated the entropy of each state in the Shannon entropy formulation, which can show underlying complexity information for the whole states,
| (5) |
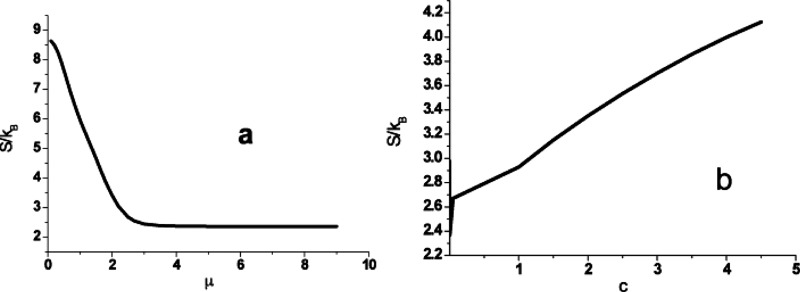
Here is the Boltzmann constant. The simulation initially starts from the equally distributed probabilities and then maximizes the degree of the complexity in the initial time. Therefore, the system entropy decreases from initial values to approach the final states dependent on and μ and c; the corresponding free energy consumes in this process simultaneously. Too frequent switching nodes from 1(0) to 0(1) zero the transitions from 1(0) to 1(0) but lower the entropy further (Fig. 4). However, any transition from 1(0) to 1(0) contributes nothing to the entropy. That explains why the high μ [the 1(0) to 0(1) transitions are preferred] reduces to the small complexity (entropy). Physiologically, the cell signaling network appears more regular in the high μ regimes. We also note that self-degradation changes the entropy but not significantly. No evidence of saturation exists across the spectrum of parameter c as was explored in the numerical experiment. In our probability model, the different initial probabilities on nodes lost their history in the cell signaling process. The final steady states as we proved above always have the identical final states independent on the initial values. However, the path connecting the initial states to the final states strongly depends on the initial condition. So it is more attractive to explore the statistical properties on the time path, such quantities as the entropy, free energy, and dependence test function.
Figure 4.
The entropy curve shows in the parameter (a) μ and (b)c. Only from 1(0) to 0(1) transitions contribute to the amount of entropy, while from 1(0) to 1(0) transitions keep entropy constant except the self-degradation.
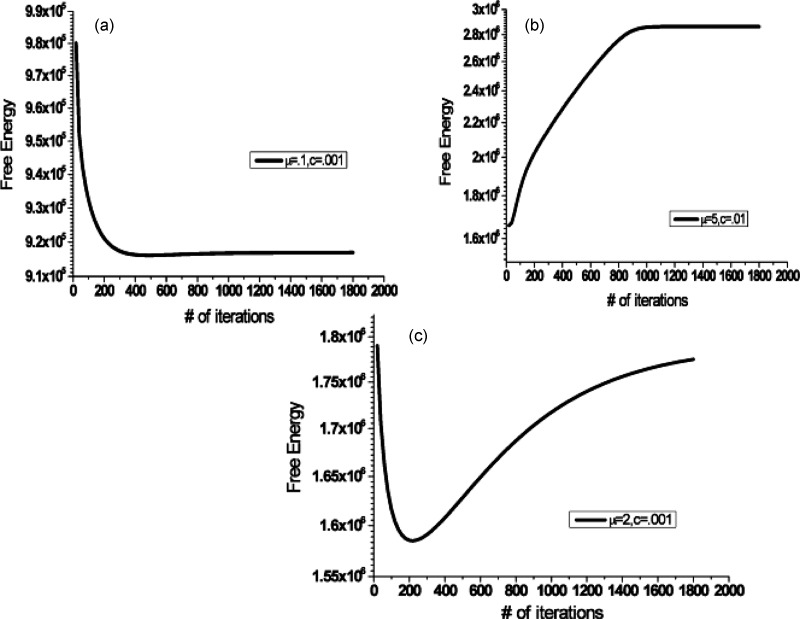
Experimentally, the cell signaling network works in the thermal bath with the temperature T. So the free energy is a key function of state in this isothermal system,
| (6) |
Figure 5 demonstrates the free energy curves at different times. Only three typical free energy curves are found in our simulation: Well potential, downhill, and uphill potentials, corresponding to that the free energy curve creates a minimum in middle, at final, and at the beginning. From the point view of energy, the thermal equilibrium state minimizes the free energy of system. However, our cell signaling network has no energy constraints with infinite energy inputs. Actually, the network stops continuing to move forward when it reaches the minimum of free energy; then the system will oscillate around the minimum as the balanced states. Therefore, only the downhill potential will approach the final steady state, while the uphill potential resists any change in the initial states, and the well potential oscillates around the bottom of free energy.
Figure 5.
The free energy plots separate into three categories: (a) downhill potential, (b) uphill potential, and (c) potential well. The potential curves strongly depend on where you started your computation. The free energy normalized by in the graph.
CONCLUSIONS
In this paper, we present a first study of the quantification of various states comprising the integrin signaling network. The execution of the analytical approach through a GRID computing framework allowed us to quantify various aspects of network information flow.
The results of our analysis of the reduced integrin signaling network suggest two key features. First, we note that the integrin signaling network is highly robust. The final state of the network remains the same regardless of the initial states. Robustness of networks has been described as a property that allows the system to retain its function despite internal and external perturbations.27, 28, 29 We note that our network leads to the same final state, which may correspond to a specific function, regardless of the initial conditions. Yet at the same time, the network is highly dynamic as the paths connecting the initial and the final states depend highly on the initial condition. This result is also of significant interest to the systems biology community, as it is the structure of network connectivity, not rate constants, that dictates the evolution and sustainability of robust networks.27, 30 Examples of such robust networks that operate over a wide range of binding kinetics include λ-phage,31 chemotaxis,32 and embryogenesis in D. melanogaster.33 Thus one can conceive the energy landscape of the integrin signaling network to be similar to a rugged funnel-like where the final states are unique but the paths leading to the final state are dependent on the initial conditions. This is similar to the results obtained previously for MAPK network24, 26 and the cell-cycle network.23 Our result underscores the robustness of the network and will hopefully lead to a better insight about the evolution of the network. While our study focused primarily on a reduced network, we believe that the network probed in this study represents the core of the larger signaling network and will have similarities with a much larger network behavior.
It is our hope that future experimental and computational studies will focus on rigorously testing the predictions of our study and will probe in even more detail the robustness of the network through mutational and siRNA knockdown studies.
ACKNOWLEDGMENTS
M.H.Z. gratefully acknowledges the support of Robert A. Welch Foundation and the thousands of users of the CELS@Home server who contributed their precious time in carrying out this study.
References
- Hynes R. O., Lively J. C., McCarty J. H., Taverna D., Francis S. E., Hodivala-Dilke K., and Xiao Q., Cold Spring Harb Symp. Quant Biol. 67, 143 (2002). 10.1101/sqb.2002.67.143 [DOI] [PubMed] [Google Scholar]
- Hynes R. O. and Zhao Q., J. Cell Biol. 150, F89 (2000). 10.1083/jcb.150.2.F89 [DOI] [PubMed] [Google Scholar]
- DeSimone D. W., Stepp M. A., Patel R. S., and Hynes R. O., Biochem. Soc. Trans. 15, 789 (1987). [DOI] [PubMed] [Google Scholar]
- Clark E. A., King W. G., Brugge J. S., Symons M., and Hynes R. O., J. Cell Biol. 142, 573 (1998). 10.1083/jcb.142.2.573 [DOI] [PMC free article] [PubMed] [Google Scholar]
- Hynes R. O., Cell 48, 549 (1987). 10.1016/0092-8674(87)90233-9 [DOI] [PubMed] [Google Scholar]
- Hynes R. O., Cell 110, 673 (2002). 10.1016/S0092-8674(02)00971-6 [DOI] [PubMed] [Google Scholar]
- Hynes R. O., Cell 69, 11 (1992). 10.1016/0092-8674(92)90115-S [DOI] [PubMed] [Google Scholar]
- Juliano R. L. and Varner J. A., Curr. Opin. Cell Biol. 5, 812 (1993). 10.1016/0955-0674(93)90030-T [DOI] [PubMed] [Google Scholar]
- Park C. C., Zhang H. J., Yao E. S., Park C. J., and Bissell M. J., Cancer Res. 68, 4398 (2008). 10.1158/0008-5472.CAN-07-6390 [DOI] [PMC free article] [PubMed] [Google Scholar]
- Felding-Habermann B., O’Toole T. E., Smith J. W., Fransvea E., Ruggeri Z. M., Ginsberg M. H., Hughes P. E., Pampori N., Shattil S. J., Saven A., and Mueller B. M., Proc. Natl. Acad. Sci. U.S.A. 98, 1853–1858 (2001). 10.1073/pnas.98.4.1853 [DOI] [PMC free article] [PubMed] [Google Scholar]
- Hannigan G., Troussard A. A., and Dedhar S., Nat. Rev. Cancer 5, 51 (2005). 10.1038/nrc1524 [DOI] [PubMed] [Google Scholar]
- Heino J., Ann. Med. 25, 335 (1993). 10.3109/07853899309147294 [DOI] [PubMed] [Google Scholar]
- Li S., Guan J. L., and Chien S., Annu. Rev. Biomed. Eng. 7, 105 (2005). 10.1146/annurev.bioeng.7.060804.100340 [DOI] [PubMed] [Google Scholar]
- Schwarz U. S., Balaban N. Q., Riveline D., Bershadsky A., Geiger B., and Safran S. A., Biophys. J. 83, 1380 (2002). 10.1016/S0006-3495(02)73909-X [DOI] [PMC free article] [PubMed] [Google Scholar]
- Kornberg L., Earp H. S., Parsons J. T., Schaller M., and Juliano R. L., J. Biol. Chem. 267, 23439 (1992). [PubMed] [Google Scholar]
- Geiger B., Science 294, 1661–1663 (2001). 10.1126/science.1066919 [DOI] [PubMed] [Google Scholar]
- Novak I. L., Slepchenko B. M., Mogilner A., and Loew L. M., Phys. Rev. Lett. 93, 268109 (2004). 10.1103/PhysRevLett.93.268109 [DOI] [PubMed] [Google Scholar]
- Guan J. L., Matrix Biol. 16, 195 (1997). 10.1016/S0945-053X(97)90008-1 [DOI] [PubMed] [Google Scholar]
- Balaban N. Q., Schwarz U. S., Riveline D., Goichberg P., Tzur G., Sabanay I., Mahalu D., Safran S., Bershadsky A., Addadi L., and Geiger B., Nat. Cell Biol. 3, 466 (2001). 10.1038/35074532 [DOI] [PubMed] [Google Scholar]
- Harburger D. S. and Calderwood D. A., J. Cell Sci. 122, 159 (2009). 10.1242/jcs.018093 [DOI] [PMC free article] [PubMed] [Google Scholar]
- Zaidel-Bar R., Itzkovitz S., Ma'ayan A., Iyengar R., and Geiger B., Nat. Cell Biol. 9, 858 (2007). 10.1038/ncb0807-858 [DOI] [PMC free article] [PubMed] [Google Scholar]
- Wang J., Huang B., Xia X., and Sun Z., PLOS Comput. Biol. 2, e147 (2006). 10.1371/journal.pcbi.0020147 [DOI] [PMC free article] [PubMed] [Google Scholar]
- Han B. and Wang J., Biophys. J. 92, 3755 (2007). 10.1529/biophysj.106.094821 [DOI] [PMC free article] [PubMed] [Google Scholar]
- Wang J., Huang B., Xia X., and Sun Z., Biophys. J. 91, L54 (2006). 10.1529/biophysj.106.086777 [DOI] [PMC free article] [PubMed] [Google Scholar] [Retracted]
- Wang J., Zhang K., and Wang E., J. Chem. Phys. 129, 135101 (2008). 10.1063/1.2985621 [DOI] [PubMed] [Google Scholar]
- Lapidus S., Han B., and Wang J., Proc. Natl. Acad. Sci. U.S.A. 105, 6039 (2008). 10.1073/pnas.0708708105 [DOI] [PMC free article] [PubMed] [Google Scholar]
- Kitano H., Nat. Rev. Genet. 5, 826 (2004). 10.1038/nrg1471 [DOI] [PubMed] [Google Scholar]
- Kitano H., Mol. Syst. Biol. 3, 137 (2007). 10.1038/msb4100179 [DOI] [PMC free article] [PubMed] [Google Scholar]
- Kitano H., Ernst Schering Research Foundation Workshop 69 (2007). [DOI] [PubMed] [Google Scholar]
- Barkai N. and Leibler S., Nature 387, 913-7 (1997). [DOI] [PubMed] [Google Scholar]
- Little J. W., Shepley D. P., and Wert D. W., EMBO J. 18, 4299 (1999). 10.1093/emboj/18.15.4299 [DOI] [PMC free article] [PubMed] [Google Scholar]
- Yi T. M., Huang Y., Simon M. I., and Doyle J., Proc. Natl. Acad. Sci. U.S.A. 97, 4649 (2000). 10.1073/pnas.97.9.4649 [DOI] [PMC free article] [PubMed] [Google Scholar]
- von Dassow G., Meir E., Munro E. M., and Odell G. M., Nature (London) 406, 188 (2000). 10.1038/35018085 [DOI] [PubMed] [Google Scholar]


