Endosperm starch synthesis pathway is a major target of indirect selection in global wheat breeding for higher yield.
Abstract
Spike number per unit area, number of grains per spike, and thousand kernel weight (TKW) are important yield components. In China, increases in wheat (Triticum aestivum) yields are mainly due to increases in grain number per spike and TKW. TKW mainly depends on starch content, as starch accounts for about 70% of the grain endosperm. Sucrose synthase catalysis is the first step in the conversion of sucrose to starch, that is, the conversion of sucrose to fructose and UDP-glucose by the wheat sucrose synthase genes (TaSus1 and TaSus2) that are located on chromosomes 7A/7B/7D and 2A/2B/2D, respectively. A total of 1,520 wheat accessions were genotyped at the six loci. Two, two, five, and two haplotypes were identified at the TaSus2-2A, TaSus2-2B, TaSus1-7A, and TaSus1-7B loci, respectively. Their main variations were detected within the introns. Significant differences between the haplotypes correlated with TKW differences among 348 modern Chinese cultivars from the core collection. Frequency changes for favored haplotypes showed gradual increases in cultivars released since beginning of the last century in China, Europe, and North America. Geographic distributions and time changes of favored haplotypes were characterized in six major wheat production regions worldwide. Strong selection bottlenecks to haplotype variations occurred at polyploidization and domestication and during breeding of wheat. Genetic-effect differences between haplotypes at the same locus influence the selection time and intensity. This work shows that the endosperm starch synthesis pathway is a major target of indirect selection in global wheat breeding for higher yield.
Wheat (Triticum aestivum) is one of the most important staple food crops in the world. The wheat cultivation area has remained more or less stable over the last 20 years. Increased production of about one-sixth above that in 1992 was mainly due to per year per unit area yield increases (http://www.ers.usda.gov/data-products/wheat-data.aspx#.UvtxFrLs64Q). Yield increases in China show a similar trend; however, in the past 5 years, per unit increases per year in yield may have declined slightly.
Yield dissection is very difficult. For a long time, quantitative trait loci mapping was commonly used in major crops such as rice (Oryza sativa), durum wheat (Triticum durum), and hexaploid wheat (Olmos et al., 2003; Mohan et al., 2009; Xing and Zhang, 2010). The disadvantage of quantitative trait loci mapping is that it takes a long time and is costly. Association analysis based on “hitchhiking” effects is an effective way to dissect important complex traits (Flint-Garcia et al., 2003; Zhang et al., 2007). Marker association, especially haplotype association analysis, accelerates the process of mapping and detection of important genomic regions and favored alleles or haplotypes for breeding (Barrero et al., 2011).
Yield in wheat is made up of three components: number of fertile spikes per unit area, grains per spike, and kernel weight usually expressed as thousand kernel weight (TKW). In China, wheat yield growth has mainly depended on increases in grain number per spike and TKW (Wang et al., 2012; Zhang et al., 2012). As starch accounts for about 70% of the dry grain weight (Dale and Housley, 1986), the rate and amount of starch synthesis should have significant effects on TKW.
Starch synthesis has been well documented in many plants. The enzyme Suc synthase (SUS) converts Suc to starch. Starch is located in the cytosol (Kleczkowski et al., 2010). SUS also plays key roles in fruit and seed maturation (Coleman et al., 2010; Jiang et al., 2011) and abiotic stress tolerance (Bologa et al., 2003; Yang et al., 2004; Bieniawska et al., 2007).
There are at least six SUS genes in Arabidopsis (Arabidopsis thaliana), rice, and Populus tomentosa (Bieniawska et al., 2007; Hirose et al., 2008). In maize (Zea mays), the paralogous genes Shrunken1 and SUS1 encode the SUS1 and SUS2 isozymes of Suc synthase (Chourey et al., 1998). Similar genes are present in barley (Hordeum vulgare) and wheat. In wheat, TaSus2 is located on homeologous group 2 chromosomes (Jiang et al., 2011). Three single nucleotide polymorphisms (SNPs) in TaSus2-2B form two haplotypes, Hap-H and Hap-L. Hap-H, the favored haplotype associated with higher TKW, underwent strong positive selection in Chinese wheat breeding as a consequence of selection for higher grain yield (Jiang et al., 2011).
In this study, the loci TaSus1 and TaSus2 encoding wheat Suc synthases were genotyped. Two, two, five, and two haplotypes were identified at TaSus2-2A, TaSus2-2B, TaSus1-7A, and TaSus1-7B, respectively. No variation was detected at TaSus2-2D or TaSus1-7D. The influence of these haplotypes on TKW was analyzed through haplotype association, and five favored haplotypes were identified. Their frequencies of change over the last century of worldwide breeding were tracked in 1,520 common wheat cultivars. In addition, their geographic distributions were also characterized. Changes in nucleotide diversity (π) of TaSus1-7A from the diploid to hexaploid levels were also investigated.
RESULTS
Cloning, Chromosome Mapping, and Characterization of the TaSus1 and TaSus2 Sets
TaSus2 genomic DNA and complementary DNA (cDNA) sequences were amplified by primer pair Sus2-167 and Sus2-168 (Jiang et al., 2011), and TaSus1 genomic DNA and cDNA sequences were amplified by primer pair Sus1-1f and Sus1-3805r from cv Chinese Spring and diploid progenitor accessions. Three different TaSus1 genes were amplified.
Based on differences between the three genomic sequences of TaSus1, three genome-specific primer pairs were designed to detect the chromosome locations of the TaSus1 orthologs (Fig. 1). Genomic DNA from the homeologous group 7 cv Chinese Spring nullitetrasomic lines, cv Chinese Spring, Triticum urartu, Aegilops speltoides, and Aegilops tauschii were amplified by the three primer pairs. TaSus1 genes were located on chromosomes 7A, 7B, and 7D.
Figure 1.
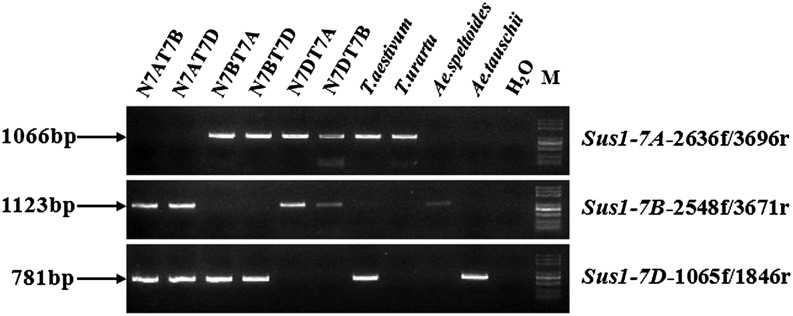
Chromosome locations of TaSus1 orthologs. The sizes of PCR products are shown on the left, and the genome-specific primers are on the right. Sources of amplified DNA are at the top.
The three TaSus1 genes each consisted of 14 exons and 13 introns (Fig. 2). The genomic sequence lengths of TaSus1-7A, TaSus1-7B, and TaSus1-7D were 3,805, 3,777, and 3,765 bp, respectively. The sequence homologies ranged from 94.1% to 95.2%, and the sequences of the three TaSus1 genes had homologies of 92.1% to 92.8% with HvSus1-7H (barley).
Figure 2.

Coding regions of TaSus1-7A, TaSus1-7B, and TaSus1-7D. Asterisks indicate polymorphic sites. CDSf, First exon; CDSi, internal exons; CDSl, last coding segment.
The genome-specific primer pair Sus2-2AP-302f and Sus2-2A-214r was designed to map TaSus2-2A. Based on genetic and molecular data for the cv Hanxuan 10 × Lumai 14 double haploid (DH) population (Yang et al., 2007), TaSus2-2A was mapped on the short arm of 2A (2AS) and flanked by simple sequence repeat markers Xgwm122 and Xgwm328 (Supplemental Fig. S1) located in deletion bin 2AS-5 (Sourdille et al., 2004).
Proteins coded by TaSus1 and TaSus2 were matched by InterProScan (http://www.ebi.ac.uk/Tools/pfa/iprscan/). In the InterProScan database, three proteins were compared (O24301, P30298, and P49040), the first two coded by SUS2 and the third by SUS1. In taxonomic coverage, the homologous proteins were distributed across bacteria, cyanobacteria, and green plants.
Haplotype Analysis at the TaSus2-2A, TaSus2-2B, TaSus1-7A, and TaSus1-7B Loci
Three SNPs earlier identified in TaSus2-2B formed two haplotypes (Jiang et al., 2011). Two SNPs were identified in TaSus2-2A, the first (20A > G) in the first exon and the second (2946A > C) in the tenth intron (Fig. 2; Supplemental Fig. S2A). Only the first SNP led to an amino acid change (GAG→Glu, GGG→Gly). These two SNPs formed two haplotypes, Hap-A and Hap-G. A cleaved amplified polymorphic site (CAPS) marker was developed based on the first SNP. Restriction endonuclease AscΙ identified the sequence only when the SNP site was G. The PCR product of Hap-A amplified by the genome-specific primer pair Sus2-2AP-302f and Sus2-2A-214r was 516 bp after enzyme digestion, and the product of Hap-G was 322 plus 194 bp after enzyme digestion (Supplemental Fig. S2C).
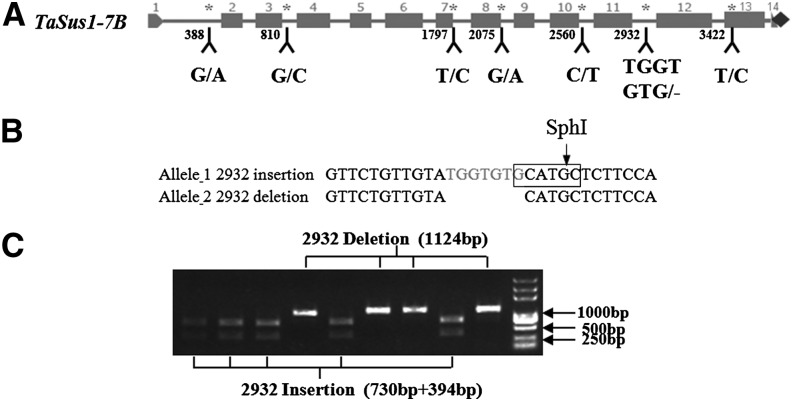
Six SNPs were identified in TaSus1-7B, within introns 1, 3, 7, 8, and 10 and the thirteenth exon. In addition, an insertion/deletion (indel) was identified within intron 11 (Fig. 3A). These polymorphic sites formed two haplotypes, Hap-T and Hap-C. A CAPS marker was developed at the indel site using restriction endonucleases SphI. The PCR product of Hap-C amplified by genome-specific primer pair Sus1-7B-2548f and Sus1-7B-3671r was 1,124 bp after restriction digestion by SphI, whereas Hap-T produced two fragments with lengths of 730 and 394 bp, respectively (Fig. 3C).
Figure 3.
Polymorphisms and marker development at TaSus1-7A. A, Coding region of TaSus1-7A. Six SNPs at 388, 810, 1,797, 2,075, 2,560, and 3,422 bp and one indel at 2,932 bp are labeled. B, The indel site at 2,932 bp between different haplotypes. The rectangle and arrow represent the recognition and digestion sites of restriction endonuclease SphI. C, PCR products restrictively digested by SphI.
Seven SNPs were identified in TaSus1-7A, within exons 4, 6, 8, and 13 and intron 4 (Supplemental Fig. S3A). SNPs in exons 6 and 13 led to amino acid changes (TCCAAT→SerAsn, AACAAA→AsnLys; GTG→Val, CTG→Leu). These seven SNPs formed five haplotypes, which were named Hap-1/Hap-2/Hap-3/Hap-4/Hap-5. Two CAPS markers were developed at 1,185 and 3,544 bp, using restriction endonucleases TaqαI and ApaLI, respectively (Supplemental Fig. S3, B–E). A genome-specific primer pair was developed to identify the SNPs at 1,599, 1,600, and 1,604 bp (Supplemental Fig. S3, F and G). However, no SNPs or indels were detected in TaSus1-7D or TaSus2-2D or the coding and promoter regions.
Haplotype Effects Associated with TKW
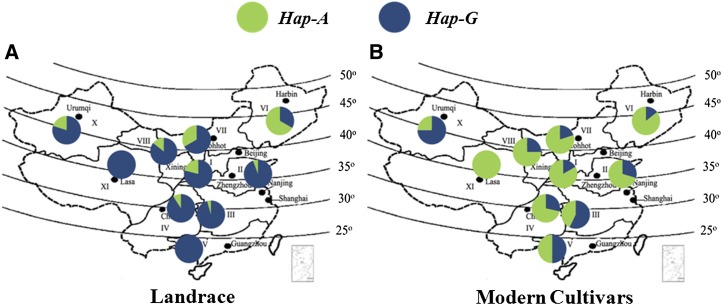
An association study of TaSus2-2A suggested that mean TKW of Hap-A was significantly higher than that of Hap-G (P < 0.05) in Chinese modern cultivars in 2002 and 2006, landraces of mini core collection (MCC) in 2006, and modern cultivars in the MCC in 2005 (Table I). In Chinese modern cultivars, the TKW difference between the two haplotypes reached a mean 3.37 g over 2 years, and Hap-A genotypes occupied a larger proportion of the areas in most ecological zones and provinces (Fig. 4). Among landraces in the MCC, 87.3% of genotypes were Hap-G, and in modern cultivars of the MCC, Hap-A genotypes represented 70.9% of entries. Strong positive selection for Hap-A suggested that it was a favored haplotype. At TaSus2-2B, TaSus2-2B-Hap-H was a favored haplotype (Jiang et al., 2011; Supplemental Fig. S4B).
Table I. Comparison of mean TKW of TaSus2-2A, TaSus1-7A, and TaSus1-7B haplotypes in Chinese modern cultivars and MCC in different years.
*P < 0.05, **P < 0.01.
|
TaSus2-2A
TKW |
TaSus1-7A
TKW |
TaSus1-7B
TKW |
||||||||||
|---|---|---|---|---|---|---|---|---|---|---|---|---|
| Hap-A | Hap-G | F | P | Hap-1 | Hap-2 | F | P | Hap-T | Hap-C | F | P | |
| g | g | g | ||||||||||
| 348 Modern cultivars | ||||||||||||
| 2002 | 42.89 ± 6.49 | 39.51 ± 7.30 | 2.811 | 0.000** | 41.84 ± 6.80 | 45.38 ± 6.86 | 0.141 | 0.019* | 43.05 ± 6.34 | 38.45 ± 7.68 | 0.652 | 0.000** |
| 2006 | 40.42 ± 6.27 | 37.05 ± 7.18 | 2.845 | 0.000** | 39.42 ± 6.58 | 41.57 ± 6.65 | 0.113 | 0.134 | 40.61 ± 6.23 | 36.03 ± 6.92 | 2.923 | 0.000** |
| 2010 | 40.81 ± 6.09 | 38.16 ± 6.37 | 0.834 | 0.001** | 39.85 ± 6.40 | 41.18 ± 6.68 | 0.822 | 0.328 | 40.84 ± 5.96 | 37.10 ± 7.00 | 2.617 | 0.000** |
| Landraces in MCC | ||||||||||||
| 2002 | 34.05 ± 6.48 | 31.87 ± 4.24 | 4.184 | 0.159 | 32.26 ± 4.58 | 32.76 ± 6.99 | 2.921 | 0.090 | 32.32 ± 4.74 | 31.36 ± 3.82 | 0.835 | 0.369 |
| 2005 | 34.90 ± 8.03 | 30.09 ± 5.62 | 3.198 | 0.002* | 30.48 ± 6.14 | 35.20 ± 6.88 | 0.196 | 0.659 | 30.95 ± 6.24 | 28.79 ± 5.37 | 0.643 | 0.146 |
| 2006 | 35.048 ± 7.293 | 32.77 ± 5.08 | 4.236 | 0.191 | 33.16 ± 5.40 | 34.89 ± 7.87 | 2.136 | 0.146 | 33.18 ± 5.56 | 32.70 ± 4.88 | 0.071 | 0.702 |
| Modern cultivars in MCC | ||||||||||||
| 2002 | 39.28 ± 4.74 | 37.26 ± 5.41 | 0.245 | 0.070 | 38.54 ± 5.05 | 39.94 ± 4.85 | 0.001 | 0.988 | 38.72 ± 4.84 | 38.42 ± 6.88 | 3.899 | 0.855 |
| 2005 | 38.40 ± 5.92 | 36.41 ± 6.73 | 0.560 | 0.185 | 37.50 ± 6.14 | 39.50 ± 6.33 | 0.205 | 0.651 | 37.77 ± 6.10 | 39.12 ± 7.70 | 0.724 | 0.559 |
| 2006 | 41.00 ± 5.97 | 37.94 ± 5.67 | 0.335 | 0.023* | 39.70 ± 6.02 | 42.50 ± 6.00 | 0.001 | 0.991 | 40.14 ± 5.76 | 39.81 ± 8.66 | 4.573 | 0.909 |
Figure 4.
Distribution of TaSus2-2A Hap-A and Hap-G in landraces (A) and modern cultivars (B). [See online article for color version of this figure.]
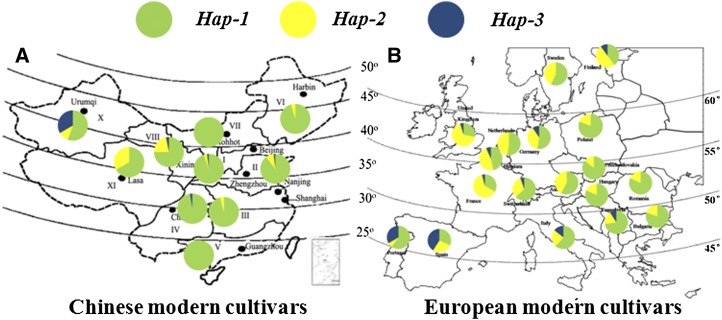
At TaSus1-7A, Hap-4/Hap-5 were present in only four accessions, so these two haplotypes were not included in subsequent statistical analyses. Hap-3 also occurred at low frequencies in both the MCC and Chinese modern cultivars (3.8% and 2.3%, respectively). A significant difference of 5.2 g in TKW between Hap-1 and Hap-3 was identified in one set of near-isogenic lines (NILs; BC3F6 of cv Youzitou/Zhengmai 366*4) in yield trial plots (Supplemental Fig. S4A). Hap-1 represented dominant proportions of 88.5% of the MCC and 90.6% of Chinese modern cultivars (Fig. 5). Hap-2 was present in 7% of Chinese cultivars, but its frequency was 32% among European and American cultivars. A significant difference in TKW between Hap-2 and Hap-1 genotypes was only detected in Chinese modern cultivars in 2006, where the difference was 3.54 g.
Figure 5.
Distribution of Hap-1/Hap-2/Hap-S3 at TaSus1-7A in Chinese (A) and European (B) cultivars. [See online article for color version of this figure.]
At TaSus1-7B, a significant difference in TKW of 4.59 g was detected in Chinese modern cultivars in 2002 and 2006. In both populations, Hap-T was present in higher proportions of genotypes, 86.3% in the MCC and 73.9% in Chinese modern cultivars. The strong selection of Hap-T suggested that it was a favored haplotype.
Favored Genes (Haplotypes) Have Higher Transcript and Enzyme Activity Levels
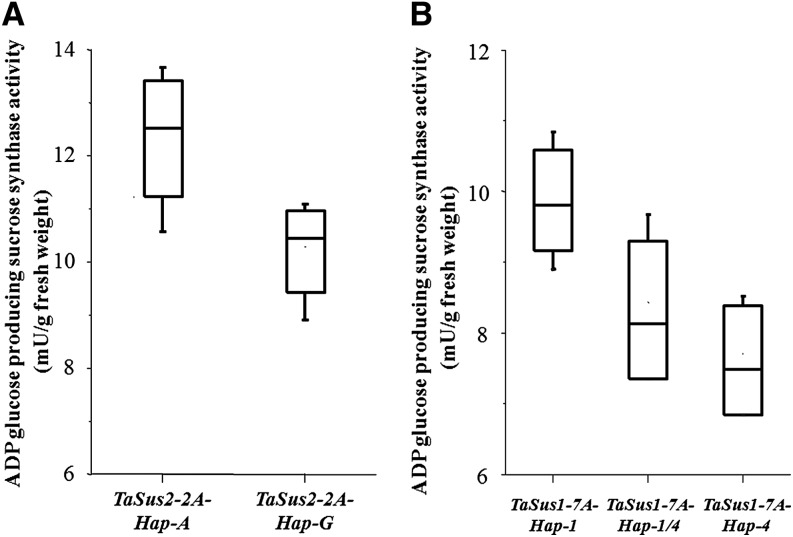
Relative quantification of mRNA expression by real-time PCR suggested that Suc synthase had a positive influence, and mRNA expression reached a peak value at 15 DPA (Fig. 6; Supplemental Table S1). At TaSus2-2A and TaSus1-7A, the relative expression levels of favored haplotypes were higher than nonfavored ones at 15 DPA. Suc synthase activity levels in developing seeds 15 DPA also demonstrated the same trends (Fig. 7; Supplemental Table S2). Transcript levels of TaSus1-7A-Hap-1 and TaSus1-7A-Hap-2 were not significantly different in any of the five periods. As there was no significant difference in TKW between the two TaSus1-7A haplotypes, they were both treated as favored haplotypes.
Figure 6.
Relative quantification of mRNA expression by real-time PCR among different haplotypes in five periods post anthesis. The materials used in the tests were all from NIL sets BC3F4 population of cv Xiaoyan 6/Zhou 18*4 (A), BC3F3 population of cv Isengrain/Yanzhan 4110*4 (B), and F3 population of cv Yangmai 158/Zhou 18*3//Handan 6172 (C). Two stable lines derived from the F3 population were used for assays of TaSus2 and TaSus1 expression.
Figure 7.
Boxplots of enzyme activities of Suc synthase in developing seeds among different haplotypes at 15 DPA. The bottom and top of the box are the first and third quartiles, and the band inside the box is the second quartile. The ends of the whiskers represent the minimum and maximum of all the data. The materials used in A and B were the same sets of those in Figure 6, A and B, respectively. The Suc synthase activity was measured in ADP Glc synthetic direction.
Changes in Haplotype Frequency during the Breeding Histories of China, Europe, and North America
Chinese modern cultivars released since the 1940s were divided into subgroups according to 10-year release intervals (Hao et al., 2006). European and American cultivars were distinguished by the same decades based on registration dates, and cultivars released earlier than 1940 were merged with the 1940s.
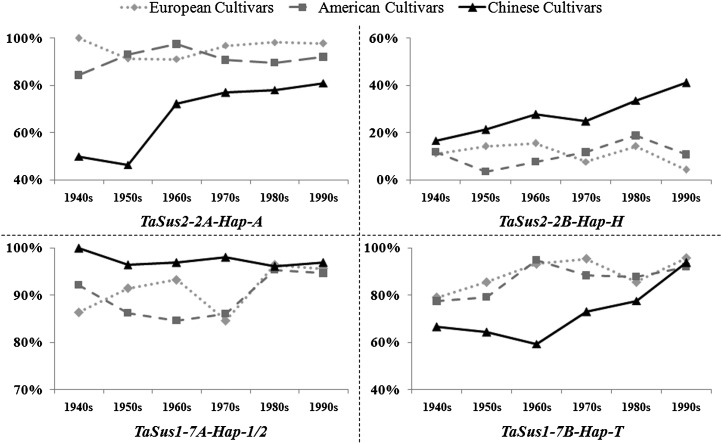
Frequency changes for the three favored haplotypes at TaSus2-2A, TaSus2-2B, and TaSus1-7B showed gradual increases in Chinese cultivars since the 1940s (Fig. 8), suggesting these favored haplotypes had undergone strong positive selection in plant breeding. The frequency changes of TaSus1-7A-Hap-1 and TaSus1-7A-Hap-2 showed slightly different trends in Chinese modern cultivars, with the former gradually decreasing and the latter gradually rising. At TaSus2-2A, TaSus1-7A, and TaSus1-7B, frequencies of favored haplotypes changed only slightly in the six decades in European and American cultivars, because they were already at very high frequencies in cultivars released in the 1940s (Fig. 8).
Figure 8.
Changes in frequency of favored haplotypes at the TaSus2-2A, TaSus2-2B, TaSus1-7A, and TaSus1-7B loci over six decades in varietal populations released in China, Europe, and the United States.
Geographic Distributions of Favored Haplotypes in Six Cultivar Populations
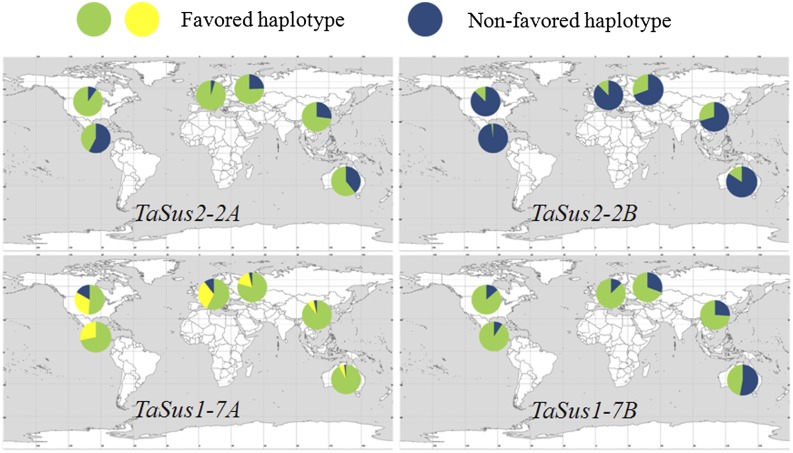
Frequencies of the five favored haplotypes at TaSus2-2A, TaSus2-2B, TaSus1-7A, and TaSus1-7B were estimated for 384 European, 447 North American, 53 International Maize and Wheat Improvement Center (CIMMYT), 82 Russian, and 51 Australian cultivars (Fig. 9). Similar frequencies of favored haplotypes were detected in European and North American cultivars (Supplemental Table S3). Similar trends were observed in Chinese and Russian cultivars. European and North American cultivars had higher proportions of favored haplotypes than the other four regions at TaSus2-2A, TaSus1-7A, and TaSus1-7B. CIMMYT cultivars showed high frequencies of favored haplotypes at TaSus1-7A and TaSus1-7B but relatively low frequencies at the other two loci. In Australian cultivars, except at TaSus1-7A, favored haplotype frequencies were not as high as in other regions (Fig. 9).
Figure 9.
Geographic distribution of haplotypes at four loci in six major wheat production regions worldwide. The yellow is predominantly TaSus1-7A-Hap-2. [See online article for color version of this figure.]
Major Haplotype Combinations at the Four Loci
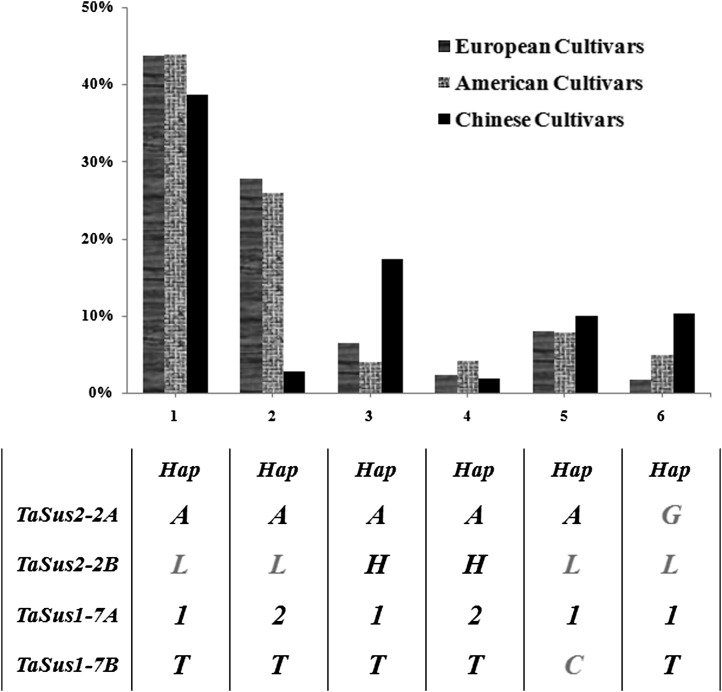
Six major haplotype combinations of the four genes were detected; these represented 90.0% of European cultivars, 90.7% of American cultivars, and 80.9% of Chinese cultivars (Fig. 10). Combination 1 occurred in about 40% of cultivars in all three populations. The largest differences between Chinese cultivars and the other two populations were for combinations 2 and 3. Hap-H at TaSus2-2B was significantly favored in Chinese cultivars, and Hap-2 at TaSus1-7A was more highly represented in European and American cultivars than in Chinese cultivars. Combinations containing nonfavored haplotypes at TaSus2-2A or TaSus1-7B only appeared in combinations 5 and 6, which accounted for very low proportions of genotypes.
Figure 10.
Proportion of haplotype combinations at four loci in three populations of released cultivars. The haplotypes below the numbers represented the combinations. Haplotypes with gray color represent nonfavored ones.
π at TaSus1-7A in Bread Wheat and Its Diploid and Tetraploid Relatives
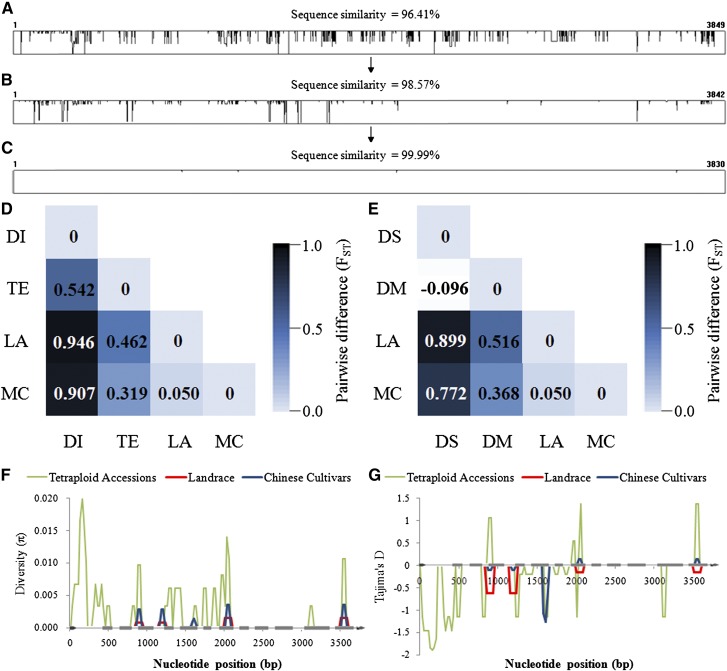
Sequence identities of TaSus1-7A compared with those of 16 diploid accessions carrying A genome ranged from 95.2% to 97.7% (Supplemental Table S4). T. urartu had the highest similarity. T. urartu could possibly be the A genome donor of common wheat. Sequence identities of TaSus1-7B with 23 diploid accessions carrying S genome (possible B genome donor) ranged from 89.2% to 93.6%, and A. speltoides had the highest similarity. However, comparing tetraploid with hexaploid wheat, sequence identities of SUS1 were 94.6% to 99.7%. Diversities of SUS1 were therefore significantly lower in polyploid wheat (Fig. 11, A–C). Tests of pairwise differences in TaSus1-7A between pairs of populations (FST, identical to the weighted average F statistic over loci) also suggested lower variability (Fig. 11D). FST between diploid accessions and hexaploid accessions was above 0.9, while the value between diploid and tetraploid accessions (0.542) and between tetraploid and hexaploid accessions (0.462 and 0.319) were much lower. The P values between populations were all below 0.05 (Supplemental Table S5), suggesting that differences between populations were significant. The FST between the wild-species Triticum dicoccoides and domesticated species Triticum dicoccum, durum wheat, and other tetraploid accessions was not significantly different; however, the FST was lower in domesticated tetraploids than in wild tetraploids (Fig. 11E), suggesting that selection at TaSus1-7A occurred during domestication. All these data suggested there were two strong bottlenecks at formations of polyploidy wheat.
Figure 11.
Diversity of the TaSus1-7A sequence in diploid accessions (A), tetraploid accessions (B; Supplemental Table S4), and common wheat (C; Chinese modern cultivars). Widths of rectangles represent the full lengths of TaSus1-7A, and lengths represent polymorphic sites and their diversity in collections. D and E, Genetic distance in TaSus1-7A between pairs of populations (FST). The color gradient presents FST values from dark (1.0) to light blue (0.0). D, DI, Diploid accessions; TE, tetraploid accessions; LA, landraces in MCC; MC, Chinese modern cultivars in MCC. E, DS, T. dicoccoides; DM, other tetraploid accessions used in this study. The πs (F) and Tajima’s D (G) at TaSus1-7A between tetraploid wheat collections, landraces, and Chinese modern cultivars. The horizontal axis represents the coding region of TaSus1-7A (Fig. 1).
The π and Tajima tests of haplotypes at TaSus1-7A were performed on tetraploid wheat collections, Chinese landraces, and modern cultivars (Fig. 11, F and G). In tetraploid accessions, π reached a peak value in the first intron, and it appeared much higher than in Chinese hexaploid cultivars at all polymorphic sites. π of tetraploid accessions was 16.6- and 10.5-fold that in Chinese landraces and modern cultivars, and 3.6-fold that of European cultivars (Table II). The dramatic decline of diversity from the tetraploid to hexaploid further illustrated that strong bottleneck effect occurred during the formation of common wheat. The Tajima test showed a D value below zero in tetraploid accessions, landraces, and Chinese cultivars and above zero in European cultivars, suggesting there was a large number of low-frequency allelic variations in tetraploid accessions, landraces, and Chinese cultivars (because Hap-1 represented 88.2% and 89.6% of accessions, respectively), and intermediate-frequency allelic variations in European cultivars was mainly due to the population structure and selection effect.
Table II. Diversities among tetraploid accessions, Chinese landraces and cultivars, and European cultivars at TaSus1-7A.
h, Number of haplotypes; Hd, haplotype diversity; θ, nucleotide polymorphism.
| Materials | h | Hd | π | θ | Tajima’s D | P |
|---|---|---|---|---|---|---|
| Tetraploid accessions | 8 | 0.924 | 0.00199 | 0.00288 | –1.40251 | >0.10 |
| Landraces | 3 | 0.156 | 0.00012 | 0.00019 | –0.66614 | >0.10 |
| Chinese cultivars | 5 | 0.193 | 0.00019 | 0.00029 | –0.70361 | >0.10 |
| European cultivars | 5 | 0.559 | 0.00055 | 0.00028 | 1.82542 | 0.10 > P > 0.05 |
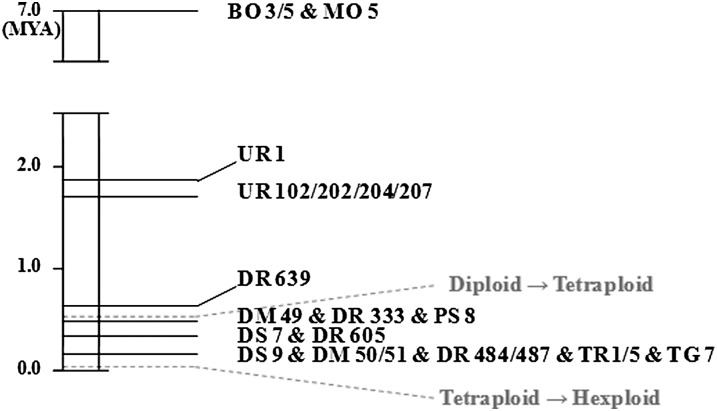
Nucleotide substitution rate can be used for estimating times of sequence divergence. For grass genes, the average substitution rate was estimated as 6.5 × 10⁻⁹ substitutions per synonymous site per year (SanMiguel et al., 1998; Gu et al., 2006). Using this rate, divergence time was estimated for TaSus1-7A in diploid ancestors and tetraploid accessions (Fig. 12). The divergence time of the A genome progenitor of wheat, T. urartu, was estimated at 1.67 to 1.83 million years ago (MYA), with an average of 1.70 MYA. The divergence time for most tetraploid accessions occurred from 0.15 to 0.45 MYA.
Figure 12.
Estimation of divergence time at TaSus1-7A in Triticum spp. The formation of tetraploid wheat originated less than 0.5 MYA and that of hexaploid occurred about 6,000 to 8,000 years ago (Dubcovsky and Dvorak, 2007; Brenchley et al., 2012). BO, Triticum boeotieum; MO, Triticum monococcum; UR, T. urartu; DS, T. dicoccoides; DM, T. dicoccum; DR, durum wheat; PS, Triticum persicum; TR, Triticum orientale; TG, Triticum turgidum.
Strong Negative Selection Occurred on Mutants within the Functional Domains of TaSus1-7A
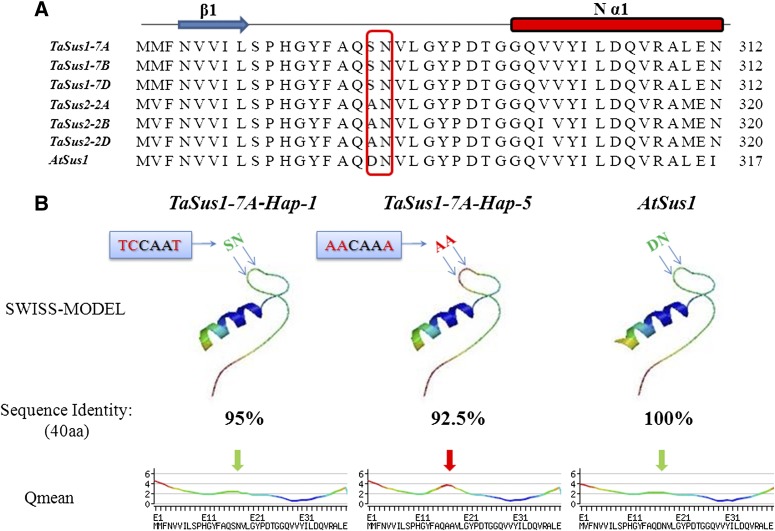
Five haplotypes were detected at TaSus1-7A in this study; however, Hap-4 and Hap-5 occurred at very low frequencies in modern cultivars. Mutations at 1,599-, 1,600-, and 1,604-bp sites from the ATG initiation site could be considered rare alleles. The structure of AtSus1 suggested SUS was a member of the GT-B glycosyltransferase superfamily (Zheng et al., 2011), and the active site of AtSus1 was the AtSus1⋅UDP⋅Fru complex. In the complex, Fru was firmly bound within a pocket formed by residues from the GT-BN domain. Nα1 is the first α-helix of the GT-BN domain, and the adjacent region is very well conserved between AtSus1 and TaSus1 (Fig. 13A). Two nonpolar amino acids substitutions (SN→AA) at Hap-4/Hap-5 might change the pocket domain binding Fru (Fig. 13B). This change might lead to reduced SUS enzyme activity and a nonbeneficial effect on yield. Therefore, it would be quickly excluded in global breeding.
Figure 13.
A, Alignment of amino acid sequences around polymorphic sites at 1,599, 1,600, and 1,604 bp at TaSus1-7A among TaSus1, TaSus2, and AtSus1. The red, hollow rectangle represents the polymorphic sites. B, Comparison of secondary protein structures of TaSus1-7A-Hap-1 and TaSus1-7A-Hap-5 by SWISS-MODEL (Guex and Peitsch, 1997; Schwede et al., 2003; Arnold et al., 2006) and Qmean (Benkert et al., 2011). The nucleotide sequences in blue rectangles represent the SNPs, and red letters are the SNPs. SN/AA/DN represent the amino acids coded in this region. The color of the Qmean curves represent the residue error, with gradients from blue (more reliable regions) to red (potentially unreliable regions). The downward-pointing arrows above Qmean curves represent the locations of polymorphic sites.
DISCUSSION
Most Variation within TaSus Genes Occur in the Introns and Promoter Regions
As the first enzyme genes in the starch synthesis pathway in common wheat, TaSus1 and TaSus2 have low diversities in this study. Base substitutions in introns were more frequent than in exons. At TaGW2-6A, a candidate gene related to grain development, favored haplotype Hap-A, was associated with seed width and TKW (Su et al., 2011). No substitutions were found in the coding regions of TaGW2-6A, TaGW2-6B, and TaGW2-6D, but polymorphic sites were found in the promoter regions. Several downstream genes in the starch synthesis pathway show abundant SNPs in different populations (Y.M. Jiang and X.Y. Zhang, unpublished data), and the substitution sites are distributed mainly in the introns and promoter regions. This phenomenon was also detected in other crops. For example, in the carotenoid biosynthesis pathway of maize, the first enzyme gene PSY1 (phytoene synthase gene), which converts geranylgeranyl pyrophosphate to phytoene, has less polymorphism in the coding and noncoding regions than the downstream genes encoding lycopene epsilon cyclase (lcyε) and β-carotene hydroxylase1 (crtRB1; Yan et al., 2010; Fu et al., 2013). Therefore, it might be a general rule that that upstream genes in biosynthesis pathways have lower diversity than downstream ones.
TaSus1 and TaSus2 Are Associated with Grain Yield of Wheat
In the starch synthesis pathway, SUS, ADP-Glc pyrophosphorylase, starch synthase, starch branching enzyme, and starch debranching enzyme are the key enzymes (Keeling and Myers, 2010). The functions and genetics of these enzymes genes have been studied in many crops, yet associations with grain yield were rarely reported. Most previous studies focused on their influence on starch texture in wheat (Morell et al., 2003) and cooking quality in rice (Tian et al., 2009). Haplotype association revealed that TaSus1 and TaSus2 were associated with TKW in wheat. Favored haplotypes of four genes for higher TKW were detected based on field data of the Chinese MCC, Chinese modern cultivars, and NILs evaluated in multiple environments.
Genetic Differences on TKW between Haplotypes at the Same Locus Affect Selection Time and Intensity
The four (of six) genes all have the same function in starch synthesis and can be considered as isoenzymes but with differences between haplotypes on TKW as estimated in the MCC, Chinese modern cultivars, and NILs. The favored Hap-1 and Hap-2 at TaSus1-7A reached the highest frequencies (Fig. 9; Supplemental Table S3) among global wheat cultivars, and in some populations, one to two haplotypes (TaSus1-7A-Hap-1 and TaSus1-7A-Hap-2) was almost fixed. At TaSus2-2B, the favored Hap-H was present in less than 25% of the world wheat cultivars. Analysis showed significant differences on genetic effect between haplotypes at the same locus existing among the four loci. They are 5.5 (7A), 4.6 (7B), 3.4 (2A), and 2.2g (2B), which were estimated based on the 348 Chinese modern cultivars and NILs (Table I; Supplemental Fig. S4). Therefore, genetic effect differences influenced haplotype selection time and intensity in cultivar populations. Of most interest was that at TaSus2-2A, TaSus2-2B, and TaSus1-7B, selection intensity for favored haplotypes in Australian cultivars was not as strong as in Chinese and European cultivars. Australian wheat is largely produced under rain-fed conditions (Turner, 2004), and yield potential of Australian cultivars is not as high as those of Europe or China. Selection intensity on TaSus2-2A and TaSus2-2B in CIMMYT cultivars is not as strong as in Chinese and former Soviet cultivars. The reason for this was not clear.
Bottleneck and Strong Selection Occurred at TaSus1-7A with Polyploidization and Domestication
Homologous SUS genes are highly diverse among different crop species, such as rice, maize, sorghum (Sorghum bicolor), barley, and wheat (Zhang et al., 2011). π in diploid wheat is significantly higher than in tetraploid and hexaploid wheat. Two dramatic declines of SUS1 diversity occurred in Triticum genus evolution, one at tetraploidization and the other at hexaploidization (Fig. 11; Table II), which indicated that twice, strong bottlenecks occurred during polyploidizations. The genetic distance between wild tetraploid and hexaploid accessions was larger than that between domesticated tetraploid and hexaploid accessions (Fig. 11, D and E), suggesting that selection occurred in the process of tetraploid domestication. The extremely high frequency of Hap-1 and Hap-2 at TaSus1-7A in both landrace (95.5%) and modern cultivars (96.6%) suggested that strong selection to this locus took place in domestication of common wheat as well. This also implies that wheat originated from a rather narrow genetic base.
The significant differences in favored haplotype frequencies at TaSus2-2A, TaSus2-2B, and TaSus1-7B between landraces and modern cultivars suggest the occurrence of strong positive selection for superior haplotypes in breeding during the last century (Figs. 8, 9, and 11). Much of this change was likely caused by selection for larger grain size.
Favored Haplotypes Coding Key Enzymes in Starch Synthesis Pathway Were Selected Worldwide
Favored haplotypes at TaSus2-2A, TaSus2-2B, TaSus1-7A, and TaSus1-7B showed similar selection trends in six global wheat production regions (Fig. 9), covering about 51% of the harvested area and 60% of grain production worldwide (http://faostat.fao.org/site/339/default.aspx). Although favored haplotypes seem to be superior in all geographical regions, when considered across the four loci, the most favored combination has not been optimized in released cultivars (Fig. 10). Markers developed for these haplotypes should be useful in future breeding for genome selection.
MATERIALS AND METHODS
Plant Materials
Forty-seven diploid progenitor accessions and 36 tetraploid accessions were used in cloning by homology, genome-specific primer design, and evolutionary studies of two Suc synthase genes (Supplemental Table S4). Thirty-six wheat (Triticum aestivum) accessions, including 18 modern cultivars and 18 landraces, were used for sequencing to detect SNPs and haplotypes at the TaSus1 and TaSus2 loci. A DH population derived from a cross elite Chinese wheat cv Hanxuan 10 and Lumai 14 was used for mapping the haplotypes.
Two Chinese wheat populations were used in the study, namely 245 accessions from the Chinese wheat MCC representing 70% of the wheat genetic diversity of China and 348 modern cultivars from the Chinese wheat core collection (Hao et al., 2008, 2011). These two populations were selected from 23,705 accessions bred or collected in China (Zhang et al., 2002; Dong et al., 2003; Hao et al., 2008). The MCC accessions were planted at the Chinese Academy of Agricultural Sciences (CAAS) Luoyang Experiment Station in Henan Province in 2002, 2005, and 2006.
In addition, 384 European, 429 North American, 53 CIMMYT, 82 Russian, and 51 Australian cultivars were surveyed to investigate the global distribution of favored haplotypes of the TaSus1 and TaSus2 genes and frequency changes of the favored haplotypes during the last 100 years. Three wheat NILs derived from BC3F4 population of cv Xiaoyan 6/Zhou 18*4, BC3F3 population of cv Isengrain/Yanzhan 4110*4, and F3 population of cv Yangmai 158/Zhou 18*3//Handan 6172 were used for detecting differences in transcript levels among cultivars with different haplotypes. One NIL pair derived from BC3F6 of cv Youzitou/Zhengmai 366*4 was used for detecting TKW difference between Hap-1 and Hap-3 at TaSus1-7A. One NIL pair derived from BC3F2 of cv Shijiazhuang 8/Shi4185*4 was used for detecting TKW difference between Hap-H and Hap-L at TaSus2-2B. All hexaploid materials are listed in Supplemental Table S6.
DNA and RNA Extraction
Genomic DNA was extracted from young lyophilized leaves as described by Sharp et al. (1988). RNA isolation and reverse transcription followed Guo et al. (2010). RNA was extracted from immature embryos 5, 10, 15, 20, and 25 DAP using TRIzol reagent. cDNA was synthesized with the SuperScript II System (Invitrogen).
Haplotype Analysis of TaSus1 and TaSus2
Three TaSus2 genes were cloned by homology by Jiang et al. (2011), and three TaSus1 genes were cloned by homology based on the sequence of barley (Hordeum vulgare) the SUS1 gene (http://www.ncbi.nlm.nih.gov/nuccore/FN400939). Primer Premier 5.0 (http://www.premierbiosoft.com/) was used for designing all primers (Supplemental Table S7) used in this study. All primers were synthesized by Invitrogen and Sangon Biotech. PCRs used LA Taq polymerase (TaKaRa Biotechnology) in reaction volumes of 15 μL containing 50 ng DNA, 7.5 μL buffer, 1.0 μL 10 mm forward and reverse primers, 0.24 μL 25 mm deoxynucleotide triphosphates, and 0.15 μL LA Taq polymerase. PCR was carried out in a Veriti 96 Well Thermal Cycler (Applied Biosystems) with the following settings: denaturing at 95°C for 5 min, followed by 35 cycles of 95°C for 30 s, annealing at 58°C to 63°C for 1 min, and 72°C for extension (1 kb min–1), with a final extension of 72°C for 10 min. PCR products were purified by purification kit DP-1502 (Tiangen), then cloned by the pGEM-T Easy Cloning Vector (Tiangen), and transformed into Escherichia coli cells by the heat shock method. Plasmids were extracted by plasmid extraction kit DP-1002 (Tiangen). DNA was sequenced by an ABI 3730XI DNA Analyzer (Applied Biosystems). Sequence alignments were carried out by SeqMan and DNAMAN (http://www.lynnon.com/). SNPs were identified by DNASTAR (http://www.dnastar.com/). The digestion sites of restriction endonucleases were detected by Primer Premier 5.0. All the restriction endonucleases used in the study were produced by New England Biolabs.
Haplotype Transcript Analysis
Three NILs were used for detecting expression differences in relative quantification of TaSus2-2A and TaSus1-7A by real-time PCR (Fig. 6). RNA was extracted from wheat seeds at 5, 10, 15, 20, and 25 DPA and then reverse transcribed by a M-MLV Reverse Transcriptase Kit (Invitrogen). Real-time PCR was carried out by Rotor-Gene Q (Qiagen).
Enzyme Assays
The activity level of Suc synthase was assayed following Doehlert et al. (1988). One gram of powder of the lyophilized wheat seeds at 15 DPA was resuspended at 4°C in 7 mL of 50 mm HEPES (pH 7.5) and centrifugated at 10,000g for 10 min. The supernatant was assayed for enzymatic activity. All enzymatic reactions were performed at 30°C. One unit is defined as the amount of enzyme that catalyzes the production of 1 μmol product min–1.
Statistical Analysis
Data processing were carried out by Office 2003 and SPSS Statistics 17.0 (http://www-01.ibm.com/software/analytics/spss/).
π at TaSus1-7A
Sequence alignments were carried out by DNASTAR. FST tests were carried out by Arlequin 3.5.1.2 (http://cmpg.unibe.ch/software/arlequin3/). Diversity analysis, Tajima D test, and a synonymous substitution test were carried out by DnaSP 5.10 (http://www.ub.es/dnasp). Divergence time was estimated following Gaut and Clegg (1991). Secondary protein structures were predicted by SWISS-MODEL (http://swissmodel.expasy.org/).
Supplemental Data
The following materials are available in the online version of this article.
Supplemental Figure S1. TaSus2-2A was mapped on 2AS flanked by simple sequence repeat markers Xgwm122 and Xgwm328 in DH population derived from cv Hanxuan 10 × Lumai 14.
Supplemental Figure S2. Polymorphisms and marker development at TaSus2-2A.
Supplemental Figure S3. Polymorphisms and marker developments at TaSus1-7A.
Supplemental Figure S4. Difference of TKW in two NILs in 2012 yield trial plot.
Supplemental Table S1. Haplotype transcript analysis data.
Supplemental Table S2. Enzyme assay data at 15 DPA.
Supplemental Table S3. Frequency of five favored haplotypes at TaSus2-2A, TaSus2-2B, TaSus1-7A, and TaSus1-7B in six released cultivar populations.
Supplemental Table S4. Accessions of diploid and tetraploid wheats used in this study.
Supplemental Table S5. FST between different populations and the corresponding P value at TaSus1-7A.
Supplemental Table S6. Accessions of hexaploid wheats used in this study.
Supplemental Table S7. Primers used to amplify variant regions of TaSus1 and TaSus2.
Supplementary Material
Acknowledgments
We thank Ravi Singh and Ana Luisa Ordaz Cano (CIMMYT) and Xinming Yang and Zhonghu He (Institute of Crop Science-CAAS) for generous help with cultivar collections used in this article and Ruilian Jing (Institute of Crop Science-CAAS) for supplying a DH population used in mapping.
Glossary
- TKW
thousand kernel weight
- CIMMYT
International Maize and Wheat Improvement Center
- SNP
single nucleotide polymorphisms
- cDNA
complementary DNA
- DH
double haploid
- CAPS
cleaved amplified polymorphic site
- indel
insertion/deletion
- MCC
mini core collection
- NIL
near-isogenic line
- FST
identical to the weighted average F statistic over loci
- π
nucleotide diversity
- MYA
million years ago
Footnotes
This work was supported by the Chinese Ministry of Science and Technology (grant no. 2010CB125900), the China Agricultural Research System (grant no. CARS–03–03B), the Animal and Plant Transgenic Project (grant no. 2011ZX08009–001), and the Chinese Academy of Agricultural Sciences Innovation Project.
Some figures in this article are displayed in color online but in black and white in the print edition.
The online version of this article contains Web-only data.
References
- Arnold K, Bordoli L, Kopp J, Schwede T. (2006) The SWISS-MODEL workspace: a web-based environment for protein structure homology modelling. Bioinformatics 22: 195–201 [DOI] [PubMed] [Google Scholar]
- Barrero RA, Bellgard M, Zhang XY. (2011) Diverse approaches to achieving grain yield in wheat. Funct Integr Genomics 11: 37–48 [DOI] [PubMed] [Google Scholar]
- Benkert P, Biasini M, Schwede T. (2011) Toward the estimation of the absolute quality of individual protein structure models. Bioinformatics 27: 343–350 [DOI] [PMC free article] [PubMed] [Google Scholar]
- Bieniawska Z, Paul Barratt DH, Garlick AP, Thole V, Kruger NJ, Martin C, Zrenner R, Smith AM. (2007) Analysis of the sucrose synthase gene family in Arabidopsis. Plant J 49: 810–828 [DOI] [PubMed] [Google Scholar]
- Bologa KL, Fernie AR, Leisse A, Loureiro ME, Geigenberger P. (2003) A bypass of sucrose synthase leads to low internal oxygen and impaired metabolic performance in growing potato tubers. Plant Physiol 132: 2058–2072 [DOI] [PMC free article] [PubMed] [Google Scholar]
- Brenchley R, Spannagl M, Pfeifer M, Barker GL, D’Amore R, Allen AM, McKenzie N, Kramer M, Kerhornou A, Bolser D, et al. (2012) Analysis of the bread wheat genome using whole-genome shotgun sequencing. Nature 491: 705–710 [DOI] [PMC free article] [PubMed] [Google Scholar]
- Chourey PS, Taliercio EW, Carlson SJ, Ruan YL. (1998) Genetic evidence that the two isozymes of sucrose synthase present in developing maize endosperm are critical, one for cell wall integrity and the other for starch biosynthesis. Mol Gen Genet 259: 88–96 [DOI] [PubMed] [Google Scholar]
- Coleman HD, Beamish L, Reid A, Park JY, Mansfield SD. (2010) Altered sucrose metabolism impacts plant biomass production and flower development. Transgenic Res 19: 269–283 [DOI] [PubMed] [Google Scholar]
- Dale EM, Housley TL. (1986) Sucrose synthase activity in developing wheat endosperms differing in maximum weight. Plant Physiol 82: 7–10 [DOI] [PMC free article] [PubMed] [Google Scholar]
- Doehlert DC, Kuo TM, Felker FC. (1988) Enzymes of sucrose and hexose metabolism in developing kernels of two inbreds of maize. Plant Physiol 86: 1013–1019 [DOI] [PMC free article] [PubMed] [Google Scholar]
- Dong YS, Cao YS, Zhang XY, Liu SC, Wang LF, You GX, Pang BS, Li LH, Jia JZ. (2003) Development of candidate core collections in Chinese common wheat germplasm. Journal of Plant Genetic Resources 4: 1–8 [Google Scholar]
- Dubcovsky J, Dvorak J. (2007) Genome plasticity a key factor in the success of polyploid wheat under domestication. Science 316: 1862–1866 [DOI] [PMC free article] [PubMed] [Google Scholar]
- Flint-Garcia SA, Thornsberry JM, Buckler ES., IV (2003) Structure of linkage disequilibrium in plants. Annu Rev Plant Biol 54: 357–374 [DOI] [PubMed] [Google Scholar]
- Fu Z, Chai Y, Zhou Y, Yang X, Warburton ML, Xu S, Cai Y, Zhang D, Li J, Yan J. (2013) Natural variation in the sequence of PSY1 and frequency of favorable polymorphisms among tropical and temperate maize germplasm. Theor Appl Genet 126: 923–935 [DOI] [PubMed] [Google Scholar]
- Gaut BS, Clegg MT. (1991) Molecular evolution of alcohol dehydrogenase 1 in members of the grass family. Proc Natl Acad Sci USA 88: 2060–2064 [DOI] [PMC free article] [PubMed] [Google Scholar]
- Gu YQ, Salse J, Coleman-Derr D, Dupin A, Crossman C, Lazo GR, Huo N, Belcram H, Ravel C, Charmet G, et al. (2006) Types and rates of sequence evolution at the high-molecular-weight glutenin locus in hexaploid wheat and its ancestral genomes. Genetics 174: 1493–1504 [DOI] [PMC free article] [PubMed] [Google Scholar]
- Guex N, Peitsch MC. (1997) SWISS-MODEL and the Swiss-PdbViewer: an environment for comparative protein modeling. Electrophoresis 18: 2714–2723 [DOI] [PubMed] [Google Scholar]
- Guo ZA, Song YX, Zhou RH, Ren ZL, Jia JZ. (2010) Discovery, evaluation and distribution of haplotypes of the wheat Ppd-D1 gene. New Phytol 185: 841–851 [DOI] [PubMed] [Google Scholar]
- Hao CY, Dong YC, Wang LF, You GX, Zhang H, Ge HM, Jia JZ, Zhang XY. (2008) Genetic diversity and construction of core collection in Chinese wheat genetic resources. Chin Sci Bull 53: 908–915 [Google Scholar]
- Hao CY, Wang LF, Ge HM, Dong YC, Zhang XY. (2011) Genetic diversity and linkage disequilibrium in Chinese bread wheat (Triticum aestivum L.) revealed by SSR markers. PLoS ONE 6: e17279. [DOI] [PMC free article] [PubMed] [Google Scholar]
- Hao CY, Wang LF, Zhang XY, You GX, Dong YS, Jia JZ, Liu X, Shang XW, Liu SC, Cao YS. (2006) Genetic diversity in Chinese modern wheat varieties revealed by microsatellite markers. Sci China C Life Sci 49: 218–226 [DOI] [PubMed] [Google Scholar]
- Hirose T, Scofield GN, Terao T. (2008) An expression analysis profile for the entire sucrose synthase gene family in rice. Plant Sci 174: 534–543 [Google Scholar]
- Jiang Q, Hou J, Hao C, Wang L, Ge H, Dong Y, Zhang X. (2011) The wheat (T. aestivum) sucrose synthase 2 gene (TaSus2) active in endosperm development is associated with yield traits. Funct Integr Genomics 11: 49–61 [DOI] [PubMed] [Google Scholar]
- Keeling PL, Myers AM. (2010) Biochemistry and genetics of starch synthesis. Annu Rev Food Sci Technol 1: 271–303 [DOI] [PubMed] [Google Scholar]
- Kleczkowski LA, Kunz S, Wilczynska M. (2010) Mechanisms of UDP-glucose synthesis in plants. Crit Rev Plant Sci 29: 191–203 [Google Scholar]
- Mohan A, Kulwal P, Singh R, Kumar V, Mir RR, Kumar J, Prasad M, Balyan HS, Gupta PK. (2009) Genome-wide QTL analysis for pre-harvest sprouting tolerance in bread wheat. Euphytica 168: 319–329 [Google Scholar]
- Morell MK, Kosar-Hashemi B, Cmiel M, Samuel MS, Chandler P, Rahman S, Buleon A, Batey IL, Li Z. (2003) Barley sex6 mutants lack starch synthase IIa activity and contain a starch with novel properties. Plant J 34: 173–185 [DOI] [PubMed] [Google Scholar]
- Olmos S, Distelfeld A, Chicaiza O, Schlatter AR, Fahima T, Echenique V, Dubcovsky J. (2003) Precise mapping of a locus affecting grain protein content in durum wheat. Theor Appl Genet 107: 1243–1251 [DOI] [PubMed] [Google Scholar]
- SanMiguel P, Gaut BS, Tikhonov A, Nakajima Y, Bennetzen JL. (1998) The paleontology of intergene retrotransposons of maize. Nat Genet 20: 43–45 [DOI] [PubMed] [Google Scholar]
- Schwede T, Kopp J, Guex N, Peitsch MC. (2003) SWISS-MODEL: an automated protein homology-modeling server. Nucleic Acids Res 31: 3381–3385 [DOI] [PMC free article] [PubMed] [Google Scholar]
- Sharp PJ, Kreis M, Shewry PR, Gale MD. (1988) Location of β-amylase sequence in wheat and its relatives. Theor Appl Genet 75: 289–290 [Google Scholar]
- Sourdille P, Singh S, Cadalen T, Brown-Guedira GL, Gay G, Qi L, Gill BS, Dufour P, Murigneux A, Bernard M. (2004) Microsatellite-based deletion bin system for the establishment of genetic-physical map relationships in wheat (Triticum aestivum L.). Funct Integr Genomics 4: 12–25 [DOI] [PubMed] [Google Scholar]
- Su ZQ, Hao CY, Wang LF, Dong YC, Zhang XY. (2011) Identification and development of a functional marker of TaGW2 associated with grain weight in bread wheat (Triticum aestivum L.). Theor Appl Genet 122: 211–223 [DOI] [PubMed] [Google Scholar]
- Tian Z, Qian Q, Liu Q, Yan M, Liu X, Yan C, Liu G, Gao Z, Tang S, Zeng D, et al. (2009) Allelic diversities in rice starch biosynthesis lead to a diverse array of rice eating and cooking qualities. Proc Natl Acad Sci USA 106: 21760–21765 [DOI] [PMC free article] [PubMed] [Google Scholar]
- Turner NC. (2004) Agronomic options for improving rainfall-use efficiency of crops in dryland farming systems. J Exp Bot 55: 2413–2425 [DOI] [PubMed] [Google Scholar]
- Wang LF, Ge HM, Hao CY, Dong YS, Zhang XY. (2012) Identifying loci influencing 1,000-kernel weight in wheat by microsatellite screening for evidence of selection during breeding. PLoS ONE 7: e29432. [DOI] [PMC free article] [PubMed] [Google Scholar]
- Xing YZ, Zhang QF. (2010) Genetic and molecular bases of rice yield. Annu Rev Plant Biol 61: 421–442 [DOI] [PubMed] [Google Scholar]
- Yan J, Kandianis CB, Harjes CE, Bai L, Kim EH, Yang X, Skinner DJ, Fu Z, Mitchell S, Li Q, et al. (2010) Rare genetic variation at Zea mays crtRB1 increases β-carotene in maize grain. Nat Genet 42: 322–327 [DOI] [PubMed] [Google Scholar]
- Yang DL, Jing RL, Chang XP, Li W. (2007) Identification of quantitative trait loci and environmental interactions for accumulation and remobilization of water-soluble carbohydrates in wheat (Triticum aestivum L.) stems. Genetics 176: 571–584 [DOI] [PMC free article] [PubMed] [Google Scholar]
- Yang J, Zhang J, Wang Z, Xu G, Zhu Q. (2004) Activities of key enzymes in sucrose-to-starch conversion in wheat grains subjected to water deficit during grain filling. Plant Physiol 135: 1621–1629 [DOI] [PMC free article] [PubMed] [Google Scholar]
- Zhang DL, Hao CY, Wang LF, Zhang XY. (2012) Identifying loci influencing grain number by microsatellite screening in bread wheat (Triticum aestivum L.). Planta 236: 1507–1517 [DOI] [PubMed] [Google Scholar]
- Zhang DQ, Xu BH, Yang XH, Zhang ZY, Li BL. (2011) The sucrose synthase gene family in Populus: structure, expression, and evolution. Tree Genet Genomes 7: 443–456 [Google Scholar]
- Zhang XY, Li CW, Wang LF, Wang HM, You GX, Dong YS. (2002) An estimation of the minimum number of SSR alleles needed to reveal genetic relationships in wheat varieties. I. Information from large-scale planted varieties and cornerstone breeding parents in Chinese wheat improvement and production. Theor Appl Genet 106: 112–117 [DOI] [PubMed] [Google Scholar]
- Zhang XY, Tong YP, You GX, Hao CY, Ge HM, Wang LF, Li B, Dong YS, Li ZS. (2007) Hitchhiking effect mapping: a new approach for discovering agronomic important genes. Agric Sci China 6: 255–264 [Google Scholar]
- Zheng Y, Anderson S, Zhang Y, Garavito RM. (2011) The structure of sucrose synthase-1 from Arabidopsis thaliana and its functional implications. J Biol Chem 286: 36108–36118 [DOI] [PMC free article] [PubMed] [Google Scholar]
Associated Data
This section collects any data citations, data availability statements, or supplementary materials included in this article.


