Version Changes
Revised. Amendments from Version 1
To the reviewers. We are grateful for your detailed reviews, they have been helpful in order to improve both our work and our manuscript. Based on the reviewers' comments, we have introduced some modifications to the original version. The summary of those modifications is included here: (i) we have simplified the abstract; (ii) we have included a new paragraph and figure in the Introduction section summarizing other approaches related to web-based visualization of protein sequence annotations; (iii) we have emphasized the novelty of this work at the end of the Introduction section; (iv) we have added a figure showing the relation across the main component and its extensions at the beginning of the Extensions section; and (v) we have corrected the typos and grammar errors from the first version.
Abstract
Summary: FeatureViewer is a BioJS component that lays out, maps, orients, and renders position-based annotations for protein sequences. This component is highly flexible and customizable, allowing the presentation of annotations by rows, all centered, or distributed in non-overlapping tracks. It uses either lines or shapes for sites and rectangles for regions. The result is a powerful visualization tool that can be easily integrated into web applications as well as documents as it provides an export-to-image functionality.
Availability: https://github.com/biojs/biojs/blob/master/src/main/javascript/Biojs.FeatureViewer.js; http://dx.doi.org/10.5281/zenodo.7719
Introduction
Position-based annotation is one of the cornerstones of bioinformatics. A great number of databases, analysis and prediction methods are geared towards providing data mapped to specific sequence coordinates. In the case of proteins, the Pfam 1 database identifies, marks-up, and characterizes different functional regions within a given protein. The coordinates of these domains are often given in terms of the start and end position within the protein. The largest pool of reviewed and automatically annotated proteins is provided by the UniProt Consortium 2. It contains position-based annotations for structural regions, modified residues, and functional sites among others. Finally, protein feature prediction methods such as those integrated into PredictProtein 3 provide position-based annotations such as secondary structure states, buried and exposed residues, coiled-coil stretches, and disordered regions. PredictProtein also maps functional regions such as protein-protein binding sites and protein-DNA binding sites onto positions within the sequence.
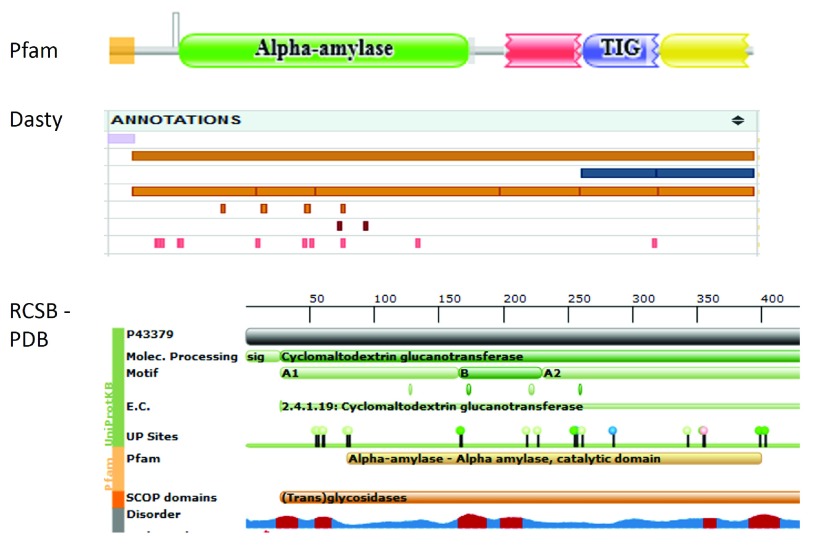
Visualization of protein sequence features has already been used in different projects, some of which are shown in Figure 1. For intance, Pfam renders Pfam domains as well as some sites of interest, such as metals, active binding sites, and also disulphide bonds. It supports uncertainty for the start and end positions of the features by means of variations of rectangular-based shapes. Dasty 4 displays protein features from different sources as well as sequences and 3D structures, provindg an overview of the visualized protein. The Research Collaboratory for Structural Bioinformatics Protein Data Bank (RCSB-PDB) 5 mainly focuses on 3D structures for proteins but also includes feature visualization, showing the relationship between UniProt and PDB coordinates.
Figure 1. Visualization of a portion of the protein P43379–UniProt accession, in Pfam, Dasty and RCSB-PDB.
BioJS 6 is an open source JavaScript collection of components for visualization of biological data on the web. Here, we present FeatureViewer and its current extensions: SimpleFeatureViewer that simplifies the input data format, and DasProteinFeatureViewer that retrieves the input data from a web service. The FeatureViewer is a standard, portable BioJS component designed to easily render position-based annotations, a.k.a. features. The FeatureViewer component can be easily integrated into and controlled from other applications. As the FeatureViewer and its extensions have been developed within the BioJS framework, they result in a set of modular visual components displaying position-based annotations that can be integrated with other web applications in a standard manner. Modularity and easy integration differentiate these components from previous protein feature web based visualization efforts.
The FeatureViewer component
The FeatureViewer component extensively uses the Raphaël javascript library 7 that renders Scalable Vector Graphics (SVG) objects in modern web browsers. The use of SVG allows the graphics to scale to any requested resolution and is portable across different computing platforms and viewing software.
The FeatureViewer component can be easily integrated into any web application by including its dependencies in the head section, e.g., jQuery 8 and Raphaël, and then instantiating the component within a JavaScript section. A special dependency for some images is required as they are used for the pop-up dialogue controls. The code below shows how to instantiate the component to create the visualization shown in Figure 2. A complete example and more information can be found at http://www.ebi.ac.uk/Tools/biojs/registry/Biojs.FeatureViewer.html. The FeatureViewer component has been tested with modern browsers such as Mozilla, Chrome, and Internet Explorer (IE); however, the image export option is not available in IE.
Figure 2. Visualization of a peptide using the FeatureViewer component.

                    var json = {
  featuresArray:[{
   // configuration for each style
   nonOverlappingStyle:{heightOrRadius:10, y:56}
   ,centeredStyle:{heightOrRadius:40, y:75}
   ,rowsStyle:{heightOrRadius:10, y:157}
   // feature information
   ,featureLabel:’Elicitor peptide 3’
   ,evidenceText:’UniProt’
   ,typeCode:’SO:0001064’
   ,typeCategory:’Molecule processing’
   ,featureId:’UPKB_Q8LAX3_PEPTIDE_74_96’
   ,featureTypeLabel:’active_peptide’
   // Display information
   ,type:’rect’, fillOpacity:0.5, stroke:’#7DBAA4’
   ,height:10, r:10, y:56, x:529, cy:56, cx:529
   ,strokeWidth:1, fill:’#7DBAA4’, width:151
  }]
  ,segment:Q8LAx3
  ,legend:{/*omitted ...*/}
  ,configuration:{
   // centered style
   sizeYCentered:160, sequenceLineYCentered:95,
   ,verticalGridLineLengthCentered:172
   ,horizontalGridNumLinesCentered:6
   // similar non–overlaping & rows (omitted)
   ,style:’nonOverlapping’, nonOverlapping:true
   // ruler
   ,requestedStart:1, requestedStop:96
   ,rulerY:20, rulerLength:660, belowRuler:30
   ,pixelsDivision:50, aboveRuler:10
   // others
   ,sizeY:76, sizeX:700, rightMargin:20
   ,leftMargin:20, sequenceLineY:54
   ,sequenceLength:96, unitsize:6.875
   ,sizeYKey:210, verticalGridLineLength:66
   ,horizontalGridNumLines:2
   ,gridLineHeight:12
   ,verticalGrid:false, horizontalGrid:false
   ,verticalGridLineLengthRows:284
   ,horizontalGridNumLinesRows:8
   ,dasSources:’http://www.ebi.ac.uk/das
   –srv/uniprot/das/uniprot’
   ,dasReference:’http://www.ebi.ac.uk/das
   –srv/uniprot/das/uniprot’
   }
};
var myPainter = new Biojs.FeatureViewer ({
  target: ”YourOwnDivId”,
  json: json
});
Options and data
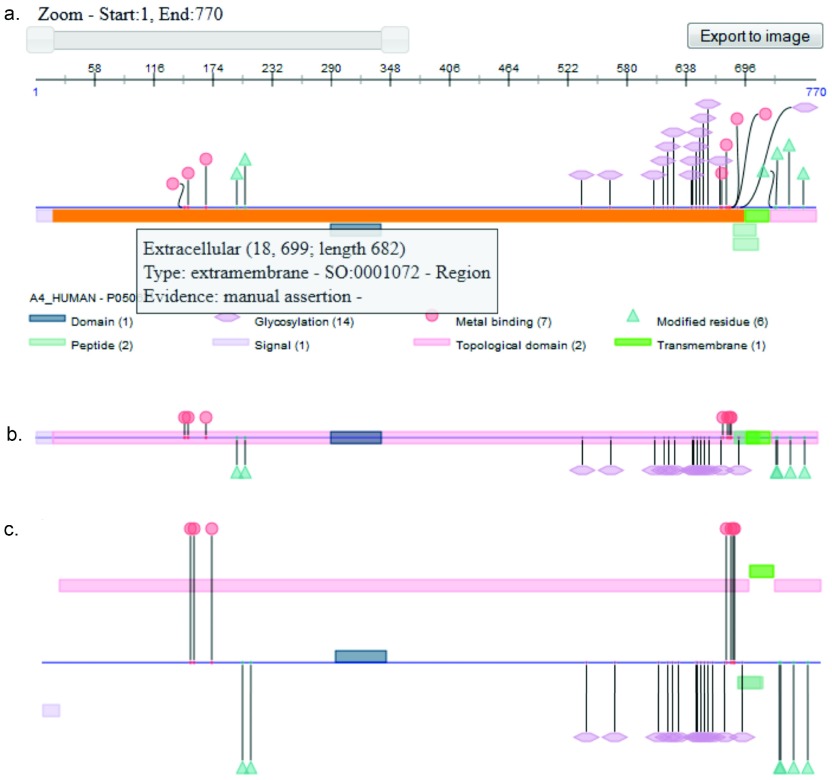
In order to instantiate the FeatureViewer component, some options should be defined. The mandatory options correspond to (i) a place holder named target, i.e., a DIV element in the web page where the annotations will be rendered, and (ii) a JSON object, named json, with the configuration, the protein identifier, the annotations, and the legend. FeatureViewer is a dummy component in the sense that it does not make any calculations about where to render the annotations, not even when the rendering style is changed; all the rendering information is provided in the json option. A comprehensive list of the elements in the json option is available at http://www.ebi.ac.uk/Tools/biojs/registry/Biojs.FeatureViewer.html. The FeatureViewer component includes three different layouts to display the features: all features centered, features grouped by type, and features organized in non-overlapping tracks, as shown in Figure 3.
Figure 3.
This visualization corresponds to the UniProt protein "Amyloid beta A4 protein" in the non-overlapping style; interactions such as shape dragging, tooltip, and selection as well as user controls such as zooming and image exporting are illustrated in this figure; b. shows the centralized view, while c. shows the by-rows view.
User controls
Additional options can also be specified in order to customize the user controls as well as interaction with the features. User controls include the zooming slider and the export-to-image button, as shown in the Figure 3a. The zooming slider allows users to hone in on a region of interest and view it in greater detail, making it possible to move from an overview aspect into a detailed one without navigating to a different page. The export-to-image button allows users to export the rendered features into an image that can embedded into a paper or presentation.
Different kinds of interaction are also possible. Events bound to rendered annotations include a mouse-over action that highlights and colors the "focused" feature. Click action is also supported. Clicking on a feature selects it so it will remain highlighted until another feature is selected; clicking an already selected feature will deselect it. Tooltips tied to each shape pop up and reveal additional information about the rendered annotations. Either shapes or lines can be used to display features covering one single amino acid; currently metal bindings can be rendered as circles, active sites as diamonds, lipidation as waves, glycosylation as hexagons, and other post translational modifications, i.e., modified residues, as triangles. When shapes are used, it is possible to drag them making it easier to distinguish one from another when they are clustered.
Extensions
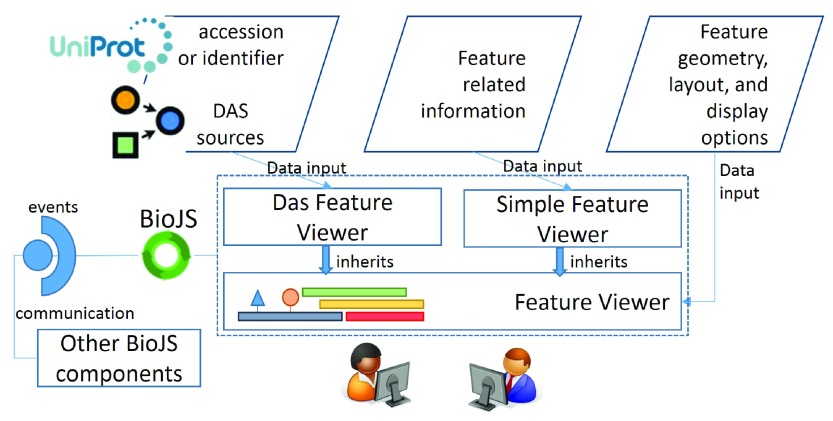
In order to make it easier for both developers and users to work wiht the FeatureViewer, two extensions are also provided. SimpleFeatureViewer simplifies the required features data while DasProteinFeatureViewer uses a web service to retrieve the features data. Figure 4 shows the three components in the Feature Viewer family.
Figure 4. This graphic shows the FeatureViewer component and its extensions as well as the variations on the required input data.
It also illustrates how BioJS handles the interaction with other components by means of events.
As FeatureViewer requires highly detailed information in order to display the features, a simpler version, the SimpleFeatureViewer component, builds on top of it. This simplified version takes care of calculating the configuration options as well as the localization of the features; thus, developers using this version can focus on the actual data rather than on intricate details regarding styles, pixels, and coordinates. However, only the non-overlapping tracks style is supported by this component. The main advantage of this component is that its data structure is much simpler than the one required for FeatureViewer, as observed in the following code excerpt.
                        var myFT = [
  {
   featureId:’UNIPROTKB_Q8LAX3_PEPTIDE_54_96’,
   featureStart:54, featureEnd:96,
   typeLabel:’Peptide’, typeCode:’SO:0001064’,
   featureLabel:’Elicitor peptide 3’,
   typeCategory:’Molecule processing’,
   evidenceText:’UniProt’, evidenceCode:’ ’,
   color:’blue’
  },
  {
   featureId:’UNIPROTKB_Q8LAX3_PEPTIDE_74_96’,
   featureStart:74, featureEnd:96,
   typeLabel:’Active Site’,
   typeCode:’SO:0001064’
   featureLabel:’Elicitor peptide 3’,
   typeCategory:’Molecule processing’,
   evidenceText:’UniProt’, evidenceCode:’ ’,
   type:’diamond’
  },
  {
   featureId:’UPKB_Q8LAX3_DISULFID_75_96’,
   featureStart:75, featureEnd:96,
   typeLabel:’Active Site’,
   typeCode:’SO:0001064’
   featureLabel:’Elicitor peptide 3’,
   typeCategory:’Molecule processing’,
   evidenceText:’UniProt’, evidenceCode:’ ’,
   color:’#33FF66’,
   type:’bridge’
   }];
var myPainter =
   new Biojs.SimpleFeatureViewer ({
   target:’YourOwnDivId’,
   sequenceId:’a4_human’,
   sequenceLength:770,
   features:myFT
});
This component requires a place holder, a sequence identifier, a sequence length, and a features array; the width in pixels to be used to rendered the protein features can also be defined by using the option imageWidth. The features array contains information for each feature to be displayed including, for instance, identifier, start and end positions in the sequence, label, and color among others. More information is available at http://www.ebi.ac.uk/Tools/biojs/registry/Biojs.SimpleFeatureViewer.html.
A second extension, the DasProteinFeatureViewer, makes use of a web service that retrieves data from Distributed Annotation System (DAS) sources. DAS defines a communication protocol used to exchange annotations on gene or protein sequences 9. Multiple protein databases provide their data following the DAS principles, for instance UniProt and InterPro 10. For this extension, no information about the features themselves is required as such details will be retrieved from the web service, as shown in the code below.
                        var myPainter =
  new Biojs.DasProteinFeatureViewer({
   target: ”YourOwnDivId”,
   segment: ”a4_human”
});
Additional options allow developers to specify the protein identifier, the DAS sources, the feature types – e.g., domain, chain, variant, etc., the rendering style, the image width, and some others. In order to avoid cross-domain problems, a proxy can also be specified. The feature types used by this component are those defined by UniProt, which is also used as the reference DAS source, i.e., the one providing the protein sequence. More information available at http://www.ebi.ac.uk/Tools/biojs/registry/Biojs.DasProteinFeatureViewer.html
Use case
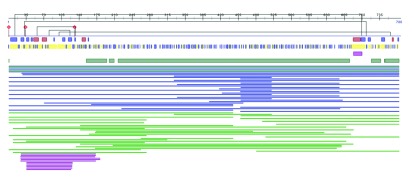
The PredictProtein service 3 integrates multiple algorithms that either retrieve from curated databases or automatically predict aspects of protein structure and function. Many of the predictions provided by the methods are mapped to positions within the protein. In order to easily highlight patterns, compare predictions, and cross-validate results, the PredictProtein interface lays out the predicted annotations in data tracks, i.e., in separate rows, each row presenting different predicted features. Data tracks are laid one under the other and enable the quick overview of some of the prominent features of the protein e.g., a cluster of binding sites close to the N-terminal or the count of trans-membrane regions. Figure 5 shows the implementation of the FeatureViewer component used for the PredictProtein service.
Figure 5. FeatureViewer is used by the PredictProtein service to show a stack of predicted structure and function features.

Conclusions
The FeatureViewer component and its extensions, SimpleFeatureViewer and DasProteinFeatureViewer, provide a platform to visualize position-based biological data easily and efficiently. FeatureViewer, like any other BioJS component, can be easily integrated with other web components or extended to have greater functionality than the one shown here. We expect this component to be particularly useful to developers and users alike, requiring little technical knowledge for its full functioning.
Software availability
Zenodo: BioJS Feature Viewer, doi: 10.5281/zenodo.7719 11
GitHub: BioJS, https://github.com/biojs/biojs/
Acknowledgements
GY thanks Burkhard Rost who helped fund this work and contributed ideas and feedback. GY also acknowledges Edda Kloppman and Tatyana Goldberg for helpful discussions and invaluable feedback and insight.
LG thanks Pablo Moreno who spotted a bug related to multiple instantiation and contributed to fixing it, as well as Mark Bingley, Claire O’Donovan, Sangya Pundir, and Xavier Watkins in the UniProt EMBL-EBI team and Rafael Jiménez and John Gómez in the IntAct EMBL-EBI team for their comments and suggestions about the FeatureViewer component and its extensions.
The authors thank all those who funded our research as well as researchers who deposited data into publicly available datasets and programmers who provided their work under a free license: our work stands upon their shoulders and would not have been possible without them.
Funding Statement
GY was supported by the Alexander von Humboldt Foundation. UniProt EMBL-EBI is funded by National Institutes of Health (NIH) [1U41HG006104-03].
The funders had no role in study design, data collection and analysis, decision to publish, or preparation of the manuscript.
v2; ref status: indexed
References
- 1.Punta M, Coggill PC, Eberhardt RY, et al. : The Pfam protein families database. Nucleic Acids Res. 2012;40(Database issue):D290–301 10.1093/nar/gkr1065 [DOI] [PMC free article] [PubMed] [Google Scholar]
- 2.UniProt Consortium Update on activities at the universal Protein Resource (uniprot) in 2013. Nucleic Acids Res. 2013;41(Database issue):D43–7 10.1093/nar/gks1068 [DOI] [PMC free article] [PubMed] [Google Scholar]
- 3.Rost B, Yachdav G, Liu J: The PredictProtein server. Nucleic Acids Res. 2004;32(Web Server issue):W321–6 10.1093/nar/gkh377 [DOI] [PMC free article] [PubMed] [Google Scholar]
- 4.Villaveces JM, Jimenez RC, Garcia LJ, et al. : Dasty3, a WEB framework for DAS. Bioinformatics. 2011;27(18):2616–2617 10.1093/bioinformatics/btr433 [DOI] [PMC free article] [PubMed] [Google Scholar]
- 5.Rose PW, Bi C, Bluhm WF, et al. : The RCSB Protein Data Bank: new resources for research and education. Nucleic Acids Res. 2013;41(D1):D475–D482 10.1093/nar/gks1200 [DOI] [PMC free article] [PubMed] [Google Scholar]
- 6.Gómez J, García LJ, Salazar GA, et al. : BioJs: an open source Javascript framework for biological data visualization. Bioinformatics. 2013;29(8):1103–4 10.1093/bioinformatics/btt100 [DOI] [PMC free article] [PubMed] [Google Scholar]
- 7.Raphaël—javascript library.2013. Reference Source [Google Scholar]
- 8.jquery—javascript library.2014. Reference Source [Google Scholar]
- 9.Jenkinson AM, Albrecht M, Birney E, et al. : Integrating biological data--the Distributed Annotation System. BMC Bioinformatics. 2008;9(Suppl 8):S3 10.1186/1471-2105-9-S8-S3 [DOI] [PMC free article] [PubMed] [Google Scholar]
- 10.Hunter S, Jones P, Mitchell A, et al. : InterPro in 2011: new developments in the family and domain prediction database. Nucleic Acids Res. 2012;40(Database issue):D306–D312 10.1093/nar/gkr948 [DOI] [PMC free article] [PubMed] [Google Scholar]
- 11.Leyla G, Yachdav G, Moreno P: Biojs feature viewer. Zenodo. 2014. Data Source [Google Scholar]


