Abstract
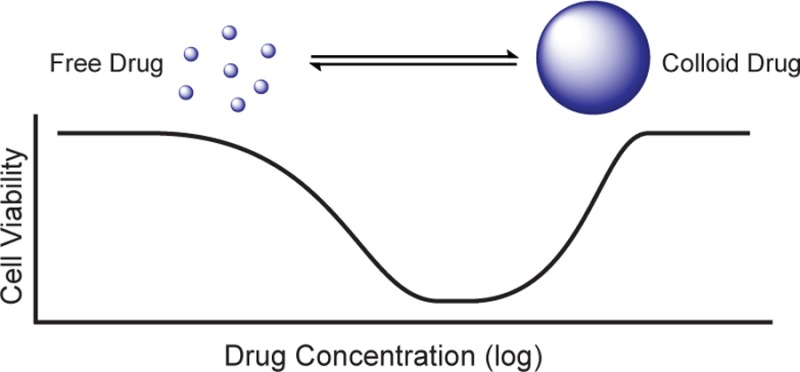
Drug efficacy does not always increase sigmoidally with concentration, which has puzzled the community for decades. Unlike standard sigmoidal curves, bell-shaped concentration–response curves suggest more complex biological effects, such as multiple-binding sites or multiple targets. Here, we investigate a physical property-based mechanism for bell-shaped curves. Beginning with the observation that some drugs form colloidal aggregates at relevant concentrations, we determined concentration–response curves for three aggregating anticancer drugs, formulated both as colloids and as free monomer. Colloidal formulations exhibited bell-shaped curves, losing activity at higher concentrations, while monomeric formulations gave typical sigmoidal curves, sustaining a plateau of maximum activity. Inverting the question, we next asked if molecules with bell-shaped curves, reported in the literature, form colloidal aggregates at relevant concentrations. We selected 12 molecules reported to have bell-shaped concentration–response curves and found that five of these formed colloids. To understand the mechanism behind the loss of activity at concentrations where colloids are present, we investigated the diffusion of colloid-forming dye Evans blue into cells. We found that colloidal species are excluded from cells, which may explain the mechanism behind toxicological screens that use Evans blue, Trypan blue, and related dyes.
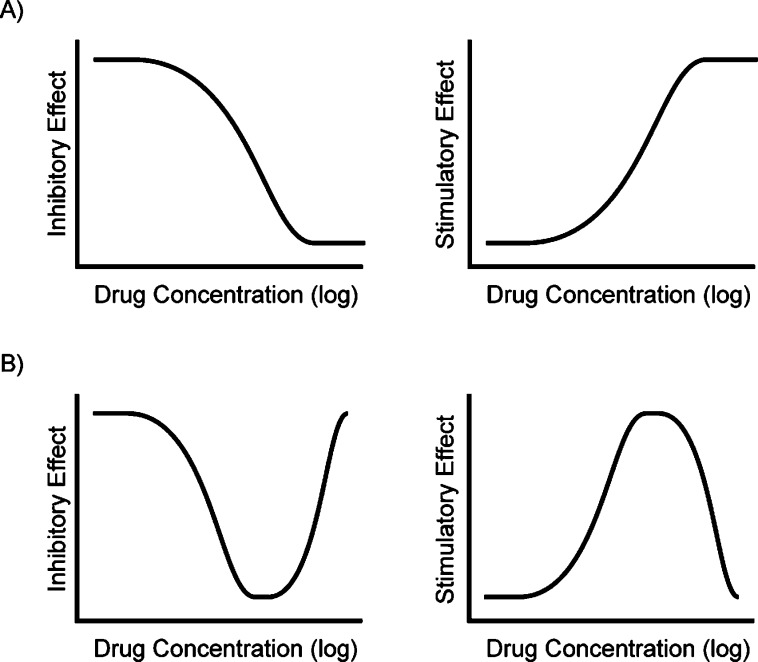
The concentration–response relationship describes the important pharmacodynamic connection between drug concentration and biological effect.1 The classic assumption for the concentration–response relationship is that a drug is ineffective at low concentrations, moderately effective at intermediate concentrations, and reaches a maximum level of efficacy at higher concentrations, which it subsequently retains. A quantitative graph of this relationship typically gives a sigmoidal curve (Figure 1), the characteristics of which have been studied and defined for 70 years.2−4 However, some drugs and reagents do not exhibit the classic concentration–response correlation and instead show “bell-” or “U-shaped” curves, which are nonsigmoidal and have a “non-monotonic dose response”.5
Figure 1.
Concentration–response curve shapes relate drug concentration to the level of antagonist (inhibitory) or agonist (stimulatory) effect. (A) Classic sigmoidal dose–response curves depict an increase in effect with increasing drug concentration. (B) Non-monotonic “U-shaped” and “bell-shaped” dose–response curves. Drug efficacy increases with increasing concentration to a maximum level, above which the effect is diminished.
Though bell-shaped concentration–response curves are not the rule, neither are they the exception, and there are well over 1000 citations to molecules with this behavior in the literature. Familiar examples of bell-shaped curves include those in endocrine disruption: the concentration–response relationship for androgens often depicts agonist effects at low concentrations and antagonist effects at high concentrations.6−8 For example, 5α-dihydrotestosterone, 17β-estradiol, and progesterone, tested in vitro, induce cell proliferation of human prostatic carcinoma at low concentrations but inhibit proliferation at high concentrations.8−10 The hermetic dose–response relationship for androgens is theorized to result from receptor binding-activation at low concentrations and chromatin rearrangement-quiescence at high concentrations.11 In contrast, many chemical agents are beneficial at low concentrations but detrimental at higher concentrations.12 For instance, allixin improves the survival and proliferation of primary neurons from embryonic rats at low concentrations but causes cell death at high concentrations.13 Other U-shaped curves result from a single drug having more than one mechanism of action. Genistein has been reported to both activate and inhibit cystic fibrosis transmembrane conductance regulator (CFTR) by binding through multiple sites. CFTR activation dominates at low genistein concentrations, while inhibition dominates at high concentrations.14 These and other explanations offer classical mechanisms through which bell-shaped curves may be understood. Still, for most molecules, such mechanisms have not been proffered, and thus the unusual bell-shaped concentration–response curves for many reagents remains to be elucidated.
Whereas biological mechanisms, such as actions at multiple targets, have been explored to explain bell-shaped concentration–response curves, the role of the physical behavior of the reagents has received little attention. Over the past decade it has become apparent that the self-association of organic molecules into colloidal particles can drastically change their behavior in biological assays.4,15−21 Originally described as one of the problems22,23 affecting purified proteins in biochemical assays, small molecule colloids have recently been shown to affect behavior in cell-based infectivity assays,24 in environments simulating those of the stomach and small intestine,25,26 and in cell culture media.27,28 Anticancer drugs such as fulvestrant, sorafenib, and crizotinib, among others, have critical aggregation concentrations (CACs) of 0.5–20 μM. Below their respective CACs, the drugs exist in a classic monomeric form where, at sufficiently high (monomeric) concentrations, they are toxic to cells; however, above their CACs, these drugs form colloidal aggregates that are substantially less cytotoxic in cell assays.27 Thus, as the concentration of these drugs is raised, cytotoxicity rises monotonically and sigmoidally until their CAC is reached, at which point cytotoxicity plateaus or even begins to drop.27 This observation prompted us to wonder whether colloid formation might explain bell-shaped concentration–response curves among drugs and reagents more generally.
Here we investigate the concentration–response of three anticancer drugs known to form colloids, fulvestrant, sorafenib, and crizotinib, over a range of concentrations to establish their full concentration–response profiles. We find that each of these three drugs displays the non-monotonic “bell-shaped” curves under conditions where they transition into colloidal aggregates, whereas they display typical monotonic sigmoidal concentration–response curves when maintained in their monomeric state. At the same time, we identify several reagents with bell-shaped curves from the literature and show that they too form colloidal aggregates. To understand the mechanistic basis of these bell-shaped curves, we investigate the diffusion of colloidal species across cell membranes and find that they are physically excluded from passive diffusion, which contrasts with the passive diffusion of free monomeric drug across the cell membrane and its consequent efficacy.
Results and Discussion
Colloidal Formulations Exhibit Bell-Shaped Concentration–Response Curves in Cell Proliferation Assays
Considering that drug efficacy varies with concentration, we evaluated the correlation of colloid formation with cytotoxicity of three anticancer drugs, paying specific attention to drug effects both above and below the critical aggregation concentration. We tested the antiproliferative activity of the three known aggregators (fulvestrant, sorafenib, and crizotinib) over a broad concentration range by preparing these drugs as both colloidal and monomeric formulations. The formulations that transitioned from monomer to colloid above their CAC values were simply the drugs themselves, dissolved in DMSO, delivered without additional excipients into cell culture media. Final colloidal formulations contained 0.1% DMSO/media stocks (Methods). The formulations that remained monomeric throughout the dosing range included 0.025% v/v of the nonionic detergent Ultra-Pure polysorbate 80 (UP 80); in previous studies27 and controls conducted here (Supplemental Figure S1), this mild detergent has no observable effect on cell behavior. At low concentrations, the concentration–response profile is similar between both “monomeric” and “colloidal” formulations. In contrast, at higher concentrations, the drugs lose efficacy, exhibiting the common U-shaped curve observed in the literature. We attribute this loss in activity to the drugs being in colloidal form (Figure 2). For example, at 1 μM concentration of sorafenib, both formulations inhibit the proliferation of MDA-MB-231 cells by about 65% relative to untreated controls; however, at 10 μM concentration of “colloidal” sorafenib, inhibition of cell proliferation was almost entirely eliminated, likely because the drug had crossed its critical concentration of 3.5 μM and had adopted a colloidal form. Conversely, by 10 μM of monomeric sorafenib, proliferation was inhibited by almost 90%, that is, sorafenib in its free form continued to have a classic, monotonic concentration–response curve. The same pattern was observed with all three drugs and all four cell lines tested. Notably, the loss of activity of the colloidal-transition formulation correlates closely with the CAC for each drug. For fulvestrant, the measured CAC is 0.5 μM, and we observe a loss of activity at 0.1 μM in two estrogen receptor positive cell lines in which fulvestrant is known to act, MCF7 and BT474.29 Likewise, crizotinib, with a CAC of 19.3 μM, loses activity between 10 and 100 μM in the T47D ductal carcinoma cell line. In all cells tested, the addition of UP 80 to the drug formulations prevents colloidal formation and preserves the expected activity of the monomeric drug at higher concentrations. In the absence of UP 80, these same drugs form colloids at higher concentrations, and at these concentrations, drug activity is lost.
Figure 2.
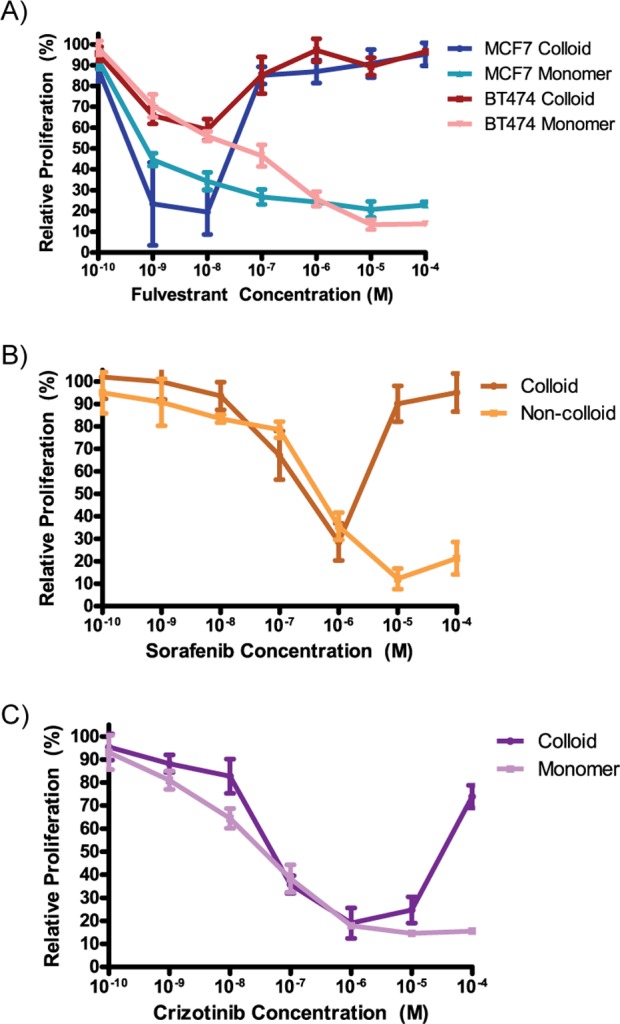
Concentration–response curves for colloidal formulations of anticancer drugs are U-shaped. (A) Fulvestrant was tested in two different cell lines: MCF-7 and BT-474. A distinct loss of activity is seen at concentrations ≥1 μM. (B) Sorafenib was tested in MDA-MB-231 cells and shows a loss of activity at concentrations ≥10 μM. (C) Crizotinib was tested in T47D cells and begins to lose antiproliferative activity at 10 μM (mean ± standard deviation; n = 6).
To ensure that the low amount of surfactant used to disrupt the colloids did not affect cell membrane integrity (Supplemental Figure S2), we treated cells with and without UP 80 detergent and monitored cell uptake of solid 100 nm fluorescent nanoparticles (FluoSpheres) (Figure 3A). These solid particles are unaffected by UP 80, and thus any difference in cell uptake is directly related to changes in membrane permeability. Importantly, there is no significant difference in the number of fluorescent particles per cell: ∼1 particle/cell was detected for all conditions and cell types, demonstrating that the UP 80 did not affect cell permeability of colloids but rather affected only colloidal stability, as nonionic detergents at low concentrations have previously been shown to do.30−32 The numbers of cells and particles per cell were quantified from confocal images (Figure 3B and C).
Figure 3.
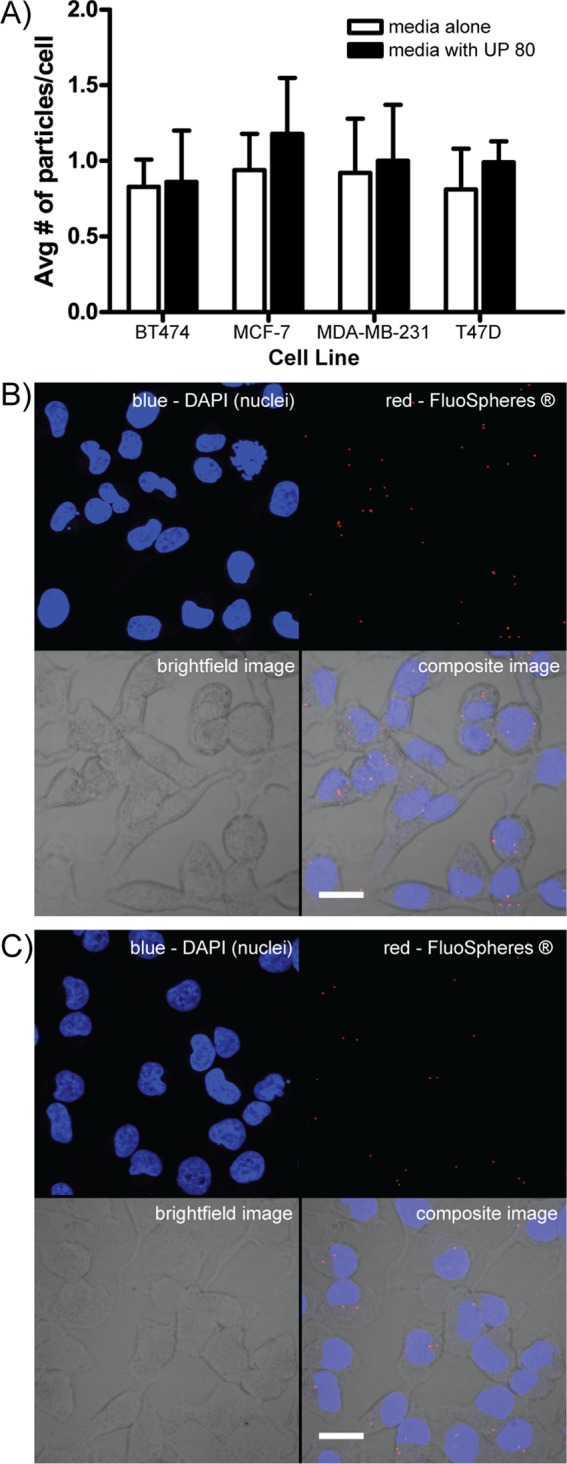
Ultrapure polysorbate 80 (UP 80) neither permeabilizes cells nor increases the cell uptake of fluorescent nanoparticles, demonstrating that the cell membrane of healthy cells is unaffected by UP 80. (A) Four different cancer cell lines were cultured for 24 h in media with 107 fluorescent solid nanoparticles/mL under colloidal conditions (media alone) or monomeric conditions (media containing UP 80). Irrespective of cell type, no significant difference in the number of fluorescent particles per cell was detected: ∼1 particle/cell was detected for all conditions and cell types. The number of cells and number of particles taken up by cells was quantified by directly counting confocal images (n = 6, mean ± SD, scale bar = 10 μm). (B) Representative images of MDA-MB-231 cells cultured under colloidal conditions: 0.1% DMSO, no UP 80. (C) Representative images of MDA-MB-231 cells cultured under monomeric conditions: 1% DMSO, with 0.025% UP 80.
Some Known Reagents with Bell-Shaped Curves Form Colloidal Aggregates
Given that known colloid formers such as fulvestrant, sorafenib, and crizotinib exhibit bell-shaped curves, will the reverse logic also hold? Do reagents known to have bell-shaped curves form colloidal aggregates? To investigate this question, we surveyed the literature for compounds that had bell-shaped concentration–response curves. Over 1000 scholarly papers were found that described reagents with such behavior (see Methods). Two of these compounds, fulvestrant27 and genistein,33 have previously been shown to be aggregating molecules. We acquired 10 more compounds, whose bell-curve behavior was largely unexplained, and tested whether they formed colloidal aggregates at relevant concentrations. Three of these compounds formed colloids with radii ranging from 24 to 82 nm as measured directly by dynamic light scattering (DLS).4,30 Their CAC values were within the range of concentrations observed for their cellular activities, often close to the maximum activities reported in their bell-shaped concentration–response curves (Table 1). For example, the concentration–response of the well-known flavonoid natural product genistein against MCF7 cells is bell-shaped, reaching maximum activity at 50 μM. By DLS, genistein forms colloidal particles with a CAC value of 150 μM (Table 1).34−36 This same pattern of lost drug activity at higher concentrations was observed with the other four reagents listed in Table 1 and previously observed to have bell-shaped concentration–response curves.
Table 1. Compounds with Bell-Shaped Curves Described in the Literature That Form Colloids.
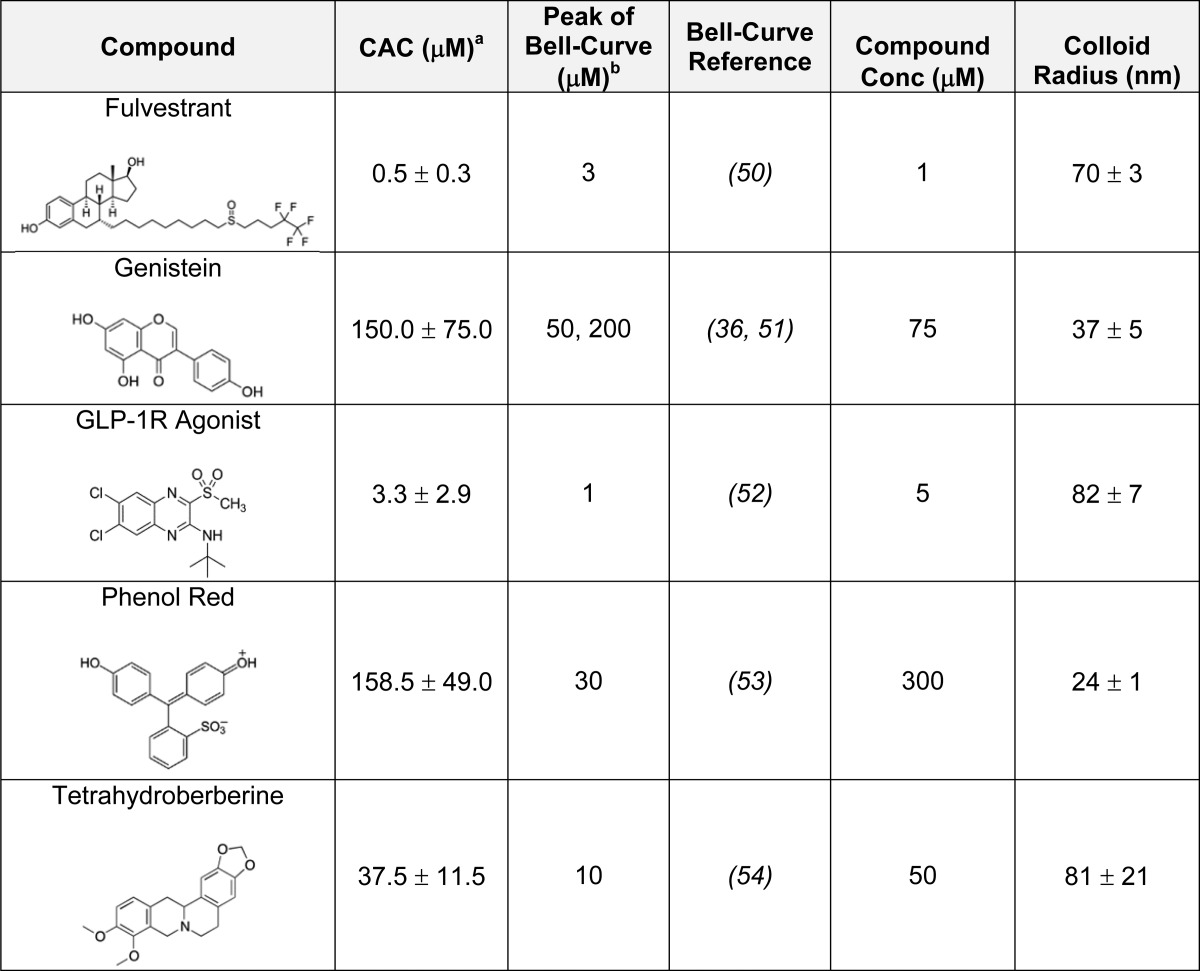
Measured as part of this study.
Approximate concentration shown in referenced paper.
Mechanistic Basis: Colloidal Particles Do Not Diffuse through Intact Cell Membranes
We suggest that colloid-forming molecules lose activity in cell culture because they cannot, in their colloidal form, cross the membranes through which their monomeric forms passively or actively diffuse. To investigate this hypothesis, we treated cells for 24 h with the dye Evans blue under conditions when it was predominantly either monomeric or colloidal and measured the fluorescence intensity of the dye in the cells by confocal microscopy (Figure 4A and B). Fascinatingly, Evans blue is only detected in live cells when it is in the primarily monomeric form, and not when it is in the primarily colloidal form.
Figure 4.
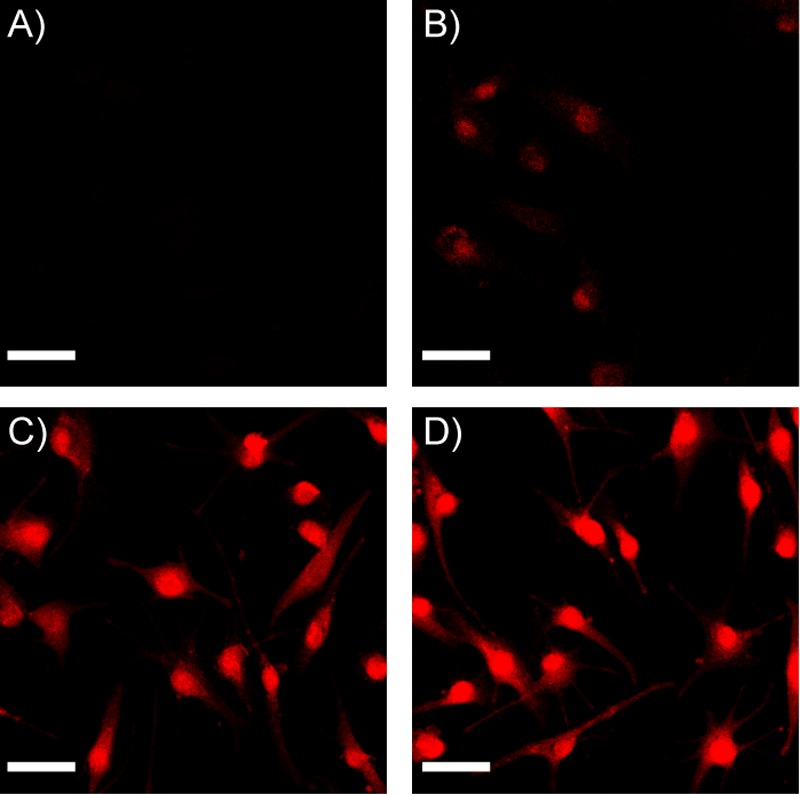
Evans blue colloids do not pass through intact cell membranes but enter cells in monomer form or pass through permeabilized cell membranes as colloids. (A) No fluorescence is detected in live cells exposed to Evans blue colloids. (B) Low fluorescence is detected in live cells exposed to Evans blue monomer, indicating that free, monomeric dye diffused passively into the cell. (C) Intense fluorescence is detected in cells permeabilized with 0.25% Triton X-100 and then treated with Evans blue colloids, after detergent washout, indicating that dye colloids are able to pass through dead cells. (D) Intense fluorescence is detected in cells permeabilized with 0.25% Triton X-100 and treated with Evans blue monomer. (Representative images shown of MDA-MB-231 cells; scale bar = 10 μm.) As we have not corrected for the differential fluorescence of the monomeric and colloidal forms of the dye, these images support only a qualitative analysis of this effect.
The simplest explanation for colloidal exclusion from membrane diffusion is that colloidal aggregates are too large for passive diffusion. We used Evans blue as a model drug-colloid because it is fluorescent, facilitating cell analysis. Evans blue colloids have an average radius of 125 nm37 and thus would have to be taken into cells by pinocytosis, instead of simple diffusion.38 Given the lack of colloidal Evans blue in healthy cells, pinocytosis did not occur at detectable levels. Formulation with UP 80 disrupts colloids, thereby resulting in a higher concentration of monomers that are able to pass through the cell membrane by diffusion. To ensure that Evans blue can diffuse through dead or dying cells, as has been observed for numerous decades, we observed that both the colloidal and monomeric forms of Evans blue readily pass through permeabilized cell membranes (Figure 4C and D). The exclusion of colloidal Evans blue from healthy, intact cells provides a likely explanation for the decreased efficacy of the colloidal drugs studied here: that colloidal drugs, like Evans blue, are unable to penetrate healthy cell membranes and are thus inefficacious. Indeed, the exclusion of Evans blue colloids may illuminate the mechanism of other related dyes, such as Trypan blue (Supplementary Figure S2), which is widely used in toxicological screens39 (as is Evans blue40). In the Trypan blue dye exclusion assay, cells are deemed dead if stained by the dye and deemed living if not stained by the dye. We have found that Trypan blue, with a CAC of 30 μM, forms colloids at the high concentrations used for exclusion assays; we suggest that, like its cousin Evans blue, the membranes of healthy cells are impermeable to Trypan blue colloids, which can only pass through the membranes of dead or damaged cells. If true, this would provide a mechanistic basis for the activity of a reagent that has been widely used for almost a century.
While colloidal exclusion almost certainly accounts for loss of activity, the fact that activity reverts to zero rather than flat-lining at an apparent maximum is intriguing. Drawing parallels to surfactant systems (e.g., liposomes, micelles, niosomes), aggregated drug in colloid form is in dynamic equilibrium with the unassociated free drug monomer in solution.16,37,41 At concentrations below the CAC, the monomer can freely diffuse and interact with proteins, including the cell membrane; however, at concentrations above the CAC, the binding of monomer to the cell membrane competes with monomer self-aggregation to colloids.16,42−45 Typically, the free-energy change of self-aggregation is much more negative than the free-energy change for protein-monomer binding.43,46,47 As such, as concentrations rise substantially above the CAC, we speculate that monomer is tied up in the aggregate-monomer exchange and is not available to interact with or enter the cell. This phenomenon has been observed for various nonionic surfactants: at concentrations below their respective critical micelle concentration (CMC), surfactants cause increased permeability and uptake of fluorescent probes,48 or even toxicity,49 in Caco-2 cell cultures. Conversely, above each surfactants’ CMC, these effects are removed; cell cultures show negligible permeability48 and negligible toxicity.49
Certain caveats merit discussion. Although colloid formation can lead to bell-shaped concentration–response curves and the bell-shaped curves of some reagents can be explained by colloidal aggregation, we do not argue that all bell-shaped concentration–response curves are explained by colloidal aggregation or even that all colloidal aggregators will have bell-shaped curves in cell culture. Many reagents have bell-shaped curves through action on multiple, counter-balanced targets or even binding at multiple-sites on a single target; this may explain the bell-shaped curves of the seven compounds tested here that were not observed to aggregate (Supplementary Table S3). Likewise, some aggregating molecules will form colloids outside of the range relevant for cellular activity and so will not exhibit a bell-shaped curve. Finally, in cell-culture experiments where one is studying membrane-bound receptors, especially in serum-free media, one may expect to see substantial affects by colloid-forming reagents.33
Taken together, the observations that known colloid-forming molecules have bell-shaped concentration–response curves in cell-based assays and that, reciprocally, at least some reagents known to have bell-shaped concentration–response curves form colloidal aggregates support the idea that bell-shaped concentration–response curves in cell-based assays can result from colloidal aggregation of the molecule itself.
Conclusions
While we do not argue that all bell-shaped curves are explained by colloidal aggregation, this should not obscure the likelihood that many bell-shaped concentration–response curves can be explained by this mechanism. Many drugs and reagents, at micromolar and submicromolar concentrations, aggregate into large colloidal particles. Such colloids cannot diffuse across the cell membrane, and as their concentration rises they act as sinks for even the free monomer, leading to a bell-shaped concentration–response. It is common to seek target-based mechanisms for these often baffling curves. While this may be warranted, establishing the plausibility of such target-based mechanisms demands extensive study. A virtue of the colloidal hypothesis is that colloids are rapidly detected and readily disrupted. Though colloid formation will not explain the bell-shaped activity of every reagent, those to which it does pertain can be easily demonstrated. One may subsequently adopt simple formulations that avoid it, revealing the unobscured behavior of the monomeric drug. Correspondingly, colloidal aggregation appears to be central to specific staining by cell and tissue reagents, such as Evans blue and Trypan blue, illuminating their specific mechanism of action after over 70 years of widespread use.
Methods
Fulvestrant and sorafenib were purchased from AK Scientific (Mountain View, CA); crizotinib from Selleck Chemicals (Houston, TX); rosmarinic acid, donepezil, and rosiglitazone from Santa Cruz Biotechnology (Dallas, TX); ketotifen, verapamil, genistein, and GLP-1R agonist from Sigma-Aldrich (St. Louis, MO); benzoquinoline from Spectrum Chemicals (New Brunswick, NJ); AFP 07 from Caymen Chemical (Ann Arbor, MI); phenol red from Amresco (Solon, OH); tetrahydroberberine from Vitas-M (Moscow, Russia). Ultrapure polysorbate 80 (UP 80) was purchased from NOF Corporation (White Plains, NY). Dulbecco’s phosphate buffered saline (DPBS) and RPMI 1640 cell culture media were purchased from Multicell Technologies (Woonsocket, RI). Charcoal-stripped Fetal bovine serum (FBS) was purchased from Sigma-Aldrich (St. Louis, MO). Cell lines MDA-MB-231 (HTB-26), MCF-7 (HTB-22), SK-BR-3 (HTB-30), and BT-474 (HTB-20) were purchased from ATCC (Manassas, VI). MTS cell proliferation assay was purchased from Promega (Madison, WI). Duke Standards NIST Traceable Polymer Microspheres were purchased from Thermo Scientific. FluoSpheres fluorescent nanoparticles were purchased form Life Technologies (Burlington, ON). All other chemicals and reagents were purchased from Sigma-Aldrich (St. Louis, MO) or TCI America (Portland, OR).
Drug Formulations
RPMI 1640 cell growth media with 10% charcoal-stripped fetal bovine serum (FBS) was used for all experiments. Stock solutions of each drug were prepared in DMSO. For colloidal formulations, stock solutions (2 μL) were combined with RPMI media (1998 μL) to give 1000-fold dilutions with 0.1% DMSO. For noncolloidal (free drug) formulations, stock drug solutions (2 μL) were first diluted 10-fold in DMSO and then mixed with RPMI media (1979.5 μL) and Ultrapure Polysorbate 80 (UP 80) (0.5 μL) to give 1000-fold drug dilutions with 1% DMSO (v/v) and 0.025% UP 80 (v/v). Vehicle controls were prepared in the same manner.
Cell Culture
Cell lines were maintained (<8 passages) in a tissue culture incubator (37 °C, 5% CO2, 95% humidified) in plastic culture flasks in relevant growth medium: MDA-MB-231 and BT-474 in RPMI 1640, MCF-7 in AMEM, and SK-BR-3 in McCoys 5A. All growth media was supplemented with 10% FBS, 10 U/mL penicillin, and 10 μg/mL streptomycin.
Concentration–Response Proliferation Assays
Cells were seeded at 10,000 cells/cm2 and allowed to adhere overnight. Drug formulations (described above) and control medium were made fresh and exchanged every 12 h for a total incubation of 72 h. Cells were then washed with fresh RPMI media, and proliferation was determined using MTS assays according to the manufacturer’s instructions or by directly counting the number of cells from fluorescent micrographs (nuclei stained with DAPI). Relative cell proliferation is defined as (absorbance of treated cells)/(absorbance of untreated cells) × 100.
Fluorescent Microparticle and Evans Blue Uptake
Nanoparticle solutions contained 107 particles/mL (FluoSpheres ) in colloidal media (0.1% DMSO in RPMI 1640 with 10% FBS) or free drug media (1% DMSO and 0.025% UP 80 in RPMI 1640 with 10% FBS). For Evans blue uptake studies, Evans blue solutions (50 mM) were made in the same media formulations above (colloidal and drug free media). Cells were seeded at 10,000 cells/cm2 and allowed to adhere overnight with nanoparticle solutions. For Evans blue permeabilization studies, cells were first treated with 0.25% Triton-X 100 in RPMI 1640 for 1 h, washed, and then treated with Evans blue solutions. After incubation for 24 h, cells were washed several times with DPBS, fixed in 4% paraformaldehyde (PFA) for 1 h, and mounted in media containing DAPI (Vectasheild, Vector Laboratories, Burlingame, CA).
Confocal Microscopy Imaging and Processing
Cells were imaged by confocal microscopy on an Olympus FV1000 at 60× magnification, using the following excitation and emission wavelengths: for DAPI, excitation at 405 nm, emission at 460 nm; for FluorSpheres, excitation at 560 nm, emission at 580 nm; for Evans blue, excitation at 560 nm, emission at 675 nm. Z-stacks of cells were collected with 0.5 μm steps between images, and all planes were quantified by directly counting cell nuclei and fluorescent particles.
Dynamic Light Scattering
Colloid radii and critical aggregation concentrations (CACs) for fulvestrant, GLP-1R agonist, phenol red, and tetrahydroberberine were determined using a DynaPro MS/X (Wyatt Technology) as previously described.16 Radii and CACs for genistein, Evans blue, and Trypan blue were determined using a DynaPro Plate Reader II (Wyatt Technology). Samples were made by diluting 100× DMSO stocks into 50 mM potassium phosphate, pH 7.0. Light scattering intensities (counts/second) were plotted versus compound concentration; the intersection of the lines below and above CAC were equated to find the CAC value. The values reported are the means and standard deviations obtained from three independent experiments.
Graphing and Statistics
All statistical analyses were performed using Graph Pad Prism version 5.00 for Windows (Graph Pad Software, San Diego California USA, www.graphpad.com). Differences among groups were assessed by one-way ANOVA with Bonferroni post hoc correction to identify statistical differences among three or more treatments. Alpha levels were set at 0.05, and a p-value of ≤0.05 was set as the criteria for statistical significance. All data are presented as mean ± standard deviation.
Acknowledgments
Supported by U.S. National Institutes of Health (NIH) grant GM71630 and an investigator grant from the Ontario Institute for Cancer Research (to B.K.S.). We thank Dr. Da Duan for helpful discussions in the preparation of this manuscript. S.C.O. and M.S.S. are grateful to The Nagai Foundation Tokyo for support through the CRS T. Nagai Postdoctoral Research Achievement Award.
Supporting Information Available
This material is available free of charge via the Internet at http://pubs.acs.org.
Author Contributions
§ These authors contributed equally to this work.
The authors declare no competing financial interest.
Funding Statement
National Institutes of Health, United States
Supplementary Material
References
- Delean A.; Munson P. J.; Rodbard D. (1978) Simultaneous analysis of families of sigmoidal curves—application to bioassay, radioligand assay, and physiological dose-response curves. Am. J. Physiol. 235, E97–E102. [DOI] [PubMed] [Google Scholar]
- Straus O. H.; Goldstein A. (1943) Zone behavior of enzymes: Illustrated by the effect of dissociation constant and dilution on the system cholinesterase-physostigmine. J. Gen. Physiol. 26, 559–585with technical assistance of Frank L. Plachte. [DOI] [PMC free article] [PubMed] [Google Scholar]
- Easson L. H.; Stedman E. (1936) The absolute activity of choline-esterase. Proc. R. Soc. Lond. B Biol. Sci. 121, 142–164. [Google Scholar]
- Shoichet B. K. (2006) Interpreting steep dose-response curves in early inhibitor discovery. J. Med. Chem. 49, 7274–7. [DOI] [PubMed] [Google Scholar]
- Calabrese E. J.; Baldwin L. A. (2001) The frequency of U-shaped dose responses in the toxicological literature. Toxicol. Sci. 62, 330–338. [DOI] [PubMed] [Google Scholar]
- Vandenberg L. N.; Wadia P. R.; Schaeberle C. M.; Rubin B. S.; Sonnenschein C.; Soto A. M. (2006) The mammary gland response to estradiol: Monotonic at the cellular level, non-monotonic at the tissue-level of organization?. J. Steroid Biochem. Mol. Biol. 101, 263–274. [DOI] [PubMed] [Google Scholar]
- Saal F. S. v.; Timms B. G.; Montano M. M.; Palanza P.; Thayer K. A.; Nagel S. C.; Dhar M. D.; Ganjam V. K.; Parmigiani S.; Welshons W. V. (1997) Prostate enlargement in mice due to fetal exposure to low doses of estradiol or diethylstilbestrol and opposite effects at high doses. Proc. Natl. Acad. Sci. U.S.A. 94, 2056–2061. [DOI] [PMC free article] [PubMed] [Google Scholar]
- Sonnenschein C.; Olea N.; Pasanen M. E.; Soto A. M. (1989) Negative controls of cell proliferation: Human prostate cancer cells and androgens. Cancer Res. 49, 3474–3481. [PubMed] [Google Scholar]
- Ralph J. L.; Orgebin-Crist M. C.; Lareyre J. J.; Nelson C. C. (2003) Disruption of androgen regulation in the prostate by the environmental contaminant hexachlorobenzene. Environ. Health Perspect. 111, 461–466. [DOI] [PMC free article] [PubMed] [Google Scholar]
- Wetherill Y. B.; Petre C. E.; Monk K. R.; Puga A.; Knudsen K. E. (2002) The xenoestrogen bisphenol A induces inappropriate androgen receptor activation and mitogenesis in prostatic adenocarcinoma cells. Mol. Cancer Ther. 1, 515–524. [PubMed] [Google Scholar]
- Vandenberg L. N.; Colborn T.; Hayes T. B.; Heindel J. J.; Jacobs D. R.; Lee D.-H.; Shioda T.; Soto A. M.; vom Saal F. S.; Welshons W. V.; Zoeller R. T.; Myers J. P. (2012) Hormones and endocrine-disrupting chemicals: Low-dose effects and nonmonotonic dose responses. Endocr. Rev. 33, 378–455. [DOI] [PMC free article] [PubMed] [Google Scholar]
- Calabrese E.; Mattson M. (2011) Hormesis provides a generalized quantitative estimate of biological plasticity. J. Cell Commun. Signal. 5, 25–38. [DOI] [PMC free article] [PubMed] [Google Scholar]
- Moriguchi T.; Matsuura H.; Itakura Y.; Katsuki H.; Saito H.; Nishiyama N. (1997) Allixin, a phytoalexin produced by garlic, and its analogues as novel exogenous substances with neurotrophic activity. Life Sci. 61, 1413–1420. [DOI] [PubMed] [Google Scholar]
- Zegarra-Moran O.; Romio L.; Folli C.; Caci E.; Becq F.; Vierfond J.-M.; Mettey Y.; Cabrini G.; Fanen P.; Galietta L. J. V. (2002) Correction of G551D-CFTR transport defect in epithelial monolayers by genistein but not by CPX or MPB-07. Br. J. Pharmacol. 137, 504–512. [DOI] [PMC free article] [PubMed] [Google Scholar]
- McGovern S. L.; Caselli E.; Grigorieff N.; Shoichet B. K. (2002) A common mechanism underlying promiscuous inhibitors from virtual and high-throughput screening. J. Med. Chem. 45, 1712–22. [DOI] [PubMed] [Google Scholar]
- Coan K. E. D.; Shoichet B. K. (2008) Stoichiometry and physical chemistry of promiscuous aggregate-based inhibitors. J. Am. Chem. Soc. 130, 9606–9612. [DOI] [PMC free article] [PubMed] [Google Scholar]
- Coan K. E.; Maltby D. A.; Burlingame A. L.; Shoichet B. K. (2009) Promiscuous aggregate-based inhibitors promote enzyme unfolding. J. Med. Chem. 52, 2067–75. [DOI] [PMC free article] [PubMed] [Google Scholar]
- Pohjala L.; Tammela P. (2012) Aggregating behavior of phenolic compounds - A source of false bioassay results?. Molecules 17, 10774–10790. [DOI] [PMC free article] [PubMed] [Google Scholar]
- Anderson D. E.; Kim M. B.; Moore J. T.; O’Brien T. E.; Sorto N. A.; Grove C. I.; Lackner L. L.; Ames J. B.; Shaw J. T. (2012) Comparison of small molecule inhibitors of the bacterial cell division protein FtsZ and identification of a reliable cross-species inhibitor. ACS Chem. Biol. 7, 1918–1928. [DOI] [PMC free article] [PubMed] [Google Scholar]
- Barrett P. J.; Sanders C. R.; Kaufman S. A.; Michelsen K.; Jordan J. B. (2011) NSAID-based gamma-secretase modulators do not bind to the amyloid-beta polypeptide. Biochemistry 50, 10328–10342. [DOI] [PMC free article] [PubMed] [Google Scholar]
- Giannetti A. M.; Koch B. D.; Browner M. F. (2008) Surface plasmon resonance based assay for the detection and characterization of promiscuous inhibitors. J. Med. Chem. 51, 574–80. [DOI] [PubMed] [Google Scholar]
- Thorne N.; Inglese J.; Auld D. S. (2010) Illuminating insights into firefly luciferase and other bioluminescent reporters used in chemical biology. Chem. Biol. 17, 646–657. [DOI] [PMC free article] [PubMed] [Google Scholar]
- Cheng K. C.; Inglese J. (2012) A coincidence reporter-gene system for high-throughput screening. Nat. Methods 9, 937. [DOI] [PMC free article] [PubMed] [Google Scholar]
- Feng B. Y.; Toyama B. H.; Wille H.; Colby D. W.; Collins S. R.; May B. C. H.; Prusiner S. B.; Weissman J.; Shoichet B. K. (2008) Small-molecule aggregates inhibit amyloid polymerization. Nat. Chem. Biol. 4, 197–199. [DOI] [PMC free article] [PubMed] [Google Scholar]
- Frenkel Y. V.; Clark A. D.; Das K.; Wang Y.-H.; Lewi P. J.; Janssen P. A. J.; Arnold E. (2005) Concentration and pH dependent aggregation of hydrophobic drug molecules and relevance to oral bioavailability. J. Med. Chem. 48, 1974–1983. [DOI] [PubMed] [Google Scholar]
- Doak A. K.; Wille H.; Prusiner S. B.; Shoichet B. K. (2010) Colloid formation by drugs in simulated intestinal fluid. J. Med. Chem. 53, 4259–4265. [DOI] [PMC free article] [PubMed] [Google Scholar]
- Owen S. C.; Doak A. K.; Wassam P.; Shoichet M. S.; Shoichet B. K. (2012) Colloidal aggregation affects the efficacy of anticancer drugs in cell culture. ACS Chem. Biol. 7, 1429–1435. [DOI] [PMC free article] [PubMed] [Google Scholar]
- LaPlante S. R.; Aubry N.; Bolger G.; Bonneau P.; Carson R.; Coulombe R.; Sturino C.; Beaulieu P. L. (2013) Monitoring drug self-aggregation and potential for promiscuity in off-target in vitro pharmacology screens by a practical NMR strategy. J. Med. Chem. 56, 7073–7083. [DOI] [PubMed] [Google Scholar]
- Subik K.; Lee J.-F.; Baxter L.; Strzepek T.; Costello D.; Crowley P.; Xing L.; Hung M.-C.; Bonfiglio T.; Hicks D. G.; Tang P. (2010) The expression patterns of ER, PR, HER2, CK5/6, EGFR, Ki-67 and AR by immunohistochemical analysis in breast cancer cell lines. Breast Cancer: Basic Clin. Res. 4, 35–41. [PMC free article] [PubMed] [Google Scholar]
- McGovern S. L.; Helfand B. T.; Feng B.; Shoichet B. K. (2003) A specific mechanism of nonspecific inhibition. J. Med. Chem. 46, 4265–4272. [DOI] [PubMed] [Google Scholar]
- Bejugam N. K.; Sou M.; Uddin A. N.; Gayakwad S. G.; D′Souza M. J. (2008) Effect of chitosans and other excipients on the permeation of ketotifen, FITC-dextran, and rhodamine 123 through Caco-2 cells. J. Bioact. Compat. Polym. 23, 187–202. [Google Scholar]
- Ilevbare G. A.; Taylor L. S. (2013) Liquid–liquid phase separation in highly supersaturated aqueous solutions of poorly water-soluble drugs: Implications for solubility enhancing formulations. Cryst. Growth Des. 13, 1497–1509. [Google Scholar]
- Sassano M. F.; Doak A. K.; Roth B. L.; Shoichet B. K. (2013) Colloidal aggregation causes inhibition of G protein-coupled receptors. J. Med. Chem. 56, 2406–2414. [DOI] [PMC free article] [PubMed] [Google Scholar]
- Brooks J. D.; Thompson L. U. (2005) Mammalian lignans and genistein decrease the activities of aromatase and 17β-hydroxysteroid dehydrogenase in MCF-7 cells. J. Steroid Biochem. Mol. Biol. 94, 461–467. [DOI] [PubMed] [Google Scholar]
- Shim H.-Y.; Park J.-H.; Paik H.-D.; Nah S.-Y.; Kim D. S. H. L.; Han Y. S. (2007) Genistein-induced apoptosis of human breast cancer MCF-7 cells involves calpain-caspase and apoptosis signaling kinase 1-p38 mitogen-activated protein kinase activation cascades. Anti-Cancer Drugs 18, 649–657. [DOI] [PubMed] [Google Scholar]
- Almstrup K.; Fernandez M. F.; Petersen J. H.; Olea N.; Skakkebaek N. E.; Leffers H. (2002) Dual effects of phytoestrogens result in U-shaped dose-response curves. Environ. Health Perspect. 110, 743–748. [DOI] [PMC free article] [PubMed] [Google Scholar]
- Corkill J. M.; Goodman J. F.; Harrold S. P. (1964) Thermodynamics of micellization of non-ionic detergents. Trans. Faraday Soc. 60, 202–&. [Google Scholar]
- Cooper G. M., and Hausman R. E. (2013) The Cell: A Molecular Approach, Sinauer Associates, Incorporated, Sunderland, MA. [Google Scholar]
- Strober W. (2001) Trypan blue exclusion test of cell viability, in Current Protocols in Immunology, John Wiley & Sons, Inc., New York, NY. [DOI] [PubMed] [Google Scholar]
- Coyne C. P. (2008) Comparative Diagnostic Pharmacology: Clinical and Research Applications in Living-System Models, John Wiley & Sons, Inc, New York, NY. [Google Scholar]
- Corkill J. M.; Goodman J. F.; Walker T.; Wyer J. (1969) The multiple equilibrium model of micelle formation. Proc. R. Soc. London, Ser. A 312, 243–255. [Google Scholar]
- Tanford C. (1973) The Hydrophobic Effect: Formation of Micelles and Biological Membranes, John Wiley & Sons, New York, NY. [Google Scholar]
- Gennis R. B.; Jonas A. (1977) Protein-lipid interactions. Annu. Rev. Biophys. Bioeng. 6, 195–238. [DOI] [PubMed] [Google Scholar]
- Owen S. C.; Chan D. P. Y.; Shoichet M. S. (2012) Polymeric micelle stability. Nano Today 7, 53–65. [Google Scholar]
- Halperin A.; Alexander S. (1989) Polymeric micelles - their relaxation kinetics. Macromolecules 22, 2403–2412. [Google Scholar]
- Israelachvili J. N.; Marcelja S.; Horn R. G. (1980) Physical principles of membrane organization. Q. Rev. Biophys. 13, 121–200. [DOI] [PubMed] [Google Scholar]
- Raicu V., and Popescu A. (2008) Integrated Molecular and Cellular Biophysics, Springer, Dordrecht. [Google Scholar]
- Batrakova E.; Han H.-Y.; Alakhov V.; Miller D.; Kabanov A. (1998) Effects of pluronic block copolymers on drug absorption in Caco-2 cell monolayers. Pharm. Res. 15, 850–855. [DOI] [PubMed] [Google Scholar]
- Dimitrijevic D.; Lamandin C.; Uchegbu I. F.; Shaw A. J.; Florence A. T. (1997) The effect of monomers and of micellar and vesicular forms of non-ionic surfactants (Solulan C24 and Solulan 16) on Caco-2 cell monolayers. J. Pharm. Pharmacol. 49, 611–616. [DOI] [PubMed] [Google Scholar]
- Liu Y.-C.; Lo Y.-C.; Huang C.-W.; Wu S.-N. (2003) Inhibitory action of ICI-182,780, an estrogen receptor antagonist, on BKCa channel activity in cultured endothelial cells of human coronary artery. Biochem. Pharmacol. 66, 2053–2063. [DOI] [PubMed] [Google Scholar]
- Zegarra-Moran O.; Romio L.; Folli C.; Caci E.; Becq F.; Vierfond J. M.; Mettey Y.; Cabrini G.; FAnen P.; Galietta L. J. V. (2002) Correction of G551D-CFTR transport defect in epithelial monolayers by genistein but not by CPX or MPB-07. Br. J. Pharmacol. 137, 504–512. [DOI] [PMC free article] [PubMed] [Google Scholar]
- Knudsen L. B.; Kiel D.; Teng M.; Behrens C.; Bhumralkar D.; Kodra J. T.; Holst J. J.; Jeppesen C. B.; Johnson M. D.; de Jong J. C.; Jorgensen A. S.; Kercher T.; Kostrowicki J.; Madsen P.; Olesen P. H.; Petersen J. S.; Poulsen F.; Sidelmann U. G.; Sturis J.; Truesdale L.; May J.; Lau J. (2007) Small-molecule agonists for the glucagon-like peptide 1 receptor. Proc. Natl. Acad. Sci. U.S.A. 104, 937–942. [DOI] [PMC free article] [PubMed] [Google Scholar]
- Liu X.; Chen B.; Chen L.; Ren W.-T.; Liu J.; Wang G.; Fan W.; Wang X.; Wang Y. (2013) U-shape suppressive effect of phenol red on the epileptiform burst activity via activation of estrogen receptors in primary hippocampal culture. PLoS One 8, e60189. [DOI] [PMC free article] [PubMed] [Google Scholar]
- Lee T. H.; Kim K. H.; Lee S. O.; Lee K. R.; Son M.; Jin M. (2011) Tetrahydroberberine, an isoquinoline alkaloid isolated from corydalis tuber, enhances gastrointestinal motor gunction. J. Pharmacol. Exp. Ther. 338, 917–924. [DOI] [PubMed] [Google Scholar]
Associated Data
This section collects any data citations, data availability statements, or supplementary materials included in this article.


