

Abstract
Noncoding 7SK snRNA is believed to play an important role in the recruitment of P-TEFb by viral protein Tat to stimulate HIV processive transcription. Because HIV-2 TAR RNA and 7SK both evolved to feature a dinucleotide bulge region, compared to the trinucleotide bulge for HIV-1 TAR, ultrafast time-resolved fluorescence spectroscopy has been used to probe the conformational landscape of HIV-2 TAR and 7SK-SL4 RNA to monitor the conformational changes upon Tat binding. Our studies demonstrate that both HIV-1/2 TAR and 7SK-SL4 sample heterogeneous ensembles in the free state and undergo distinct conformational transitions upon Tat binding. These findings provide exquisite knowledge on the conformational complexity and intricate mechanism of molecular recognition and pave the way for drug design and discovery that incorporate dynamics information.
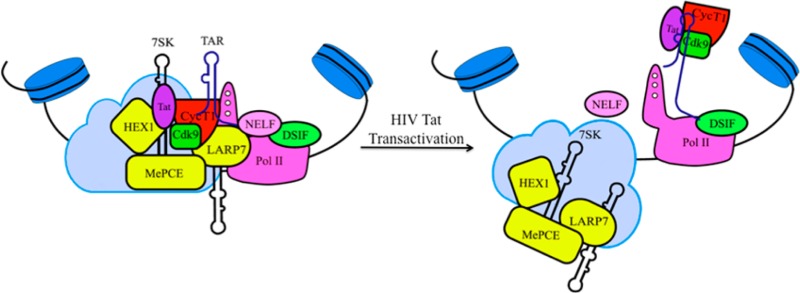
The recruitment of host positive transcription elongation factor b (P-TEFb) kinase is a required step for transcription elongation of HIV.1,2 The catalytic activity of P-TEFb (a heterodimer of CycT1 and Cdk9) in cells is dynamically controlled by inhibitory 7SK small nuclear ribonucleoprotein (snRNP), composed of Hexim1 protein and noncoding 7SK snRNA.3−7 Recent works illustrated that HIV Tat protein releases P-TEFb from the 7SK snRNP through competitive binding with the emerging TAR element, and this release directs P-TEFb toward Pol II,8,9 resulting in the transition from Pol II pausing to elongation (Figure 1).
Figure 1.
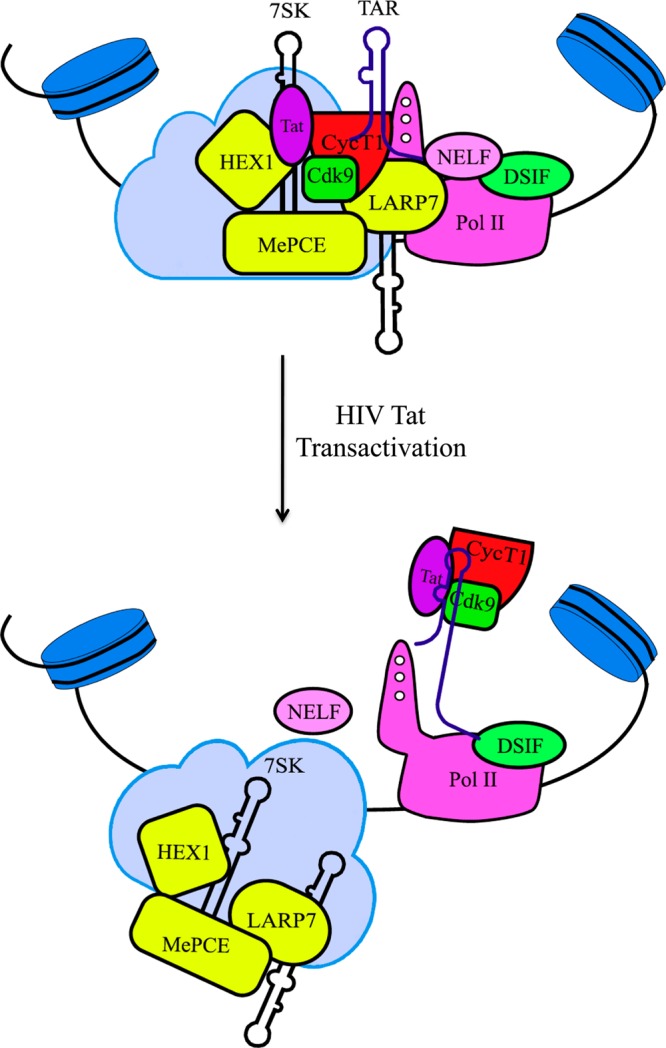
HIV transactivation model. A transcriptionally active Tat/P-TEFb/TAR complex was formed after TAR competitively dislodged 7SK from the Tat/P-TEFb complex, resulting in the transition from Pol II pausing to elongation.
The conserved stem loop 4 of 7SK (7SK-SL4) contains a substantial sequence homology to the HIV TAR RNA10 (Figure 2); therefore, Tat, which is similar to Hexim1 in possessing an arginine-rich motif, could directly bind 7SK snRNA to displace Hexim1 in the complex.11 The molecular mimicry between viral Tat-TAR and host Hexim1–7SK snRNA complex suggested a competition whereby Tat–TAR takes the place of 7SK snRNP and activates P-TEFb to promote HIV elongation.7,12 The TAR–Tat interaction is a classic paradigm of RNA–protein interactions.13−16 However, the structural recognition of 7SK snRNA upon Tat binding and subsequent competition by TAR RNA still need further in-depth investigation.
Figure 2.
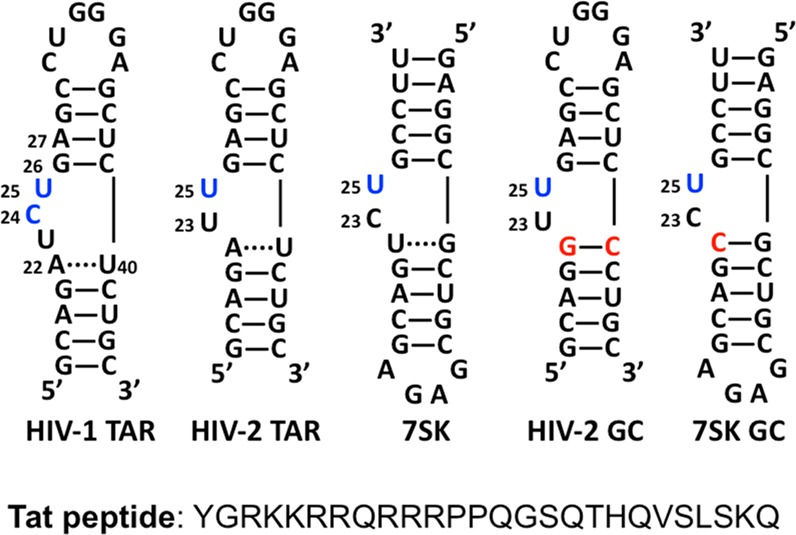
Secondary structure of models of HIV-1/2 TAR and 7SK RNAs (wild type and GC mutants) and sequence of Tat peptide. All numbering is based on that of HIV-1 TAR. Bases in blue are labeled by 2-aminopurine. Mutated positions are labeled in red.
Ultrafast dynamics-based approaches have been recently developed to dissect the dynamic behavior of different biological systems, particularly RNA systems.17−26 We have demonstrated that in HIV-1 TAR RNA, the ligand-free state samples multiple families of conformations with different base-stacking patterns around the functionally critical bulge region.17 Binding of Tat stabilizes a conformation that features the coaxial stacking, shifting equilibrium toward this state, but other states still exist. The conformational transition mechanism of Tat binding manifests itself as conformational capture.17,27−34 In this study, we have elucidated the role of conformational dynamics and resulting structural heterogeneity in HIV-1/2 TAR and 7SK snRNA recognition to capture the changes upon interaction with Tat. As opposed to the trinucleotide bulge in HIV-1 TAR (Figure 2), HIV-2 and 7SK snRNA feature a dinucleotide bulge. Our data demonstrate distinct novel mechanisms for Tat binding to these RNAs and lay the foundation for drug design to target similar structures based on distinct dynamic behaviors.
Experimental Procedures
Materials
All of the RNA constructs were purchased from Dharmacon (Lafayette, CO) and purified by PAGE. The wild-type constructs and the GC mutants are shown in Figure 2. RNA concentrations were calculated from UV absorbance measurements at 260 nm using extinction coefficients provided by Dharmacon. The oligos were dissolved in sodium phosphate buffer (20 mM sodium phosphate, 25 mM NaCl, and 0.1 mM EDTA, PH 6.8) for all experiments. The 26-mer basic region of Tat protein was obtained from the University of Texas Southwestern Medical Center Peptide Facility. The peptide was synthesized using Fmoc chemistry, the crude product was purified by HPLC and lyophilized to remove failure sequences and impurities such as TFA to avoid its potential effects on peptide properties,35 and the identity was confirmed by mass spectrometry. The concentration of the peptide was determined by absorbance at 280 nm using the tyrosine residue.
Steady-State Fluorescence Spectroscopy
RNA solutions of 200 nM were annealed in sodium phosphate buffer by heating at 95 °C for 1.5 min followed by flash cooling. Fluorescence measurements were performed using a Shimadzu RF 5301 spectrofluorophotometer. The sample cuvette was thermostatted at 25 °C using a circulating water bath. The excitation wavelength was 320 nm, and the emission wavelength was 370 nm. Titrations were carried out by adding 1–4 μL aliquots of Tat, from stock concentrations of 5, 20, 40, or 180 μM, with constant stirring. Between each injection of ligand, a 3 min period was allowed for the binding reaction to reach equilibrium. All measurements were performed in triplicate, and the fluorescence intensity of the buffer was subtracted from that of the samples. Fluorescence intensity at 370 nm was plotted versus ligand concentration and analyzed using the Dynafit program.36
Femtosecond Time-Resolved Fluorescence Spectroscopy
Briefly, femtosecond pulses (120 fs, 800 nm, 2.3 mJ) were generated from a Ti:sapphire laser system (Spectra Physics). Half of the pulse was used to pump one optical parametric amplifier (OPA), and the output signal was quadrupled to generate the excitation pump pulse at 320 nm. The remainder of the fundamental 800 nm was also used to pump another OPA as the probe pulse. The emission from the sample cell was collected by a pair of parabolic focus mirrors and mixed with the probe pulse in a BBO crystal (barium borate crystal). The upconverted signal at 257 nm (upconverted from 380 nm) was detected by a photomultiplier tube (PMT) after passing through a double-grating monochromator. RNA concentration of all femtosecond samples was 120 μM, which was optimal for the generation of a sufficient fluorescence signal. The RNA sample was annealed prior to each experiment by heating at 95 °C for 1.5 min followed by flash-cooling for 30 min to allow the RNA to fold into the native hairpin structure. Samples were measured at 22 °C in a quartz cell with a 5 mm path length. For magic-angle fluorescence measurements, the pump beam polarization was set at the magic angle (54.7°) with respect to fluorescence polarization set by the BBO crystal to avoid complications from orientational motions.
The femtosecond transients were collected up to 400 ps, and the fluorescence decay profiles were fit to a sum of multiple exponential functions convoluted by the following Gaussian instrument response function
where τi and Ai are the decay lifetimes and the pre-exponential amplitudes, respectively, for the ith decay component; t0 is time zero; Δ is the width of the instrument response function (cross correlation, typically 500–600 fs determined by recording the Raman emission profile for solvent water); and erf is the error function.
Mathematical software (Scientist) was used to analyze the ultrafast dynamics data. χ2 and F-test statistical tests were used to analyze and identify the number of transients needed to fit the sample population the best.17 The parameter for the slowest component was fixed at the average value (11.3 ns) of the observed lifetimes for free 2AP base, 9-methyl-2AP, and 2AP-riboside (ranging from 10.4 to 11.8 ns) for most of the transients37 because the time window of the femtosecond experiments (up to 400 ps) was too short to determine uniquely the slowest decay component. The specific choice of the fixed value for this component on the order of 10–11 ns did not affect the fitting of the faster components, but our testing indicated that the fitting may not converge if it is not fixed. Hundreds of transients were collected to give an average decay profile, and uncertainty in the fitted parameters was within ±5%.
Results and Discussion
HIV TAR and 7SK RNA Constructs
A series of RNA constructs10,17,38 was synthesized with 2-aminopurine (denoted as P) replacing nucleotides within the bulge (Figure 2). The 7SK model RNA was based on a minimal construct used in ref (10). The choice of the sequence allowed us to compare directly with the behavior of HIV-1 TAR reported earlier, with the focus on the bulge region. It has been shown that Tat binds WT HIV TAR RNAs with low nanomolar affinity39,40 and argininamide, a Tat peptide mimic, binds WT 7SK RNA with low micromolar affinity.10 Our steady-state fluorescence spectroscopy measurements showed that Tat peptide bound these 2AP-labeled constructs with high affinities in the low nanomolar range (Table 1) with similar titration patterns (Figure 3) as reported before;17 therefore, these constructs can be used as good probes for our study.
Table 1. Dissociation Constants of Tat Binding.
| Constructs | Kd1 (nM) | Kd2 (μM) |
|---|---|---|
| HIV-1 P24 | 60 ± 10 | ∼1 |
| HIV-1 P25 | 6 ± 2 | ∼0.1 |
| HIV-2 P25 | ∼1 | 0.2 ± 0.05 |
| 7SK P25 | 29 ± 10 | 1.1 ± 0.2 |
| HIV-1 P24-GC | 7 ± 3 | ∼1 |
| HIV-1 P25-GC | 2 ± 1 | 0.1 ± 0.01 |
| HIV-2 P25-GC | ∼1 | 0.08 ± 0.03 |
| 7SK P25-GC | 27 ± 5 | 1.3 ± 0.5 |
Figure 3.
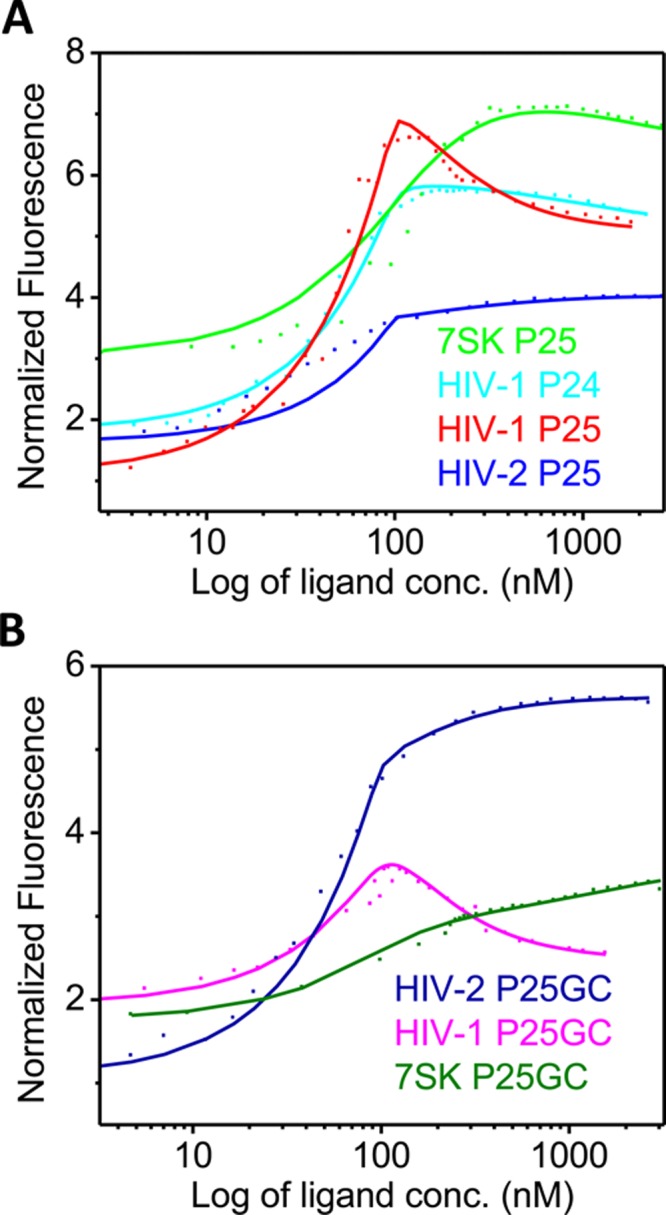
Steady-state fluorescence titrations of Tat binding to (A) HIV-1 P24, HIV-1 P25, HIV-2 P25, and 7SK RNAs and (B) GC mutants HIV-1 P25-GC, HIV-2 P25-GC, and 7SK P25-GC.
Conformational Heterogeneity of HIV TAR and 7SK RNAs in the Free State
We have collected ultrafast dynamics decays for the HIV-2 TAR and 7SK RNA constructs in the free state in comparison to those for HIV-1 TAR RNA (Figure 4).17 All of the decay profiles were multiphasic and fit to multiexponential decay functions (Table 2), and the number of parameters was determined by statistical analyses, including the χ2 and F tests.17,25
Figure 4.
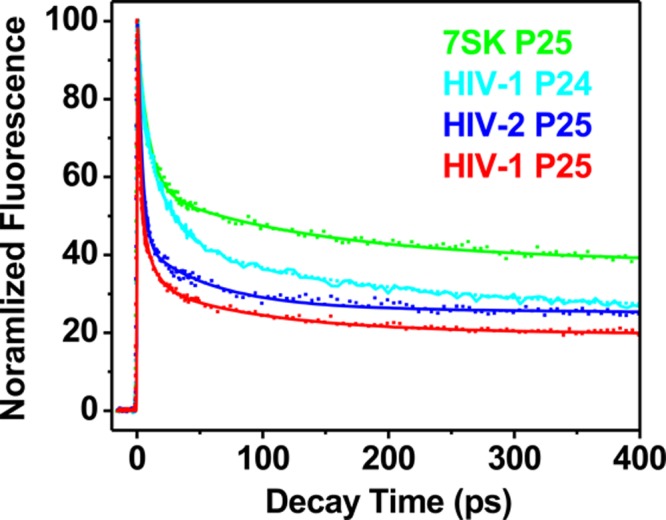
Ultrafast fluorescence time-resolved fluorescence decay profiles for HIV-1 P24, HIV-1 P25, HIV-2 P25, and 7SK P25 in the free state.
Table 2. Ultrafast Dynamics Decay Parameters.
| Constructs | τ1 (ps), A1 (%) | τ2 (ps), A2 (%) | τ3 (ns), A3 (%) |
|---|---|---|---|
| Free RNAs | |||
| HIV-2 P25 | 3.7, 61 | 58, 15 | 11.3, 24 |
| 7SK P25 | 8.8, 42 | 126, 18 | 11.3, 40 |
| HIV-2 P25-GC | 7.3, 56 | 74, 19 | 11.3, 25 |
| 7SK P25-GC | 6.5, 49 | 112, 22 | 11.3, 29 |
| Tat Complexes | |||
| HIV-2 P25 | 7.0, 15 | 4.7, 85 | |
| 7SK P25 | 9.3, 23 | 200, 21 | 11.3, 56 |
| HIV-2 P25-GC | 9.4, 15 | 145, 9 | 11.3, 76 |
| 7SK P25-GC | 7.5, 35 | 111, 24 | 11.3, 41 |
The multiphasic nature of the decay profiles indicated that theses RNAs, like their HIV-1 TAR counterpart,17 sample various heterogeneous conformations. The decay profile for HIV-2 P25 is similar to that for HIV-1 P25, with ultrafast decay component (3.7 ps, 61%) being dominant, indicating significant stacking interaction of base 25 with G26. The intermediate component (58 ps, 15%) represents dynamic motion of the base or stacking interaction with U24, whereas the slow component (11.3 ns, 24%) represents a conformation in which this base is completely bulged out of the loop.17 However, for 7SK P25, the fastest component (τ1 = 8.8 ps) is less populated (42%) compared to those for HIV-1/2 P25. Correspondingly, the totally unstacked population (11.3 ns, 40%) is larger than that of HIV-1/2 TAR. These findings suggest that like HIV-1 TAR the bulge-base 25 of HIV-2 TAR and 7SK also interconvert between stacked and unstacked states, featuring heterogeneous populations. However, the bulge bases in these RNAs have different equilibrium between these substates. The population distribution data can be used to calculate the free-energy differences between the substates and are in the range of ΔG°22 °C ∼0.03–0.82 kcal/mol, with the population of the highest occupancy (represented by τ1) representing the overall ground state for the ligand-free state.
Tat Induces Distinct Conformational Transition Pattern in TAR and 7SK RNAs
For HIV-1 TAR RNA, base 24 serves mostly as a linker during Tat complex formation, and base 25 has more critical functional roles in Tat recognition.17 Next, we probed the population distribution of base 25 in HIV-2 TAR and 7SK when bound by Tat peptide to elucidate further their potentially different roles in RNA recognition. Because looping-out of this bulge base is necessary for the formation of both HIV-1/2 Tat–TAR complexes,13−15,38 7SK snRNA may employ a similar strategy.10 Changes in the dynamic profiles of base P25 upon Tat binding would indicate such a conformational transition.
Figure 5A shows that binding of Tat to HIV-2 TAR induced the most significant changes in the decay profile, with the unstacked population in the Tat complex for HIV-2 P25 (85%) being higher than that for HIV-1 P25 (61%) but resembling that of the complex for HIV-1 P24 (79%), as reported in our previous study.17 For 7SK, the final profile for the Tat complex is similar to that of HIV-1 TAR P25 complex (Figure 5B). However, because of the higher unstacked population in the free state for 7SK RNA, the amplitude of change was much smaller than in the case of HIV-1/2 TAR. This evidence strongly indicates that the bulge region of 7SK RNA is more preorganized than in HIV-1/2 TAR. Previous NMR result showed that 7SK undergoes little conformational changes upon argininamide binding.10 Our results showed that the 7SK RNA in the free state exists in a roughly 1:1 equilibrium between two major conformations (Table 2), one of which resemble the bound state with base 25 looped out, in addition to a third minor population. This shows that the 7SK RNA already preorganizes a significant portion of its population for Tat binding, at least at the critical bulge region. Tat binding induced a shift in this equilibrium only slightly toward the bound state, resulting in about a 16% increase from the starting 40%. Other techniques viewed 7SK RNA as an average structure of these different populated states, and because Tat binding only induced a small population shift between the substates compared to HIV-1 or HIV-2 TAR RNAs, it appears that little overall conformational changes occurred in 7SK RNA upon Tat binding.10 Contrary to the lack of conformational changes upon ligand binding observed by previous NMR studies, our unique approach provides more intricate details of the RNA conformational transition patterns among the subpopulations as an ensemble, with quantitative information on the equilibrium distribution of the different substates and their unique structural features, allowing determination of the energetic profiles of the transition and the subtle and specific structural changes.
Figure 5.
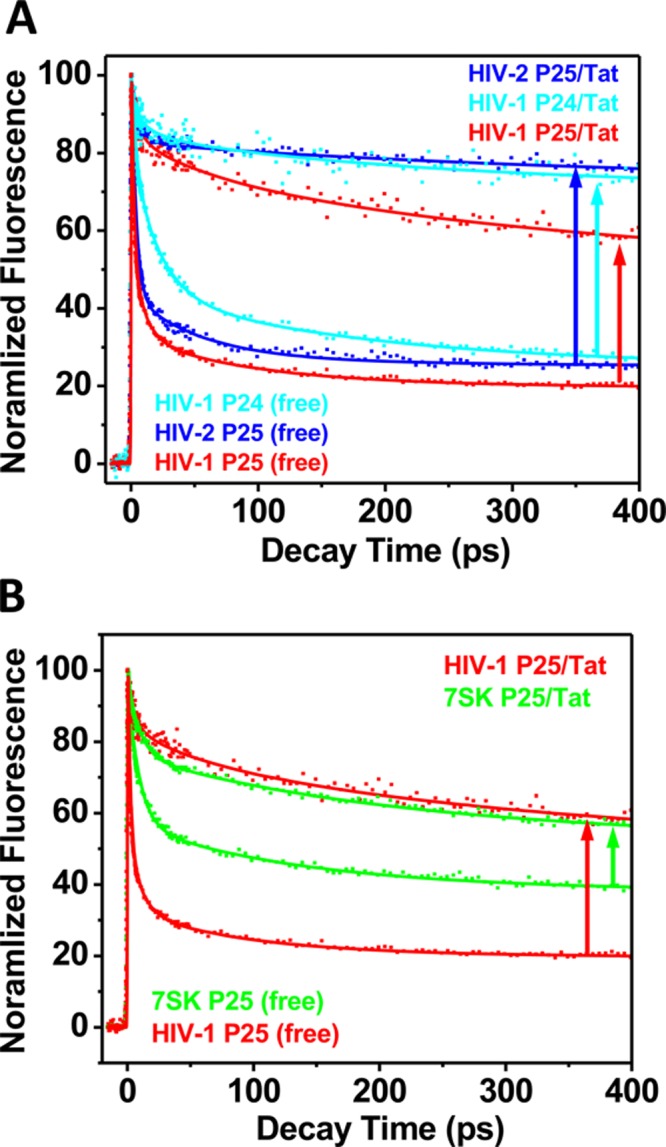
Comparison between changes in decay dynamics upon Tat binding between HIV-1 and HIV-2 TAR RNAs and 7SK RNA. Upward arrows indicate the direction and magnitude of changes in the dynamics decay profiles upon Tat binding to each RNA.
GC Mutation at the Bulge-Stem Junction Affects the Dynamics Differently
We and others have demonstrated that mutating the A22-U40 base pair in HIV-1 TAR to a GC pair at the bulge-stem junction can significantly shift the population toward the unstacked state.17,41 We further tested the potential effects of such a mutation (Figure 2) in HIV-2 TAR and 7SK RNAs. Interestingly, in HIV-2 P25-GC, the G22–C40 replacement did not affect the behavior of P25 as much in either the free state or upon Tat binding (Figure 6A). This suggests that bulge-base 25 in HIV-2 TAR functions more like a linker providing flexibility for the bulge region for conformational changes similar to the case of base 24 in HIV-1 TAR.17 The NMR structure of HIV-2 TAR in complex with argininamide38 is also consistent with such a conclusion. However, in the case of 7SK P25, the GC mutation (7SK P25-GC) somewhat increases the stacked population and decreases the unstacked population in both the free RNA and in the Tat complex, suggesting that base 25 plays more roles in structural recognition than being a linker (Figure 6B). The GC mutation at the bulge-stem junction makes the bulge region in 7SK RNA even more preorganized, similar to the effect observed for HIV-1 TAR at base 25.17,41
Figure 6.
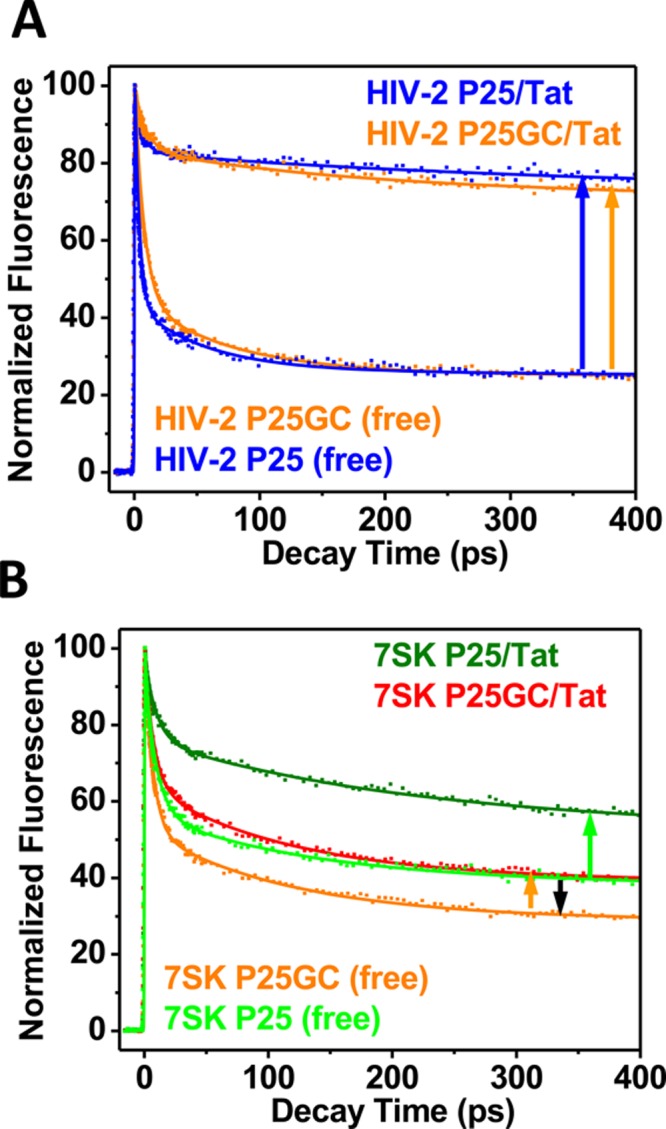
Effect of GC mutation on decay dynamics for (A) HIV-2 P25 RNA and (B) 7SK P25 RNA. Upward arrows indicate the direction and magnitude of changes in the dynamics decay profiles upon Tat binding to each GC mutant RNA; the downward arrow (black) indicates the effect of GC mutation on the 7SK RNA in the Tat-free state.
In summary, we sought to understand the different patterns of the dynamic conformational heterogeneity of the functionally important bulge regions of the 7SK and HIV TAR RNAs and the consequence of such heterogeneity on biological recognition. RNA-based therapeutics has been a challenging area, and recent efforts have led to some significant progress.42−45 To advance this field further, detailed knowledge on how RNA dynamics impact its recognition was investigated in this study. Although similar in base sequence and structural pattern, implying a common evolutional origin, the HIV-1/2 TAR RNA and the 7SK snRNA have very distinct dynamic behaviors in the free state, leading to very different patterns of Tat binding from a dynamic conformational ensemble point of view. Important lessons can be learned from these findings with regard to designing drug molecules to target similar structures based on distinct dynamic behaviors. The ensemble pictures of these RNAs suggest that some of the unique conformations can be selected for structure-specific targeting by novel drug molecules to achieve specificity. In particular, drugs do not have to be developed to target the abundant state or the Tat-bound state; rather, a specific conformation may contain more unique structural features than the dominant conformation in the free RNA state. If novel drugs could act to bind the minor alternative state specifically, then they can lock the RNA into an inactive state for Tat binding and interfere with the virus lifecycle. We envision that information on the plasticity and elasticity of RNA conformations will be extremely useful for RNA-based therapeutics in general.
Glossary
Abbreviations Used
- TAR
trans-activation response
- Tat
trans-activator of transcription
- P-TEFb
positive transcription elongation factor b
- PAGE
polyacrylamide gel electrophoresis
- 2AP
2-aminopurine
- fwhm
full width at half-maximum
- OPA
optical parametric amplifier
- fs
femtosecond
- ps
picosecond
- ns
nanosecond
Author Contributions
∥ These authors contributed equally to this work.
This work was supported by grants from the Robert A. Welch Foundation (AT-1645) to T.X., the Emerging Pathogens Institute to X.Q., and in part by the NIH/NCATS Clinical and Translational Science Award to the University of Florida (UL1 TR00064) to X.Q. V.W. is supported by UF HHMI Science for Life program.
The authors declare no competing financial interest.
Funding Statement
National Institutes of Health, United States
References
- Peterlin B. M.; Price D. H. (2006) Controlling the elongation phase of transcription with P-TEFb. Mol. Cell 23, 297–305. [DOI] [PubMed] [Google Scholar]
- Wei P.; Garber M. E.; Fang S. M.; Fischer W. H.; Jones K. A. (1998) A novel CDK9-associated C-type cyclin interacts directly with HIV-1 Tat and mediates its high-affinity, loop-specific binding to TAR RNA. Cell 92, 451–462. [DOI] [PubMed] [Google Scholar]
- Kim Y. K.; Bourgeois C. F.; Isel C.; Churcher M. J.; Karn J. (2002) Phosphorylation of the RNA polymerase II carboxyl-terminal domain by CDK9 is directly responsible for human immunodeficiency virus type 1 Tat-activated transcriptional elongation. Mol. Cell. Biol. 22, 4622–4637. [DOI] [PMC free article] [PubMed] [Google Scholar]
- Ahn S. H.; Kim M.; Buratowski S. (2004) Phosphorylation of serine 2 within the RNA polymerase II C-terminal domain couples transcription and 3′ end processing. Mol. Cell 13, 67–76. [DOI] [PubMed] [Google Scholar]
- Komarnitsky P.; Cho E. J.; Buratowski S. (2000) Different phosphorylated forms of RNA polymerase II and associated mRNA processing factors during transcription. Genes Dev. 14, 2452–2460. [DOI] [PMC free article] [PubMed] [Google Scholar]
- Yik J. H.; Chen R.; Nishimura R.; Jennings J. L.; Link A. J.; Zhou Q. (2003) Inhibition of P-TEFb (CDK9/Cyclin T) kinase and RNA polymerase II transcription by the coordinated actions of HEXIM1 and 7SK snRNA. Mol. Cell 12, 971–982. [DOI] [PubMed] [Google Scholar]
- Zhou Q.; Yik J. H. (2006) The Yin and Yang of P-TEFb regulation: Implications for human immunodeficiency virus gene expression and global control of cell growth and differentiation. Microbiol. Mol. Biol. Rev. 70, 646–659. [DOI] [PMC free article] [PubMed] [Google Scholar]
- D’Orso I.; Frankel A. D. (2010) RNA-mediated displacement of an inhibitory snRNP complex activates transcription elongation. Nat. Struct. Mol. Biol. 17, 815–821. [DOI] [PMC free article] [PubMed] [Google Scholar]
- Barboric M.; Lenasi T. (2010) Kick-sTARting HIV-1 transcription elongation by 7SK snRNP deporTATion. Nat. Struct. Mol. Biol. 17, 928–930. [DOI] [PubMed] [Google Scholar]
- Durney M. A.; D’Souza V. M. (2010) Preformed protein-binding motifs in 7SK snRNA: Structural and thermodynamic comparisons with retroviral TAR. J. Mol. Biol. 404, 555–567. [DOI] [PubMed] [Google Scholar]
- Sobhian B.; Laguette N.; Yatim A.; Nakamura M.; Levy Y.; Kiernan R.; Benkirane M. (2010) HIV-1 Tat assembles a multifunctional transcription elongation complex and stably associates with the 7SK snRNP. Mol. Cell 38, 439–451. [DOI] [PMC free article] [PubMed] [Google Scholar]
- Barboric M.; Yik J. H.; Czudnochowski N.; Yang Z.; Chen R.; Contreras X.; Geyer M.; Matija Peterlin B.; Zhou Q. (2007) Tat competes with HEXIM1 to increase the active pool of P-TEFb for HIV-1 transcription. Nucleic Acids Res. 35, 2003–2012. [DOI] [PMC free article] [PubMed] [Google Scholar]
- Puglisi J. D.; Tan R.; Calnan B. J.; Frankel A. D.; Williamson J. R. (1992) Conformation of the TAR RNA-arginine complex by NMR spectroscopy. Science 257, 76–80. [DOI] [PubMed] [Google Scholar]
- Aboul-ela F.; Karn J.; Varani G. (1995) The structure of the human immunodeficiency virus type-1 TAR RNA reveals principles of RNA recognition by Tat protein. J. Mol. Biol. 253, 313–332. [DOI] [PubMed] [Google Scholar]
- Puglisi J. D.; Chen L.; Frankel A. D.; Williamson J. R. (1993) Role of RNA structure in arginine recognition of TAR RNA. Proc. Natl. Acad. Sci. U.S.A. 90, 3680–3684. [DOI] [PMC free article] [PubMed] [Google Scholar]
- Zacharias M.; Hagerman P. J. (1995) The bend in RNA created by the transactivation response element bulge of human-immunodeficiency-virus is straightened by arginine and by Tat-derived peptide. Proc. Natl. Acad. Sci. U.S.A. 92, 6052–6056. [DOI] [PMC free article] [PubMed] [Google Scholar]
- Lu J.; Kadakkuzha B. M.; Zhao L.; Fan M.; Qi X.; Xia T. (2011) Dynamic ensemble view of the conformational landscape of HIV-1 TAR RNA and allosteric recognition. Biochemistry 50, 5042–5057. [DOI] [PubMed] [Google Scholar]
- Lu J.; Zhao L.; Xia A.; Xia T.; Qi X. (2013) Dissect conformational distribution and drug-induced population shift of prokaryotic rRNA A-site. Biochemistry 52, 1651–1653. [DOI] [PubMed] [Google Scholar]
- Nguyen H. N.; Zhao L.; Gray C. W.; Gray D. M.; Xia T. (2011) Ultrafast fluorescence decay profiles reveal differential unstacking of 2-aminopurine from neighboring bases in single-stranded DNA-binding protein subsites. Biochemistry 50, 8989–9001. [DOI] [PubMed] [Google Scholar]
- Lee S. W.; Zhao L.; Pardi A.; Xia T. B. (2010) Ultrafast dynamics show that the theophylline and 3-methylxanthine aptamers employ a conformational capture mechanism for binding their ligands. Biochemistry 49, 2943–2951. [DOI] [PMC free article] [PubMed] [Google Scholar]
- Jain N.; Zhao L.; Liu J. D.; Xia T. B. (2010) Heterogeneity and dynamics of the ligand recognition mode in purine-sensing riboswitches. Biochemistry 49, 3703–3714. [DOI] [PubMed] [Google Scholar]
- Kadakkuzha B. M.; Zhao L.; Xia T. (2009) Conformational distribution and ultrafast base dynamics of leadzyme. Biochemistry 48, 3807–3809. [DOI] [PubMed] [Google Scholar]
- Liu J. D.; Zhao L.; Xia T. (2008) The dynamic structural basis of differential enhancement of conformational stability by 5′- and 3′-dangling ends in RNA. Biochemistry 47, 5962–5975. [DOI] [PubMed] [Google Scholar]
- Zhao L.; Xia T. (2007) Direct revelation of multiple conformations in RNA by femtosecond dynamics. J. Am. Chem. Soc. 129, 4118–4119. [DOI] [PubMed] [Google Scholar]
- Zhao L.; Xia T. (2009) Probing RNA conformational dynamics and heterogeneity using femtosecond time-resolved fluorescence spectroscopy. Methods 49, 128–135. [DOI] [PubMed] [Google Scholar]
- Xia T. (2008) Taking femtosecond snapshots of RNA conformational dynamics and complexity. Curr. Opin. Chem. Biol. 12, 604–611. [DOI] [PubMed] [Google Scholar]
- Leulliot N.; Varani G. (2001) Current topics in RNA-protein recognition: control of specificity and biological function through induced fit and conformational capture. Biochemistry 40, 7947–7956. [DOI] [PubMed] [Google Scholar]
- Williamson J. R. (2000) Induced fit in RNA-protein recognition. Nat. Struct. Biol. 7, 834–837. [DOI] [PubMed] [Google Scholar]
- Al-Hashimi H. M.; Walter N. G. (2008) RNA dynamics: It is about time. Curr. Opin. Struct. Biol. 18, 321–329. [DOI] [PMC free article] [PubMed] [Google Scholar]
- Frank A. T.; Stelzer A. C.; Al-Hashimi H. M.; Andricioaei I. (2009) Constructing RNA dynamical ensembles by combining MD and motionally decoupled NMR RDCs: New insights into RNA dynamics and adaptive ligand recognition. Nucleic Acids Res. 37, 3670–3679. [DOI] [PMC free article] [PubMed] [Google Scholar]
- Al-Hashimi H. M.; Gosser Y.; Gorin A.; Hu W. D.; Majumdar A.; Patel D. J. (2002) Concerted motions in HIV-1 TAR RNA may allow access to bound state conformations: RNA dynamics from NMR residual dipolar couplings. J. Mol. Biol. 315, 95–102. [DOI] [PubMed] [Google Scholar]
- Zhang Q.; Stelzer A. C.; Fisher C. K.; Al-Hashimi H. M. (2007) Visualizing spatially correlated dynamics that directs RNA conformational transitions. Nature 450, 1263–1267. [DOI] [PubMed] [Google Scholar]
- Zhang Q.; Sun X. Y.; Watt E. D.; Al-Hashimi H. M. (2006) Resolving the motional modes that code for RNA adaptation. Science 311, 653–656. [DOI] [PubMed] [Google Scholar]
- Bailor M. H.; Sun X.; Al-Hashimi H. M. (2010) Topology links RNA secondary structure with global conformation, dynamics, and adaptation. Science 327, 202–206. [DOI] [PubMed] [Google Scholar]
- Andrushchenko V. V.; Vogel H. J.; Prenner E. J. (2007) Optimization of the hydrochloric acid concentration used for trifluoroacetate removal from synthetic peptides. J. Pept. Sci. 13, 37–43. [DOI] [PubMed] [Google Scholar]
- Kuzmic P. (1996) Program DYNAFIT for the analysis of enzyme kinetic data: Application to HIV proteinase. Anal. Biochem. 237, 260–273. [DOI] [PubMed] [Google Scholar]
- Holmen A.; Norden B.; Albinsson B. (1997) Electronic Transition moments of 2-aminopurine. J. Am. Chem. Soc. 119, 3114–3121. [Google Scholar]
- Brodsky A. S.; Williamson J. R. (1997) Solution structure of the HIV-2 TAR-argininamide complex. J. Mol. Biol. 267, 624–639. [DOI] [PubMed] [Google Scholar]
- Weeks K. M.; Ampe C.; Schultz S. C.; Steitz T. A.; Crothers D. M. (1990) Fragments of the HIV-1 Tat protein specifically bind TAR RNA. Science 249, 1281–1285. [DOI] [PubMed] [Google Scholar]
- Tao J. S.; Frankel A. D. (1992) Specific binding of arginine to TAR RNA. Proc. Natl. Acad. Sci. U.S.A. 89, 2723–2726. [DOI] [PMC free article] [PubMed] [Google Scholar]
- Stelzer A. C.; Kratz J. D.; Zhang Q.; Al-Hashimi H. M. (2010) RNA dynamics by design: Biasing ensembles towards the ligand-bound state. Angew. Chem., Int. Ed. 49, 5731–5733. [DOI] [PMC free article] [PubMed] [Google Scholar]
- Stelzer A. C.; Frank A. T.; Kratz J. D.; Swanson M. D.; Gonzalez-Hernandez M. J.; Lee J.; Andricioaei I.; Markovitz D. M.; Al-Hashimi H. M. (2011) Discovery of selective bioactive small molecules by targeting an RNA dynamic ensemble. Nat. Chem. Biol. 7, 553–559. [DOI] [PMC free article] [PubMed] [Google Scholar]
- Davidson A.; Begley D. W.; Lau C.; Varani G. (2011) A Small-molecule probe induces a conformation in HIV TAR RNA capable of binding drug-like fragments. J. Mol. Biol. 410, 984–996. [DOI] [PMC free article] [PubMed] [Google Scholar]
- Tran T.; Disney M. D. (2010) Two-dimensional combinatorial screening of a bacterial rRNA A-site-like motif library: Defining privileged asymmetric internal loops that bind aminoglycosides. Biochemistry 49, 1833–1842. [DOI] [PMC free article] [PubMed] [Google Scholar]
- Bardaro M. F.; Shajani Z.; Patora-Komisarska K.; Robinson J. A.; Varani G. (2009) How binding of small molecule and peptide ligands to HIV-1 TAR alters the RNA motional landscape. Nucleic Acids Res. 37, 1529–1540. [DOI] [PMC free article] [PubMed] [Google Scholar]