

Significance
A near one-to-one relationship had previously been observed between increments in the fluxes of the glutamate−glutamine neurotransmitter cycle and neuronal glucose oxidation in the tricarboxylic acid (TCA) cycle. This flux relationship was consistent with a hypothesized mechanism involving glycolytic ATP in astrocytes and astrocyte-to-neuron lactate shuttling. Here, 2-fluoro-2-deoxy-d-glucose was used to evaluate the glucose flux through glycolysis and the TCA cycle in nerve terminals isolated from the brains of rats under baseline and high-activity conditions. In a direct contradiction of this hypothesis, the results show that nerve terminals metabolize significant amounts of glucose.
Keywords: neuroenergetics, glutamate−glutamine cycle, neuronal glucose phosphorylation, synaptoneurosomes, 2-fluorodeoxyglucose
Abstract
Previous 13C magnetic resonance spectroscopy experiments have shown that over a wide range of neuronal activity, approximately one molecule of glucose is oxidized for every molecule of glutamate released by neurons and recycled through astrocytic glutamine. The measured kinetics were shown to agree with the stoichiometry of a hypothetical astrocyte-to-neuron lactate shuttle model, which predicted negligible functional neuronal uptake of glucose. To test this model, we measured the uptake and phosphorylation of glucose in nerve terminals isolated from rats infused with the glucose analog, 2-fluoro-2-deoxy-d-glucose (FDG) in vivo. The concentrations of phosphorylated FDG (FDG6P), normalized with respect to known neuronal metabolites, were compared in nerve terminals, homogenate, and cortex of anesthetized rats with and without bicuculline-induced seizures. The increase in FDG6P in nerve terminals agreed well with the increase in cortical neuronal glucose oxidation measured previously under the same conditions in vivo, indicating that direct uptake and oxidation of glucose in nerve terminals is substantial under resting and activated conditions. These results suggest that neuronal glucose-derived pyruvate is the major oxidative fuel for activated neurons, not lactate-derived from astrocytes, contradicting predictions of the original astrocyte-to-neuron lactate shuttle model under the range of study conditions.
Metabolic and neurophysiological research has experimentally related brain energy consumption, in the form of glucose oxidation, to the brain work supporting neuronal firing. Carbon-13 magnetic resonance spectroscopy (MRS) measurements (1, 2) of the associated fluxes in cerebral cortex of anesthetized rats over a range of electrical activity revealed, surprisingly, a near 1:1 relationship (in molar equivalent units) between increments in the glutamate−glutamine neurotransmitter cycle and neuronal glucose oxidation. Subsequent studies of rat and human cerebral cortex have been consistent with this finding (3, 4). The near 1:1 flux relation was consistent with a cellular/molecular model, originally proposed by Pellerin and Magistretti (5), and subsequently expanded to include the glutamate/glutamine cycle (1, 6). Evidence for the astrocyte-to-neuron lactate shuttle (ANLS) model is summarized in ref. 7. In this model (Fig. 1A), glutamate released from neurons is taken up by astrocytes and converted to glutamine using ATP derived from glycolysis. Lactate produced by this process is transferred to neurons where oxidation occurs. This ANLS model predicts a 1:1 relationship between increments in astrocytic glutamate uptake and glycolysis. Glycolytically derived ATP might provide for more rapid clearance of glutamate from the synaptic cleft into astrocyte processes devoid of mitochondria (8).
Fig. 1.

Schematic depiction of two neuroenergetics models under consideration to account for the 1:1 flux relationship between increments in Vcyc and VTCAn. (A) ANLS-type model (model 1) described by Sibson et al. (1). Above isoelectricity, lactate transfer from astrocytes to neurons (expressed as glucose equivalents) is determined by the rate of the glutamate−glutamine cycle, Vcyc. Neuronal glucose phosphorylation was assumed to be equivalent to the isoelectric rate for all activity levels, i.e., in A,  . Predicted rates of CMRglcn(P+Ox) for model 1 were calculated using Eq. 1, shown at the bottom of A. In the revised description of model 1 by Hyder et al. (3), glucose phosphorylation in neurons above isoelectricity can occur depending on the magnitude of astroglial oxidation and its dependence on neural activity. (B) Independent-type model (model 2) in which neurons and astrocytes take up and oxidize glucose according to their respective energy needs. Phosphorylated glucose not oxidized within the cell may be effluxed as lactate, VLac(efflux), which is shown by dashed lines, reflecting uncertainty of the lactate-releasing neural cells (13, 41). Predicted rates of
  for model 2 were calculated using Eq. 4, shown at the bottom of B.
  , rate of glucose oxidation in astrocytes
  ;
;  , rate of glucose oxidized in neurons at isoelectricity
  ;
;  , rate of total glucose phosphorylation in astrocytes, which includes oxidative and nonoxidative (net lactate efflux) catabolism;
  , rate of glucose phosphorylation in astrocytes with oxidation, includes lactate efflux to neurons at the rate Vcyc (model 1) or to extracellular fluid (model 2);
  , rate of total glucose phosphorylation in neurons, which includes oxidative and nonoxidative (lactate efflux) catabolism;
  , rate of glucose phosphorylation in neurons with oxidation; Gln, glutamine; Glu, glutamate; Lac, lactate; OAA, oxaloacetate; Pyr, pyruvate; αKG, α-ketoglutarate; VPC, pyruvate carboxylase rate in astrocytes; VPDHa, pyruvate dehydrogenase rate in astrocytes; VTCAa, TCA cycle flux in astrocytes; VTCAn, TCA cycle flux in neurons
  ;
;  , TCA cycle flux in neurons at isoelectricity.
The ANLS hypothesis has been challenged on biochemical, in vivo, in situ, and in vitro experimental and theoretical grounds (9–13), as well as the lack of direct in vivo evidence for oxidation of astroglia-derived lactate by neurons. The experimental data against the ANLS model are described in a recent review by Dienel (13). The present study tested predictions of the ANLS model in anesthetized rats (both at baseline and during seizure-induced activation) by direct measurement in brain nerve terminals of the uptake and phosphorylation of an i.v.-infused glucose analog, 2-fluoro-2-deoxy-d-glucose (FDG). To test the hypothesized model (1, 6) (Fig. 1A), we measured the rate of glucose phosphorylation in nerve terminals isolated from the brains of rats receiving a short-timed infusion of FDG mixed with 13C-labeled glucose. FDG is phosphorylated by hexokinase to fluoro-2-deoxy-glucose-6-phosphate (FDG6P), which is metabolized only to a limited extent; thus, FDG6P accumulates in neural cells at a rate proportional to glucose utilization (14). The FDG and 13C-glucose mixture (1:7) was infused for 8 min followed by a 52-min washout of FDG by infusing only 13C-glucose (Fig. 2A), after which the animals were euthanized and the nerve terminals were isolated. FDG6P was measured in extracts using 19F NMR and normalized to N-acetylaspartate (NAA) or glutamate plus γ-aminobutyrate (GABA), predominantly neuronal metabolites, measured in the same extracts using 1H-[13C] NMR. Measurements were made both of nerve terminals and of total brain tissue homogenate, the latter consisting of metabolites from all cells, including neurons and astrocytes. Comparisons were made of the normalized FDG6p formed in brain nerve terminals and homogenate during control conditions and a more stimulated state (seizure) induced by the GABAA receptor antagonist, bicuculline. The normalized FDG flux in nerve terminals was then compared with the cortical flux of glucose oxidation, measured in vivo in a previous study of anesthetized rats (15), as well as with the flux in whole brain homogenate, both of which included neuronal and glial contributions. The present results reveal high levels of neuronal phosphorylation of FDG, suggesting that over a significant activity range, neurons are capable of supporting a substantial fraction of their substrate requirements by direct uptake and phosphorylation of glucose.
Fig. 2.

Time courses of blood FDG and glucose concentrations during FDG/[1,6-13C2] glucose infusion (A) and 19F NMR spectra of nerve terminal (NT) (B) and homogenate (C) extracts for control and seizure conditions. FDG was infused for 8 min (solid bar) and [1,6-13C2] glucose for 60 min (open bar) followed by euthanasia and nerve terminal preparation (arrow). α,βFDG6P, 2-fluoro-2-deoxyglucose-6-phosphate; with resolved C1 α and β anomers.
Results
FDG Metabolism Reflects Premortem Glucose Phosphorylation.
FDG levels and enrichments in arterial plasma increased rapidly during the i.v. FDG/[1,6-13C2]glucose infusions in both saline-injected (control) and bicuculline-injected animals, reaching average values of ∼0.8–1.1 mM and ∼7%, respectively (Fig. 2 and Table S1). Cessation of the FDG infusion at 8 min led to declines in plasma FDG levels to <0.2 mM and <2 mol% by 60 min, when animals were euthanized and nerve terminals were isolated (Fig. S1 and Table S1). In pilot experiments conducted without a washout period (euthanasia and terminal isolation at 8 min), blood and brain FDG levels were much higher (Fig. S2) than with washout (Fig. 2 B and C). Thus, the washout significantly reduced the levels of FDG in blood and brain, ensuring that brain FDG6P accumulation mostly reflects premortem metabolism.
Glucose Phosphorylation Levels Are High in Nerve Terminals.
Fig. 2 B and C depicts 1H-decoupled 19F NMR spectra of nerve terminal and homogenate extracts prepared from control and seizing rats infused with FDG and [1,6-13C2]glucose. The α and β anomers of FDG6P prominently appear in the 19F NMR spectrum. To compare the levels of FDG6P for different nerve terminal preparations, FDG6P was expressed as a ratio with NAA, a neuronal marker, thus normalizing FDG6P to the neuronal fraction. We compared FDG6P/NAA for nerve terminals and the brain homogenate as a measure of glucose phosphorylation in “neurons” to total glucose phosphorylation in brain homogenate. Unexpectedly, FDG6P/NAA in nerve terminals (0.045 ± 0.007) was not significantly different from that in brain homogenate (0.046 ± 0.010) (Table 1). Because brain homogenate includes neurons and astrocytes, prima facie glucose phosphorylation appeared to be dominant in neurons. Similar results were obtained when FDG6P was referenced to the sum of the steady-state concentrations of glutamate-13C4 and GABA-13C2, produced by metabolism of the coinfused [1,6-13C2]glucose, or the sum of glutamate and GABA (Table S2), all predominately neuronal metabolites.
Table 1.
Ratio of FDG6P-to-NAA in nerve terminals and brain homogenate under control and seizure conditions
| FDG6P/NAA | |||
| Control (Con) | Seizure (Sez) | Ratio (Sez/Con) | |
| Nerve terminals | 0.045 (0.007) | 0.093 (0.015) | 2.08 (0.49) |
| Homogenate | 0.046 (0.010) | 0.086 (0.012) | 1.89 (0.51) |
Ratios reflect mean (± SD) of three separate preparations each.
Seizures Increase Nerve Terminal Glucose Phosphorylation.
FDG6P was substantially increased in nerve terminals of bicuculline-treated rats compared with saline-injected controls (Fig. 2B). In nerve terminals from seizing rats, FDG6P/NAA was 208% of control, comparable to that seen in brain homogenate (189% of control) (Table 1 and Fig. 2C). Similar increases were also seen when FDG6P was expressed relative to the sum of 13C-labeled glutamate and GABA (nerve terminals, 188% of control; homogenate, 260% of control) or the sum of their total levels (nerve terminals, 196% of control; homogenate, 220% of control) (Table S2). Thus, increased activity led to a large increase in terminal glucose phophorylation. We also compared the seizure-induced changes in FDG6P/NAA for a small piece of parietal/temporal cortex with cortical glucose consumption (CMRglc(ox)n and CMRglc(tot)) reported in a previous in vivo 13C NMR study (15) (Table S3). In the in vivo study, CMRglc(tot) was estimated as the sum of glucose oxidation and the initial rate of lactate accumulation during seizure onset. The seizure-related change in FDG6P/NAA (260% of control) was similar to the change in CMRglc(tot) during seizures (277%) but less than CMRglc(tot) at seizure onset (470%). The larger change in CMRglc(tot) during seizure onset than in FDG6P/NAA could be related to the contribution of glial glycogen breakdown to net lactate formation, which also is the likely source of lactate (and glutamate) isotopic dilution seen during early seizures (15).
Nerve Terminal Astroglial Contamination Is Low.
Several glial-associated markers were assessed to estimate glial contamination of nerve terminals (Fig. S3). Glutamine, a glial biosynthetic product, was not detected in extracts of nerve terminals, in contrast to cortex or whole brain homogenate where prominent signals of glutamine were observed (Fig. S4). Formation of 13C-labeled glutamine, which was seen in homogenates incubated in vitro with [2-13C]acetate (a glial substrate), or [1,6-13C2]glucose plus [U-13C5]glutamate (neuronal and glial substrates), was not detected during incubations with freshly isolated nerve terminals, although both led to substantial glutamate 13C labeling as expected for nerve terminals (Fig. S3 B and C). Because gliosomes would be expected to have an abundance of glutamate and glucose transporters, as well as glycolytic and tricarboxylic acid (TCA) cycle enzymes capable of metabolizing [U-13C5]glutamate to [U-13C5]glutamine and [1,6-13C2]glucose to [4-13C]glutamate/[4-13C]glutamine, respectively, we combined both 13C-labeled substrates to isotopically enrich multiple pathways leading to glial glutamine synthesis, reducing potential dilution inflows and increasing assay sensitivity to reveal glial metabolism. Glutamine synthetase activity measured in nerve terminals was 3.3% of total homogenate (Fig. S3A). Immunoblots against glial-expressed GFAP established an upper limit of contamination by glia or glial fragments of ∼9–17% of total protein (Fig. S3D). Together, the results strongly suggest a relatively low level of gliosome contamination of the nerve terminals.
Predictions of Two Neuroenergetics Models.
The support of the ANLS model (Fig. 1A, model 1) by the incremental 1:1 experimental relationship was based on the hypothesis that glycolytic ATP supports glutamate uptake and conversion to glutamine in astrocytes; one molecule of ATP would be expended by Na+/K+-ATPase to expel the three Na+ ions cotransported with each molecule of glutamate, and another to convert glutamate to glutamine by glutamine synthetase. If this process is performed in astrocytes using glycolytic ATP, it leads to a 1:1 relationship between the glutamate−glutamine cycle and astrocytic glucose uptake with subsequent oxidation in the neuron after lactate shuttling (1, 6). The faster synthesis of ATP by glycolysis over oxidative phosphorylation would promote faster clearance of glutamate from the extracellular space, which occurs within ∼10 ms (16), providing a mechanistic rationale in support of the ANLS model. Despite considerable scientific debate, direct experimental evidence for or against the ANLS model as the source of the 1:1 relationship between ΔVcyc and ΔCMRglc(ox)n is lacking. Direct evidence was sought in this study by comparing the amount of the glucose analog (FDG) accumulated by neurons and glia under different levels of brain activity with model predictions. For the model shown in Fig. 1A, equations were derived for the rates of glucose phosphorylation in neurons and astrocytes followed by complete oxidation (CMRglcn,a(P+Ox)) under the constraint that astroglial glutamate uptake and conversion to glutamine is coupled to astrocytic glucose uptake in a 1:1 relation.
where VTCAn is neuronal TCA cycle flux, VTCAn(iso) is neuronal TCA cycle flux under isoelectric (nonsignaling) conditions, VPDHa is astroglial pyruvate dehydrogenase flux, and VPC is astroglial pyruvate carboxylase flux (not present in the neurons). The factor of 0.5 refers to the two molecules of pyruvate/lactate formed per molecule of glucose metabolized by glycolysis, which enters the TCA cycle via pyruvate dehydrogenase (neurons and astrocytes) or pyruvate carboxylase (astrocytes). We note that glucose derived from glycogen hydrolysis in astrocytes bypasses hexokinase and is not included in CMRglcaP.
The predictions of an alternative to the ANLS-based model (Fig. 1B, model 2), in which neurons and astrocytes phosphorylate glucose independently according to their energy needs, were also tested by the present data; in this model, the 1:1 flux relationship between ΔVcyc and ΔCMRglc(ox)n (or equivalently, Δ0.5VTCAn) arises in neurons rather than astrocytes. This scenario would be consistent with evidence from studies of cultured astrocytes that plasma membrane ATPase uses ATP derived by glycolysis or oxidative phosphorylation equally well (17), and that ATP generated by both pathways support glutamate uptake (18).
Comparison with Results.
Table 2 presents the values predicted by the two models of CMRglcn(P+Ox) and total glucose oxidation (CMRglc(ox)n+a) under control and seizure conditions, along with their respective seizure-to-control (Sez/Con) ratios. These values were calculated from the equations in Predictions of Two Neuroenergetics Models using previously reported rates of neuronal and astroglial glucose oxidation and glutamate/glutamine cycling measured under similar conditions, as input. These predictions were compared with the measured FDG6P/NAA (from Table 1) for the isolated nerve terminals (assumed to represent the neuronal pool) relative to FDG6P/NAA for whole brain homogenate, the latter taken to represent whole brain glucose phosphorylation. Likewise, the relations describing the predicted relative change (Sez/Con) in FDG6P/NAA are:
 |
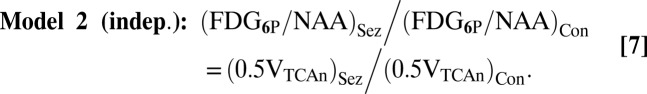 |
The predicted change in FDG6P/NAA for total brain homogenate was calculated as the sum of neuronal and astrocytic glucose oxidation (Table 2), (CMRglc(ox)n+a)Sez/(CMRglc(ox)n+a)Con. Fig. 3 compares measured and predicted ratios of the two models. This analysis, being the more direct test, compares incremental total and neuronal glucose phosphorylation between control and seizure conditions. As seen in Fig. 3, the experimentally determined ratio is substantially closer to model 2 (independent) than model 1 (ANLS), and similar to brain homogenate.
Table 2.
Predicted change in rates of neuronal glucose phosphorylation for two neuroenergetics models
| Control (Con) | Seizure (Sez) | Ratio (Sez/Con) | ||||
| CMRglcn(P+Ox) | CMRglc(ox)n+a | CMRglcn(P+Ox) | CMRglc(ox)n+a | CMRglcn(P+Ox) | CMRglc(ox)n+a | |
| Model 1 (ANLS) | 0.08 (0.02) | 0.44 (0.05) | 0.08 | 0.79 (0.14) | 1.0 | 1.8 (0.26) |
| Model 2 (Indep.) | 0.26 (0.05) | 0.44 (0.05) | 0.57 (0.14) | 0.79 (0.14) | 2.2 (0.67) | 1.8 (0.26) |
Values reflect mean (± SD).  is the rate of glucose phosphorylation in neurons followed by complete oxidation in the neuronal TCA cycle and calculated using values of
  and VTCAn according to Eqs. 1 and 4 describing the two energetics models (Fig.1).
  will be less than total glucose phosphorylation in neurons or astrocytes
  to the extent that net lactate is formed and effluxed, which is depicted in model 2 (Fig. 1B) by the dashed arrow. CMRglc(ox)n+a is the rate of total glucose oxidation occurring in neurons plus astrocytes (= CMRglc(ox)n + CMRglc(ox)a), where CMRglc(ox)n = 0.5VTCAn and CMRglc(ox)a = 0.5(VPC + VPDHa). Values used in the calculations:
  = 0.08(±0.02) µmol·g−1·min−1 (1, 15); CMRglc(ox)n = 0.26(±0.05) (control) and 0.57(±0.14) µmol·g−1·min−1 (seizure) (15); CMRglc(ox)a and
  were estimated from the respective slope and y intercept of the relation (CMRglc(ox)a = 0.11Vcyc + 0.16) obtained by a linear least-squares fit to a plot of CMRglc(ox)a vs. Vcyc using values of Vg, VPC, and VNT (=Vcyc) for low and moderate activity (34, 35), and of Vg (22), VPC (55), and Vcyc (15) for the seizure condition, where CMRglc(ox)a = Vg/2+VPC. Estimated values of CMRglc(ox)a were calculated from this equation giving 0.18 (±0.06) (control) and 0.22 (±0.12) µmol·g−1·min−1 (seizure) for Vcyc = 0.22 (±0.08) and 0.52 (±0.06) µmol·g−1·min−1 (15), respectively. CMRglc(ox)n+a = CMRglc(ox)n + CMRglc(ox)a = 0.26 + 0.18 = 0.44(±0.05) (control) and 0.57 + 0.22 = 0.79 (±0.14) µmol·g−1·min−1 (seizure). Expressions relating CMRglc(ox)a to VPDHa, Vg and VPC are found in SI Text, Effects of Astroglial Glucose Oxidation on Predicted Neuronal Glucose Uptake.
Fig. 3.

Comparison of seizure-to-control (Sez/Con) ratios for glucose phosphorylation in nerve terminals (NT) and brain homogenate (H) with predictions of the two neuroenergetics models. Values shown for NT and H reflect the Sez/Con ratios of FDG6P/NAA expressed as mean ± SD (n = 3,3). Predicted rates of neuronal glucose phosphorylation with oxidation,  , were calculated using Eqs. 1−3 (model 1) and Eqs. 4 and 5 (model 2) for control and seizure conditions and expressed as a ratio.
Discussion
Factors Influencing the FDG6P/NAA Ratio in Nerve Terminals.
NAA as a measure of neuronal cytosolic volume.
The conclusion that similar amounts of FDG were taken up (on a per cellular cytosol basis) in the nerve terminals and in total neuronal volume assumes that NAA, which is found exclusively in neurons, reflects quantitatively the neuronal cytosolic volume. The concentration of NAA is relatively homogenous (6–8 mM) across multiple rat brain regions (19). Because the rate of intracellular diffusion of NAA greatly exceeds its metabolic turnover, the intraneuronal distribution of NAA is anticipated to be relatively homogenous. For example, based on the apparent diffusion coefficient of NAA of 0.27 µm2/ms determined by MRS (20), mixing of NAA throughout neurons would occur in ∼60 min, whereas the metabolic turnover of NAA is slow [NAAC3 time constant, 13–14 h (21)].
Accuracy with which nerve terminals reflect total neuronal FDG uptake.
Surprisingly, the absolute FDG6P/NAA ratio for the nerve terminals was the same as that for total brain homogenate, which contains contributions of glucose uptake from astroglia and other neural cells not containing NAA. A ∼20–30% higher FDG6P/NAA would be anticipated for brain homogenate based on estimates of the rate of glial glucose oxidation (3, 22, 23). A possible explanation for this discrepancy is that FDG6P could be more concentrated in nerve terminals. Evidence for this was previously reported (24, 25) using 14C-2-deoxyglucose autoradiography. Based on considerations of energy budget modeling and mitochondrial density (26), and in vitro measurements (27), the highest neuronal rates of glucose uptake and oxidation may occur in postsynaptic dendrites, spines, and axon collaterals. Thus, differences in the distribution of FDG6P between presynaptic and postsynaptic neuronal elements may explain the equal FDG6P/NAA ratios found.
Effect of postmortem anaerobic glycolysis.
Another factor that could lead to an artifactually high amount of FDG6P in the nerve terminals would be extensive postmortem anaerobic glycolysis. To minimize this possibility, we designed the FDG infusion so that the maximum FDG uptake would occur during the premortem stage by incorporating a washout period of 52 min. At the end of the washout period, the mole fraction of FDG to glucose in blood was reduced to <2% (Table S1 and Fig. S1), which would insignificantly impact the FDG6P levels.
Effects of FDG on energetics, kinetics, and metabolism beyond FDG6P.
FDG competes with glucose for transport into the brain and, at high doses, can interfere with ATP formation by limiting glucose availability and sequestering inorganic phosphate (Pi) as FDG6P. The average FDG6P concentrations, 0.44 μmol·g−1 (control) and 1.1 μmol·g−1 (seizure) in cortex and 4.2 nmol·mg−1 protein (control) and 19.9 nmol·mg−1 protein (seizures) in the nerve terminals, were significantly less than those reported in two previous in vivo studies using bolus i.v. or intra-arterial injections (500 mg/kg) of 2-[6-13C]deoxyglucose (28) or 2-deoxyglucose (29). Deuel et al. (29) observed no significant effects of the FDG infusion on brain levels of ATP, phosphocreatine, or Pi, or in the intracerebral pH as measured by 31P MRS, despite using approximately a 10× higher dose of FDG than in the present study. The relatively low brain FDG6P concentration was also reflected in the absence of other fluorinated phosphorylated metabolites of FDG (27). However, low levels of fluorodeoxymannose-6-P (β, −59.15 ppm; α, −40.85) were detected in the homogenate extract, which may reflect postmortem metabolism. Thus, FDG and FDG6P levels would not be expected to significantly impact glucose metabolism.
A potential source of overestimation of nerve terminal glucose uptake in the seizure condition is that the lumped constant (LC), which corrects for different kinetic properties of FDG versus glucose, may rise steeply when brain glucose concentration falls to <1 μmol·g−1 (12). In awake rats during 1 h of bicuculline seizures (30), glucose levels remained above the critical value of ∼1 μmol·g−1, supporting our use of a single LC value. However, if the decline in glucose is more pronounced in the nerve terminals compared with whole tissue, FDG/glucose ratio would rise, leading to artifactually high rates of FDG phosphorylation relative to glucose. A study of glucose utilization using [2-14C]deoxyglucose (DG) during penicillin-induced seizures (31) found that brain glucose decreased by 20% (to 1.7 μmol·g−1), which corresponded to an increase in LC (and overestimate of CMRglc rate) of ∼10%. Because FDG is transported and phosphorylated faster than 2-DG (LC of 0.71 vs. 0.48) (32), the expected overestimate would be lower, ∼5–7%.
Effect of astroglial contamination in the nerve terminal fraction.
Another potential source of FDG6P could arise through contamination of nerve terminals by glial processes or gliosomes (33). The nerve terminals were judged to be relatively pure based on the absence of glutamine (a glial marker), their inability to synthesize 13C labeled glutamine from [U-13C5]glutamate and [1,6-13C2]glucose or [2-13C]acetate in vitro when supplied with these substrates, and relatively low enzymatic activity of glutamine synthetase and a glial marker protein (GFAP) (Fig. S3).
Impact of Activity-Dependent Astroglial Glucose Oxidation.
In model 1, the glia are approximated as transferring all of the lactate they produce through glycolysis-coupled glutamate uptake to the neuron. However, as discussed in ref. 3, because the astroglia can in principle oxidize the pyruvate resulting from this process, the net transfer of lactate to the neurons may be favored only when the rate of glutamate/glutamine cycling (Vcyc) exceeds the rate of astroglial glucose (pyruvate) oxidation. The magnitude of this effect was estimated by combining our previous data on neuronal glucose oxidation and glutamate cycling under similar conditions of halothane anesthesia and seizures (15) with the reported rates of astroglial glucose oxidation (22, 34, 35). Assuming a glial oxidative activity dependence similar to what has been reported in other conditions (22, 23, 36), and the model proposed in ref. 3, the predicted neuronal FDG uptake during seizures compared with control would rise by at most ∼38%, leading to a predicted seizure-to-control ratio of 1.4 rather than 1 (SI Text, Effects of Astroglial Glucose Oxidation on Predicted Neuronal Glucose Uptake), which still does not agree with the high neuronal uptake of FDG observed.
Potential Neuronal Basis of the 1:1 Ratio.
The finding of a large fraction of activity-dependent glucose uptake in neurons requires an alternative explanation of the 1:1 relationship. Two alternate mechanisms have been postulated, one involving the coupling of neuronal glycolysis (or glycolytic ATP) to vesicular loading of glutamate (37, 38) and another involving the coupling of neuronal glutamate formed from glutamine to redox movements into mitochondria via the malate aspartate shuttle (39, 40). Glutamate accumulation into synaptic vesicles is driven by a H+ electrochemical gradient produced by a vacuolar (H+)-ATPase, the energetic cost of which was estimated to be ∼0.33 ATP/glutamate (26). Assuming this ATP to be derived entirely from glycolysis would lead to a predicted flux ratio ΔVcyc:ΔCMRglcn(P+Ox) of ∼6:1, well above the observed value of 1:1. In the scheme of Hertz and coworkers (39, 40), the processing of glutamine to transmitter glutamate is indirect, involving mitochondrial formation of α-ketoglutarate from glutamine and with efflux to cytoplasm in exchange with malate. Because there is a fixed stoichiometric relationship between the formation of glycolytically produced NADH from glucose and the transfer of reducing equivalents into mitochondria via malate (1 glucose: 2 NADH: 2 malate), the formation of transmitter glutamate from glutamine will correlate with the exchange-mediated flow of glycolytically produced reducing equivalents from cytoplasm to mitochondria. Because one molecule of glucose provides 2 molecules of NADH in cell cytoplasm by glycolysis, the expected incremental glutamine/glucose flux ratio (ΔVcyc:ΔCMRglcn) would be 2:1 in the compartment of glutamate transmitter synthesis, i.e., the nerve terminal. This value, however, is twice the value of 1:1 determined in vivo. Noting that the measured value of neuronal TCA cycle flux (denominator in the ratio) includes all neuronal compartments, including those where glutamine metabolism and cycling may be limited, e.g., postsynaptic dendritic sites and/or cell bodies, might explain this discrepancy. Rates of glucose oxidation in glutamatergic postsynaptic/dendritic compartments might be expected to be strongly correlated with presynaptic glutamate release and cycling (Vcyc), consistent with recent experimental (41) and theoretical findings (27).
Reconciling the Experimental Evidence: Rest vs. Activation.
The finding of high resting neuronal FDG phosphorylation in adult rats is consistent with in vivo findings from high-resolution 2-DG autoradiography (42), reporting approximately equal amounts of glucose utilization by neurons and astrocytes. In addition, an in vivo study using the fluorescent glucose analog, 2-deoxy-N-(7-nitrobenz-2-oxa-1,3-diazol-4-yl)-aminoglucose (2-NBDG), which is phosphorylated by hexokinase to 2-NBDP6P (43), also found uptake/metabolism in both neurons (hippocampal pyramidal and cerebellar Purkinje cells) and astroglia of adult rats. The in vivo findings, however, are at odds with two recent in vitro studies using 2-NBDG in immature (P10 to P21) cerebellar (44) and hippocampal (45) brain slices, which found less uptake in neurons than in astrocytes, inferring support for the ANLS mechanism. However, the relevance for functional metabolism is problematic because rates of neuronal glucose oxidation and glutamate−glutamine cycling in P10 neocortex are ∼1/3 of the mature cortex (46), and in unstimulated slices, glutamate−glutamine cycling is not detected and oxygen consumption rate is very low (47). Because the quantitative use of 2-NBDG (unlike 2-DG and 2-FDG) and stability of 2-NBDG6P remains to be thoroughly validated (13), conclusions of cell type-specific glucose utilization (and inferences to unmeasured lactate movements) may be premature. Our results go further than previous studies in showing that with intense activation, glucose phosphorylation is increased in nerve terminals, suggesting that direct glucose uptake and oxidation is a major pathway to satisfy energy demands. As such, our findings do not support the proposal that neuronal glycolysis is inhibited under high-activity conditions (48) or that neurons in vivo lack the ability to increase glycolysis as seen in cultured cells (49). However, our results do not rule out an important role for an ANLS mechanism under certain conditions, e.g., that existing during the initial stages of intense neural activation when net glycogen breakdown occurs (50, 51)), such as for seizure onset (15). Also, our findings do not address whether neurons are a source (10, 52) or a sink (5, 53) of the extracellular lactate rise seen with neural activation (see ref. 13 for a review of the evidence on this topic).
Conclusions
The present findings, which indicate that neuronal glycolysis is capable of substantial support of its oxidative needs, are incompatible with an ANLS-type model previously proposed to explain the ∼1:1 relationship observed between ΔVcyc and ΔCMRglc(ox)n, suggesting this relation may arise in neurons. Furthermore, the results demonstrate up-regulation of neuronal glycolysis during neural activation and direct neuronal oxidation of glucose-derived pyruvate; but they do not support astrocytic lactate production strongly coupled with lactate shuttling to neurons to provide a major neuronal fuel. The synaptosome data are consistent with and extend (i.e., by doing the activation in vivo instead of in vitro) studies of synaptosomes from adult rodents, clearly demonstrating their high capacity for increasing glycolysis and oxidative metabolism.
Materials and Methods
Adult male Wister rats were prepared under halothane anesthesia (15) in accordance with protocols approved by the Yale Animal Care and Use Committee.
FDG and [1,6-13C2]glucose were infused for 8 min, followed by [1,6-13C2]glucose alone (washout) for 60 min.
Nerve terminals were prepared from rat forebrain using isotonic media and Ficoll density gradient centrifugation (54).
Tissue extracts were prepared using ethanol (15) for high-resolution 19F or 1H-[13C] NMR at 11.7T.
The values reported reflect mean ± SD. Statistical significance of differences was assessed by Student t test with level of P < 0.05. Further details appear in SI Text.
Supplementary Material
Acknowledgments
The authors thank Bei Wang for animal preparation and Shirley Wang for immunoblotting. This study was supported by National Institutes of Health Grants R01-DK27121 and R01-DK27121-28S.
Footnotes
The authors declare no conflict of interest.
This article contains supporting information online at www.pnas.org/lookup/suppl/doi:10.1073/pnas.1403576111/-/DCSupplemental.
References
- 1.Sibson NR, et al. Stoichiometric coupling of brain glucose metabolism and glutamatergic neuronal activity. Proc Natl Acad Sci USA. 1998;95(1):316–321. doi: 10.1073/pnas.95.1.316. [DOI] [PMC free article] [PubMed] [Google Scholar]
- 2.Shen J, et al. Determination of the rate of the glutamate/glutamine cycle in the human brain by in vivo 13C NMR. Proc Natl Acad Sci USA. 1999;96(14):8235–8240. doi: 10.1073/pnas.96.14.8235. [DOI] [PMC free article] [PubMed] [Google Scholar]
- 3.Hyder F, et al. Neuronal-glial glucose oxidation and glutamatergic-GABAergic function. J Cereb Blood Flow Metab. 2006;26(7):865–877. doi: 10.1038/sj.jcbfm.9600263. [DOI] [PubMed] [Google Scholar]
- 4.Rothman DL, De Feyter HM, de Graaf RA, Mason GF, Behar KL. 13C MRS studies of neuroenergetics and neurotransmitter cycling in humans. NMR Biomed. 2011;24(8):943–957. doi: 10.1002/nbm.1772. [DOI] [PMC free article] [PubMed] [Google Scholar]
- 5.Pellerin L, Magistretti PJ. Glutamate uptake into astrocytes stimulates aerobic glycolysis: A mechanism coupling neuronal activity to glucose utilization. Proc Natl Acad Sci USA. 1994;91(22):10625–10629. doi: 10.1073/pnas.91.22.10625. [DOI] [PMC free article] [PubMed] [Google Scholar]
- 6.Magistretti PJ, Pellerin L, Rothman DL, Shulman RG. Energy on demand. Science. 1999;283(5401):496–497. doi: 10.1126/science.283.5401.496. [DOI] [PubMed] [Google Scholar]
- 7.Pellerin L, Magistretti PJ. Sweet sixteen for ANLS. J Cereb Blood Flow Metab. 2012;32(7):1152–1166. doi: 10.1038/jcbfm.2011.149. [DOI] [PMC free article] [PubMed] [Google Scholar]
- 8.Shulman RG, Hyder F, Rothman DL. Cerebral energetics and the glycogen shunt: Neurochemical basis of functional imaging. Proc Natl Acad Sci USA. 2001;98(11):6417–6422. doi: 10.1073/pnas.101129298. [DOI] [PMC free article] [PubMed] [Google Scholar]
- 9.Gjedde A, Marrett S. Glycolysis in neurons, not astrocytes, delays oxidative metabolism of human visual cortex during sustained checkerboard stimulation in vivo. J Cereb Blood Flow Metab. 2001;21(12):1384–1392. doi: 10.1097/00004647-200112000-00002. [DOI] [PubMed] [Google Scholar]
- 10.Chih CP, Roberts EL., Jr Energy substrates for neurons during neural activity: A critical review of the astrocyte-neuron lactate shuttle hypothesis. J Cereb Blood Flow Metab. 2003;23(11):1263–1281. doi: 10.1097/01.WCB.0000081369.51727.6F. [DOI] [PubMed] [Google Scholar]
- 11.Hertz L. The astrocyte-neuron lactate shuttle: A challenge of a challenge. J Cereb Blood Flow Metab. 2004;24(11):1241–1248. doi: 10.1097/00004647-200411000-00008. [DOI] [PubMed] [Google Scholar]
- 12.Dienel GA. Fueling and imaging brain activation. ASN Neuro. 2012;4(5):e00093. doi: 10.1042/AN20120021. [DOI] [PMC free article] [PubMed] [Google Scholar]
- 13.Dienel GA. Brain lactate metabolism: The discoveries and the controversies. J Cereb Blood Flow Metab. 2012;32(7):1107–1138. doi: 10.1038/jcbfm.2011.175. [DOI] [PMC free article] [PubMed] [Google Scholar]
- 14.Sokoloff L, et al. The [14C]deoxyglucose method for the measurement of local cerebral glucose utilization: Theory, procedure, and normal values in the conscious and anesthetized albino rat. J Neurochem. 1977;28(5):897–916. doi: 10.1111/j.1471-4159.1977.tb10649.x. [DOI] [PubMed] [Google Scholar]
- 15.Patel AB, et al. Glutamatergic neurotransmission and neuronal glucose oxidation are coupled during intense neuronal activation. J Cereb Blood Flow Metab. 2004;24(9):972–985. doi: 10.1097/01.WCB.0000126234.16188.71. [DOI] [PubMed] [Google Scholar]
- 16.Bergles DE, Diamond JS, Jahr CE. Clearance of glutamate inside the synapse and beyond. Curr Opin Neurobiol. 1999;9(3):293–298. doi: 10.1016/s0959-4388(99)80043-9. [DOI] [PubMed] [Google Scholar]
- 17.Silver IA, Erecińska M. Energetic demands of the Na+/K+ ATPase in mammalian astrocytes. Glia. 1997;21(1):35–45. doi: 10.1002/(sici)1098-1136(199709)21:1<35::aid-glia4>3.0.co;2-0. [DOI] [PubMed] [Google Scholar]
- 18.Swanson RA, Benington JH. Astrocyte glucose metabolism under normal and pathological conditions in vitro. Dev Neurosci. 1996;18(5-6):515–521. doi: 10.1159/000111448. [DOI] [PubMed] [Google Scholar]
- 19.Wang J, et al. Regional metabolite levels and turnover in the awake rat brain under the influence of nicotine. J Neurochem. 2010;113(6):1447–1458. doi: 10.1111/j.1471-4159.2010.06684.x. [DOI] [PMC free article] [PubMed] [Google Scholar]
- 20.Pfeuffer J, Tkác I, Gruetter R. Extracellular-intracellular distribution of glucose and lactate in the rat brain assessed noninvasively by diffusion-weighted 1H nuclear magnetic resonance spectroscopy in vivo. J Cereb Blood Flow Metab. 2000;20(4):736–746. doi: 10.1097/00004647-200004000-00011. [DOI] [PubMed] [Google Scholar]
- 21.Choi IY, Gruetter R. Dynamic or inert metabolism? Turnover of N-acetyl aspartate and glutathione from D-[1-13C]glucose in the rat brain in vivo. J Neurochem. 2004;91(4):778–787. doi: 10.1111/j.1471-4159.2004.02716.x. [DOI] [PMC free article] [PubMed] [Google Scholar]
- 22.Oz G, et al. Neuroglial metabolism in the awake rat brain: CO2 fixation increases with brain activity. J Neurosci. 2004;24(50):11273–11279. doi: 10.1523/JNEUROSCI.3564-04.2004. [DOI] [PMC free article] [PubMed] [Google Scholar]
- 23.Hertz L, Peng L, Dienel GA. Energy metabolism in astrocytes: High rate of oxidative metabolism and spatiotemporal dependence on glycolysis/glycogenolysis. J Cereb Blood Flow Metab. 2007;27(2):219–249. doi: 10.1038/sj.jcbfm.9600343. [DOI] [PubMed] [Google Scholar]
- 24.Schwartz WJ, et al. Metabolic mapping of functional activity in the hypothalamo-neurohypophysial system of the rat. Science. 1979;205(4407):723–725. doi: 10.1126/science.462184. [DOI] [PubMed] [Google Scholar]
- 25.Mata M, et al. Activity-dependent energy metabolism in rat posterior pituitary primarily reflects sodium pump activity. J Neurochem. 1980;34(1):213–215. doi: 10.1111/j.1471-4159.1980.tb04643.x. [DOI] [PubMed] [Google Scholar]
- 26.Attwell D, Laughlin SB. An energy budget for signaling in the grey matter of the brain. J Cereb Blood Flow Metab. 2001;21(10):1133–1145. doi: 10.1097/00004647-200110000-00001. [DOI] [PubMed] [Google Scholar]
- 27.Hall CN, Klein-Flügge MC, Howarth C, Attwell D. Oxidative phosphorylation, not glycolysis, powers presynaptic and postsynaptic mechanisms underlying brain information processing. J Neurosci. 2012;32(26):8940–8951. doi: 10.1523/JNEUROSCI.0026-12.2012. [DOI] [PMC free article] [PubMed] [Google Scholar]
- 28.Cohen DM, et al. A method for measuring cerebral glucose metabolism in vivo by 13C-NMR spectroscopy. Magn Reson Med. 2002;48(6):1063–1067. doi: 10.1002/mrm.10284. [DOI] [PubMed] [Google Scholar]
- 29.Deuel RK, Yue GM, Sherman WR, Schickner DJ, Ackerman JJ. Monitoring the time course of cerebral deoxyglucose metabolism by 31P nuclear magnetic resonance spectroscopy. Science. 1985;228(4705):1329–1331. doi: 10.1126/science.4001946. [DOI] [PubMed] [Google Scholar]
- 30.Chapman AG, Meldrum BS, Siesjö BK. Cerebral metabolic changes during prolonged epileptic seizures in rats. J Neurochem. 1977;28(5):1025–1035. doi: 10.1111/j.1471-4159.1977.tb10665.x. [DOI] [PubMed] [Google Scholar]
- 31.Nakanishi H, Cruz NF, Adachi K, Sokoloff L, Dienel GA. Influence of glucose supply and demand on determination of brain glucose content with labeled methylglucose. J Cereb Blood Flow Metab. 1996;16(3):439–449. doi: 10.1097/00004647-199605000-00010. [DOI] [PubMed] [Google Scholar]
- 32.Tokugawa J, Ravasi L, Nakayama T, Schmidt KC, Sokoloff L. Operational lumped constant for FDG in normal adult male rats. J Nucl Med. 2007;48(1):94–99. [PubMed] [Google Scholar]
- 33.Henn FA, Anderson DJ, Rustad DG. Glial contamination of synaptosomal fractions. Brain Res. 1976;101(2):341–344. doi: 10.1016/0006-8993(76)90274-2. [DOI] [PubMed] [Google Scholar]
- 34.Choi IY, Lei H, Gruetter R. Effect of deep pentobarbital anesthesia on neurotransmitter metabolism in vivo: On the correlation of total glucose consumption with glutamatergic action. J Cereb Blood Flow Metab. 2002;22(11):1343–1351. doi: 10.1097/01.WCB.0000040945.89393.46. [DOI] [PubMed] [Google Scholar]
- 35.Duarte JM, Lanz B, Gruetter R. Compartmentalized cerebral metabolism of [1,6-13C]glucose determined by in vivo 13C NMR spectroscopy at 14.1 T. Front Neuroenergetics. 2011;3:3. doi: 10.3389/fnene.2011.00003. [DOI] [PMC free article] [PubMed] [Google Scholar]
- 36.Dienel GA, Schmidt KC, Cruz NF. Astrocyte activation in vivo during graded photic stimulation. J Neurochem. 2007;103(4):1506–1522. doi: 10.1111/j.1471-4159.2007.04859.x. [DOI] [PubMed] [Google Scholar]
- 37.Ikemoto A, Bole DG, Ueda T. Glycolysis and glutamate accumulation into synaptic vesicles. Role of glyceraldehyde phosphate dehydrogenase and 3-phosphoglycerate kinase. J Biol Chem. 2003;278(8):5929–5940. doi: 10.1074/jbc.M211617200. [DOI] [PubMed] [Google Scholar]
- 38.Ishida A, Noda Y, Ueda T. Synaptic vesicle-bound pyruvate kinase can support vesicular glutamate uptake. Neurochem Res. 2009;34(5):807–818. doi: 10.1007/s11064-008-9833-3. [DOI] [PMC free article] [PubMed] [Google Scholar]
- 39.Hertz L, Yu AC, Kala G, Schousboe A. Neuronal-astrocytic and cytosolic-mitochondrial metabolite trafficking during brain activation, hyperammonemia and energy deprivation. Neurochem Int. 2000;37(2-3):83–102. doi: 10.1016/s0197-0186(00)00012-7. [DOI] [PubMed] [Google Scholar]
- 40.Palaiologos G, Hertz L, Schousboe A. Evidence that aspartate aminotransferase activity and ketodicarboxylate carrier function are essential for biosynthesis of transmitter glutamate. J Neurochem. 1988;51(1):317–320. doi: 10.1111/j.1471-4159.1988.tb04872.x. [DOI] [PubMed] [Google Scholar]
- 41.Caesar K, et al. Glutamate receptor-dependent increments in lactate, glucose and oxygen metabolism evoked in rat cerebellum in vivo. J Physiol. 2008;586(5):1337–1349. doi: 10.1113/jphysiol.2007.144154. [DOI] [PMC free article] [PubMed] [Google Scholar]
- 42.Nehlig A, Wittendorp-Rechenmann E, Lam CD. Selective uptake of [14C]2-deoxyglucose by neurons and astrocytes: High-resolution microautoradiographic imaging by cellular 14C-trajectography combined with immunohistochemistry. J Cereb Blood Flow Metab. 2004;24(9):1004–1014. doi: 10.1097/01.WCB.0000128533.84196.D8. [DOI] [PubMed] [Google Scholar]
- 43.Itoh Y, Abe T, Takaoka R, Tanahashi N. Fluorometric determination of glucose utilization in neurons in vitro and in vivo. J Cereb Blood Flow Metab. 2004;24(9):993–1003. doi: 10.1097/01.WCB.0000127661.07591.DE. [DOI] [PubMed] [Google Scholar]
- 44.Barros LF, et al. Preferential transport and metabolism of glucose in Bergmann glia over Purkinje cells: A multiphoton study of cerebellar slices. Glia. 2009;57(9):962–970. doi: 10.1002/glia.20820. [DOI] [PubMed] [Google Scholar]
- 45.Jakoby P, et al. Higher transport and metabolism of glucose in astrocytes compared with neurons: A multiphoton study of hippocampal and cerebellar tissue slices. Cereb Cortex. 2014;24(1):222–231. doi: 10.1093/cercor/bhs309. [DOI] [PubMed] [Google Scholar]
- 46.Chowdhury GM, Patel AB, Mason GF, Rothman DL, Behar KL. Glutamatergic and GABAergic neurotransmitter cycling and energy metabolism in rat cerebral cortex during postnatal development. J Cereb Blood Flow Metab. 2007;27(12):1895–1907. doi: 10.1038/sj.jcbfm.9600490. [DOI] [PubMed] [Google Scholar]
- 47.Badar-Goffer RS, Ben-Yoseph O, Bachelard HS, Morris PG. Neuronal-glial metabolism under depolarizing conditions. A 13C-n.m.r. study. Biochem J. 1992;282(Pt 1):225–230. doi: 10.1042/bj2820225. [DOI] [PMC free article] [PubMed] [Google Scholar]
- 48.Occhipinti R, Somersalo E, Calvetti D. Astrocytes as the glucose shunt for glutamatergic neurons at high activity: An in silico study. J Neurophysiol. 2009;101(5):2528–2538. doi: 10.1152/jn.90377.2008. [DOI] [PMC free article] [PubMed] [Google Scholar]
- 49.Bolaños JP, Almeida A, Moncada S. Glycolysis: A bioenergetic or a survival pathway? Trends Biochem Sci. 2010;35(3):145–149. doi: 10.1016/j.tibs.2009.10.006. [DOI] [PubMed] [Google Scholar]
- 50.Shetty PK, Sadgrove MP, Galeffi F, Turner DA. Pyruvate incubation enhances glycogen stores and sustains neuronal function during subsequent glucose deprivation. Neurobiol Dis. 2012;45(1):177–187. doi: 10.1016/j.nbd.2011.08.002. [DOI] [PMC free article] [PubMed] [Google Scholar]
- 51.Dienel GA, Ball KK, Cruz NF. A glycogen phosphorylase inhibitor selectively enhances local rates of glucose utilization in brain during sensory stimulation of conscious rats: Implications for glycogen turnover. J Neurochem. 2007;102(2):466–478. doi: 10.1111/j.1471-4159.2007.04595.x. [DOI] [PMC free article] [PubMed] [Google Scholar]
- 52.Mangia S, Simpson IA, Vannucci SJ, Carruthers A. The in vivo neuron-to-astrocyte lactate shuttle in human brain: Evidence from modeling of measured lactate levels during visual stimulation. J Neurochem. 2009;109(Suppl 1):55–62. doi: 10.1111/j.1471-4159.2009.06003.x. [DOI] [PMC free article] [PubMed] [Google Scholar]
- 53.Bélanger M, Allaman I, Magistretti PJ. Brain energy metabolism: Focus on astrocyte-neuron metabolic cooperation. Cell Metab. 2011;14(6):724–738. doi: 10.1016/j.cmet.2011.08.016. [DOI] [PubMed] [Google Scholar]
- 54.Lai JCK, Clark JB. Isolation and Characterization of Synaptic and Nonsynaptic Mitochondria From Mammalian Brain. Clifton, NJ: Humana Press, Inc.; 1989. [Google Scholar]
- 55.Patel AB, et al. Cerebral pyruvate carboxylase flux is unaltered during bicuculline-seizures. J Neurosci Res. 2005;79(1-2):128–138. doi: 10.1002/jnr.20311. [DOI] [PubMed] [Google Scholar]
Associated Data
This section collects any data citations, data availability statements, or supplementary materials included in this article.