

Abstract
Empowered by technology and sampling efforts designed to facilitate genome-wide association mapping, human geneticists are now studying the geography of genetic variation with unprecedented detail. With high genomic coverage and geographic resolution, these studies are identifying loci with spatial signatures of selection, such as extreme levels of differentiation and correlations with environmental variables. Collectively, patterns at these loci are beginning to provide novel insights into the process of human adaptation. Here we review the challenges of these studies and emerging results, including how human population structure has influenced the response to novel selective pressures.
While this year marks the bicentennial and sesquicentennial of Darwin’s birth and the publication of the Origin of Species, a major intervening event and intellectual milestone for Darwin was his voyage on the HMS Beagle. Indeed, both Wallace and Darwin came to understand natural selection not by studying the flora and fauna of a single region, but by comparing patterns of variation across geographic regions.
The potential of geographic studies of genetic variation in humans has been recognized for some time, and progress in tapping this potential has benefited from sequential advances in technologies for surveying genetic variation. More than 40 years ago, the innovation of protein electrophoresis allowed researchers to survey allele frequency variation in worldwide population samples1, 2 at multiple loci. Some of the best understood examples of natural selection in humans were discovered in this era, such as the correlation between the geographic distribution of malaria and the sickle cell allele3 and the extreme geographic differentiation of the null allele of the Duffy blood group1. These early studies were limited to the loci that could be easily surveyed using classical assays, but these limitations are increasingly falling aside. High-throughput genotyping and sequencing are allowing population geneticists to survey variation on a genomic scale in large worldwide population samples.
The scale of modern data makes it possible to apply novel, powerful methods for detecting loci under selection using data from multiple populations. Theoretical population genetic models have provided some insights into possible signatures of natural selection (Box 1, Figures 1–3). For example, if an advantageous variant is due to a novel mutation (as opposed to standing variation), it will initially be present at a single geographic location, and will spread outwards from that point in what R.A. Fisher referred to as a “wave of advance” of the advantageous allele4. If selection intensities vary over space, correlations between environmental variables and allele frequencies can arise. The exact outcome in each case depends on various factors, such as how the selective advantage of an allele varies across space and the dispersal patterns in a population (Figure 1,2). Several methods have emerged to detect these spatial signatures of selection.
Box 1. Classical models of selection in structured populations.
Models of selection in structured populations have a long history in theoretical population genetics. Some of the classical questions addressed with these models include: At what speed does an advantageous allele spread geographically through a population? Under what conditions does gene flow homogenize populations sufficiently to prevent local adaptation? Is it plausible that observed genetic variation can be explained by spatially heterogeneous selection? In pursuing these questions, theoreticians developed a collection of mathematical models to describe selection in structured populations.
Dynamic spread of an allele
One of the earliest models was R.A. Fisher’s wave of advance model4. Fisher studied a model where one region of the habitat is fixed for an advantageous allele, and the allele is spreading into territory where it was formerly absent. Fisher described the moving gradient (i.e. “wave”) of allele frequency that can form (Fig 1A), and derived the minimum speed of the traveling wave. This minimum speed is of interest for theoretical arguments about the plausibility of geographically distributed populations evolving cohesively at adaptively evolving loci. More recent work has focused on studying the dynamics of the wave in models that include genetic drift 45, 47, 87
Variation at equilibrium — balancing selection due to spatially varying selection
While Fisher’s model focuses on the non-equilibrium dynamics of a spreading advantageous allele, others considered the problem of whether, at equilibrium, genetic variation could be maintained by spatially varying selection. This interest in stable polymorphisms was in part driven by a desire to explain situations in nature where genetic variation would be stable in a population through time, and hence would be more easily observed in empirical surveys. The Levene model 88 was one of the first to consider variation in selection coefficients across environments. Under its original form it did not include spatially restricted migration, so it presented a particularly challenging scenario for producing stable polymorphisms (88,89, 90 cf. 91). Models with both spatial variation in selective pressures and spatially restricted migration have a much broader range of parameter values favoring stable polymorphisms. A common feature of these models is the formation of gradients (or “clines”) in allele frequency over space. The best studied of this family of models considers an abrupt or continuous environmental transition between two habitats with differing selection regimes (Fig 2A, 2B) 34, 64, 92–100.
Figure 1. The “wave of advance” spread of a globally advantageous mutation.

Arrows indicate how the allele frequencies of a selected allele (red) are expected to change over time, depending on the pattern of selective advantage of the allele (indicated in green above each plot). Vertical arrows represent the magnitude of increase expected due to selection. Horizontal arrows represent how dispersal homogenizes allele frequencies across space. For every selected allele, a representative neutral allele (blue) of similar average frequency is shown for comparison. In each case the allele is supposed to have arisen at location 3 along the x-axis (marked with a vertical dashed line); the spread will continue until the selected allele is at frequency 1 across the whole habitat.
(A) Uniform selective advantage across space. If the novel variant is identically advantageous everywhere, the prediction is that as the variant increases in frequency it will be exceptionally concentrated around its geographic origin relative to a neutral variant of the same age. One effect of this is to create transiently enhanced levels of divergence among populations and clines in allele frequencies that reflect the geographic origin of the allele.
(B, C) Non-uniform advantage across space. In scenario B, the novel allele is introduced to the regions in which it is most advantageous and increase in frequency rapidly in those regions. This can lead to transient correlations between allele frequency and the environmental factor that drives positive selection. In contrast, in scenario C, the novel allele arises in an area distant from where it is most advantageous. It will increase in frequency locally before spreading outwards, and its distribution will carry a strong signature of its geographic origin and be less reflective of spatial variation in selective advantage.
These models assume selection acting on new mutations, which may not be the prevailing model in humans. Selection on pre-existing variation will complicate these simple scenarios.
Figure 3. Neutral scenarios that produce clines in allele frequencies.
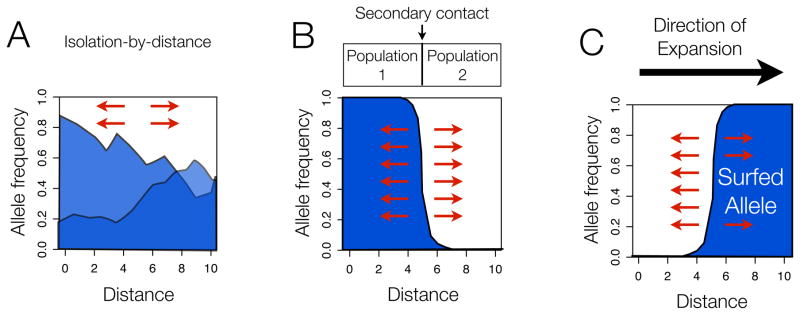
(A) Isolation by distance. Under models of isolation-by-distance, many neutral alleles will show cline patterns, especially along geographic axes with the least gene flow.
(B) Secondary contact between two populations. With secondary contact, neutral alleles will transiently show a cline pattern at the contact zone between the two populations. Note that the allele frequency in the two source populations need not be 0 and 1, as shown here; clines along the secondary contact zone will form even if the allele frequency difference between the two populations is more modest.
(C) Expansion into new territory giving rise to serial founder effects and “allele surfing”. The cartoon depicts the distribution immediately following the expansion and an extreme case of surfing where the allele has gone completely to fixation.
In each case, arrows indicate that none of these patterns is stable -- dispersal and drift will erode the clines over time. In all three models, cline patterns that arise can potentially be confused with cline patterns expected as a result of selection.
Figure 2. Spatially varying selection and stable polymorphisms.

The panels illustrate the allele frequency dynamics of a novel variant (red) in a population, when the variant is advantageous in some locations and disadvantageous in others (A, B) or when local balancing selection (e.g. due to heterozygote advantage) is operating (C, D). These scenarios give rise to a stable polymorphism (where the novel and ancestral variant persist in the population). In these models the novel variant will not replace the ancestral variant - the novel variant will simply become more common in the regions where it is advantageous and can spread to via dispersal. For every selected allele, a representative neutral allele of similar average frequency (blue) is shown for reference.
(A) Allele is favored in some patches and disfavored in others; in this situation, the allele will be fixed in the geographic patches where it is advantageous, and absent in regions where it is disadvantageous, with clines of frequency expected along the contact points between the two regions
(B) Allele is favored in one geographic extreme and disfavoured in the opposite extreme. If the transition from being advantageous and disadvantageous occurs across a geographic range, rather than being abrupt, then broader clines are expected.
(C) Local balancing selection that varies in intensity across space. When selection intensities vary across space, the local equilibrium frequencies will vary across space depending on the environmental factors driving selection and in turn generate correlations of allele frequencies with environmental factors that are not transient. A classic example is the sickle-cell mutation, which is found in high frequency in regions where malarial endemia is high and decreases in frequency as the prevalence of malaria decreases.
(D) Local balancing selection that is constant across space; balancing selection can lead to exceptionally constant allele frequencies over space.
Scenarios A–C will generate correlations between allele frequency and environmental factors underlying variation in selection.
The investigation of spatial patterns at selected loci can give insight into fundamental questions about geographically variable traits in humans and how humans have evolved in response to novel selective pressures. Although humans are overwhelmingly genetically similar, marked geographic patterns have been observed for many heritable traits. Such traits include disease risk, pathogen resistance, and variable drug response, as well as physiological characteristics, such as skin pigmentation and body mass. In some cases, correlations with environmental variables suggest that natural selection shaped the global distribution of a trait; examples include correlations between skin pigmentation and latitude5, lactose tolerance and milk consumption6–8, and body mass and weather temperature9, 10. In studying variation for these traits, many questions arise such as: What combination of selection (if any) and dispersal led to the current geographic distributions of alleles at these loci? Which loci have geographic patterns of variation that suggest the recent impact of natural selection? How often do different populations use different variants to respond to the same selective pressures? Answering these evolutionary questions is relevant for understanding the genetic basis and evolutionary origins of human phenotypic variation, a task that is particularly important for biomedical traits.
In this review, we describe methods for studying selection based on spatial patterns of genetic variation, keeping in mind the difficulties of distinguishing the outcome of neutral demographic processes and selective events. We first review aspects of background spatial patterns of variation that might confound and/or strongly influence the outcome of selection in humans. We then turn to approaches for using spatial patterns to study signatures of selection and review some of the established and emerging results of these studies. In particular, we outline insights on the sources of variation used by human populations to adapt to novel selective pressures.
Background spatial patterns due to demographic history
Recent genome-wide studies of human population structure have greatly increased the resolution of our understanding of human population structure.11–16,17,18,19. Before investigating possible spatial signatures of selection, it is crucial to understand the background spatial patterns created by human demographic processes.
Clusters and clines
Genome-wide studies using the HGDP panel17–21 have revealed evidence for clusters and clines in human genetic data. At the global scale, there is evidence for at least five major genetic clusters that correspond to broad continental regions17–19. The change in the proportion of ancestry across the boundary regions tends to be gradual, and individuals from these regions have ancestry from groups on both sides of the boundary20. Although there has been some debate as to whether these clusters are due to uneven sampling20, 22, there are also biological explanations for this pattern. One is isolation-by-distance (Figure 3A) that is accentuated by geographic barriers, and the other is secondary contact (Figure 3B) between differentiated ancestral populations.
In addition to continental-scale clusters, clines of allele frequencies are common in humans: a graded change in allele frequencies is evident in analyses of the relationship between genetic and geographic distance within regions of the world and at a global scale1, 21, 23. Geographic clines may be due to the spatial patterning that occurred as humans expanded out of Africa (see below), but they may also arise from a long-standing history of spatially restricted gene flow. These results taken together imply that, although there are continental-scale clusters, allele frequencies change gradually on small geographic scales.
The expansion out of Africa and allele surfing
Studies of the HGDP panel have also highlighted a gradual decrease in genetic diversity levels as a function of the distance from sub-Saharan Africa, a result that is consistent with the serial founder model of human expansion out of sub-Saharan Africa21, 24. Importantly, this model can give rise to the “allele surfing” phenomenon, which produces cline patterns (Figure 3C) and geographic patches called “sectors” 25–28. This phenomenon is a result of the intense amount of genetic drift occurring at the leading edge of a population expansion. As one set of population founders is further sub-sampled to produce a new set of founders, alleles that are at low frequency in the ancestral population, or new mutations that occur during the expansion, can rapidly rise to high frequency in the newly colonized populations (i.e. alleles “surf” the expansion wave).
All the above genome-wide patterns are crucially important in assessing and interpreting the evidence for selection in structured populations. This is because some of these patterns closely resemble those expected under specific models of selection. For example, latitudinal clines of allele frequencies may reflect migration patterns or the action of a selective pressure correlated with latitude (e.g. UV radiation). Similarly, alleles that have surfed may look very similar to alleles that have recently undergone positive selection29, 30. Therefore, a rigorous assessment of the evidence for adaptation requires that background spatial patterns of variation be incorporated in statistical tests of neutrality so that the effects of selection can be distinguished from those of population history alone.
Spatial approaches for detecting selection in humans
FST based approaches
Wright’s fixation index, FST, provides a relative measure of the amount of genetic differentiation between populations31, 32. This simple statistic has been used to study spatial selection based on an insight of Lewontin and Kraukauer33 (although traces of the idea can be found in several papers at least as early as 194834, 35). The key insight is that the expected differentiation of allele frequencies between populations is the same at all neutral loci and is determined principally by demographic processes. However, loci that have undergone selection in one population but not another are expected to show higher levels of differentiation (i.e. higher FST values). Importantly, such high FST values can arise as a result of transient “wave of advance” dynamics of a globally advantageous allele (Figure 1A) or of local selective pressures (Figure 1B, 2). At the other extreme, alleles maintained at an equilibrium frequency by balancing selection are expected to exhibit less differentiation (i.e. lower FST values) than expected at neutral loci.
Lewontin and Krakauer considered data from many independent loci and asked whether the variance across loci of the FST statistic was greater than expected under a model in which all loci evolve neutrally. A difficulty with this approach is that a model of population history has to be specified in order to develop expectations for the FST distribution under neutrality. An early analysis of human allele frequency data that incorporated a complex demographic model found evidence for an excess of high and low values of FST relative to expectations36. This type of approach has been extended to thousands of SNPs and coupled with coalescent simulations of a population structure model37, and again showed an excess of both high- and low- values of FST consistent with both adaptive divergence and balancing selection.
Recently, it has become more common to take a complementary approach that avoids overly simplified models of human history. One group of such approaches relies on defining sets of functionally-related SNPs and then asking whether the distribution of FST values for these SNPs is significantly different from that for other, putatively neutral, SNPs (for example, by comparing the distributions for genic versus non-genic SNPs). This approach may have power to detect weak or recent selective pressures that result in small changes in allele frequencies at a sufficiently large number of loci. However, defining groups of functionally-related SNPs or genes is not straightforward and, because the number of possible sets is large, the power may be low (due to multiple test corrections). Recent genome-wide surveys have shown that there is a significant excess of genic relative to non-genic SNPs and of nonsynonymous and 5′ UTR SNPs relative to non-genic SNPs in the extreme tail of the FST distribution38, 39. These results suggest that the approach may also be used to identify individual targets of adaptations (see below).
FST values can also be used to detect genomic regions that have undergone selection. If selection is strong, loci under selection should exhibit extreme levels of differentiation relative to neutral loci and thus may be identified through outlier approaches (Fig. 4). With such outlier approaches, the evidence for selection at specific loci is assessed by calculating the proportion of SNPs within a genome-wide distribution that have more extreme FST values compared to the SNP of interest (this proportion is sometime referred to as an “empirical p-value”, although it is perhaps better understood as a transformed rank statistic than a proper statistical p-value). Related model-based approaches test for abnormally differentiated loci using the island model, 40, 41, but a limitation is that these methods can mistake neutral loci for being selected if population structure is hierarchical42.
Figure 4. Outlier approaches to identify candidate targets of selection.

Outlier approaches simply rank all SNPs from a large-scale survey based on the value of a test statistic, e.g. FST, and then take all SNPs above a specified cut-off as targets of selection. This is based on the assumption that selection is sufficiently strong to generate extreme spatial patterns compared to the rest of the genome. The power and accuracy of these approaches depends on a number of variables, including the proportion of loci affected by selection and the strength of selection105.
In a similar vein, specific candidate SNPs can be evaluated against a large collection of SNPs to determine if the spatial patterns at candidate SNP is unusual relative to the rest of the genome. (A) Correlation between allele frequency and latitude for candidate susceptibility SNPs for hypertension (in red) compared to random microsatellites (STRs; in blue) and SNPs (in yellow) 53. (B) Differentiation of allele frequency in loci (A–K) involved in natural variation in skin pigmentation compared to a large collection of random SNPs 75. The dotted line shows the position beyond which 5% of the random SNPs fall, and the solid line the position beyond which 1% of the random SNPs fall.
Several individual variants underlying phenotypes known to be advantageous have extreme allele frequency differentiation. Examples include several SNPs in skin pigmentation genes (e.g. SLC24A543, KITLG44, MC1R39) or in immune response genes (e.g. FY, TLR639). Although these extremely differentiated variants provide plausible examples of advantageous alleles, it is conceivable that many selective pressures in humans are not strong and thus would be missed by outlier approaches.
Several other caveats apply to the interpretation of the results of FST analyses. One possible complication is the impact of background selection, whereby strong purifying selection acts repeatedly on a locus. Because strong deleterious alleles are quickly eliminated, it is as if neighboring loci exist in a population with a much smaller population size (i.e., neighboring loci have a lower effective population size). This enhances the rate of genetic drift and hence differentiation, resulting in an excess of high FST values in comparison to strictly neutral loci45, 46.Because background selection is likely to act more strongly in genic compared to non-genic regions, negative rather than positive selection could underlie part or all of the observed excess of high FST for genic relative to non-genic SNPs. To take the effect of background selection into account, different classes of SNPs within coding regions should be compared. At a qualitative level, two recent studies showed a higher enrichment of nonsynonymous SNPs than synonymous SNPs in the upper tail of the FST distribution38, 39, which provides some evidence against background selection as an explanation for the enrichment in high FST values. A second possible complication is that theoretical work has shown that, under some parameter values, the expected levels of differentiation of a spreading adaptive mutation are lower (rather than higher) at the selected site than at neutral loci 47; however, it is arguable whether the parameter range where this occurs is relevant to humans. Finally, several factors might bias levels of differentiation in ways that confound FST-based methods, especially when comparing FST distributions between large sets of SNPs (e.g. genic vs. non-genic comparisons). Caution may be necessary to avoid biases due to between-population differences in the frequency spectrum and to systematic differences in SNP ascertainment and in genomic features that might influence levels of differentiation (e.g. %G+C content, recombination rates).
Geographic clines and correlations of allele frequencies with environmental variables
In natural populations of many species several quantitative traits are distributed clinally, namely they are correlated with geographic variables (e.g. latitude). Other traits are correlated with specific environmental variables (e.g. temperature), which mirror the selective pressures acting on the phenotypes themselves. Studies of protein and DNA polymorphisms, mainly in fruitflies and humans, have shown that in many cases allele frequencies have spatial patterns that parallel those in adaptive phenotypes, raising the possibility that gradual changes in allele frequency across space signal adaptations to continuous local environments (Fig 2C). A notable example is a selected polymorphism in the alcohol dehydrogenase (Adh) locus in D. melanogaster, which is correlated with latitude on both hemispheres48. Consistent with the idea that this spatial pattern reflects adaptations to varying climate, the clines for the Adh polymorphism have shifted over a 20 years period in response to the recent climate change49.
Until recently, analyses of geographic clines did not take into account the effect of population history in assessing the evidence for selection (this is also true for the recently proposed spatial analysis method [SAM] method50). Most recent studies (see Box 2) have used background spatial patterns of allele frequency to guide a null expectation by comparing correlations with geographic or environmental variables for test loci to those found in large collections of unlinked control loci. Spatial evidence for adaptations to continuous environments is inferred if there is an excess of high correlations at test compared to control loci. Using this approach, a study showed that a set of candidate susceptibility alleles for hypertension tend to have stronger correlations with latitude compared to hundreds of microsatellites and many SNPs52, 53. Another study showed that SNPs in candidate genes for the metabolic syndrome are more strongly correlated with climate variables than control SNPs51. In an attempt to adjust for the background genetic structure of human populations, this study estimated a null model for the covariance of allele frequencies among populations and assessed the evidence for selection by testing if a linear relationship between a genic SNP and a continuous environmental variable provided a better explanation for the data compared to the null model.
Box 2. Recent studies of geographic clines and environmental correlations.
The newly available genome-scale data sets in densely sampled human populations have reawakened interest in the study of geographic clines and correlations between allele frequencies and environmental variables. Recent studies have focused primarily on genes that are plausible candidate susceptibility loci for common human diseases or disease-related traits with marked inter-ethnic differences in prevalence. These approaches are bolstered by adaptive hypotheses that explain the epidemiology of these phenotypes. For example, the higher prevalence of hypertension, and in particular salt sensitive hypertension, in African Americans compared to European Americans was hypothesized to reflect adaptations to hot equatorial climates in ancestral African populations101. Accordingly, candidate susceptibility variants for hypertensions showed strong clines with latitude in the HGDP panel52, 53.
These approaches are now being used to inform the identification of polymorphic variants with effects on gene function. An early study of the TP53 gene, which is a master sensor of stress, had detected a latitudinal cline for a common amino acid variant in worldwide populations102. Recently, the same polymorphism was found to be correlated with cold winter temperature in East Asians, while a SNP in the MDM2 gene, whose protein product interacts with P53, was strongly associated with UV intensity in the same populations103. Although there is a plausible biological rationale linking variable stress response and adaptations to local environments, it will be important to determine if these observations stand out against background spatial patterns of variation or are consistent with neutral evolution. A role for spatially-varying selection in shaping stress response was recently proposed also for the serum and glucocorticoid regulated kinase 1 (SGK1) gene. Unusual levels of allele frequency divergence between populations and clines with environmental variables identified a variant upstream to SGK1 that affects binding of the glucocorticoid receptor to the DNA and glucocorticoid-mediated induction of SGK1 expression104.
Interestingly, clines of genetic diversity have been observed in the HLA region81. More specifically, a significant correlation between HLA diversity and pathogen richness was detected, consistent with pathogen driven selection acting on the HLA genes. These results suggest a role for balancing selection in adaptations to local environments. If this is the case, some polymorphisms showing allele frequency clines may be maintained by balancing selection that varies continuously in intensity with concomitant gradual variation in equilibrium allele frequencies. Indeed, some variants (e.g. variation in the RPTOR gene) show extremely strong correlations with environmental variables without marked differences in allele frequencies between the extremes of the geographic range51, as might be expected under strong balancing but not strong directional selection (Fig. 5).
As for FST-based approaches, outlier approaches can be applied to the analysis of latitudinal clines and of correlations with environmental variables; in this case, the test statistic measures the evidence for a correlation between allele frequency and latitude or environmental variables (see examples in Box 2).
Importantly, geographic clines are also expected under a neutral model of isolation by distance or if two separated populations have recently come into secondary contact (e.g., Figure 3B and C). Moreover, correlations between allele frequencies and environmental variables may arise under neutrality if populations happen to be structured in the same way as the environmental variables (Fig. 3A). If populations are not, correlations between allele frequencies and environmental variables (for example, the scenario in Fig. 2C) may provide more robust signals of spatially-varying selection compared to geographic clines.
Comparing within-population diversity among populations
If a recent selective sweep has taken place in one population but not another (either due to local adaptation or a wave of advance), there will be a paucity of variation near the selected site in the population in which the sweep took place; this reduction in variation can be detected by comparing locus-specific diversity levels between populations54–57. Two recent approaches based on relative amounts of local haplotype diversity, (XP-EHH)58 and ln(Rsb)59, aim to exploit the signature of positive selection on patterns of linked variation; these methods are powerful in cases in which selection drives the allele to fixation or near-fixation in one population but not the other (as opposed to iHS which uses only one population and loses power once the beneficial allele becomes nearly fixed60). A useful property of these methods is that they can point to the haplotype carrying the advantageous allele and the population in which the adaptation occurred. Signals detected by using such approaches include variation at the LCT locus61, a well established target of selection, at the LARGE and DMD genes, which play a role in Lassa virus infection58, and at the EDAR gene58, which is involved in the development of hair, teeth and exocrine glands.
The history of specific adaptive variants
While most contemporary research focuses on identifying loci that have undergone recent positive selection, further insights will come from detailed follow-up studies on the spatial distribution of alleles that are putatively adaptive.
If a geographically localized signature is due to a partial sweep, one can use a “wave of advance” model to estimate the relative strength of positive selection from the spatial distribution of the selected allele. Qualitatively, if a selected allele is at high frequency near its origin, but has not spread out broadly, selection is inferred to be strong relative to dispersal; whereas if the allele disperses broadly before reaching high frequency near its origin, selection is likely to be weak relative to dispersal. Quantitatively fitting a “wave of advance” model to spatial data can allow one to estimate of the ratio of the strength of positive selection to dispersal. Further interpretation of this ratio requires using either knowledge of dispersal parameters to gain insight about selection or knowledge of the allele age to make inferences about selection intensity and, in turn, estimate dispersal. This analysis was attempted for the human CCR5 Δ32 HIV-resistance allele62, but the interpretation of the results is complicated by inaccuracies in the estimated recombination rates that in turn led to incorrect inferences about the allele age63. This approach might have broad applicability; however, current wave of advance models are still relatively simple (e.g., assumptions include spatially and temporally homogenous dispersal and completely deterministic allele frequency change).
In cases where the allele in question shows what appears to be a simple geographic cline (Figure 2), the width of the cline may be used to estimate the strength of selection (e.g., as described in Endler64). One complication is that these methods are only feasible if the cline is known to be due to an abrupt change (Fig 2A) or a linear gradient (Fig 2B) in selective pressure. Observations of environmental factors related to the selective pressure may help distinguish between models for the geographic cline (e.g., if environmental proxies for the selective pressure are clinal, one might infer that the selective pressure is also clinal).
Insights into the sources of adaptive variation based on spatial patterns
In order to adapt to a new selective pressure, a population must either: 1) Wait for an adaptive variant to be introduced by mutation; 2) Wait for an adaptive variant to be introduced via dispersal from a neighboring population; 3) Employ standing variation (e.g. a previously neutral segregating variant becomes advantageous). Spatial patterns of selected alleles are beginning to provide insights into the relative importance of these three sources of adaptive genetic variation for human populations.
Multiple mutations underlying adaptive phenotypes
Strikingly, many of the best-studied adaptive phenotypes in humans have revealed multiple mutations conferring an advantage to the same or similar selective pressures. The examples include lactase persistence65–67, skin pigmentation68, and malaria resistance polymorphisms (reviewed in 69–71). For instance, G6PD deficiency, a form of malaria resistance, is due to two main mutations (G6PDA− and G6PDMed) each accounting for the vast majority of cases in Sub-Saharan Africa and Europe, respectively. Lactase persistence has a similar pattern at the continental scale whereby different mutations are found in Europe, Africa and the Middle East65–67. Moreover, within Africa and the Middle East, multiple mutations have been shown to contribute to lactose tolerance (however, some of these are shared between populations as if they arose from shared ancestral standing variation [see below]). A possible explanation is that the spread of adaptive alleles across continental regions is sufficiently slow and mutation rates to adaptive alleles are sufficiently high that novel adaptive mutations arise within distinct geographic regions, before any single variant spreads globally39. Indeed, theoretical work has shown that population-specific mutations are likely if population structure is strong and if multiple mutations at multiple loci can give rise to the adaptive trait (genetic redundancy72, 73). If, indeed, genetic heterogeneity is common for adaptive phenotypes, it poses challenges for replicating results between populations in association studies and for detecting selection39, 73, 74. Further studies will help establish whether population-specific adaptive mutations are the rule or an exception seen only for the extreme examples of selection that have been well-studied thus far.
Dispersal, demography, and the geographic distribution of selected alleles
Two recent analyses of spatial patterns in SNP data from the HGDP and Hapmap populations have shown that the most strongly differentiated alleles among continental populations (hence, likely targets of selection) are distributed geographically in patterns much like those expected for neutral genetic variation39, 75. These results support the notion that population structure is important in shaping the dispersal of selected alleles and, in turn, the outcome of natural selection in humans. Presumably, adaptive mutations have been slow to spread in humans (1) because of low levels of long-range dispersal and (2) because the variant may still be lost by drift in the new population even if it disperses (especially if its selective advantage is weak).
These studies also suggest that the timing of human population expansions may play a role in determining the dispersal and distribution of adaptive alleles. For instance, many alleles in high frequency in East Asian HGDP populations are also found in the Americas, presumably because alleles that were selected in East Asian populations prior to the colonization of America would be carried into the Americas at high frequency. The severity of bottlenecks might also impact the distribution of selected alleles and might explain why more loci were observed as fixed differences between the Han Chinese and Yoruban populations than between the CEPH European and Yoruban populations39.
A major criticism of the conclusions of these studies is that many of the extremely differentiated SNPs may be neutral (e.g., Hofer et al30) and that most truly adaptive variants may not be detected because they involve subtle allele frequency shifts or selection on standing variation (see below). Nonetheless, the patterns described above are observed also for a number of extremely differentiated alleles with known phenotypic and fitness consequences, implying that dispersal has been limiting at least for this set of adaptive variants. For example, several skin pigmentation variants that reached high frequency in Western Eurasia, but not in East Asia (and vice versa) even though both groups of populations experience similar degrees of UV radiation39, 76, 77.
Selection on standing variation
Due to the recent origin and dispersal of human populations, there is abundant shared variation among populations. Plausibly, some of that shared variation became adaptive with the onset of environmental challenges posed by novel diet, habitat, and pathogen pressures. As a result, different populations may have responded to similar selective pressures using the same or different standing alleles. This may create scenarios in which there is limited power to detect signals of selection 39, 73, 74. For example, if the trait is complex, adaptation can occur via small shifts in allele frequencies at multiple loci. Even if an adaptive trait is simple and monogenic, the canonical signatures of enhanced linkage disequilibrium (LD) and reduced diversity due to a selective sweep are substantially weakened when positive selection acts on standing variation78, 79. These systematic deficiencies in power make it challenging to assess the importance of standing variation in the response to selection.
Future progress should be made in developing models and methods for studying selection on standing variation in order to address this challenge. Even though the LD-based and diversity-based signatures may be weak78, 79, the spatial patterns expected at the selected site itself may still be quite strong for standing variation. For example, the scenarios in Figure 2 do not depend on whether selection began on standing versus new variation. The advent of whole-genome re-sequencing will allow interrogating all sites for spatial signatures of selection without relying on LD and, thus, it will improve the power to discover examples of standing variation.
Future Directions
While we have shown various approaches that are providing novel insights, further progress in the field will depend on novel developments.
Advancing models of selection for humans
The classical models of selection in structured populations (Box 1), lack several features that may have important effects on the dynamics of selection in human populations: 1) Recent spatial expansions with serial founder effects; 2) Changing selective pressures on different time-scales, some of which are quite recent (e.g., changes associated with large time-scale climate change, colonization of novel habitats during the expansion out of East Africa, the development of agriculture, modern health technologies, and on-going pathogen emergence); 3) Spatial complexities, such as irregularly shaped habitats, fine-scaled variation in selection pressures, and geographically and temporally varying dispersal parameters; and 4) The potential for multiple mutations and/or standing variation underlying the adaptive response to a novel selective pressure.
Relaxing these assumptions to build more insightful models will be computationally challenging. Carefully describing the basic properties of even the classical models reviewed in Box 1 is still an ongoing research area (e.g. Nagylaki and Lou80), largely because the simple classical models alone present serious mathematical challenges. To move forward and include many of the features listed above will require innovative theoretical approaches and possibly large-scale numerical approximation techniques, much like those used in other fields that deal inherently with complex spatial processes (meteorology, oceanography).
Full re-sequencing data
A major limitation of SNP genotyping data sets is the ascertainment bias introduced in the selection of SNPs to be surveyed. This is particularly problematic in spatial studies of selection because the most interesting variants may be geographically restricted and hence may not be variable in the population panel used for SNP discovery. Full re-sequencing data will overcome this limitation. Further, it will allow asking whether polymorphism levels at specific loci (such as the HLA region81) vary as a function of specific environmental variables. Small scale re-sequencing studies have already identified interesting spatial patterns of nonsynonymous variants for candidate selection targets as well as susceptibility loci for clinical phenotypes; these include the MC1R locus involved in skin pigmentation82, the ANGPTL4 known to influence plasma lipid levels83, and the NAT2 gene coding for a drug metabolizing enzyme84, 85. Next generation sequencing technologies will help to reveal the fine texture of human sequence variation across geography and address questions about human history and selection with unprecedented detail.
Using rich environmental data and fine-scale population samples to detect subtle signatures of selection
To date, analyses of spatial patterns of variation have focused on extremely differentiated variants and probably missed loci that show more subtle allele frequency differences or weaker environmental correlations. Future studies will be most fruitful if coupled with a detailed characterization of human environmental diversity such as information about climate, diet composition, pathogen diversity and load, and mode of subsistence. Indeed, previous studies looking at specific environmental features directly relevant to human physiology and health successfully identified regionally advantageous variants and established paradigmatic examples (e.g. malarial endemia and sickle cell anemia). Perhaps because of the need for fine-scale geographic sampling and environmental data, analyses of environmental correlations have been applied only to individual candidate genes rather than on a genome-scale. These approaches are most powerful if they compare populations living in different environments within the same continental cluster and for different clusters; allele frequency differences between environments that are consistently observed within multiple clusters can be attributed to environmental adaptations as opposed to divergence between populations. This study design was recently applied to copy number variation in the amylase gene, which appears to have increased and decreased in response to selective pressures for high or low starch diets within disparate regions of the world86.
Relevance to biomedical research
To the extent that genetic variation contributes to health disparities, it will be interesting to determine how often risk variants for diseases with marked differentiation across ethnic groups result from neutral or adaptive processes and, if adaptive, whether the alleles were globally or locally advantageous. The convergent evolution of the light pigmentation phenotype in Asia and Europe39, 68, 76 reminds us that different frequencies of a variant influencing a phenotype do not necessarily imply that the phenotype has different prevalence across populations. They also argue that the biological mechanisms underlying a given adaptive phenotype may differ across populations. Common diseases may provide examples of this as it is often subtypes of a given disease that vary in prevalence across populations (e.g. triple negative breast cancer and salt-sensitive hypertension), pointing to different pathways underlying the same disease in different populations. Additionally, studies of spatial patterns of human genetic variation are beginning to give insight into the extent with which the socio-political (e.g., census) categories used in biomedical research coincide with the spatial distribution of selective pressures and of selected alleles. On one hand, the alignment of the spatial distribution of many selected alleles with continental clusters39, 75 supports claims that continental clusters might be useful to describe and understand the distribution of medically relevant phenotypes. On the other hand, the observed correlation between geographic or environmental variables and the frequency of some susceptibility alleles suggests that genetic variation is not always organized according to these geographically defined clusters, but follows specific aspects of the environment51–53. Finally, a deeper understanding of the evolutionary processes generating genetic differences between populations will hopefully prevent mis-interpretations of spatial patterns of genetic variation.
Figure 5. Correlation of a SNP in the RPTOR gene with environmental variables.

(A) Pie charts show the frequency of the derived allele at SNP rs12946049 in the RPTOR gene in the HGDP panel51. Color intensities represent the maximum temperature in the winter. (B) Allele frequency at rs12946049 as a function of distance from the equator. Qualitatively, the correlation is convincing for three reasons. First, the variation correlates strongly with an environmental feature in ways that depart from background spatial patterns (e.g., distantly related populations sharing the same environment – tropical Americas, Oceania and sub-Saharan Africa – have similar allele frequencies). Second, the correlation exists within multiple world regions, as shown in panel B. Interestingly, the extent of allele frequency differentiation at this SNP is not extreme (ranging from 0 to 0.5 frequency).
Acknowledgments
We would like to thank M. Przeworski, G. Coop, and members of our laboratories for discussions and critical comments on the manuscript. AD acknowledges research support from the National Institutes of Health (GM79558 and DK56670) and JN acknowledges support from the Searle Scholars Program and the National Science Foundation (0733033).
Glossary
- Selective sweep
When a mutation with a beneficial fitness effect arises in a population, natural selection will rapidly increase the frequency of the mutation to a high frequency or to fixation, resulting in a reduction of diversity at and around the selected locus
- Linkage disequilibrium
The non-random association of alleles carried at different loci. If a particular combination of alleles on a chromosome (i.e. haplotype) is found more or less frequently than expected assuming independence among loci, then linkage disequilibrium (LD) is said to exist. LD can arise for various reasons (novel mutations, genetic drift, natural selection, admixture) but recombination is the main process which removes it
- Isolation-by-distance
A model in which the amount of gene flow between two locations decreases as a function of distance. At equilibrium, this model predicts that genetic differentiation increases as a function of geographic distance. Sometimes the term refers simply to this emergent pattern, rather than the model
- Secondary contact
The event in which two populations that have ceased to exchange migrants begin to re-exchange migrants with one another. In cases where the populations exchange migrants along a frontier, this boundary is known as a secondary contact zone
- Serial founder model
A model of how novel habitats are colonized in which a source population is first sub-sampled to choose founders who will colonize a neighboring unoccupied space. This sub-sampling process, which results in a population bottleneck, is repeated sequentially as the population expands into further unoccupied space
- Purifying selection
When natural selection acts to remove novel deleterious mutations from a population
- Effective population size
The population size needed to predict how a locus would evolve with respect to some property (typically genetic drift), if that locus evolved according to the idealized Wright-Fisher model of population genetics. In many complex scenarios, the behaviour of a locus can be predicted with an appropriate effective population size
- Metabolic syndrome
A combination of traits related to type 2 diabetes, obesity, hypertension and altered lipid levels. It is a major risk factor for cardiovascular disease
- Island model
A model of population structure in which a number of island populations each exchange migrants symmetrically
- Genetic heterogeneity
The production of a similar phenotype by different mutations at either the same or different loci in different individuals
- Convergent evolution
Two traits are said to be the result of convergent evolution if their similarities arose by independent processes without common ancestry. This usually reflects evolutionary adaptation to similar environmental conditions
- Fitness peak
A location in the space of possible genetic configurations for a population that results in high mean fitness
- Relative fitness
A measure of the contribution of a genotype to next generation calculated as the average number of surviving progeny of that genotype relative to that of the genotype with the highest average number of surviving progeny
- Gene flow
The movement of genes among populations. Often expressed as the proportion of gene copies (or breeding individuals) that are immigrants from a different population
- Principal component
A linear combination of multivariate observations that is chosen such that the resulting values summarize the major patterns of covariation among the observed units (e.g. individuals, populations) in the original data
- Triple negative breast cancer
A subtype of breast cancer that lacks three receptors, i.e. estrogen receptor, progesteron receptor, and human epidermal growth factor receptor 2. Although breast cancer overall is more common among women of European ancestry, triple negative cases occurs more frequently in postmenopausal women of African ancestry. They are also more aggressive and resistant to current treatment compared to cancers that express these receptors
- Salt sensitive hypertension
Refers to inter-individual variation in blood pressure changes in response to high or low sodium intake. Hypertensive subjects whose blood pressure increases more than a specified proportion upon salt loading are defined as salt sensitive
- Genetic drift
The random fluctuations in allele frequency through time that occur due to chance alone
- Variance
A measure of the dispersion of a random variable around its mean value
- Coalescent simulations
An efficient and flexible approach for simulating population genetic data that traces ancestral lineages backwards in time keeping track of events in which ancestral lineages have common ancestors (coalescent events)
- Power
The frequency with which a statistical test will reject a null hypothesis that is false
- RPTOR
It codes for the regulatory associated protein of target of rapamycin. The complex between the RPTOR gene product and the target of rapamycin is the central component of a nutrient- and hormone-sensitive signaling pathway that regulates cell growth
Contributor Information
John Novembre, Email: jnovembre@ucla.edu.
Anna Di Rienzo, Email: dirienzo@uchicago.edu.
References Cited
- 1.Cavalli-Sforza LL, Menozzi P, Piazza A. History and geography of human genes. Princeton University Press; Princeton, N.J: 1994. [Google Scholar]
- 2.Roychoudhury AK, Nei M. Human Polymorphic Genes World Distribution. Oxford University Press; New York - Oxford: 1988. [Google Scholar]
- 3.Haldane JBS. The rate of mutation of human genes. Hereditas. 1949;35 (Suppl 1):267–272. [Google Scholar]
- 4.Fisher R. The wave of advance of advantageous genes. Ann Eugen. 1937;7:355–369. [Google Scholar]
- 5.Roberts DF. Human pigmentation: its geographical and racial distribution and biological significance. J Soc Cosmetic Chem. 1977;28:329–342. [Google Scholar]
- 6.Simoons FJ. Primary adult lactose intolerance and the milking habit: a problem in biologic and cultural interrelations. II. A culture historical hypothesis. Am J Dig Dis. 1970;15:695–710. doi: 10.1007/BF02235991. [DOI] [PubMed] [Google Scholar]
- 7.Simoons FJ. Primary adult lactose intolerance and the milking habit: a problem in biological and cultural interrelations. I. Review of the medical research. Am J Dig Dis. 1969;14:819–36. doi: 10.1007/BF02233204. [DOI] [PubMed] [Google Scholar]
- 8.Cavalli-Sforza LL. Analytic review: some current problems of human population genetics. Am J Hum Genet. 1973;25:82–104. [PMC free article] [PubMed] [Google Scholar]
- 9.Katzmarzyk PT, Leonard WR. Climatic influences on human body size and proportions: ecological adaptations and secular trends. Am J Phys Anthropol. 1998;106:483–503. doi: 10.1002/(SICI)1096-8644(199808)106:4<483::AID-AJPA4>3.0.CO;2-K. [DOI] [PubMed] [Google Scholar]
- 10.Roberts DF. Climate and Human Variability. Cummings; Menlo Park: 1978. [Google Scholar]
- 11.Friedlaender JS, et al. The genetic structure of Pacific Islanders. PLoS Genet. 2008;4:e19. doi: 10.1371/journal.pgen.0040019. [DOI] [PMC free article] [PubMed] [Google Scholar]
- 12.Wang S, et al. Genetic variation and population structure in native Americans. PLoS Genet. 2007;3:e185. doi: 10.1371/journal.pgen.0030185. [DOI] [PMC free article] [PubMed] [Google Scholar]
- 13.Nelson MR, et al. The Population Reference Sample, POPRES: a resource for population, disease, and pharmacological genetics research. Am J Hum Genet. 2008;83:347–58. doi: 10.1016/j.ajhg.2008.08.005. [DOI] [PMC free article] [PubMed] [Google Scholar]
- 14.Novembre J, et al. Genes mirror geography within Europe. Nature. 2008;456:98–101. doi: 10.1038/nature07331. [DOI] [PMC free article] [PubMed] [Google Scholar]
- 15.Lao O, et al. Correlation between genetic and geographic structure in Europe. Curr Biol. 2008;18:1241–8. doi: 10.1016/j.cub.2008.07.049. [DOI] [PubMed] [Google Scholar]
- 16.Tishkoff SA, et al. The genetic structure and history of Africans and African Americans. Science. 2009;324:1035–44. doi: 10.1126/science.1172257. [DOI] [PMC free article] [PubMed] [Google Scholar]
- 17.Li JZ, et al. Worldwide human relationships inferred from genome-wide patterns of variation. Science. 2008;319:1100–4. doi: 10.1126/science.1153717. [DOI] [PubMed] [Google Scholar]
- 18.Rosenberg NA, et al. Genetic structure of human populations. Science. 2002;298:2381–5. doi: 10.1126/science.1078311. [DOI] [PubMed] [Google Scholar]
- 19.Jakobsson M, et al. Genotype, haplotype and copy-number variation in worldwide human populations. Nature. 2008;451:998–1003. doi: 10.1038/nature06742. [DOI] [PubMed] [Google Scholar]
- 20.Rosenberg NA, et al. Clines, clusters, and the effect of study design on the inference of human population structure. PLoS Genet. 2005;1:e70. doi: 10.1371/journal.pgen.0010070. [DOI] [PMC free article] [PubMed] [Google Scholar]
- 21.Ramachandran S, et al. Support from the relationship of genetic and geographic distance in human populations for a serial founder effect originating in Africa. Proc Natl Acad Sci U S A. 2005;102:15942–7. doi: 10.1073/pnas.0507611102. [DOI] [PMC free article] [PubMed] [Google Scholar]
- 22.Serre D, Paabo S. Evidence for gradients of human genetic diversity within and among continents. Genome Res. 2004;14:1679–85. doi: 10.1101/gr.2529604. [DOI] [PMC free article] [PubMed] [Google Scholar]
- 23.Handley LJ, Manica A, Goudet J, Balloux F. Going the distance: human population genetics in a clinal world. Trends Genet. 2007;23:432–9. doi: 10.1016/j.tig.2007.07.002. [DOI] [PubMed] [Google Scholar]
- 24.Prugnolle F, Manica A, Balloux F. Geography predicts neutral genetic diversity of human populations. Curr Biol. 2005;15:R159–60. doi: 10.1016/j.cub.2005.02.038. [DOI] [PMC free article] [PubMed] [Google Scholar]
- 25.Edmonds CA, Lillie AS, Cavalli-Sforza LL. Mutations arising in the wave front of an expanding population. Proceedings of the National Academy of Sciences of the United States of America. 2004;101:975–979. doi: 10.1073/pnas.0308064100. [DOI] [PMC free article] [PubMed] [Google Scholar]
- 26.Vlad MO, Cavalli-Sforza LL, Ross J. Enhanced (hydrodynamic) transport induced by population growth in reaction-diffusion systems with application to population genetics. Proceedings of the National Academy of Sciences of the United States of America. 2004;101:10249–10253. doi: 10.1073/pnas.0403419101. [DOI] [PMC free article] [PubMed] [Google Scholar]
- 27.Klopfstein S, Currat M, Excoffier L. The fate of mutations surfing on the wave of a range expansion. Molecular Biology and Evolution. 2006;23:482–490. doi: 10.1093/molbev/msj057. [DOI] [PubMed] [Google Scholar]
- 28.Excoffier L, Ray N. Surfing during population expansions promotes genetic revolutions and structuration. Trends in Ecology & Evolution. 2008;23:347–351. doi: 10.1016/j.tree.2008.04.004. [DOI] [PubMed] [Google Scholar]
- 29.Currat M, et al. Comment on “Ongoing adaptive evolution of ASPM, a brain size determinant in Homo sapiens” and “Microcephalin, a gene regulating brain size, continues to evolve adaptively in humans”. Science. 2006;313:172. doi: 10.1126/science.1122822. author reply 172. [DOI] [PubMed] [Google Scholar]
- 30.Hofer T, Ray N, Wegmann D, Excoffier L. Large Allele Frequency Differences between Human Continental Groups are more Likely to have Occurred by Drift During range Expansions than by Selection. Annals of Human Genetics. 2009;73:95–108. doi: 10.1111/j.1469-1809.2008.00489.x. [DOI] [PubMed] [Google Scholar]
- 31.Wright S. The Genetical Structure of Populations. Annals of Eugenics. 1951;15:323–354. doi: 10.1111/j.1469-1809.1949.tb02451.x. [DOI] [PubMed] [Google Scholar]
- 32.Holsinger KE, Weir BS. Genetics in geographically structured populations: defining, estimating and interpreting F(ST) Nat Rev Genet. 2009;10:639–50. doi: 10.1038/nrg2611. [DOI] [PMC free article] [PubMed] [Google Scholar]
- 33.Lewontin RC, Krakauer J. Distribution of gene frequency as a test of the theory of the selective neutrality of polymorphisms. Genetics. 1973;74:175–95. doi: 10.1093/genetics/74.1.175. [DOI] [PMC free article] [PubMed] [Google Scholar]
- 34.Haldane JB. The theory of a cline. J Genet. 1948;48:277–84. doi: 10.1007/BF02986626. [DOI] [PubMed] [Google Scholar]
- 35.Cavalli-Sforza LL. Population structure and human evolution. Proc R Soc Lond B Biol Sci. 1966;164:362–79. doi: 10.1098/rspb.1966.0038. [DOI] [PubMed] [Google Scholar]
- 36.Bowcock AM, et al. Drift, admixture, and selection in human evolution: a study with DNA polymorphisms. Proc Natl Acad Sci U S A. 1991;88:839–43. doi: 10.1073/pnas.88.3.839. [DOI] [PMC free article] [PubMed] [Google Scholar]
- 37.Akey JM, Zhang G, Zhang K, Jin L, Shriver MD. Interrogating a high-density SNP map for signatures of natural selection. Genome Res. 2002;12:1805–14. doi: 10.1101/gr.631202. [DOI] [PMC free article] [PubMed] [Google Scholar]
- 38.Barreiro LB, Laval G, Quach H, Patin E, Quintana-Murci L. Natural selection has driven population differentiation in modern humans. Nat Genet. 2008;40:340–5. doi: 10.1038/ng.78. [DOI] [PubMed] [Google Scholar]
- 39.Coop G, et al. The role of geography in human adaptation. PLoS Genet. 2009;5:e1000500. doi: 10.1371/journal.pgen.1000500. [DOI] [PMC free article] [PubMed] [Google Scholar]
- 40.Beaumont MA, Balding DJ. Identifying adaptive genetic divergence among populations from genome scans. Mol Ecol. 2004;13:969–80. doi: 10.1111/j.1365-294x.2004.02125.x. [DOI] [PubMed] [Google Scholar]
- 41.Beaumont MA, Nichols RA. Evaluating loci for use in the genetic analysis of population structure. Proc R Soc Lond B Biol Sci. 1996;263:1719–1626. [Google Scholar]
- 42.Excoffier L, Hofer T, Foll M. Detecting loci under selection in a hierarchically structured population. Heredity. 2009 doi: 10.1038/hdy.2009.74. [DOI] [PubMed] [Google Scholar]
- 43.Lamason RL, et al. SLC24A5, a putative cation exchanger, affects pigmentation in zebrafish and humans. Science. 2005;310:1782–6. doi: 10.1126/science.1116238. [DOI] [PubMed] [Google Scholar]
- 44.Williamson SH, et al. Localizing recent adaptive evolution in the human genome. PLoS Genet. 2007;3:e90. doi: 10.1371/journal.pgen.0030090. [DOI] [PMC free article] [PubMed] [Google Scholar]
- 45.Charlesworth B, Nordborg M, Charlesworth D. The effects of local selection, balanced polymorphism and background selection on equilibrium patterns of genetic diversity in subdivided populations. Genet Res. 1997;70:155–74. doi: 10.1017/s0016672397002954. [DOI] [PubMed] [Google Scholar]
- 46.Hu XS, He F. Background selection and population differentiation. J Theor Biol. 2005;235:207–19. doi: 10.1016/j.jtbi.2005.01.004. [DOI] [PubMed] [Google Scholar]
- 47.Santiago E, Caballero A. Variation after a selective sweep in a subdivided population. Genetics. 2005;169:475–83. doi: 10.1534/genetics.104.032813. [DOI] [PMC free article] [PubMed] [Google Scholar]
- 48.Berry A, Kreitman M. Molecular analysis of an allozyme cline: alcohol dehydrogenase in Drosophila melanogaster on the east coast of North America. Genetics. 1993;134:869–93. doi: 10.1093/genetics/134.3.869. [DOI] [PMC free article] [PubMed] [Google Scholar]
- 49.Umina PA, Weeks AR, Kearney MR, McKechnie SW, Hoffmann AA. A rapid shift in a classic clinal pattern in Drosophila reflecting climate change. Science. 2005;308:691–3. doi: 10.1126/science.1109523. [DOI] [PubMed] [Google Scholar]
- 50.Joost S, et al. A spatial analysis method (SAM) to detect candidate loci for selection: towards a landscape genomics approach to adaptation. Mol Ecol. 2007;16:3955–69. doi: 10.1111/j.1365-294X.2007.03442.x. [DOI] [PubMed] [Google Scholar]
- 51.Hancock AM, et al. Adaptations to climate in candidate genes for common metabolic disorders. PLoS Genet. 2008;4:e32. doi: 10.1371/journal.pgen.0040032. [DOI] [PMC free article] [PubMed] [Google Scholar]
- 52.Thompson EE, et al. CYP3A variation and the evolution of salt-sensitivity variants. Am J Hum Genet. 2004;75:1059–69. doi: 10.1086/426406. [DOI] [PMC free article] [PubMed] [Google Scholar]
- 53.Young JH, et al. Differential susceptibility to hypertension is due to selection during the out-of-Africa expansion. PLoS Genet. 2005;1:e82. doi: 10.1371/journal.pgen.0010082. [DOI] [PMC free article] [PubMed] [Google Scholar]
- 54.Schlotterer C. A microsatellite-based multilocus screen for the identification of local selective sweeps. Genetics. 2002;160:753–63. doi: 10.1093/genetics/160.2.753. [DOI] [PMC free article] [PubMed] [Google Scholar]
- 55.Kauer MO, Dieringer D, Schlotterer C. A microsatellite variability screen for positive selection associated with the “out of Africa” habitat expansion of Drosophila melanogaster. Genetics. 2003;165:1137–48. doi: 10.1093/genetics/165.3.1137. [DOI] [PMC free article] [PubMed] [Google Scholar]
- 56.Storz JF, Payseur BA, Nachman MW. Genome scans of DNA variability in humans reveal evidence for selective sweeps outside of Africa. Mol Biol Evol. 2004;21:1800–11. doi: 10.1093/molbev/msh192. [DOI] [PubMed] [Google Scholar]
- 57.Marshall JM, Weiss RE. A Bayesian heterogeneous analysis of variance approach to inferring recent selective sweeps. Genetics. 2006;173:2357–70. doi: 10.1534/genetics.105.053314. [DOI] [PMC free article] [PubMed] [Google Scholar]
- 58.Sabeti PC, et al. Genome-wide detection and characterization of positive selection in human populations. Nature. 2007;449:913–8. doi: 10.1038/nature06250. [DOI] [PMC free article] [PubMed] [Google Scholar]
- 59.Tang K, Thornton KR, Stoneking M. A new approach for using genome scans to detect recent positive selection in the human genome. PLoS Biol. 2007;5:e171. doi: 10.1371/journal.pbio.0050171. [DOI] [PMC free article] [PubMed] [Google Scholar]
- 60.Voight BF, Kudaravalli S, Wen X, Pritchard JK. A map of recent positive selection in the human genome. PLoS Biol. 2006;4:e72. doi: 10.1371/journal.pbio.0040072. [DOI] [PMC free article] [PubMed] [Google Scholar]
- 61.Bersaglieri T, et al. Genetic signatures of strong recent positive selection at the lactase gene. Am J Hum Genet. 2004;74:1111–20. doi: 10.1086/421051. [DOI] [PMC free article] [PubMed] [Google Scholar]
- 62.Novembre J, Galvani AP, Slatkin M. The geographic spread of the CCR5 Delta32 HIV-resistance allele. PLoS Biol. 2005;3:e339. doi: 10.1371/journal.pbio.0030339. [DOI] [PMC free article] [PubMed] [Google Scholar]
- 63.Sabeti PC, et al. The case for selection at CCR5-Delta32. PLoS Biol. 2005;3:e378. doi: 10.1371/journal.pbio.0030378. [DOI] [PMC free article] [PubMed] [Google Scholar]
- 64.Endler JA. Geographic variation, speciation, and clines. Princeton University Press; Princeton, N.J: 1977. [PubMed] [Google Scholar]
- 65.Enattah NS, et al. Identification of a variant associated with adult-type hypolactasia. Nat Genet. 2002;30:233–7. doi: 10.1038/ng826. [DOI] [PubMed] [Google Scholar]
- 66.Tishkoff SA, et al. Convergent adaptation of human lactase persistence in Africa and Europe. Nat Genet. 2007;39:31–40. doi: 10.1038/ng1946. [DOI] [PMC free article] [PubMed] [Google Scholar]
- 67.Enattah NS, et al. Independent introduction of two lactase-persistence alleles into human populations reflects different history of adaptation to milk culture. Am J Hum Genet. 2008;82:57–72. doi: 10.1016/j.ajhg.2007.09.012. [DOI] [PMC free article] [PubMed] [Google Scholar]
- 68.Norton HL, et al. Genetic evidence for the convergent evolution of light skin in Europeans and East Asians. Mol Biol Evol. 2007;24:710–22. doi: 10.1093/molbev/msl203. [DOI] [PubMed] [Google Scholar]
- 69.Cappellini MD, Fiorelli G. Glucose-6-phosphate dehydrogenase deficiency. Lancet. 2008;371:64–74. doi: 10.1016/S0140-6736(08)60073-2. [DOI] [PubMed] [Google Scholar]
- 70.Flint J, Harding RM, Boyce AJ, Clegg JB. The population genetics of the haemoglobinopathies. Baillieres Clin Haematol. 1998;11:1–51. doi: 10.1016/s0950-3536(98)80069-3. [DOI] [PubMed] [Google Scholar]
- 71.Hill AV. Molecular epidemiology of the thalassaemias (including haemoglobin E) Baillieres Clin Haematol. 1992;5:209–38. doi: 10.1016/s0950-3536(11)80042-9. [DOI] [PubMed] [Google Scholar]
- 72.Goldstein DB, Holsinger KE. Maintenance of Polygenic Variation in Spatially Structured Populations - Roles for Local Mating and Genetic Redundancy. Evolution. 1992;46:412–429. doi: 10.1111/j.1558-5646.1992.tb02048.x. [DOI] [PubMed] [Google Scholar]
- 73.Kelly JK. Geographical variation in selection, from phenotypes to molecules. American Naturalist. 2006;167:481–495. doi: 10.1086/501167. [DOI] [PubMed] [Google Scholar]
- 74.Latta RG. Differentiation of allelic frequencies at quantitative trait loci affecting locally adaptive traits. American Naturalist. 1998;151:283–292. doi: 10.1086/286119. [DOI] [PubMed] [Google Scholar]
- 75.Pickrell JK, et al. Signals of recent positive selection in a worldwide sample of human populations. Genome Res. 2009;19:826–37. doi: 10.1101/gr.087577.108. [DOI] [PMC free article] [PubMed] [Google Scholar]
- 76.Myles S, Somel M, Tang K, Kelso J, Stoneking M. Identifying genes underlying skin pigmentation differences among human populations. Human Genetics. 2007;120:613–621. doi: 10.1007/s00439-006-0256-4. [DOI] [PubMed] [Google Scholar]
- 77.Norton HL, et al. Genetic evidence for the convergent evolution of light skin in Europeans and east Asians. Molecular Biology and Evolution. 2007;24:710–722. doi: 10.1093/molbev/msl203. [DOI] [PubMed] [Google Scholar]
- 78.Przeworski M, Coop G, Wall JD. The signature of positive selection on standing genetic variation. Evolution. 2005;59:2312–23. [PubMed] [Google Scholar]
- 79.Hermisson J, Pennings PS. Soft sweeps: molecular population genetics of adaptation from standing genetic variation. Genetics. 2005;169:2335–52. doi: 10.1534/genetics.104.036947. [DOI] [PMC free article] [PubMed] [Google Scholar]
- 80.Nagylaki T, Lou Y. Evolution under multiallelic migration-selection models. Theoretical Population Biology. 2007;72:21–40. doi: 10.1016/j.tpb.2007.02.005. [DOI] [PubMed] [Google Scholar]
- 81.Prugnolle F, et al. Pathogen-driven selection and worldwide HLA class I diversity. Curr Biol. 2005;15:1022–7. doi: 10.1016/j.cub.2005.04.050. [DOI] [PubMed] [Google Scholar]
- 82.Harding RM, et al. Evidence for variable selective pressures at MC1R. Am J Hum Genet. 2000;66:1351–61. doi: 10.1086/302863. [DOI] [PMC free article] [PubMed] [Google Scholar]
- 83.Romeo S, et al. Population-based resequencing of ANGPTL4 uncovers variations that reduce triglycerides and increase HDL. Nat Genet. 2007;39:513–6. doi: 10.1038/ng1984. [DOI] [PMC free article] [PubMed] [Google Scholar]
- 84.Luca F, et al. Multiple advantageous amino acid variants in the NAT2 gene in human populations. PLoS One. 2008;3:e3136. doi: 10.1371/journal.pone.0003136. [DOI] [PMC free article] [PubMed] [Google Scholar]
- 85.Patin E, et al. Deciphering the ancient and complex evolutionary history of human arylamine N-acetyltransferase genes. Am J Hum Genet. 2006;78:423–36. doi: 10.1086/500614. [DOI] [PMC free article] [PubMed] [Google Scholar]
- 86.Perry GH, et al. Diet and the evolution of human amylase gene copy number variation. Nat Genet. 2007;39:1256–60. doi: 10.1038/ng2123. [DOI] [PMC free article] [PubMed] [Google Scholar]
- 87.Slatkin M, Wiehe T. Genetic hitch-hiking in a subdivided population. Genet Res. 1998;71:155–60. doi: 10.1017/s001667239800319x. [DOI] [PubMed] [Google Scholar]
- 88.Levene H. Genetic Equilibrium When More Than One Ecological Niche Is Available. American Naturalist. 1953;87:331–333. [Google Scholar]
- 89.Hoekstra RF, Bijlsma R, Dolman AJ. Polymorphism from Environmental Heterogeneity - Models Are Only Robust If the Heterozygote Is Close in Fitness to the Favored Homozygote in Each Environment. Genetical Research. 1985;45:299–314. doi: 10.1017/s001667230002228x. [DOI] [PubMed] [Google Scholar]
- 90.Smith JM, Hoekstra R. Polymorphism in a Varied Environment - How Robust Are the Models. Genetical Research. 1980;35:45–57. doi: 10.1017/s0016672300013926. [DOI] [PubMed] [Google Scholar]
- 91.Barton NaC, AG . In: Population Biology: Ecological and Evolutionary Viewpoints. Wohrmann KaJ, SK, editors. Springer-Verlag; Berlin: 1990. [Google Scholar]
- 92.Fisher RA. Gene Frequencies in a Cline Determined by Selection and Diffusion. Biometrics. 1950;6:353–361. [PubMed] [Google Scholar]
- 93.Slatkin M. Gene Flow and Selection in a Cline. Genetics. 1973;75:733–756. doi: 10.1093/genetics/75.4.733. [DOI] [PMC free article] [PubMed] [Google Scholar]
- 94.Slatkin M. Gene Flow and Selection in a 2-Locus System. Genetics. 1975;81:787–802. doi: 10.1093/genetics/81.4.787. [DOI] [PMC free article] [PubMed] [Google Scholar]
- 95.May RM, Endler JA, Mcmurtrie RE. Gene Frequency Clines in Presence of Selection Opposed by Gene Flow. American Naturalist. 1975;109:659–676. doi: 10.1086/283036. [DOI] [PubMed] [Google Scholar]
- 96.Nagylaki T. Conditions for Existence of Clines. Genetics. 1975;80:595–615. doi: 10.1093/genetics/80.3.595. [DOI] [PMC free article] [PubMed] [Google Scholar]
- 97.Nagylaki T. Clines with Variable Migration. Genetics. 1976;83:867–886. doi: 10.1093/genetics/83.4.867. [DOI] [PMC free article] [PubMed] [Google Scholar]
- 98.Nagylaki T. Clines with Asymmetric Migration. Genetics. 1978;88:813–827. doi: 10.1093/genetics/88.4.813. [DOI] [PMC free article] [PubMed] [Google Scholar]
- 99.Endler JA. Gene Flow and Population Differentiation. Science. 1973;179:243–250. doi: 10.1126/science.179.4070.243. [DOI] [PubMed] [Google Scholar]
- 100.Slatkin M, Maruyama T. Genetic Drift in a Cline. Genetics. 1975;81:209–222. doi: 10.1093/genetics/81.1.209. [DOI] [PMC free article] [PubMed] [Google Scholar]
- 101.Gleibermann L. Blood pressure and dietary salt in human populations. Ecol Food Nutr. 1973;2:143–156. [Google Scholar]
- 102.Beckman G, et al. Is p53 polymorphism maintained by natural selection? Hum Hered. 1994;44:266–70. doi: 10.1159/000154228. [DOI] [PubMed] [Google Scholar]
- 103.Shi H, et al. Winter temperature and UV are tightly linked to genetic changes in the p53 tumor suppressor pathway in Eastern Asia. Am J Hum Genet. 2009;84:534–41. doi: 10.1016/j.ajhg.2009.03.009. [DOI] [PMC free article] [PubMed] [Google Scholar]
- 104.Luca F, et al. Adaptive variation regulates the expression of the human SGK1 gene in response to stress. PLoS Genet. 2009;5:e1000489. doi: 10.1371/journal.pgen.1000489. [DOI] [PMC free article] [PubMed] [Google Scholar]
- 105.Teshima KM, Coop G, Przeworski M. How reliable are empirical genomic scans for selective sweeps? Genome Res. 2006;16:702–12. doi: 10.1101/gr.5105206. [DOI] [PMC free article] [PubMed] [Google Scholar]