

Abstract
Androgen receptor (AR) binds male sex steroids and mediates physiological androgen actions in target tissues. ChIP-seq analyses of AR-binding events in murine prostate, kidney and epididymis show that in vivo AR cistromes and their respective androgen-dependent transcription programs are highly tissue specific mediating distinct biological pathways. This high order of tissue specificity is achieved by the use of exclusive collaborating factors in the three androgen-responsive tissues. We find two novel collaborating factors for AR signaling in vivo—Hnf4α (hepatocyte nuclear factor 4α) in mouse kidney and AP-2α (activating enhancer binding protein 2α) in mouse epididymis—that define tissue-specific AR recruitment. In mouse prostate, FoxA1 serves for the same purpose. FoxA1, Hnf4α and AP-2α motifs are over-represented within unique AR-binding loci, and the cistromes of these factors show substantial overlap with AR-binding events distinct to each tissue type. These licensing or pioneering factors are constitutively bound to chromatin and guide AR to specific genomic loci upon hormone exposure. Collectively, liganded receptor and its DNA-response elements are required but not sufficient for establishment of tissue-specific transcription programs.
Keywords: AP-2α, AR pathway, FoxA1, Hnf4α, pioneer factors
Introduction
Androgens regulate the growth and function of reproductive tissues but also elicit physiological androgenic responses in many other tissues (Bardin & Catterall, 1981). Prostate gland is an accessory sex organ secreting alkaline fluid that constitutes 50–70% of sperm volume. Epididymis, in turn, is a tightly coiled tubule linking efferent ducts with vas deferens, and it is an organ responsible for sperm maturation (Robaire & Viger, 1995). Murine kidney is a highly androgen-responsive tissue, with a number of metabolic events being under androgenic control (Catterall et al, 1986). The effects of physiological androgens testosterone (T) and 5α-dihydrotestosterone are mediated by the androgen receptor (AR), a ligand-dependent transcription factor of the nuclear receptor superfamily. Upon ligand binding, AR translocates from the cytoplasm to the nucleus, binds to cognate response elements at regulatory regions of the target genes and drives hormone-specific transcription programs by recruiting a plethora of coregulatory proteins to the basal transcription machinery.
Precise control of gene expression is required for specific transcriptional outcomes at different stages of development and in various cell types and tissues. Several mechanisms contribute to the tissue-specific functions of nuclear receptors, including, but not limited to, steroid, receptor and coregulator levels as well as DNA methylation and histone modification patterns (Tang et al, 2011). Recent genome-wide studies of transcription factor cistromes and histone modifications have highlighted the importance of distant enhancer sites in driving the cell type-specific gene regulation (Heintzman et al, 2009; Shen et al, 2012). The mechanisms by which specific nuclear receptor recruitment onto these enhancer sites is achieved are still poorly understood, but a growing body of evidence underlies the role of pioneering or licensing factors, i.e. proteins with an intrinsic ability to bind to condensed chromatin and prime specific genomic loci for subsequent receptor binding (Zaret & Carroll, 2011).
FoxA1 is a pioneer factor for several steroid receptors, including estrogen receptor (ER), AR, and glucocorticoid receptor (GR; Augello et al, 2011; Sahu et al, 2011, 2013; Zaret & Carroll, 2011). Differential FoxA1 recruitment governs lineage-specific binding of ERα and AR (Lupien et al, 2008), and cell type- and receptor-specific binding of AR and GR to chromatin (Sahu et al, 2013). Comparison of ERα cistromes in MCF7 breast cancer and U2OS osteosarcoma cells demonstrated cell type-specific ERα recruitment and showed that FoxA1 modulates ERα function only in MCF7 cells (Krum et al, 2008). GATA-4 is shown to play pioneering role for few osteoblast-specific ERα-responsive genes in U2OS cells (Miranda-Carboni et al, 2011). GATA family members have also been identified as pioneer factors for ERα in MCF7 breast cancer cells (Eeckhoute et al, 2007) and for AR in LNCaP prostate cancer cells (Wang et al, 2007). Furthermore, progesterone receptor (PR) cistromes are distinct in breast and uterine cancer cells and differentially enriched for transcription factor cis-elements (Yin et al, 2012). These results from cancer cell lines suggest that dissimilar pioneering or licensing factors are important in specifying steroid receptor binding in different cell types, but robust genome-wide information validating this concept, especially under in vivo conditions in normal tissues, is still lacking.
Androgens exert well-known effects throughout the body, but mechanisms responsible for tissue-specific AR pathways are largely unknown. Analyses of AR cistromes in human prostate cancer cell lines have revealed some cell-type specificity and highlighted the importance of FoxA1 in determining the AR-mediated transcriptional readout (Wang et al, 2009; Massie et al, 2011; Sahu et al, 2011, 2013). Here, we have examined AR cistromes in three highly androgen-responsive murine tissues—prostate, epididymis and kidney—and show that the distribution of AR-binding events exhibits only marginal overlap among the three androgen target tissues. Importantly, we identify a distinct signature for specific collaborating transcription factors within the AR cistromes of the three tissues. The tissue-specific collaborating factors—FoxA1 in prostate, Hnf4α in kidney and AP-2α in epididymis—show extensive overlap with AR-binding events and occupy the tissue-specific sites prior to ligand-induced AR loading. Collectively, these results imply a critical role for collaborating transcription factors in determining the in vivo outcome of the AR pathway in different androgen target tissues and emphasize that FoxA1 is a prostate-specific rather than a universal pioneering factor for AR.
Results
In vivo AR cistromes in mouse prostate, kidney and epididymis
Chromatin immunoprecipitation (ChIP) was performed on three androgen-responsive murine tissues: prostate, caput epididymis and kidney. Male mice were surgically castrated and treated 4 days later with testosterone (T) or vehicle for 2 h, after which prostate and kidney were harvested. Caput epididymides were collected from intact male mice. The Fkbp5 gene is highly androgen-responsive in all three tissues, as illustrated by Fkbp5 mRNA accumulation (Fig1A). Loading of AR onto an androgen response element in intron 5 of Fkbp5 (Magee et al, 2006) was determined by direct ChIP-qPCR, and it showed >100-fold enrichment after T treatment over castrated controls in all three tissues (Fig1B). ChIP and ChIP-seq assays from murine tissues were significantly improved by inclusion of a quick nuclear isolation step using hexylene glycol-containing buffer (Isomaa et al, 1982). To define AR cistromes in the three tissues—prostate, kidney and epididymis—ChIP-seq was performed from prostate and kidney of T-treated castrated males and from epididymides of intact males together with corresponding castrated controls. Peak calling by MACS algorithm (Zhang et al, 2008) revealed 10,171 AR-binding sites (ARBs) in prostate, 14,062 in kidney and 22,598 in caput epididymis from two biological replicates (Supplementary Data S1–3; false discovery rate, FDR < 2%). Loading of AR onto chromatin of castrated mouse tissues was marginal (Fig1C). The binding patterns were highly reproducible in biological replicates, as illustrated by the ChIP-seq tracks for the Fkbp5 and Gadd45g genes (Fig1C) that are regulated by androgens in all three tissues. The genome-wide distribution pattern of ARBs is similar in all tissues, in that 38–43% of the ARBs are located in distal enhancer, 4–7% in proximal promoter region (≤ 3 kb), and 44–47% in intronic regions (Fig1D).
Figure 1.
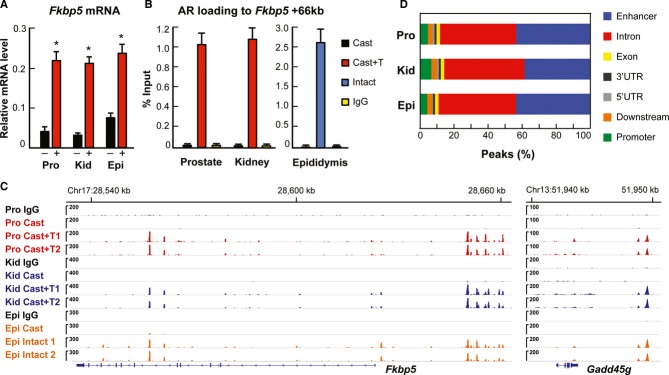
- Accumulation of Fkbp5 mRNA in prostate, kidney and epididymis of castrated mice after a 3-day T (+) or vehicle (−) treatment (mean + s.e.m., n = 5, *P < 0.05).
- AR loading onto an intronic Fkbp5 enhancer site in prostate and kidney of castrated mice after 2-h T-exposure, and in epididymis of castrated and intact male mice. Mean + s.e.m. values from four independent experiments are shown.
- AR-binding events at Fkbp5 and Gadd45g loci in castrated mice and in the presence of T in prostate, kidney and epididymis. Results from two biological replicates (1 and 2) are shown. IgG, non-specific rabbit IgG used for ChIP.
- Genome-wide distribution of ARBs in three murine tissues.
AR cistromes display high degree of tissue specificity
The AR cistromes exhibit minor to moderate overlap between prostate, epididymis and kidney, and the majority of the AR-binding events are unique to a given tissue. Only 1,615 (7–16%) of the ARBs are shared by all three tissues (Fig2A). The tag density maps of the unique and overlapping binding events mapped within ±5 kb clearly illustrate the difference in the three androgen-responsive tissues (Fig2B). Likewise, average tag density profiles exhibit dissimilarities among the different ARB groups, in that AR binding is marginal in other two tissues for unique ARBs and that shared sites show substantial AR binding in all tissues (Supplementary Fig S1). Prostate and epididymis, the two reproductive tissues, show the highest overlap in their AR-binding events (3,061 sites), kidney and epididymis exhibit an intermediate overlap profile (2,472 sites), and the lowest number of sites is shared by prostate and kidney (514 sites). Importantly, 48% of the ARBs in prostate, 67% in kidney, and 68% in epididymis are unique to each tissue, attesting to high selectivity and tissue specificity of the AR cistromes (Fig2A and B). Representative examples of visualization of tissue-specific ARBs for genes that are androgen-responsive in only one of the three tissues are shown in Fig2C–E; Defb50 in prostate, Kap in kidney and Adam7 in epididymis. Accumulation of mRNAs encoded by these genes is induced by T treatment in a fashion commensurate with the presence of tissue-specific ARBs (Fig2F–H). Altogether 60 shared and tissue-specific AR-binding sites were validated by using direct ChIP-qPCR, and they all showed excellent concordance with the ChIP-seq results. Validations for seven loci in each category are shown in Supplementary Fig S2.
Figure 2.

- A Area-proportional Venn diagram of AR cistromes in prostate, kidney and caput epididymis (two independent biological replicates, FDR < 2%).
- B Tag density maps for tissue-specific and shared ARBs. The binding events are ranked from the strongest to weakest receptor-binding event, and the unique sites are centered to the receptor binding sites in the respective tissue.
- C–E Location of ARBs in the regulatory regions of Defb50 (C), Kap (D) and Adam7 (E) genes in prostate, kidney and epididymis. Two biological replicates are shown for each tissue (1 and 2).
- F–H Accumulation of Defb50 mRNA (F), Kap mRNA (G) and Adam7 mRNA (H) in castrated males after a 3-day T (+) or vehicle (−) treatment (mean + s.e.m., n = 5, *P < 0.05).
Gene expression profiles in prostate, kidney and epididymis
Gene expression profiles were examined in prostate, caput epididymis and kidney of castrated male mice after a 3-day T exposure. With a fold-change of ≥ 1.5 (P < 0.05), we identified 589, 471, and 802 differentially expressed genes in prostate, epididymis and kidney, respectively (Supplementary Data S4). In agreement with distinct AR cistromes in the three tissues, AR transcriptomes are also highly tissue specific. Out of 342 androgen up-regulated transcripts in prostate, 269 in epididymis, and 438 in kidney, the three tissues share only nine up-regulated genes. Likewise, most of the transcripts down-regulated by androgen are unique to each tissue, and only 14 down-regulated transcripts are common to all tissues (Fig3A). Androgen-regulated and stably expressed genes were compared to AR-binding sites within ±100 kb of the transcription start sites (TSSs) of the genes. Almost 80% of the transcripts up-regulated in prostate and over 90% of those up-regulated in kidney and epididymis have at least one ARB within ±100 kb of the TSS (Fig3B). Likewise, 88%, 80% and 72% of the down-regulated transcripts in epididymis, kidney and prostate, respectively, have at least one ARB within ±100 kb of the TSS. Androgen-regulated genes—both up- and down-regulated—in all tissues could be mapped to the nearest ARBs significantly more often than stably expressed genes after exposure to T (Fig3B).
Figure 3.

- Area-proportional Venn diagrams of up-regulated and down-regulated genes in prostate, kidney and epididymis (fold change ≥ 1.5, P < 0.05).
- The presence of AR-binding events within ± 100 kb of TSSs of androgen up-regulated, down-regulated or stably expressed genes in prostate, kidney and epididymis.
- Unsupervised hierarchical clustering of androgen-regulated transcripts in prostate, kidney and epididymis.
- qRT-PCR validation of differential expression of tissue-specific and shared androgen-regulated transcripts in castrated males after a 3-day treatment with T (+) or vehicle (−). Representative transcripts belonging to eight clusters depicted in (C) are shown (mean + s.e.m., n = 5, *P < 0.05).
The majority of the transcripts are androgen-responsive only in one tissue, or only in two out of three tissues, as judged by unsupervised hierarchical clustering of the transcripts (Fig3C). Strikingly, there are transcripts that are up-regulated by androgen in one tissue but down-regulated in other tissues, highlighting the tissue specificity of the AR pathways (e.g. cluster 5 in Fig3C). Enrichment analysis of gene ontology categories using the WebGestalt (http://bioinfo.vanderbilt.edu/webgestalt/) pathway tool revealed that androgen-regulated transcripts are involved in both similar and tissue-specific biological processes. Various metabolic processes are enriched among several clusters of androgen up-regulated transcripts. In particular, metabolic processes, such as lipid and nitrogen metabolism, are strongly over-represented among the kidney-unique androgen-regulated transcripts (cluster 6 in Fig3C, Supplementary Table S1), whereas steroid metabolic process is enriched among the transcripts up-regulated in prostate and epididymis (cluster 4). Of note, androgen-induced transcripts in prostate and epididymis are over-represented for genes involved in cell cycle regulation and mitosis, highlighting the role for androgens in cellular proliferation of these tissues (cluster 2). That genes involved in cellular metabolism, but not in proliferation, are among the enriched biological processes in kidney agrees with the notion that androgen exposure leads to hypertrophy rather than hyperplasia in proximal tubule epithelial cells (Bardin & Catterall, 1981). Examples of qRT-PCR validation are shown in Fig3D for selected transcripts with tissue-specific androgen regulation in eight separate clusters of Fig3C and for transcripts that are androgen-regulated only in one tissue (Supplementary Fig S3); all results are in excellent agreement with the microarray data shown in Fig3C.
To rule out the possibility that the above conclusions are biased by the extended (3-day) androgen exposure, tissue-specific androgen-induced transcription programs were also examined at shorter time intervals, at 12 and 24 h after a single T dose to castrated male mice (Supplementary Data S4). In agreement with the results of the 3-day treatment, the three tissues show clearly distinct gene expression profiles, with only a few common genes being up- or down-regulated by androgen in all three tissues (Supplementary Fig S4A). The majority of both up- and down-regulated genes have at least one ARB within ±100 kb of the TSS, and the genes can be mapped to ARBs significantly more often than stably expressed genes at each time interval (Supplementary Fig S4B). Unsupervised hierarchical clustering illustrates that the transcription programs are tissue-specific and that androgen-regulated transcripts in each tissue—prostate, kidney and epididymis—are very similar at the three time points (Supplementary Fig S4C).
Enrichment of cis-elements among the ARBs is tissue-specific
De novo motif searches revealed a 15-bp canonical androgen response element (ARE) sequence as the top enriched cis-element within the ARBs in all three tissues. However, enrichment for other cis-regulatory elements adjacent to the AR-binding events is remarkably dissimilar between the tissues. Besides the canonical 15-bp ARE and various versions of ARE half-sites, the only significantly enriched cis-elements (P < 0.001, sorted by z-score) revealed by de novo analysis from all ARBs unique to prostate (4,915 sites) and from top 5,000 ARB sites unique to kidney and epididymis are depicted in Fig4A–C. The cis-element for FoxA1 is over-represented among the ARBs unique to prostate (Fig4A, Supplementary Table S2A), the cis-element for Hnf4α among the ARBs unique to kidney (Fig4B, Supplementary Table S2C), and the cis-element for the AP-2 family (α, β, γ) among the ARBs unique to epididymis (Fig4C, Supplementary Table S2E). Previous reports on prostate cancer cell lines indicated that FoxA1-pioneered ARBs are enriched for a composite cis-element comprising a forkhead motif and an ARE half-site (Sahu et al, 2011). Interestingly, approximately 20% of the AR binding events unique to normal mouse prostate are enriched for the same composite cis-element (Fig4A). Motif over-representation analyses using a priori information from databases agree with de novo motif analyses and confirm distinct enrichment profiles for cis-elements in different tissues (Fig4D). Cis-elements for forkhead proteins, such as FoxA1 and FoxA2, are over-represented among one-half of the prostate-unique ARBs, but are completely absent among the ARBs unique to the other two tissues. The top most significant cis-element adjacent to approximately 90% of the kidney-unique ARBs is Hnf4α; however, cis-elements for other members of nuclear receptor subfamily 2, such as RXR and COUP-TF, are also over-represented among these ARBs. Of note, the ARBs unique to epididymis show significant over-representation of cis-elements for the AP-2 family members, with AP-2α exhibiting a very high concordance (99.5% of the ARBs) and other members a somewhat lower overlap (AP-2β; 50%, and AP-2γ; 54%) with the ARBs.
Figure 4.

- A–C All significant cis-elements among the ARBs unique to prostate (A), kidney (B), and epididymis (C), as identified by de novo motif searches. The percentages indicated underneath the motif logos are calculated from the number of hits for each cis-element among the unique ARBs used in the motif search (all 4,915 unique ARBs in the case of prostate, and top 5,000 unique ARBs in the case of kidney and epididymis).
- D Motif over-representation analysis for the ARBs unique to prostate, kidney and epididymis. Analysis was performed using SeqPos using a cut-off z score of 10−10. Each block represents the presence of a cis-element adjacent to an AR-binding site, expressed as percentages and arranged in bins of 20.
- E Area-proportional Venn diagrams of AR and FoxA1 cistromes in prostate, AR and Hnf4α cistromes in kidney and AR and AP-2α cistromes in epididymis in the presence of T.
Enrichment of cis-elements among all ARBs in the three tissues was also examined to avoid a potential bias stemming from the use of top-enriched sites unique to a given tissue. The de novo motifs show clear differences between the tissues, in that FoxA1 motif is present only among the ARBs in prostate (Supplementary Table S2B), Hnf4α only among the ARBs in kidney (Supplementary Table S2D) and AP-2 only among the ARBs in epididymis (Supplementary Table S2F). Motif scanning for ARE and the cis-elements for the tissue-specific collaborating factors revealed that a full-length ARE is present in 31–56% of all ARBs, whereas an ARE half-site is found in more than 90% of the ARBs. FoxA1 cis-element is enriched among 47% of all ARBs in prostate, that of Hnf4α among 37% of all ARBs in kidney and that of AP-2α among 25% of all ARBs in epididymis (Supplementary Table S2B, D, F).
To validate the biological relevance of the tissue-specific transcription factor cis-elements identified by de novo motif analyses, we performed in vivo ChIP-seq on the three tissues with antibodies specific to their respective collaborating factors, that is, FoxA1, Hnf4α and AP-2α. We identified 18,759 FoxA1-binding sites in prostate (Supplementary Data S5), 16,539 Hnf4α-binding sites in kidney (Supplementary Data S6) and 25,246 AP-2α-binding sites in epididymis (Supplementary Data S7) in the presence of androgen (two biological replicates in each case, FDR < 2%). A strong overlap was observed between the AR cistromes and the cistromes of their respective tissue-specific collaborating factors, in that 50% of the ARBs are shared with Hnf4α-binding sites in kidney, 33% of the ARBs are shared with FoxA1-binding sites in prostate, and 25% of the ARBs are shared with AP-2α-binding sites in epididymis (Fig4E). A larger proportion of the ARBs unique to each tissue overlaps with the respective tissue-specific collaborating factor as compared to the ARBs shared between different tissues (Supplementary Fig S5).
Tissue-specific pioneering factors guide AR binding in prostate, kidney and epididymis
FoxA1, Hnf4α and AP-2α bind to chromatin in a tissue-specific fashion, in that < 10 peaks were found for Hnf4α in prostate and epididymis or for FoxA1 in kidney and epididymis. Tag density maps generated within a ±5 kb window around the ARBs in each tissue clearly illustrate that there is no FoxA1 binding in the near vicinity of ARBs in kidney and epididymis, and no Hnf4α binding adjacent to the ARBs in prostate and epididymis (Fig5A–C). Even though AP-2α ChIP-seq revealed 1,423 and 20,932 binding events in prostate and kidney, respectively (Supplementary Data S8 and S9), the tag density maps show only modest enrichment of AP-2α-binding events adjacent to the ARBs in these tissues, and the average tag profiles show substantially fewer AP-2α sequencing reads at prostate and kidney ARBs compared to those of FoxA1 and Hnf4α, respectively (Supplementary Fig S6A). Indeed, only 273 AP-2α-binding sites overlap with ARBs in prostate, whereas in kidney, approximately 15% of the ARBs are shared with AP-2α (Supplementary Fig S6B), a number considerably lower than that for Hnf4α. A proportion of the ARBs in kidney (8%) is shared by both Hnf4α and AP-2α (Supplementary Fig S6B). It is possible that AP-2α binding at these shared sites plays a role in AR function, as the average tag profiles of AP-2α binding at the 181 and 1,184 ARBs in prostate and kidney, respectively, are higher than those of FoxA1 and Hnf4α at the same sites (Supplementary Fig S6C).
Figure 5.

- A–C Tag density maps showing AR, FoxA1, Hnf4α and AP-2α binding events centered within a ± 5 kb window of AR-binding sites. In prostate (A), the binding events are ranked from the strongest to weakest on the basis of FoxA1 sites. AR, FoxA1, Hnf4α and AP-2α binding events and H3K4me1 and H3K27ac histone marks at the Hhatl locus of prostate chromatin. In kidney (B), the binding events are ranked from the strongest to weakest on the basis of Hnf4α sites. AR, FoxA1, Hnf4α and AP-2α binding events and H3K4me1 and H3K27ac histone marks on renal chromatin at the Serpinf2 locus. In epididymis (C), the binding events are ranked from the strongest to weakest on the basis of AP-2α sites. Binding events of AR, FoxA1, Hnf4α and AP-2α and H3K4me1 and H3K27ac histone marks on epididymal chromatin at the Cad locus.
- D Average tag density profiles for H3K4me1 and H3K27ac histone marks at ARBs shared with FoxA1 and at AR only sites in prostate, at ARBs shared with Hnf4α and at AR only sites in kidney, and at ARBs shared with AP-2α and at AR only sites in epididymis.
The tissue-specific collaborating factors are capable of binding to chromatin prior to AR loading, as ChIP-seq identified 32, 718 FoxA1-binding events in prostate (Supplementary Data S10), 7,517 Hnf4α-binding events in kidney (Supplementary Data S11) and 22,604 AP-2α-binding events in epididymis (Supplementary Data S12; FDR < 2%) of castrated male mice. Tag density map of the ChIP-seq reads from prostate revealed similar intensity for FoxA1 in the castrated and T-treated conditions, whereas AR binding in the absence of T was negligible (Fig5A). Likewise, Hnf4α binds to chromatin in kidney (Fig5B) and AP-2α in epididymis (Fig5C) prior to the T treatment-induced AR loading. Representative examples of ChIP-seq tracks to visualize the binding events at enhancers of AR-regulated gene are shown in Fig5A–C to demonstrate that these tissue-specific transcription factors–FoxA1 in prostate, Hnf4α in kidney, and AP-2α in epididymis—indeed precede AR in chromatin binding, supporting the notion that they serve as tissue-specific pioneering or licensing factors for the receptor. ChIP-qPCR validations of tissue-specific pioneering factor binding in castrated and T-treated mice at AR-binding sites that are unique to each tissue are shown in Supplementary Fig S7A. More than 80% of the FoxA1-binding events in prostate are same under castrated and T-treated conditions, approximately 90% of the Hnf4α-binding events and approximately 70% of the AP-2α-binding events are the same under the two conditions (Supplementary Fig S7B). Interestingly, binding of a respective collaborating factor enhances AR loading, as judged by average tag density numbers where ARBs shared with collaborating factors are higher than those devoid of a collaborating factor (Supplementary Fig S8A). AR recruitment, in turn, stabilizes collaborating factor binding to chromatin, as seen from average tag density profiles for FoxA1, Hnf4α and AP-2α binding in the absence and the presence of T (Supplementary Fig S8B). Of note, expression of FoxA1 or Hnf4α genes is not regulated by androgens, as FoxA1 and Hnf4α mRNA levels are similar in castrated and T-treated mice (Supplementary Fig S9). However, expression of AP-2α and AP-2β is under androgen control in caput epididymis, suggesting an additional layer of regulation in AR action (Supplementary Fig S9).
ChIP-seq with antibodies against two histone modifications associated to open chromatin and active enhancers, H3K4me1 and H3K27ac (Barski et al, 2007; Heintzman et al, 2007), revealed that about one-half (47–60%) of all ARBs in prostate, kidney and epididymis overlap with these chromatin marks in the respective tissues (Supplementary Fig S10). About two-thirds (60–74%) of ARBs that are shared with AR and the tissue-specific collaborating factors—FoxA1 in prostate, Hnf4α in kidney and AP-2α in epididymis—overlap with H3K4me1 and H3K27ac marks (Supplementary Fig S10). Importantly, the average tag density for both H3K4me1 and H3K27ac is higher for the ARBs shared with tissue-specific collaborating factors than for the AR only sites in each tissue (Fig5D), implying that the shared sites are located within active chromatin regions. Examples of AR-binding events in the proximity of androgen up-regulated genes also show that both active histone marks are enriched around the sites containing ARBs and the respective collaborating factor binding events (Fig5A–C).
Most of the AR-binding sites are tissue-specific, even for the genes that are up-regulated by androgen in all three tissues. Importantly, AR binding to tissue-specific enhancers is guided in these situations by distinct tissue-specific collaborating factors. For example, in the case of Nans encoding a common up-regulated transcript, AR occupies different enhancers in the three tissues, showing remarkable co-occupancy with FoxA1 in prostate, Hnf4α in kidney and AP-2α in epididymis, respectively (Fig6A). Similarly, tissue-specific collaborating factors guide AR binding onto Cyp2b10 enhancers in prostate and kidney but not in epididymis (Fig6B), onto Pgap2 enhancers in prostate and epididymis but not in kidney (Fig6C), and onto Acox3 enhancers in kidney and epididymis but not in prostate (Fig6D), correlating with the respective tissue-specific mRNA accumulation profiles for each gene. However, for some genes, such as Mfsd2a, AR binding occurs independently of the above collaborating factors in all three tissues (Supplementary Fig S11A), implying that other factors are involved. At a small fraction of binding sites, AR co-localizes with both AP-2α and Hnf4α in kidney and AP-2α and FoxA1 in prostate, as shown for the androgen-responsive Creld2, where AR utilizes the same enhancer element in all three tissue types (Supplementary Fig S11B).
Figure 6.

- A–D Levels of encoded mRNAs together with ChIP-seq tracks on AR, FoxA1, Hnf4α and AP-2α binding events in prostate, kidney and epididymis for Nans (A), Cyp2b10 (B), Pgap2 (C) and Acox3 (D). For transcript expression, the levels are shown after a 3-day T (+) or vehicle (–) administration (mean + s.e.m., n = 5, *P < 0.05). For the binding events, ChIP-seq tracks in the presence of T are shown.
Loss of tissue-specific collaborating factors depletes AR binding to loci shared with these factors
Pioneering function of FoxA1 for AR is well established in prostate cancer cell lines (Sahu et al, 2011), and our results on mouse prostate support this notion. To examine whether AP-2α depletion influences AR binding, an immortalized epithelial cell line (mE-Cap28) established from caput epididymis of transgenic GPX5-Tag1 mice (Sipilä et al, 2004) was utilized. These cells were exposed to siRNA specific to AP-2α mRNA resulting in approximately 80% reduction in AP-2α mRNA and protein levels at 72 h after transfection (Fig7A). Of note, AR protein level is not affected by AP-2α depletion (Fig7A). Direct ChIP-qPCR assay for ARBs shared by AR and AP-2α in murine epididymal tissue show that, in mE-Cap28 cells, T-induced AR binding to these sites upon AP-2α depletion is significantly reduced as compared to those in parental, non-targeting siRNA-treated control cells (Fig7B).
Figure 7.
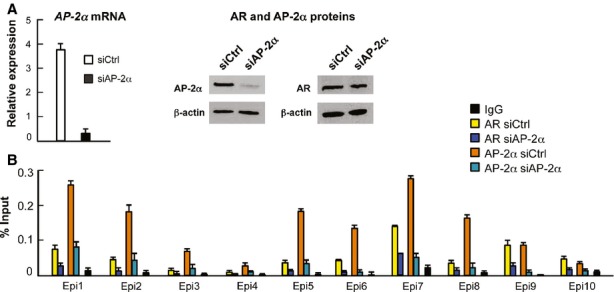
- AP-2α mRNA and protein, and AR protein level in parental cells (siCtrl), and in cells transfected with siRNA targeting AP-2α mRNA (siAP-2α).
- ChIP-qPCR analyses of AR and AP-2α loading onto chromatin in parental and AP-2α-depleted mE-Cap28 cells at sites shared by AR and AP-2α in murine epididymal tissue in vivo (mean + s.e.m., n = 3).
To study consequences of Hnf4α depletion in murine renal cells, we established primary cultures of epithelial cells from proximal tubules of murine kidneys. These cells represent their tissue of origin in that they express the Ar gene; however, they do not express Hnf4α (Supplementary Fig S12A–B). The same applies to MRPTEpiCells, a commercially available primary epithelial cell line from murine proximal tubules (Supplementary Fig S12A). Since the primary cells are devoid of Hnf4α, we assessed AR binding to sites that are bound by both AR and Hnf4α in murine renal tissue in vivo, and compared them to ARBs independent of Hnf4α in vivo. Importantly, AR is incapable of binding to shared AR–Hnf4α sites in the primary proximal tubule cells, whereas the AR sites independent of Hnf4α in vivo are occupied by AR in the primary cells (Supplementary Fig S12C).
Expression of the collaborating factors in prostate, kidney and epididymis
The relative abundance of mRNAs encoding the three collaborating factors indicates that Hnf4α is expressed exclusively in kidney and FoxA1 in prostate (Supplementary Fig S9). mRNAs encoding the AP-2 family members α and β are expressed in all three tissues, whereas the remaining family member γ, δ and ε show no expression (Supplementary Fig S9). It was important to verify that FoxA1 in prostate, Hnf4α in kidney and AP-2α in epididymis are expressed in the same cell types as AR. The luminal epithelial cells in prostate, proximal tubular epithelial cells in kidney and principal cells in caput epididymis show strong AR antigen staining (Fig8). Strong FoxA1 staining is seen only in prostate epithelial cells, and it is absent or very weak in kidney and epididymis, supporting the notion that FoxA1 is a prostate-specific AR modulator in vivo. That the proximal tubular epithelial cells in kidney are AR-positive is in accordance with results showing androgen-induced Odc mRNA accumulation in these particular cell types (Crozat et al, 1992). Importantly, the same cell types in kidney stain strongly for Hnf4α antigen, which is not detectable in prostate or epididymis. Strong staining for AP-2α is present in the epididymis in the same cell types as AR, giving credence to its licensing role in AR function.
Figure 8.
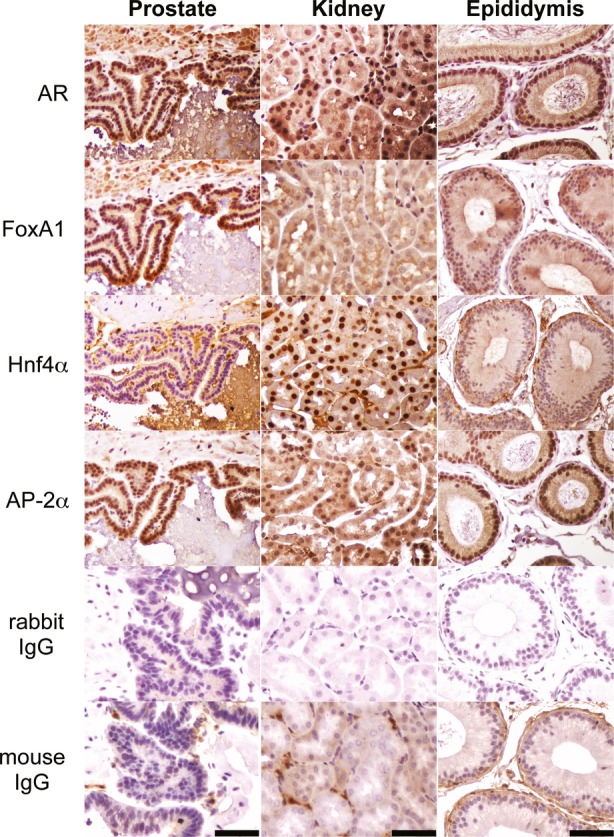
Expression of tissue-specific collaborating factors in prostate, kidney and epididymis
Immunohistochemical staining for FoxA1, Hnf4α and AP-2α antigens in prostate, kidney and epididymis. Negative controls stained with non-specific rabbit and mouse IgGs are also shown. The bar corresponds to 50 μm.
Discussion
Transcriptional regulation by steroid receptors is a well-coordinated sequential process that involves cognate ligand binding to the receptor, specific receptor–chromatin interactions, and interplay with coregulatory proteins and basal transcription machinery. Gene expression profiles and transcription factor cistromes have mostly been studied in various cancer cell lines or single tissues. Tissue-specific action of androgens have previously been examined using conditional AR knock-out models (reviewed by De Gendt & Verhoeven, 2012) and reporter mice with an androgen-inducible luciferase construct (Pihlajamaa et al, 2011). Here, we report detailed analyses of AR cistromes and transcriptomes in multiple tissue types, along with delineation of requisite collaborating factors. Androgen signaling in three murine tissues—prostate, epididymis, and kidney—involves the use of distinct AR-binding events that drive tissue-specific transcription programs. The AR cistromes show only a modest overlap in these tissues, and most AR-binding events are specific for a given tissue and preceded by chromatin binding of distinct collaborating factors. Importantly, there is no AR binding to chromatin under androgen-deprived conditions. Collectively, our results indicate that the steroid, the receptor and the cis-element are necessary but not sufficient for specific AR pathways but tissue-specific collaborating transcription factors are required to guide AR to the appropriate chromosomal locations, in order to initiate the AR pathway that is typical of a given tissue or developmental stage.
FoxA1 has been shown to modulate AR function in prostate cancer cell lines in multiple ways. It determines cell-line and receptor-specific binding events and governs AR and GR binding not only by pioneering receptor loading but also by occluding genomic loci from receptor binding (Lupien et al, 2008; Sahu et al, 2011, 2013). Other transcription factors suggested to pioneer AR function in cell lines include GATA-2 and ETS family members (Wang et al, 2007; Chng et al, 2012). A recent report on AR cistromes in human castration resistant prostate cancer tissues identified also cis-elements other than FoxA1 being overrepresented adjacent to the ARBs, possibly owing to a heterogeneous nature of the specimens (Sharma et al, 2013). Our current results in normal mouse prostate showing forkhead motif as the most significantly over-represented cis-element, and FoxA1 co-occupancy at one-third of prostate ARBs, implies that FoxA1 is an AR pioneer also in normal prostate. This notion agrees with the result that, despite the presence of AR, several prostate-specific androgen-regulated markers are not expressed in FoxA1 null epithelial cells of prostatic rudiments grown under renal capsules of nude male mice (Gao et al, 2005). However, it is important to emphasize that FoxA1 is by no means a universal pioneering or licensing factor of the AR pathway, in that other DNA-binding collaborating factors—Hnf4α and AP-2α—are required to guide AR to bind to proper chromatin loci in other tissues, such as kidney and epididymis.
Hnf4α is a constitutively active nuclear receptor with a major regulatory role in the development and function of liver (Hwang-Verslues & Sladek, 2010). It was recently shown that Hnf4α binding is required for subsequent small heterodimer partner (SHP) binding, and the lack of Hnf4α in liver-specific Hnf4α knock-out mice shows reduction in the activating modifications in the histone tails, i.e. H3K4 trimethylation (Kir et al, 2012). Genome-wide Hnf4α binding sites in mouse liver have linked Hnf4α to farnesoid X receptor (Fxr) function and demonstrated that Hnf4α and Fxr bind to shared sites on chromatin and interact in a Fxr-activation-dependent manner (Thomas et al, 2013). Hnf4α is expressed in human and rodent kidney (Harries et al, 2009), and it has been shown to affect gene expression in proximal tubules during kidney development (Gallegos et al, 2012). Our present work provides a novel link for Hnf4α to steroid receptors, implying a pioneering role for it in the AR pathway specifically in kidney. Interestingly, Hnf4α deficiency has more prominent effects on gene expression in the liver of male than female mice (Holloway et al, 2008), suggesting that Hnf4α also affects AR signaling in liver.
A previous study on the Lcn5 promoter in mouse epididymis showed that FoxA2 alters AR-dependent Lcn5 expression, especially in the caudal segment of the epididymis (Yu et al, 2006). However, forkhead cis-elements are not enriched in the AR cistrome of caput epididymis, suggesting that FoxA2 is not an important modulator of the AR pathway in this segment of epididymis. We found the number of FoxA1-binding events being minimal in caput epididymis, which agrees with the fact that FoxA1 is not expressed in mouse epididymis (Yu et al, 2005; this work). Importantly, cis-elements for AP-2 family members are significantly over-represented adjacent to the ARBs in caput epididymis. Transcription factors of the AP-2 family are expressed in various tissue types, and the five members in mammals—AP-2α–AP-2ε—possess non-redundant roles during development (Eckert et al, 2005). Recently, AP-2γ was identified as a collaborating factor for ERα in MCF7 breast cancer cells (Tan et al, 2011). The AP-2α cis-element has almost a perfect concordance with the ARBs in epididymis, suggesting that AP-2α is required for AR function. Indeed, one-fourth of the ARBs in epididymis are bound by AP-2α prior to AR binding, lending credence to a regulatory role for AP-2α in tissue-specific AR function. Previous study by Hu et al (2010) showed occupancy of both AP-2α and AP-2β at a few epididymal ARBs; thus, the role of AP-2β in AR binding in a genome-wide scale remains elusive. AP-2α is expressed in all three tissues examined in this work. However, the AP-2α cistrome overlaps only with a minor subset of AR-binding events in prostate and kidney. Previously, co-occupancy of ERα with both AP-2γ and FoxA1 was reported at specific sites in breast cancer cells (Tan et al, 2011). Despite a relatively high number of genomic AP-2α binding sites in mouse kidney, the overlap between AP-2α and AR cistromes is marginal, reinforcing the role of Hnf4α as the main collaborator for AR function in kidney.
In conclusion, the present study identifies tissue-specific licensing or pioneering factors for AR function; FoxA1 in prostate, Hnf4α in kidney and AP-2α in epididymis. The cistrome and transcriptome analyses are commensurate with the expression of these collaborating factors. Since the three collaborating factors occupy only a part of the AR-binding sites in their respective tissues, additional DNA-binding transcription factors are likely to be required in each tissue to prime chromatin for recruitment of liganded AR and subsequent modulation of the AR pathway in a tissue-specific manner. It remains to be established whether the tissue-specific collaborating factors recognize similar epigenetic marks or employ different mechanisms to read the genetic information. Our study provides novel insights into tissue-specific gene transcription and indicates that a liganded steroid receptor, AR in this case, and its response element on chromatin are required, but not sufficient, for a specific transcriptional outcome in a given tissue.
Materials and Methods
Mice and hormone treatments
All the experiments were carried out using 8–12-week-old male ICR mice. T was injected subcutaneously 4 days after surgical castration (1 mg of T/mouse in 0.1 ml mineral oil, corresponding to 30 μg of T/g of body weight), control group received only vehicle. For ChIP assays, prostates and kidneys were harvested 2 h after a single T or vehicle injection, and caput epididymides were collected from intact or castrated male mice. For mRNA isolation and gene expression profiling, prostates, kidneys and caput epididymides were harvested from castrated males 12 or 24 h after a single T or vehicle injection or after a 3-day treatment with T or vehicle. All the experiments were performed according to the guidelines for animal experiments at the University of Helsinki and under license from appropriate Finnish Review Board for animal experiments.
Cell culture
mE-Cap28 epithelial cell line (Sipilä et al, 2004) was a kind gift from Dr Petra Sipilä (University of Helsinki, Finland). The cells were cultured in Dulbecco's Modified Eagle Medium (DMEM; Gibco) in the presence of 10% fetal bovine serum (FBS). Primary cells from murine renal cortex were established essentially as described previously (Asadi et al, 1994). In short, kidney cortices were harvested in ice-cold Hank's balanced salt solution, minced with scalpel and treated with collagenase I from Clostridium histolyticum in the presence of 0.5% BSA (Fraction V) for 45 min at room temperature. Tubule suspension was filtered through wire mesh and centrifuged 2 min at 60 g. The pellet was washed with and resuspended in the growth medium consisting of 1:1 DMEM/F-12 (Gibco) supplemented with 0.015 M NaHCO3, 0.1 mM Na-pyruvate, 2.5 mM NaCl, 5 μg/ml bovine insulin, 5 μg/ml human transferrin, 50 nM hydrocortisone, 1.2 ng/ml epidermal growth factor and 10% charcoal-stripped FBS, and tubules were allowed to sediment by gravity for 10 min. The supernatant was removed, and the sediment was resuspended and allowed to sediment for 10 min. Sedimentation was repeated four times, and the final sediment was plated on 100-mm culture dish (Sarstedt). The presence of tubules in the final sediment was confirmed by microscopic evaluation. Commercially available proximal tubule epithelial cells (MRPTEpiCells) were from ScienCell Research Laboratories.
siRNA transfection
For siRNA transfections, mE-Cap28 cells were seeded in DMEM containing 10% charcoal-stripped FBS, and 70–80% confluent cells were transfected with siRNA SMARTpools targeting AP-2α mRNA or non-targeting control (ON-TARGETplus, Dharmacon, Thermo Scientific) with Dharmafect-1 transfection reagent according to the manufacturer's instructions. T treatment (100 nM) for 2 h was performed at 72 h after transfection. The siRNA sequences are shown in Supplementary Table S3.
Chromatin immunoprecipitation (ChIP)
ChIP assays on mE-Cap28 cells and primary renal proximal tubule cells were performed after a 2-h T (100 nM) or vehicle exposure as previously described (Sahu et al, 2011) and ChIP assays from tissues were performed essentially with same protocol with some modifications for tissue specimens. In short, after a 2-h T treatment, the tissues were freshly harvested, minced with a scalpel and cross-linked with 1% formaldehyde for 20 min at room temperature. Cross-linking was stopped by using 0.125 M glycine for 5 min at room temperature, followed by two washes with ice-cold phosphate-buffered saline. The cross-linked tissues were homogenized in hexylene glycol buffer [1 M hexylene glycol, 0.1 mM MgCl2, 5 mM EGTA, 1 mM PIPES, 2 mM dithiothreitol, and 1× complete protease inhibitor set (Roche)] using Ultra Turrax (Ika, Staufen, Germany) and the homogenate was filtered through nylon net (20 μm; Isomaa et al, 1982). The filtered homogenate was centrifuged to isolate crude nuclear fraction, and the pellet was resuspended in RIPA buffer. Chromatin was sonicated to yield fragments of 200–500 bp in size using micro-tip sonicator (Misonix Inc., Farmingdale, NY, USA). To produce one 500-μl chromatin sample, one prostate, two kidneys or caput epididymides from six animals were used, yielding in 2.5–10 mg total protein and 50–150 μg DNA (Supplementary Table S4). One-fifth of the chromatin samples was used for a single IP reaction. Antibodies conjugated to magnetic Dynabeads (Invitrogen, Carlsbad, CA, USA) were incubated at 4°C with sonicated chromatin overnight, followed by five washes in LiCl wash buffer and overnight reversal of cross-linking at 65°C. Immunoprecipitated DNA was purified using Qiaquick PCR purification kit (Qiagen GmbH, Hilden, Germany) and eluted in 100 μl of elution buffer. The antibodies used for the ChIP experiments were: AR (Karvonen et al, 1997; Kang et al, 2004), FoxA1 (ab23738, Abcam, Cambridge, UK), HNF4α (ab41898, Abcam), AP-2α (ab52222, Abcam), H3K4me1 (ab8895, Abcam), H3K27ac (ab4729, Abcam), normal rabbit IgG (sc-2027, Santa Cruz, Dallas, TX, USA), normal mouse IgG (sc-2025, Santa Cruz). In ChIP-qPCR, immunoprecipitated and input DNA was amplified using SYBR Green Mastermix (Roche Diagnostics, Indianapolis, IN, USA) and specific primers (Supplementary Table S5) and the results shown as percentage of input values.
ChIP-sequencing
Immunoprecipitated DNA samples were processed for library preparation according to Illumina's instructions as described previously (Sahu et al, 2011), by pooling three to four immunoprecipitates for each library (Supplementary Table S4). In brief, the DNA samples were blunt-ended and ligated to sequencing adapters. Adapter-ligated DNA fragments (size range, 150–300 bp) were excised from agarose gel and purified with QIAquick Gel Extraction kit (Qiagen). Isolated DNA was amplified by PCR (20 cycles), and the purified DNA library was sequenced using Genome Analyzer II (Illumina, Inc., San Diego, CA, USA) at Biomedicum Functional Genomics core facility. ChIP-seq reads were filtered using the Illumina chastity filter during the base-calling process and Bowtie was used to align the reads to reference mouse genome (mm9), without any mismatches. ChIP-seq experiments were performed in biological duplicates, and only reproducible peaks were used for further analyses. The number of unique ChIP-seq reads for each sample is provided in Supplementary Table S6.
Bioinformatic analysis
The peak calling was performed using the MACS algorithm (Zhang et al, 2008). The overlap analysis, CEAS analysis, genome-wide correlation, motif analysis and tag density maps were performed using Cistrome: an integrative platform for transcription regulation studies (Liu et al, 2011). De novo and motif enrichment analyses for top-enriched 5,000 ARBs unique to each tissue were performed using SeqPos motif tool version 1.0.0 with the following parameters: width of region to be scanned, 600 bp; P-value < 0.001; max output hits, 0 (all motifs that fit to P-value cut-off are included), and the results were sorted on the basis of z-score. De novo motifs were identified by using TOMTOM motif comparison tool in MEME Suite (Gupta et al, 2007). De novo analysis and motif scanning for all ARBs in each tissue were carried out with Find Motif algorithm in HOMER analysis suite with following parameters: region size, 600 bp; motif length: 8, 15, and 20 bp (Heinz et al, 2010). Data visualization was carried out using Integrative Genomics Viewer (Robinson et al, 2011).
RNA isolation and gene expression profiling
Tissues were harvested from castrated males 12 and 24 h after single T or vehicle injection and after a 3-day T or vehicle treatment and stored in RNALater (Qiagen). Total RNA was isolated from the tissues using RNeasy Mini kit (Qiagen). RNA from three independent biological replicates was hybridized to Illumina Mouse-6 v2 Expression BeadChips at the Biomedicum Functional Genomics core facility. Data analysis was performed using Anduril software (Ovaska et al, 2010) and Genomic region operation kit (Ovaska et al, 2013) together with “R” software (http://www.r-project.org/) and Bioconductor “lumi” package (http://www.bioconductor.org). Raw intensity values were normalized independently between arrays for each sample using quantile normalization. The median values of sample replicates were used to calculate differentially expressed genes between T- and vehicle-treated groups with cut-off values of fold-change ≥ 1.5 and a P-value < 0.05 (Student's t-test). Unsupervised hierarchical clustering and heat maps were generated using Cluster and TreeView (Eisen et al, 1998).
ChIP-seq and gene expression data have been deposited in the Gene Expression Omnibus database with accession number GSE47194.
Quantitative RT-PCR
cDNA was produced from 1.5 μg of total RNA with Superscript III First-Strand Synthesis System with random hexamers (Invitrogen). qPCR was carried out in 20 μl with SYBR Green Mastermix (Roche) and specific primers (Supplementary Table S5). The results were calculated with LightCycler 480 Software (Roche) using standard curve and normalized to levels of 18S rRNA. Statistical significance of differences in expression between T- and vehicle-treated groups was calculated with Student's t-test (P < 0.05).
Immunoblotting
Fifty μg of total protein from kidney or caput epididymis tissue and from mE-Cap28 and primary kidney cells was resolved on 10% SDS-PAGE (BioRad). Immunoblot analyses were performed using anti-AR (Karvonen et al, 1997; Kang et al, 2004), anti-AP-2α (ab52222, Abcam), anti-Hnf4α (ab41898, Abcam), and anti-β-actin (sc-47778, Santa Cruz) antibodies.
Immunohistochemistry
Prostate, kidney and caput epididymis tissues were collected from intact male mice and fixed in 4% paraformaldehyde at 4°C overnight, dehydrated and embedded in paraffin. Five-μm sections were dewaxed with xylene, rehydrated, and treated with 2% hydrogen peroxide for 15 min to block the endogenous peroxidase activity. For antigen retrieval, the slides were boiled in 10 mM sodium citrate (pH 6.0). The blocking was performed in 1% bovine serum albumin and normal goat or horse serum (Vector Laboratories, Burlingame, CA, USA), and incubation with primary antibodies for AR (Karvonen et al, 1997; Kang et al, 2004), FOXA1 (ab23738, Abcam), HNF4α (ab41898, Abcam), AP-2α (ab52222, Abcam), normal rabbit IgG (sc-2027, Santa Cruz Biotechnology), normal mouse IgG (sc-2025, Santa Cruz Biotechnology) was carried out at a 1:200 dilution at 4°C overnight. Biotinylated anti-rabbit and anti-mouse IgG secondary antibodies (Vector Laboratories) were used at a 1:200 dilution, and the immune complexes were visualized using the Vectastain Elite ABC and DAB substrate kits (Vector Laboratories). Counterstaining was carried out using Mayer's hemalum solution (Merck, Darmstadt, Germany). The slides were dehydrated and mounted using Permount (Fisher Chemicals, Fair Lawn, NJ).
Acknowledgments
We thank Saija Kotola for the technical help. This work was supported by Academy of Finland, Sigrid Jusélius Foundation, Finnish Cancer Foundations, Biocentrum Helsinki, ERANET SysBio+ (Synergy), Helsinki University Central Hospital, European Union (contract No. LSHM-CT-2005-018652), and Helsinki Biomedical Graduate Program.
Author contributions
The overall study was conceived and designed by PP, BS and OAJ. The experiments were performed by PP and BS. PP, BS, LL, VA and SH analyzed the data. PP, BS and OAJ wrote the paper with contributions from other authors.
Conflict of interest
The authors declare that they have no conflict of interest.
Supporting Information
Supplementary Figure S1
Supplementary Figure S2
Supplementary Figure S3
Supplementary Figure S4
Supplementary Figure S5
Supplementary Figure S6
Supplementary Figure S7
Supplementary Figure S8
Supplementary Figure S9
Supplementary Figure S10
Supplementary Figure S11
Supplementary Figure S12
Supplementary Table S1
Supplementary Table S2
Supplementary Table S3-S4
Supplementary Table S5
Supplementary Table S6
Supplementary Data S1-S3
Supplementary Data S4
Supplementary Data S5-S12
Review Process File
Source Data for Figure 7
References
- Asadi FK, Dimaculangan DD, Berger FG. Androgen regulation of gene expression in primary epithelial cells of the mouse kidney. Endocrinology. 1994;134:1179–1187. doi: 10.1210/endo.134.3.8119157. [DOI] [PubMed] [Google Scholar]
- Augello MA, Hickey TE, Knudsen KE. FOXA1: master of steroid receptor function in cancer. EMBO J. 2011;30:3885–3894. doi: 10.1038/emboj.2011.340. [DOI] [PMC free article] [PubMed] [Google Scholar]
- Bardin CW, Catterall JF. Testosterone: a major determinant of extragenital sexual dimorphism. Science. 1981;211:1285–1294. doi: 10.1126/science.7010603. [DOI] [PubMed] [Google Scholar]
- Barski A, Cuddapah S, Cui K, Roh TY, Scones DE, Wang Z, Wei G, Chepelev I, Zhao K. High-resolution profiling of histone methylations in the human genome. Cell. 2007;129:823–837. doi: 10.1016/j.cell.2007.05.009. [DOI] [PubMed] [Google Scholar]
- Catterall JF, Kontula KK, Watson CS, Seppanen PJ, Funkenstein B, Melanitou E, Hickok NJ, Bardin CW, Jänne OA. Regulation of gene expression by androgens in murine kidney. Recent Progr Horm Res. 1986;42:71–109. doi: 10.1016/b978-0-12-571142-5.50006-9. [DOI] [PubMed] [Google Scholar]
- Chng KR, Chang CW, Tan SK, Yang C, Hong SZ, Sng NY, Cheung E. A transcriptional repressor co-regulatory network governing androgen response in prostate cancers. EMBO J. 2012;31:2810–2823. doi: 10.1038/emboj.2012.112. [DOI] [PMC free article] [PubMed] [Google Scholar]
- Crozat A, Palvimo JJ, Julkunen M, Jänne OA. Comparison of androgen regulation of ornithine decarboxylase and S-adenosylmethionine decarboxylase gene expression in rodent kidney and accessory sex organs. Endocrinology. 1992;130:1131–1144. doi: 10.1210/endo.130.3.1537280. [DOI] [PubMed] [Google Scholar]
- De Gendt K, Verhoeven G. Tissue- and cell-specific functions of the androgen receptor revealed through conditional knockout models in mice. Mol Cell Endocrinol. 2012;352:13–25. doi: 10.1016/j.mce.2011.08.008. [DOI] [PubMed] [Google Scholar]
- Eckert D, Buhl S, Weber S, Jager R, Schorle H. The AP-2 family of transcription factors. Genome Biol. 2005;6:246. doi: 10.1186/gb-2005-6-13-246. [DOI] [PMC free article] [PubMed] [Google Scholar]
- Eeckhoute J, Keeton EK, Lupien M, Krum SA, Carroll JS, Brown M. Positive cross-regulatory loop ties GATA-3 to estrogen receptor α expression in breast cancer. Cancer Res. 2007;67:6477–6483. doi: 10.1158/0008-5472.CAN-07-0746. [DOI] [PubMed] [Google Scholar]
- Eisen MB, Spellman PT, Brown PO, Botstein D. Cluster analysis and display of genome-wide expression patterns. Proc Natl Acad Sci USA. 1998;95:14863–14868. doi: 10.1073/pnas.95.25.14863. [DOI] [PMC free article] [PubMed] [Google Scholar]
- Gallegos TF, Martovetsky G, Kouznetsova V, Bush KT, Nigam SK. Organic anion and cation SLC22 “drug” transporter (Oat1, Oat3, and Oct1) regulation during development and maturation of the kidney proximal tubule. PLoS ONE. 2012;7:e40796. doi: 10.1371/journal.pone.0040796. [DOI] [PMC free article] [PubMed] [Google Scholar]
- Gao N, Ishii K, Mirosevich J, Kuwajima S, Oppenheimer SR, Roberts RL, Jiang M, Yu X, Shappell SB, Caprioli RM, Stoffer M, Hayward SW, Matusik RJ. Forkhead box A1 regulates prostate ductal morphogenesis and promotes epithelial cell maturation. Development. 2005;132:3431–3443. doi: 10.1242/dev.01917. [DOI] [PubMed] [Google Scholar]
- Gupta S, Stamatoyannopolous JA, Bailey T, Noble WS. Quantifying similarity between motifs. Genome Biol. 2007;8:R24. doi: 10.1186/gb-2007-8-2-r24. [DOI] [PMC free article] [PubMed] [Google Scholar]
- Harries LW, Brown JE, Gloyn AL. Species-specific differences in the expression of the HNF1A, HNF1B and HNF4A genes. PLoS ONE. 2009;4:e7855. doi: 10.1371/journal.pone.0007855. [DOI] [PMC free article] [PubMed] [Google Scholar]
- Heintzman ND, Hon GC, Hawkins RD, Kheradpour P, Stark A, Harp LF, Ye Z, Lee LK, Stuart RK, Ching CW, Ching KA, Antosiewicz-Bourget JE, Liu H, Zhang X, Green RD, Lobanenkov VV, Stewart R, Thomson JA, Crawford GE, Kellis M, et al. Histone modifications at human enhancers reflect global cell-type-specific gene expression. Nature. 2009;459:108–112. doi: 10.1038/nature07829. [DOI] [PMC free article] [PubMed] [Google Scholar]
- Heintzman ND, Stuart RK, Hon G, Fu Y, Ching CW, Hawkins RD, Barrera LO, Van Calcar S, Qu C, Ching KA, Wang W, Weng Z, Green RD, Crawford GE, Ren B. Distinct and predictive chromatin signatures of transcriptional promoters and enhancers in the human genome. Nat Genet. 2007;39:311–318. doi: 10.1038/ng1966. [DOI] [PubMed] [Google Scholar]
- Heinz S, Benner C, Spann N, Bertolino E, Lin YC, Lasio P, Cheng JX, Murre C, Singh H, Glass CK. Simple combinations of lineage-determining transcription factors prime cis-regulatory elements required for macrophage and B cell identities. Mol Cell. 2010;38:576–589. doi: 10.1016/j.molcel.2010.05.004. [DOI] [PMC free article] [PubMed] [Google Scholar]
- Holloway MG, Miles GD, Dombkowski AA, Waxman DJ. Liver-specific hepatocyte nuclear factor-4α deficiency: greater impact on gene expression in male than in female mouse liver. Mol Endocrinol. 2008;22:1274–1286. doi: 10.1210/me.2007-0564. [DOI] [PMC free article] [PubMed] [Google Scholar]
- Hu S, Yao G, Guan X, Ni Z, Ma W, Wilson EM, French FS, Liu Q, Zhang Y. Research resource: genome-wide mapping of in vivo androgen receptor binding sites in mouse epididymis. Mol Endocrinol. 2010;24:2392–2405. doi: 10.1210/me.2010-0226. [DOI] [PMC free article] [PubMed] [Google Scholar]
- Hwang-Verslues WW, Sladek FM. HNF4α–role in drug metabolism and potential drug target? Curr Opin Pharmacol. 2010;10:698–705. doi: 10.1016/j.coph.2010.08.010. [DOI] [PMC free article] [PubMed] [Google Scholar]
- Isomaa V, Pajunen AE, Bardin CW, Jänne OA. Nuclear androgen receptors in the mouse kidney: validation of a new assay. Endocrinology. 1982;111:833–843. doi: 10.1210/endo-111-3-833. [DOI] [PubMed] [Google Scholar]
- Kang Z, Jänne OA, Palvimo JJ. Coregulator recruitment and histone modifications in transcriptional regulation by the androgen receptor. Mol Endocrinol. 2004;18:2633–2648. doi: 10.1210/me.2004-0245. [DOI] [PubMed] [Google Scholar]
- Karvonen U, Kallio PJ, Jänne OA, Palvimo JJ. Interaction of androgen receptors with androgen response element in intact cells. Roles of amino- and carboxyl-terminal regions and the ligand. J Biol Chem. 1997;271:15973–15979. doi: 10.1074/jbc.272.25.15973. [DOI] [PubMed] [Google Scholar]
- Kir S, Zhang Y, Gerard RD, Kliewer SA, Mangelsdorf DJ. Nuclear receptors HNF4α and LRH-1 cooperate in regulating Cyp7a1 in vivo. J Biol Chem. 2012;287:41334–41341. doi: 10.1074/jbc.M112.421834. [DOI] [PMC free article] [PubMed] [Google Scholar]
- Krum SA, Miranda-Carboni GA, Lupien M, Eeckhoute J, Carroll JS, Brown M. Unique ERα cistromes control cell type-specific gene regulation. Mol Endocrinol. 2008;22:2393–2406. doi: 10.1210/me.2008-0100. [DOI] [PMC free article] [PubMed] [Google Scholar]
- Liu T, Ortiz JA, Taing L, Meyer CA, Lee B, Zhang Y, Shin H, Wong SS, Ma J, Lei Y, Pape UJ, Poidinger M, Chen Y, Yeung K, Brown M, Turpaz Y, Liu XS. Cistrome: an integrative platform for transcriptional regulation studies. Genome Biol. 2011;12:R83. doi: 10.1186/gb-2011-12-8-r83. [DOI] [PMC free article] [PubMed] [Google Scholar]
- Lupien M, Eeckhoute J, Meyer CA, Wang Q, Zhang Y, Li W, Carroll JS, Liu XS, Brown M. FoxA1 translates epigenetic signatures into enhancer-driven lineage-specific transcription. Cell. 2008;132:958–970. doi: 10.1016/j.cell.2008.01.018. [DOI] [PMC free article] [PubMed] [Google Scholar]
- Magee JA, Chang LW, Stormo GD, Milbrandt J. Direct, androgen receptor-mediated regulation of the FKBP5 gene via a distal enhancer element. Endocrinology. 2006;147:590–598. doi: 10.1210/en.2005-1001. [DOI] [PubMed] [Google Scholar]
- Massie CE, Lynch A, Ramos-Montoya A, Boren J, Stark R, Fazli L, Warren A, Scott H, Madhu B, Sharma N, Bon H, Zecchini V, Smith DM, Denicola GM, Mathews N, Osborne M, Hadfield J, Macarthur S, Adryan B, Lyons SK, et al. The androgen receptor fuels prostate cancer by regulating central metabolism and biosynthesis. EMBO J. 2011;30:2719–2733. doi: 10.1038/emboj.2011.158. [DOI] [PMC free article] [PubMed] [Google Scholar]
- Miranda-Carboni GA, Guemes M, Bailey S, Anaya E, Corselli M, Peault B, Krum SA. GATA4 regulates estrogen receptor-α-mediated osteoblast transcription. Mol Endocrinol. 2011;25:1126–1136. doi: 10.1210/me.2010-0463. [DOI] [PMC free article] [PubMed] [Google Scholar]
- Ovaska K, Laakso M, Haapa-Paananen S, Louhimo R, Chen P, Aittomäki V, Valo E, Nunez-Fontarnau J, Rantanen V, Karinen S, Nousiainen K, Lahesmaa-Korpinen AM, Miettinen M, Saarinen L, Kohonen P, Wu J, Westermarck J, Hautaniemi S. Large-scale data integration framework provides a comprehensive view on glioblastoma multiforme. Genome Med. 2010;2:65. doi: 10.1186/gm186. [DOI] [PMC free article] [PubMed] [Google Scholar]
- Ovaska K, Lyly L, Sahu B, Jänne OA, Hautaniemi S. Genomic region operation kit for flexible processing of deep sequencing data. IEEE/ACM Trans Comput Biol Bioinform. 2013;10:200–206. doi: 10.1109/TCBB.2012.170. [DOI] [PubMed] [Google Scholar]
- Pihlajamaa P, Zhang FP, Saarinen L, Mikkonen L, Hautaniemi S, Jänne OA. The phytoestrogen genistein is a tissue-specific androgen receptor modulator. Endocrinology. 2011;152:4395–4405. doi: 10.1210/en.2011-0221. [DOI] [PubMed] [Google Scholar]
- Robaire B, Viger RS. Regulation of epididymal epithelial cell functions. Biol Reprod. 1995;52:226–236. doi: 10.1095/biolreprod52.2.226. [DOI] [PubMed] [Google Scholar]
- Robinson JT, Thorvaldsdottir H, Winckler W, Guttman M, Lander ES, Getz G, Mesirov JP. Integrative genomics viewer. Nat Biotechnol. 2011;29:24–26. doi: 10.1038/nbt.1754. [DOI] [PMC free article] [PubMed] [Google Scholar]
- Sahu B, Laakso M, Ovaska K, Mirtti T, Lundin J, Rannikko A, Sankila A, Turunen JP, Lundin M, Konsti J, Vesterinen T, Nordling S, Kallioniemi O, Hautaniemi S, Jänne OA. Dual role of FoxA1 in androgen receptor binding to chromatin, androgen signalling and prostate cancer. EMBO J. 2011;30:3962–3976. doi: 10.1038/emboj.2011.328. [DOI] [PMC free article] [PubMed] [Google Scholar]
- Sahu B, Laakso M, Pihlajamaa P, Ovaska K, Sinielnikov I, Hautaniemi S, Jänne OA. FoxA1 specifies unique androgen and glucocorticoid receptor binding events in prostate cancer cells. Cancer Res. 2013;73:1570–1580. doi: 10.1158/0008-5472.CAN-12-2350. [DOI] [PubMed] [Google Scholar]
- Sharma NL, Massie CE, Ramos-Montoya A, Zecchini V, Scott HE, Lamb AD, MacArthur S, Stark R, Warren AY, Mills IG, Neal DE. The androgen receptor induces a distinct transcriptional program in castration-resistant prostate cancer in man. Cancer Cell. 2013;23:35–47. doi: 10.1016/j.ccr.2012.11.010. [DOI] [PubMed] [Google Scholar]
- Shen Y, Yue F, McCleary DF, Ye Z, Edsall L, Kuan S, Wagner U, Dixon J, Lee L, Lobanenkov VV, Ren B. A map of the cis-regulatory sequences in the mouse genome. Nature. 2012;488:116–120. doi: 10.1038/nature11243. [DOI] [PMC free article] [PubMed] [Google Scholar]
- Sipilä P, Shariatmadari R, Huhtaniemi IT, Poutanen M. Immortalization of epididymal epithelium in transgenic mice expressing simian virus 40 T antigen: characterization of cell lines and regulation of the polyoma enhancer activator 3. Endocrinology. 2004;145:437–446. doi: 10.1210/en.2003-0831. [DOI] [PubMed] [Google Scholar]
- Tan SK, Lin ZH, Chang CW, Varang V, Chng KR, Pan YF, Yong EL, Sung WK, Cheung E. AP-2γ regulates oestrogen receptor-mediated long-range chromatin interaction and gene transcription. EMBO J. 2011;30:2569–2581. doi: 10.1038/emboj.2011.151. [DOI] [PMC free article] [PubMed] [Google Scholar]
- Tang Q, Chen Y, Meyer C, Geistlinger T, Lupien M, Wang Q, Liu T, Zhang Y, Brown M, Liu XS. A comprehensive view of nuclear receptor cancer cistromes. Cancer Res. 2011;71:6940–6947. doi: 10.1158/0008-5472.CAN-11-2091. [DOI] [PMC free article] [PubMed] [Google Scholar]
- Thomas AM, Hart SN, Li G, Lu H, Fang Y, Fang J, Zhong XB, Guo GL. Hepatocyte nuclear factor 4 alpha and farnesoid X receptor co-regulates gene transcription in mouse livers on a genome-wide scale. Pharm Res. 2013;30:2188–2198. doi: 10.1007/s11095-013-1006-7. [DOI] [PMC free article] [PubMed] [Google Scholar]
- Wang Q, Li W, Liu XS, Carroll JS, Jänne OA, Keeton EK, Chinnaiyan AM, Pienta KJ, Brown M. A hierarchical network of transcription factors governs androgen receptor-dependent prostate cancer growth. Mol Cell. 2007;27:380–392. doi: 10.1016/j.molcel.2007.05.041. [DOI] [PMC free article] [PubMed] [Google Scholar]
- Wang Q, Li W, Zhang Y, Yuan X, Xu K, Yu J, Chen Z, Beroukhim R, Wang H, Lupien M, Wu T, Regan MM, Meyer CA, Carroll JS, Manrai AK, Jänne OA, Balk SP, Mehra R, Han B, Chinnaiyan AM, et al. Androgen receptor regulates a distinct transcription program in androgen-independent prostate cancer. Cell. 2009;138:245–256. doi: 10.1016/j.cell.2009.04.056. [DOI] [PMC free article] [PubMed] [Google Scholar]
- Yin P, Roqueiro D, Huang L, Owen JK, Xie A, Navarro A, Monsivais D, Coon JS, Kim JJ, Dai Y, Bulun SE. Genome-wide progesterone receptor binding: cell type-specific and shared mechanisms in T47D breast cancer cells and primary leiomyoma cells. PLoS ONE. 2012;7:e29021. doi: 10.1371/journal.pone.0029021. [DOI] [PMC free article] [PubMed] [Google Scholar]
- Yu X, Gupta A, Wang Y, Suzuki K, Mirosevich J, Orgebin-Crist MC, Matusik RJ. Foxa1 and Foxa2 interact with the androgen receptor to regulate prostate and epididymal genes differentially. Ann N Y Acad Sci. 2005;1061:77–93. doi: 10.1196/annals.1336.009. [DOI] [PubMed] [Google Scholar]
- Yu X, Suzuki K, Wang Y, Gupta A, Jin R, Orgebin-Crist MC, Matusik R. The role of forkhead box A2 to restrict androgen-regulated gene expression of lipocalin 5 in the mouse epididymis. Mol Endocrinol. 2006;20:2418–2431. doi: 10.1210/me.2006-0008. [DOI] [PubMed] [Google Scholar]
- Zaret KS, Carroll JS. Pioneer transcription factors: establishing competence for gene expression. Genes Dev. 2011;25:2227–2241. doi: 10.1101/gad.176826.111. [DOI] [PMC free article] [PubMed] [Google Scholar]
- Zhang Y, Liu T, Meyer CA, Eeckhoute J, Johnson DS, Bernstein BE, Nusbaum C, Myers RM, Brown M, Li W, Liu XS. Model-based analysis of ChIP-seq (MACS) Genome Biol. 2008;9:R137. doi: 10.1186/gb-2008-9-9-r137. [DOI] [PMC free article] [PubMed] [Google Scholar]
Associated Data
This section collects any data citations, data availability statements, or supplementary materials included in this article.
Supplementary Materials
Supplementary Figure S1
Supplementary Figure S2
Supplementary Figure S3
Supplementary Figure S4
Supplementary Figure S5
Supplementary Figure S6
Supplementary Figure S7
Supplementary Figure S8
Supplementary Figure S9
Supplementary Figure S10
Supplementary Figure S11
Supplementary Figure S12
Supplementary Table S1
Supplementary Table S2
Supplementary Table S3-S4
Supplementary Table S5
Supplementary Table S6
Supplementary Data S1-S3
Supplementary Data S4
Supplementary Data S5-S12
Review Process File
Source Data for Figure 7