

Abstract
Synonymous codons encode the same amino acid, but differ in other biophysical properties. The evolutionary selection of codons whose properties are optimal for a cell generates the phenomenon of codon bias. Although recent studies have shown strong effects of codon usage changes on protein expression levels and cellular physiology, no translational control mechanism is known that links codon usage to protein expression levels. Here, we demonstrate a novel translational control mechanism that responds to the speed of ribosome movement immediately after the start codon. High initiation rates are only possible if start codons are liberated sufficiently fast, thus accounting for the observation that fast codons are overrepresented in highly expressed proteins. In contrast, slow codons lead to slow liberation of the start codon by initiating ribosomes, thereby interfering with efficient translation initiation. Codon usage thus evolved as a means to optimise translation on individual mRNAs, as well as global optimisation of ribosome availability.
Keywords: codon usage, ribosome speed, translation, translation elongation, translational control
See related article http://dx.doi.org/10.1002/embj.201387388
Introduction
The genetic code is degenerate, in the sense that most amino acids are encoded by multiple synonymous codons. Although synonymous codons have the same coding potential, most organisms display patterns of preferential use where some codons within a synonymous group are used more frequently than others (reviewed in Hershberg & Petrov, 2008). Highly expressed genes typically prefer codons decoded by abundant tRNA species (Ikemura, 1982; Powell & Moriyama, 1997), whereas weakly expressed genes either show no preferences, or in some cases preferentially contain codons decoded by rare tRNA species (Neafsey & Galagan, 2007).
The use of codons that are overrepresented in naturally highly expressed proteins in recombinant sequences usually improves expression levels compared to random codon usage, particularly in eukaryotic hosts (Kotula & Curtis, 1991; Nagata et al, 1999; Outchkourov et al, 2002; Sinclair & Choy, 2002; Slimko & Lester, 2003; Yadava & Ockenhouse, 2003; Mossadegh et al, 2004; Hu et al, 2006; Lombardi et al, 2009; Mirzaei et al, 2010; Jeon et al, 2012). The situation may be distinct in prokaryotes, where codon usage was found to have only minor effects on gene expression levels (Kudla et al, 2009). Moreover, codon usage controls protein levels also in naturally evolved eukaryotic genes. This has been studied in detail in vivo for the Drosophila alcohol dehydrogenase gene where it was shown that introduction of non-preferred codons reduced expression levels (Carlini & Stephan, 2003), whereas an increase in the content of preferred codons increased expression levels (Hense et al, 2010). More recently, several examples emerged where codon usage controls fungal gene expression levels with phenotypic consequences (Chan et al, 2012; Kemp et al, 2013; Zhou et al, 2013).
Importantly, despite the many clear examples for connections between codon usage and protein expression levels there is currently no clear understanding of the mechanism by which codon usage exerts translational control. In the relevant literature, it is frequently assumed that there is a connection between ribosome speed and protein expression levels. However, this assumption is not compatible with the prevailing view in the translational control field that protein expression levels are mostly controlled by translation initiation factor activity (Aitken & Lorsch, 2012). This latter view assumes that translation elongation is fast compared to translation initiation, and ribosome recruitment to mRNAs is therefore not restricted by the speed with which initiating ribosomes free up the initiation region (McCarthy, 1998). More recent experimental evidence has suggested that elongation factor levels are more limiting than initiation factor levels, which would be difficult to reconcile with this view (Firczuk et al, 2013).
The speed with which a codon is decoded depends on the abundance ratio of cognate, charged tRNAs over near-and non-cognate species (Fluitt et al, 2007; Zouridis & Hatzimanikatis, 2008; Chu et al, 2011). Near-and non-cognate tRNAs differ in that non-cognates leave the ribosome rapidly following the initial tRNA:A-site contact, whereas near-cognate tRNAs can undergo some of the accommodation reactions also undergone by cognates, and therefore remain bound to the A-site for much longer periods of time than non-cognates. The near-cognate:cognate ratio determines how many tRNAs need to be rejected, and how long the rejection process takes, before the first cognate tRNA enters the ribosomal A-site. This ratio varies over almost two orders of magnitude in yeast (Chu et al, 2011), and on this basis the mean decoding time for different codons should vary over a similar range. Evolutionarily preferred codons are decoded by abundant tRNAs (Ikemura, 1982) which generally show favourable near cognate:cognate ratios (Chu et al, 2011), and in sum ribosomes are thus predicted to move faster on sequences with a higher proportion of preferred codons. In addition to codon usage, ribosome speed is further modulated by ribosome binding factors (Liu et al, 2013; Shalgi et al, 2013) and by nascent peptide:ribosome interactions (Charneski & Hurst, 2013).
Although the biochemical evidence suggests that there should be differences in decoding speed between codons, recent deep sequencing studies did not detect ribosomal dwell time differences between codons (Ingolia et al, 2011; Qian et al, 2012). However, some codon dependent pausing was detected in other studies (Stadler & Fire, 2011) and it was suggested that biases in the data may obscure further signals (Dana & Tuller, 2012). Moreover, there is independent in vivo evidence supporting the notion that the speed of codon-decoding underlies the physical effects of codon usage on gene expression. This includes our recent demonstration that computational models which interpret ribosome movement based on assumptions of fully charged tRNAs and resulting strong speed differences between codons (Chu et al, 2012) are good predictors of protein expression level changes that result from both manipulation of the codon usage on an mRNA, and from manipulation of the tRNA content of the cell (Chu et al, 2011).
In the present study, we identify a novel translational control mechanism by which codon-dependent ribosome movement around the start codon restricts attainable translation initiation rates. On efficiently initiating mRNAs, ribosomes must move away from the start codon sufficiently quickly to allow fast re-binding of the mRNA to subsequent ribosomes. In contrast, slow ribosome movement around the start codon suffices to restrict translation initiation rates even if all other features of that mRNA would sustain high initiation rates. This translational control mechanism is a major determinant of expression levels in recombinant protein expression constructs, as well as determining expression levels of endogenous eukaryotic genes.
Results
Codon decoding time is a partial predictor of protein expression levels
Although studies on recombinant protein expression provide a substantial body of evidence causally connecting codon usage to protein expression levels, these studies were performed in expression systems with widely differing genetic backgrounds and are thus difficult to compare quantitatively. We therefore generated controlled codon usage variants for initially three different protein coding sequences. These sequences comprised firefly luciferase derivatives identical to those used in an earlier study (Chu et al, 2011), but with a deletion of the last three amino acids of the native sequence which maintains full activity while abrogating the peroxisomal location of this protein (Gould et al, 1989; Sala-Newby & Campbell, 1994); Renilla luciferase; and the yeast HIS3 gene. In the following, we refer to the corresponding proteins as CFLuc (for cytoplasmic firefly luciferase), RLuc and His3, respectively.
We used biochemical knowledge on the reactions of an elongation cycle (Fluitt et al, 2007) and on near-cognate:cognate tRNA ratios in yeast (Chu et al, 2011) to calculate the mean decoding time for each codon, assuming that all tRNAs are fully charged. We then systematically replaced codons with the slowest possible codon coding for the same amino acid to generate ‘min’ variants of the three reporter genes (minCFLuc, minRLuc and minHIS3). Similarly, we systematically replaced codons with the fastest possible codon coding for the same amino acid to generate ‘max’ variants (maxCFLuc, maxRLuc and maxHIS3). The naturally occurring or commonly used versions of these genes, which contain mixtures of fast and slow codons, were denoted as standard or ‘sta’ variants.
All sequences except maxRLuc, which for unknown reasons could not be successfully synthesised, were generated as synthetic DNA constructs, and expressed in yeast using identical transcriptional control elements and UTRs from a single copy vector (Sikorski & Hieter, 1989; Fig 1A). For all constructs tested, the different codon variants resulted in varying expression levels (Fig 1B–D), where the level of expression always followed the predicted speed of decoding of the full open reading frame (ORF) in terms of rank order.
Figure 1.
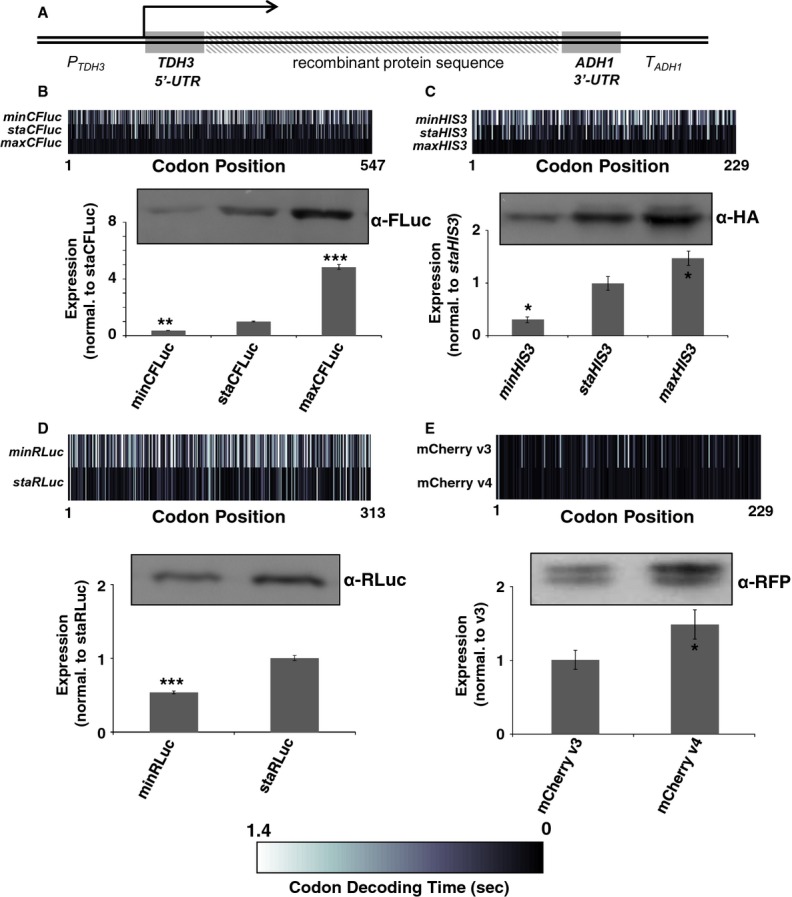
A Illustration of the basic expression construct. The CFLuc, RLuc and HIS3 codon variants were expressed from centromeric (single copy) plasmids using identical transcriptional and translational control sequences, consisting of the transcriptional promoter and 5′-UTR of the yeast TDH3 (glyceraldehyde-3-phosphate dehydrogenase, GPD) gene, and of the 3′-UTR and transcriptional terminator sequences of the yeast ADH1 (alcohol dehydrogenase) gene. Both TDH3 and ADH1 are highly expressed endogenous yeast genes. mCherry variants were expressed using promoter sequences as described (Qian et al, 2012).
B–E For each of the recombinant proteins heat-maps are shown to illustrate the calculated decoding speed of the different constructs used (a colour bar is shown at the bottom of the figure for reference), a typical western blot derived from identical numbers of lysed cells, and bar graphs indicating mean and standard error of the mean of expression levels from multiple independent transformants. The bar graphs indicate luciferase activity measurements (n = 8, panels B and D), western blots (n = 3, panel C), or fluorescence measurements (n = 6, panel E). Statistical significance of the expression difference to the relevant reference construct is indicated by asterisks (*, P ≤ 0.05; **, P < 0.01; ***, P < 0.001). Statistical tests used to determine significance are: (B) Tukey's test following one-way ANOVA (F = 597.88, P = 0); (C) Tukey's Test following one-way ANOVA (F = 27.56, P = 0.0009); (D) t-test (P = 1.1 × 10⁻⁸); (E) t-test (P = 0.050). All DNA sequences used in this figure are detailed in the supplemental material.
Source data are available online for this figure.
The behaviour of our codon variants is consistent with very recent findings on variants of a fluorescent protein, mCherry, expressed in baker's yeast. This also varied in expression levels strictly with the content of optimal codons (Qian et al, 2012). However, this study reported only very small increases when comparing expression from a sequence with mostly optimal codons to a sequence with only optimal codons, with <5% increase between the variants. In order to compare the results from Qian et al to our data, we re-cloned their expression variants 3 and 4 from the originally used multi copy plasmid to the same single copy plasmid used for expression of our codon variants. With these constructs, we observed difference in expression of >50% both in western blots using anti-RFP antibodies, and in fluorescence measurements (Fig 1E), comparable to the behaviour of our other codon variants. We conclude that the plasmid copy number variations that are frequently observed for high copy plasmids in yeast (Moriya et al, 2006) may have partially distorted expression level variations in the original mCherry constructs.
To establish the mechanism by which codon usage affected protein expression in our constructs, we analysed the correlation between expression levels and various secondary parameters affected by codon usage including calculated speed of decoding for the entire ORF, GC content, predicted mRNA secondary structure, and experimentally determined mRNA steady-state levels (Fig 2). Of these parameters, the calculated speed of decoding shows the strongest correlation, followed by mRNA steady-state levels and, more weakly, GC content. This is consistent with a model where codon usage affects protein expression levels via multiple routes, one of which is the speed of mRNA decoding.
Figure 2.
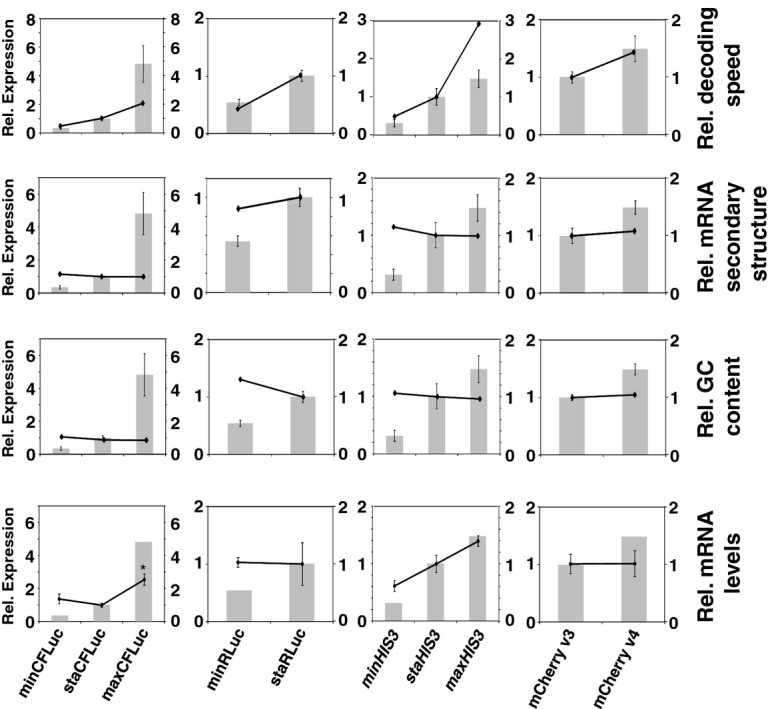
Protein expression levels (grey bars) are the same as in Figure 1. The black line graphs indicate calculated decoding speed (top row), calculated mRNA secondary structure content (second row), calculated GC content (third row), or experimentally determined mRNA expression levels (bottom row). The calculated secondary structure content was defined in terms of ΔG and then normalised to each sta construct. Higher values indicate more stable secondary structure. For the experimentally determined mRNA levels, the standard error of the mean is indicated by error bars and significant difference to the reference construct is indicated by asterisks (*, P < 0.05). Three biologically independent samples were analysed for each construct. Statistical tests used to determine significance are: CFLuc variants, Tukey's Test following one-way ANOVA (F = 8.94, P = 0.016); RLuc variants, t-test (P = 0.95); HIS3 variants, Tukey's Test following one-way ANOVA (F = 11.36, P = 0.009); mCherry variants, t-test (P = 0.97).
Translation initiation and elongation rates in yeast
The wide-spread observation of quantitative translational control by codon usage, which we also observe in the results presented here, suggests that translation elongation rates can somehow affect translation initiation rates. A possible explanation for such an effect is that physiological translation elongation rates may be closer to initiation rates than generally assumed, in which case higher rates of elongation away from the start codon would be required to allow higher initiation rates. This would transfer control over protein expression levels from translation initiation factor-mediated ribosome affinity to translation elongation.
In order to estimate whether translation initiation and elongation rates in vivo are in a range where such control could be exerted, we used a curated dataset comprising genome-wide protein levels, protein turnover, and mRNA levels (von der Haar, 2008) to calculate apparent in vivo translation initiation rates. Analyses of these data revealed that yeast mRNAs recruit a ribosome on average every 0.8 s, with a range for different transcripts from 0.2 to 5 s (excluding the top and bottom deciles to disregard extreme outliers). Since our current biochemical models predict that elongation cycles take between 0.05 and 1.4 s to complete depending on the codon, and since a ribosome covers about 10 codons (Wolin & Walter, 1988), start codon clearance intervals for yeast mRNAs range from 0.5 to 14 s. Thus, according to the best available biochemical knowledge, physiological initiation and elongation rates are in a range where the inherent ribosome affinity of an mRNA and the start codon clearance rate of elongating ribosomes could both independently limit achievable ribosome recruitment rates.
Codon usage affects protein expression levels only at high translation initiation rates
The analyses presented above indicate that translation initiation and elongation rates in vivo are in a range were either could independently limit translation on individual mRNAs, depending on their specific initiation-and elongation rate constants. We explored this issue for the CFLuc expression constructs presented above, using a recently developed computational program for modelling eukaryotic translation (Chu et al, 2012). This program stochastically simulates translation initiation, tRNA sampling, peptidyl transfer, translocation and translation termination, using rules that recapitulate our biochemical knowledge of translation. Our implementation of these rules implicitly assumes high levels of tRNA availability, and that different codons are decoded with significantly different speeds. If the input rules are correct, the simulation should thus recapitulate the behaviour of translation in vivo.
When we simulated translation of CFLuc variants with varying translation initiation efficiencies, the simulations predicted that alterations to the ratio between elongation rates and initiation rates for these constructs would lead to a handover of control from initiation to elongation and vice versa (Fig 3A). These modelling results led us to propose the following model of codon usage-dependent gene expression.
Figure 3.
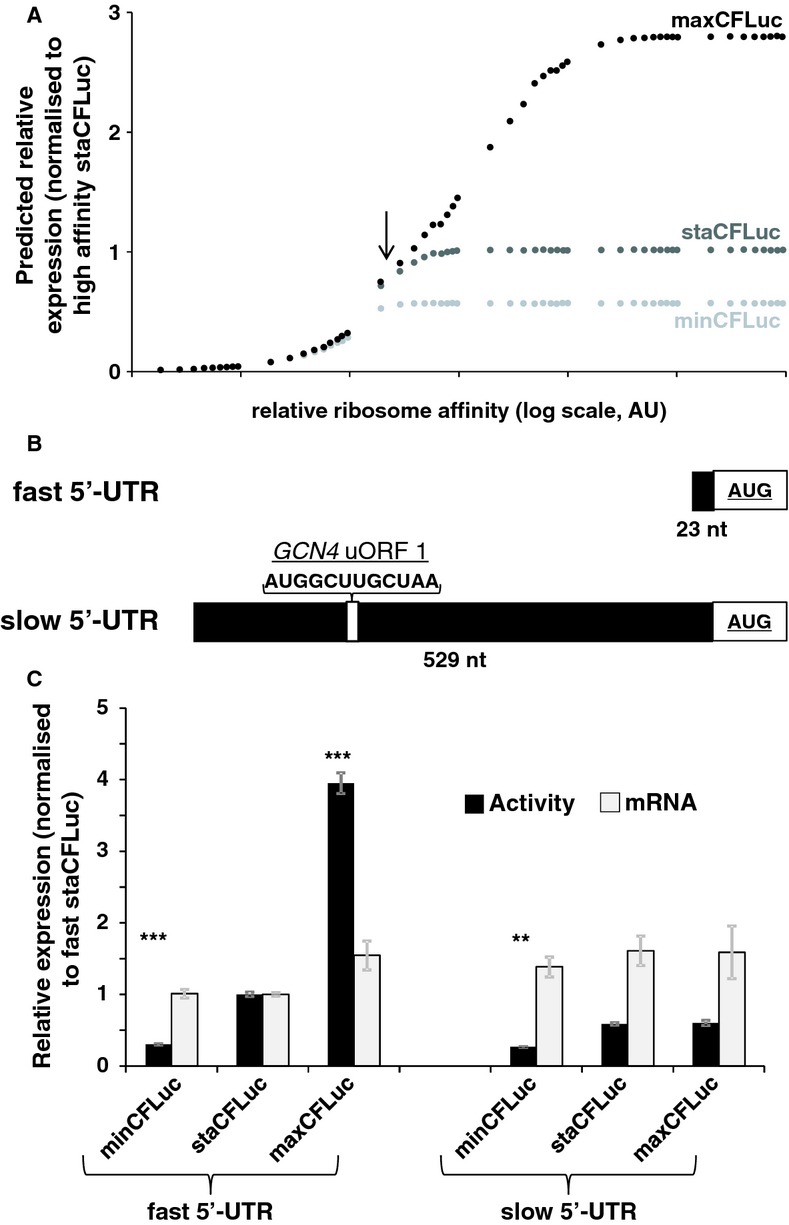
- The result of computer simulations predicting protein expression as a function of ribosome affinity. Individual data points indicate the results of a single simulation run. Significant effects of codon usage on expression levels are predicted only at high ribosome affinity, whereas at low ribosome affinity all constructs are expressed at identical levels. The arrow indicates the point where expression levels are most similar to experimental data with the ‘slow’ 5′-UTR in (C).
- Experimental manipulation of ribosome affinity on CFLuc expression constructs. Compared to the original construct used to generate data in Figure 1, a ‘slow initiation’ derivative was constructed by introducing a uORF-containing 5′-UTR (derived from the naturally uORF-containing yeast GCN4 leader sequence, from which uORFs 2–4 were deleted).
- Comparison of experimentally observed expression levels of fast and slow initiating CFLuc expression constructs, based on observed luciferase activity (black bars) and mRNA levels (light bars). maxCFLuc and staCFLuc express indistinguishable levels of luciferase activity when ribosome arrival rates at the CFLuc start codon are reduced. In contrast, minCFLuc remains lower than the other two variants, and this sequence is not affected by introduction of the slow leader sequence. Error bars denote the standard error of the mean. Statistical significance was tested using Tukey's Test following one-way ANOVA, with parameters for luciferase activity: n = 8, F = 507, P = 0; for mRNA: n = 3, F = 0.74, P = 0.62. Statistical significance of the difference to the comparable sta construct from each group (i.e. comparing fast vs fast and slow vs slow) is indicated by asterisks: *, P < 0.05; **, P < 0.01; ***, P < 0.001, no asterisk, P > 0.05.
If an mRNA binds efficiently to ribosomes, fast elongation away from the start codon is required to ensure that every initiating ribosome encounters a free start site. On the other hand, if elongation is so slow that initiating ribosomes find the start codon still blocked by the preceding ribosome, some form of interference with the translation initiation process of the second ribosome must take place. We do not know in detail what happens in such a case, possibilities include that the second ribosome remains bound to the mRNA until the start codon is accessible and then completes the initiation pathway, or that it falls of the mRNA, giving another ribosome the chance to attempt initiation. In any case, in this interference situation the frequency with which ribosomes access the start codon depends strictly on the rate of liberation of this codon. Importantly, such an interference situation can be removed either by increasing elongation speed, or by decreasing the frequency with which ribosomes attempt to access the start codon, until initiating ribosomes have a high probability of finding the latter free of occupation by the preceding ribosome.
The first part of this prediction, that increasing elongation speed via codon usage should improve protein production on mRNAs which bind efficiently to ribosomes, is borne out by the codon dependence of the constructs shown in Fig 1, as well as the many reported instances of improved expression levels upon codon optimisation of recombinant sequences (discussed in the introduction). Similar to our own expression constructs described above, most recombinant protein expression constructs copy features from efficiently expressed host genes, and will thus be efficient ribosome recruiters.
The second part of the prediction states that a reduction in the frequency with which ribosomes attempt to access the start codon can make gene expression independent of translation elongation rates and codon usage. To test this experimentally, we exchanged the original 5′-UTR of the CFLuc constructs originating from the highly expressed yeast TDH3 gene for a 529 nt long 5′-UTR containing a uORF (Fig 3B). This UTR is a derivative of the natural yeast GCN4 5′-UTR, with deletions of three of the four original GCN4 uORFs (Grant et al, 1994). We reasoned that the majority of ribosomes would be released following termination on the uORF, and only a fraction of ribosomes would re-initiate and translate the main CFLuc ORF. These constructs were termed ‘slow’ CFLucs as they increase the average time interval between two ribosomes accessing the CFLuc start codon.
When we experimentally compared CFLuc activity for the fast and slow constructs, we found that protein expression for staCFLuc and maxCFLuc was significantly reduced with slow 5′-UTRs. Moreover, as predicted by our simulations, these two constructs no longer differed in expression levels despite their different codon usage (Fig 3C). In contrast, the minCFLuc expression levels were not significantly altered by introduction of the slow 5′-UTR, and remained lower than for the staCFLuc and maxCFLuc sequences. All of these changes in protein expression were accompanied by minor changes in mRNA levels, which were not statistically significant (Fig 3C) and which could not explain the observed changes in measured luciferase activity. Interestingly, the computational analyses predict a point that shows a quantitatively very similar expression pattern, where maxCFLuc and staCFLuc have already converged but expression levels of these two constructs are still higher than for minCFLuc (indicated by an arrow in Fig 3A).
The observed behaviour of the fast and slow CFLuc constructs is fully consistent with the expected behaviour if translation elongation and initiation rates in the physiological range can indeed interfere with each other. Achieving high protein expression levels would then depend on mRNA feature that are compatible with both high initiation and high elongation rates, whereas either low initiation rates or low elongation rates on their own would be sufficient to restrict protein expression levels.
Efficient protein synthesis is dependent on ribosome speed throughout the open reading frame
The hypothesis that ribosome speed can control achievable translation initiation rates by interfering with efficient ribosome recruitment can be further investigated by separately analysing the role of ribosome movement at the 5′-and 3′-ends of an ORF. We exchanged portions of the 5′-maxCFLuc sequence with the corresponding minCFLuc codons, and then measured how introduction of these slower codons affected luciferase expression levels (Fig 4). maxCFLuc expression was exquisitely sensitive to the introduction of slow 5′-codons, with the shortest slow codon run that produced a statistically significant effect being the min8max variant. This variant differs in decoding speed from the fully optimised sequence in only three codons, since the other five of the eight initial codons either have no synonymous codons (Met), or the available synonymous codons have very similar near-cognate:cognate ratios and therefore very similar decoding times (Asp, Asn and two Lys). Importantly, codon changes up to codon 16 did not significantly affect mRNA levels. The reduction in expression levels observed for these constructs is thus caused at the translational level.
Figure 4.
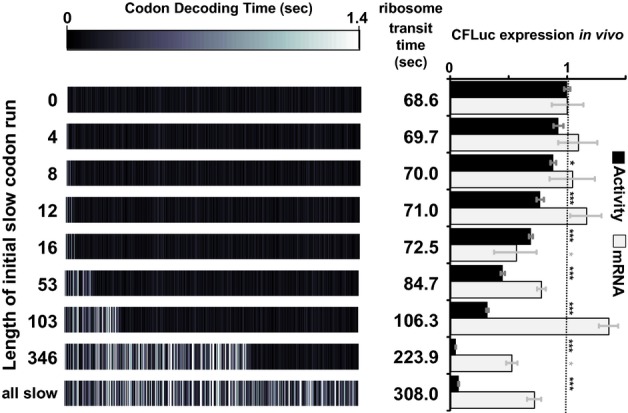
Expression levels are compared for derivatives of the maxCFLuc sequence (topmost construct), which consists only of the fastest possible codons. The 5′-end of this sequence was replaced by minCFLuc DNA, which consists only of the slowest possible codons. Replacement of as few as eight codons at the CFLuc 5′-end significantly affects luciferase activity levels, without significantly affecting mRNA levels. In contrast, replacement of the last 201 codons has no additional effect if the preceding codons are already slow (compare expression from the ‘346′ and ‘all slow’ constructs. The ‘all slow’ construct is identical to minCFLuc). ‘Transit Time’ denotes the time required by one isolated ribosome to translate the respective construct, and was calculated as the sum of the mean codon decoding times. The bars and error bars denote the mean and standard error of the mean for luciferase activity (n = 8) and luciferase mRNA levels (n = 3). Statistical significance of difference to the topmost (0 slow codons) construct was tested using Tukey's Test following one-way ANOVA, with parameters for luciferase activity: n = 8, F = 239.65, P = 0; for mRNA: n = 3, F = 6.96, P = 4 × 10⁻⁶. Statistical significance is indicated by asterisks: *, P < 0.05; **, P < 0.01; ***, P < 0.001, no asterisk, P > 0.05. The primer design strategy developed to compare the different codon variants is described in the supplemental information.
With the introduction of further slow codons expression became more limited, although this effect tailed off with longer stretches of slow codons. Interestingly however, substitution of the last 201 codons for slow codons no longer had any effect on translation if the first 346 codons were already slow (compare expression levels of ‘346′ and ‘all slow’ in Fig 4). Taken together, these observation indicate that codon usage and ribosome speed at the 5′-end of the mRNA strongly affect translation rates, whereas ribosome speed at the 3′-end of the mRNA can be altered without affecting speed at the 5′-end and therefore without affecting protein expression levels.
While ribosome speed at the 5′-end can be independent of ribosome speed at the 3′-end, theoretical approaches for studying ribosome movement in polysomes have long highlighted that speed changes at the 3′-end of an mRNA may affect gene expression levels if those speed changes cause ribosome queuing back to the beginning of the ORF. Under such conditions, the speed of multiple ribosomes translating a single mRNA can be much slower than the speed attained by one ribosome translating that mRNA in isolation (Chu & von der Haar, 2012; Ciandrini et al, 2013).
In order to demonstrate this possibility experimentally, we created a DNA construct that contained 346 fast codons followed by 201 slow codons (max346min, Fig 5A). Luciferase activity expressed from this construct was strongly limited compared to the maxCFLuc construct containing only fast codons (Fig 5B), consistent with the model prediction that this arrangement of codons would induce frequent collisions 5′ of the fast/slow boundary (Fig 5A). This was accompanied by less significant changes in the level of the corresponding mRNA, which were insufficient to explain the extent of the changes observed in activity levels, confirming that the majority of these changes are caused at the translational level.
Figure 5.
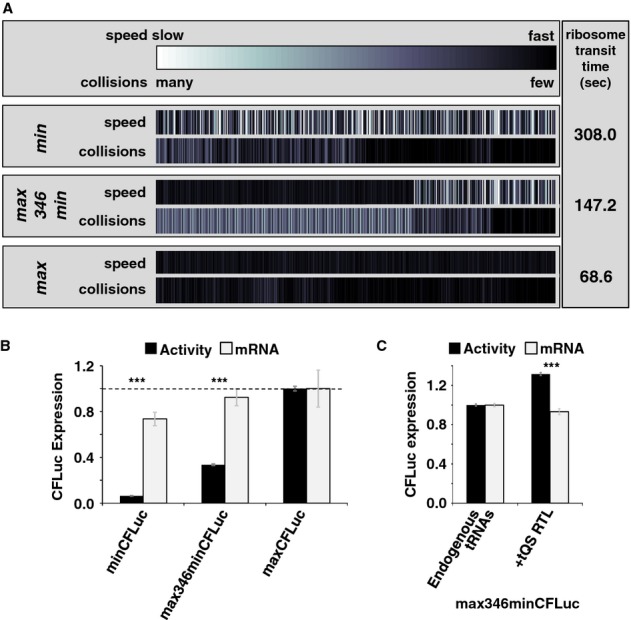
- Analyses of the collision behaviour on selected CFLuc variants. Both the speed of codon decoding and the observed number of collisions over each codon are displayed as heat maps. The minCFLuc and maxCFLuc sequences show moderate predicted levels of ribosome collisions, mostly in the 5′-half of the coding sequence preceding regions containing slower codons compared to the overall sequence. In contrast, a max346min construct which consists of 346 fast codons followed by 201 slow codons show high predicted levels of collisions preceding the boundary between the fast and slow sequence portions. Ribosome transit times, calculated as the sum of the mean decoding times for all codons, give the time required by one individual ribosome to translate the respective construct. The transit times of multiple ribosomes under conditions where collisions can occur is expected to be slower than this value.
- Experimental results obtained with the expression constructs analysed in (A). The introduction of slow codons into the 3′-end of maxCFLuc significantly reduces luciferase activity, without significantly affecting mRNA levels (as determined by Tukey's Test following one-way ANOVA). ANOVA parameters for luciferase activity are: n = 8, F = 1350, P = 0; for mRNA: n = 5, F = 0.95, P = 0.39. Samples significantly different from maxCFLuc are labelled: ***, P < 0.001; unlabelled, P > 0.05.
- The introduction of a plasmid that doubles the gene copy number for the five single-gene encoded essential tRNAs in yeast increases luciferase activity expressed from the mixed construct (n = 16, P = 3 × 10⁻¹⁰, t-test), without significantly affecting mRNA levels (n = 6, P = 0.62, t-test). The ability of tRNAs to affect protein expression levels confirms that expression from this construct is limited by codon usage and not by inadvertently formed RNA secondary structure. ***, P < 0.001; unlabelled, P > 0.05.
We further ascertained that the limitation in the max346min construct was at the level of codon decoding and not caused by inadvertent changes in mRNA secondary structure by manipulating the pool of rare tRNAs. For this experiment, we used a centromeric plasmid containing genes for the five essential single-gene encoded tRNAs in Saccharomyces cerevisiae. Because of the strong correlation of tRNA levels and tDNA gene copy number in yeast, this plasmid is expected to double the content of these five rarest tRNAs. We previously observed that introduction of this plasmid led to an increase in expression levels from the minCFLuc sequence by approximately 25%, consistent with a predicted increase in the speed of decoding of that sequence by a similar amount (Chu et al, 2011). In contrast, expression of staCFLuc and maxCFLuc were unaffected by the introduction of this plasmid.
Around 20% of the slow part of the max346min sequence is decoded by single-gene tRNAs, a similar proportion as for the slow minCFLuc sequence (25%). Ribosome speed on 3′-end of the max346minCFLuc ORF is thus expected to respond similarly to rare tRNA overexpression as ribosome speed on minCFLuc. When introduced into cells expressing max346minCFLuc, the tRNA plasmid did indeed increase luciferase expression by 31% (Fig 5C), consistent with the notion that slow codons in the latter part of an mRNA can limit gene expression by preventing fast movement of ribosomes at the beginning of the same mRNA.
The observation that traffic jams can propagate slow ribosome movement from one part of an mRNA to another also explains why the gradual introduction of slow codons from the 5′ end of the ORF led to a gradual decline in expression levels in the constructs shown in Fig 4. Our computer simulations predict that at high ribosome affinity the minCFLuc sequence displays frequent collision in the 5′-half of the ORF (Fig 5A), up to a particularly slow codon run near the middle of the sequence. This accounts for the observed pattern of reduction in gene expression levels as slow codons are introduced up to this bottleneck, but not if the slow-codon run is extended further 3′ of it.
The findings presented so far provide a mechanistic explanation for the longstanding observation that codon usage can affect protein expression levels, namely by limiting the rate with which translation initiation events can occur on an mRNA. We refer to this translational control mechanism as ‘start codon clearance’ control.
Start codon clearance control can be used to probe codon decoding times in vivo
The agreement between experimental results and computer simulations based on models where different codons are decoded with different speeds strengthens the case for the existence of such differences in vivo, despite the fact that these differences do not produce effects in deep sequencing data. To provide more quantitative evidence for speed differences between codons, we modified the maxCFLuc construct to include runs of ten glutamic acid codons following the maxCFLuc start codon and preceding the normal maxCFLuc ORF (Fig 6A). If the ten initial codons are decoded more slowly than the decoding speed in the following, fast luciferase sequence, ribosomes will move slowly on the initial ten codons but then progress quickly through the rest of the ORF. Because 10 codons is the reported physical extension of one ribosome, this means that the next ribosome can initiate exactly when the 10 codon sequence has been passed. The time interval between two initiation events on this mRNA is thus directly determined by the time required to translate the initial slow codon run, and protein synthesis rates from these constructs can be used to derive codon decoding times.
Figure 6.
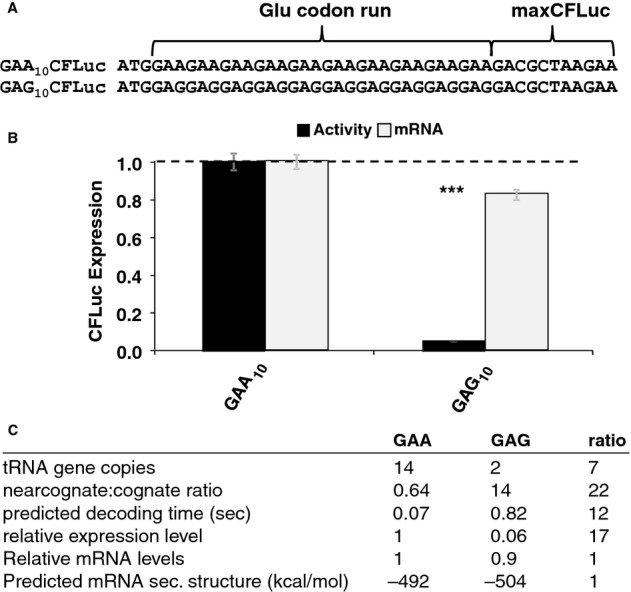
- Derivatives of the maxCFLuc construct were created that contain runs of either GAA or GAG codons, both encoding glutamic acid, following the start codon.
- The GAG codon run significantly reduces luciferase activity compared to the GAA run (black bars, n = 16, P < 10–12, t-test) while affecting mRNA levels less significantly (light bars, n = 3, P = 0.12, t-test). Error bars indicate the standard error of the mean. Samples significantly different from GAA are labelled: ***, P < 0.001; unlabelled, P > 0.05.
- A summary of parameters for the two Glu codon run constructs. There is a good quantitative match between the observed expression levels differences and the predicted codon decoding time, corroborating a model in which different codons are decoded with different speeds in vivo.
We generated two constructs containing runs of both GAA and GAG codons, which in our models strongly differ in decoding speed (0.07 and 0.82 s average decoding times, respectively, compared to a median decoding time of codons in the maxCFLuc sequence of 0.12 s). We observed that the slower GAG codons limited luciferase expression 17-fold more than the faster GAA codons, compared to a 12-fold predicted difference in decoding times (Fig 6B). Neither the calculated secondary structure content of these mRNAs nor the mRNA expression levels differ strongly between the constructs (Fig 6B), although we cannot exclude small changes in these parameters that are below the resolution of our assays. Given the minor potential for contributions from these parameters, we conclude that the magnitude of the observed expression differences agrees excellently with the difference in codon decoding times predicted by our decoding models. These data therefore strongly support the notion that different codons are decoded with different speeds in vivo. While this manuscript was in preparation, similar constructs were described by Kemp et al (2013) who introduced 5-and 10 codon runs of Gln codons (CAA and CAG) 5′ of an unmodified luciferase sequence similar to our staCFLuc construct. The constructs used in that study yielded similar results to our own. This confirms that this approach is generally applicable for estimating speeds of codon decoding.
Start codon clearance control limits gene expression from naturally evolved genes
We next sought to show that start codon clearance control is used to control gene expression levels on natural yeast genes. When designing the His3 codon usage variants, we noticed that the natural HIS3 gene consisted of a high proportion of slow codons. We quantified this by comparing the ribosome transit time for the first 10 codons of the actual yeast HIS3 gene against the ribosome transit times of randomly generated sequences encoding amino acid patterns as observed in 73 reported HIS3 sequences from different budding yeasts (Fig 7A). The transit time for the actual gene was slower than for 95% of randomly generated sequences, indicating that codon usage in the yeast HIS3 gene may have evolved to limit His3 expression levels.
Figure 7.
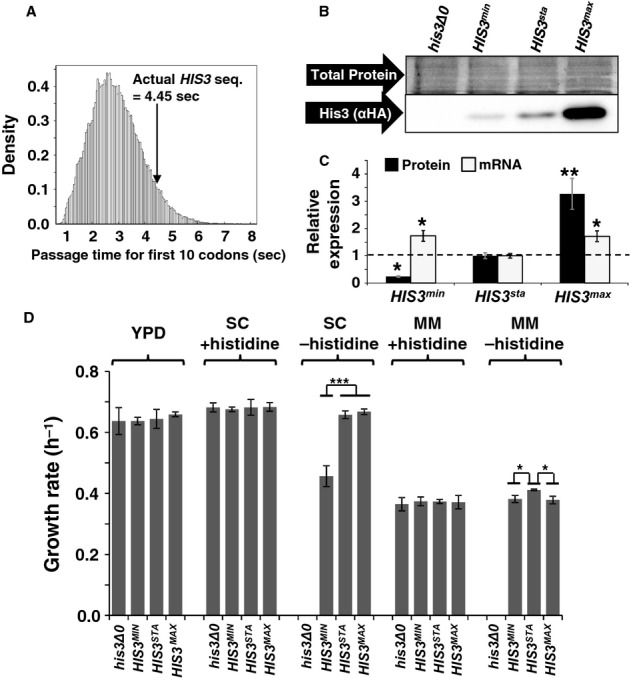
- Start codon clearance on yeast HIS3 mRNAs is slow. The histogram shows the speed distribution for the first ten amino acids, for 10 000 randomly generated sequences which produce an amino acid substitution pattern as observed in naturally occurring HIS3 sequences from 73 different budding yeasts. The observed S. cerevisiae HIS3 sequence is slower than 95% of random sequences, indicating that this sequence may have been selected for slow start codon clearance rates.
- Natural HIS3 codon usage determines His3 expression levels. HA-tagged HIS3 gene variants were introduced into the yeast genome at the normal chromosomal locus for this gene, maintaining all of its natural control sequences. Protein expression levels were determined using antibodies against the HA-tag located at the His3 C-termini. The top panel shows a section of post-transfer gel stained for total protein as loading control.
- Quantification of protein and mRNA expression data for HIS3 codon variants. Error bars show the standard error of the mean. Significance was analysed by Tukey's Test following one-way ANOVA. Protein: n = 3, F = 22.24, P = 0.0017. mRNA: n = 6, F = 5.99, P = 0.012. Statistical significance of differences to the reference sample (sta) is indicated by asterisks (*, P < 0.05; **, P < 0.01).
- Media-dependent growth rates of HIS3 derivative strains. In YPD, as well as SC or MM containing histidine, the three HIS3 strains as well as the original his3 deletion strain show indistinguishable growth rates. In contrast, in SC lacking histidine the HIS3min strain growth with reduced rates, whereas in MM lacking histidine the natural codon-usage HIS3sta has a small but significant growth advantage over both the other two strains. Error bars denote the standard error of the mean for growth rates of three independently derived HIS3 integrants. Statistical significance was tested by one-way ANOVA followed by Tukey's Test. ANOVA parameters are: n = 3 for all samples. YPD, F = 0.49, P = 0.70; SC +HIS, F = 0.12, P = 0.95; SC –HIS, F = 90.5, P = 3.3 × 10⁻⁵; MM +HIS, F = 0.18, P = 0.91; MM –HIS, F = 9.85, P = 0.01. Samples significantly different from other samples within their group according to the post-hoc analysis are labelled by asterisks: *, P < 0.05; ***, P < 0.001. Unlabelled bars are not significantly different from other samples within their group.
Source data are available online for this figure.
To directly test this prediction, we generated fusions of our three HA-tagged HIS3 variants with the natural HIS3 regulatory sequences, and incorporated these constructs at the chromosomal HIS3 locus. The resulting HIS3sta locus differed from wild-type HIS3 loci only in the presence of an HA tag between the last amino acid of the His3 protein and the stop codon, whereas the HIS3min and HIS3max loci additionally differed in the codon usage of the ORF. When the respective strains were inoculated into medium lacking histidine, all three were able to grow. Western blots revealed that these strains expressed an HA-tagged protein consistent in size with a His3-HA fusion protein (Fig 7B), and that the expression levels of this protein followed the order HIS3min < HIS3sta < HIS3max (Fig 7B and C). Additional analyses of the corresponding mRNA levels demonstrated that these showed statistically significant but minor changes (<2-fold) between the codon variants, which could not explain the observed protein expression pattern (Fig 7C). These findings demonstrate that, for HIS3 mRNAs with natural ribosome affinity, translation initiation and elongation activities are balanced in such a way that codon usage restricts protein expression levels.
In order to explore the phenotypic consequences of alterations in HIS3 codon usage, we conducted high resolution growth assays of the codon variants in different media. In YPD, synthetic complete medium (SC) or synthetic minimal medium (MM) containing histidine, the variant HIS3 strains exhibited growth rates that differed neither between the variants, nor when compared to the original his3 deletion strain (Fig 7C). In contrast, in SC lacking histidine, the HIS3min allele significantly reduced growth rates compared to HIS3sta and HIS3max. Our interpretation of this is that His3min expression levels are too low to generate sufficient histidine for maximum growth rates in SC medium. In MM medium lacking histidine, the HIS3sta strain had a small but statistically significant growth advantage over both the other strains. In sum, these findings can be taken as qualitative evidence that HIS3 codon usage has evolved to achieve optimal His3 expression levels.
Discussion
Our simulations and experiments analysing different combinations of codon usage and translation initiation rates reveal a mechanism by which codon usage can affect protein expression levels. The efficiency with which mRNAs recruit ribosomes on the one hand, and the rate of ribosomal movement near start codons on the other, separately control protein synthesis frequencies as they can each individually restrict translation initiation rates. In other words, high protein expression levels are only possible if both initiation and elongation are efficient. Experiments designed to probe the role of slow codons in the 3′-or 5′-parts of an mRNA confirmed that slow ribosome movement at the 5′-end is necessary and sufficient to restrict protein expression levels. Such slow movement near the start codon can be caused either by locally slow codons in the vicinity of the start site, or by slow sites elsewhere in the mRNA if these cause traffic jams that queue back to the start.
Our findings connect with previous empirical evidence on the regulation of translation elongation activity in eukaryotes. First, there are several published examples of altered gene expression patterns and phenotypes resulting from changes in translation elongation. Examples include overexpression of eEF1A isoforms and resulting tumorigenesis in mammalian cells (Anand et al, 2002), altered tRNA modification levels as part of a translational control program modifying the response to stresses in yeast (Chan et al, 2012), control of circadian rythms in Neurospora by codon-usage dependent expression of a clock protein (Zhou et al, 2013), and control of pseudohyphal growth in S. cerevisiae by mutations modifying tRNA stability (Kemp et al, 2013). Second, all translation elongation factors are phospho-proteins and are modified by kinase pathways in both mammals (Browne & Proud, 2002) and yeast (Stark et al, 2010). Although the physiology of elongation factor phosphorylation has not been studied in detail, frequent post-translational modification of elongation factors is consistent with an important regulatory role of such factors, which may often be exerted in conjunction with regulation impinging on translation initiation (Patel et al, 2002). Lastly, systematic studies of sensitivity coefficients for individual translation factors recently revealed that elongation factor levels exert stronger control over cell growth and protein synthesis rates than initiation factor levels (Firczuk et al, 2013). Together, these findings implicate translation elongation as a rich source of gene expression regulation. It is likely that start codon clearance control is a central mechanism connecting these different layers of empirical evidence.
In terms of evolution, it is clear that high gene expression levels can only be achieved if both translation initiation and translation elongation are compatible with efficient translation. Genes which require high expression levels for optimal fitness of an organism will therefore evolve features that lead to both high ribosome affinity and high start codon clearance rates. As our experimental results show, the latter requires the use of fast codons along the entire ORF. Such a mechanism would be sufficient to account for the observed correlation between use of optimal codons and high expression levels (Hershberg & Petrov, 2008), although in reality this correlation is likely an outcome of many overlapping, balanced mechanisms including optimisation of the global behaviour of the translational machinery, and effects from translation-independent parameters like secondary structure, GC content, and others.
For genes where low expression levels are important on the other hand, translation initiation and elongation could both independently limit gene expression. Codon usage is thus likely to evolve in some, but not all, low-expressed genes as the limiting function that ensures low expression levels. This would be consistent with the observation that in some organisms inefficient codons are statistically overrepresented in sequences encoding low-abundance proteins (Neafsey & Galagan, 2007).
In sum, our study reveals a translational control mechanism that provides a mechanistic connection between codon usage patterns and protein expression levels. To our knowledge, this is the first reported mechanism that can unify current theories of translational control and of codon usage evolution.
Materials and Methods
Simulation of individual codon decoding times
A reaction scheme for an individual elongation cycle was used as published (Fluitt et al, 2007). This scheme was implemented as a Matlab SimBiology object (release 2009a), with tRNA concentrations of cognate, near-cognate and non-cognate species for each codon assigned as published (Chu et al, 2011). tRNAs were assumed to be quantitatively aminoacylated and in complex with eEF1A and GTP. eEF2-catalysed translocation was modelled as an explicit set of reactions, but eEF3-dependent E-site tRNA release was modelled as a single, fast reaction since there are no detailed rate constants available for this step. Simulations were started using a stochastic solver and continued until peptidyl transfer and translocation had occurred. The time between start of the simulation and the completion of the translocation reaction was recorded for 10 000 independent simulations per codon. The mean of all 10 000 results was used as the mean decoding time for the codon in question. Supplementary Table S1 summarises the resulting mean decoding times for all codons.
Simulations of ribosome traffic along mRNA sequences
These were conducted using our published software for simulating translation (Chu et al, 2012) with parameters as described (Chu & von der Haar, 2012). Briefly, this software uses a stochastic simulation algorithm to simulate the interaction between a ribosome population, an mRNA population and a tRNA population. All ribosomes are tracked as individual agents with known positions on mRNAs, which interact with members of the tRNA population. The fate of an interacting tRNA is dependent on its nature (cognate, near-cognate or non-cognate), with the respective rate-constants defined from published kinetic and biochemical analyses [the rate constants are summarised in Fluitt et al (2007)]. The codon-dependent definition of each tRNA species as cognate, non-cognate or near-cognate is derived from rules defined by Plant et al (2007), and is given in detail in Chu et al (2011). The abundance of each tRNA species is estimated from the proportion of the gene copy number for that species (Chu et al, 2011). Once a ribosome has interacted with a tRNA, its A-site is blocked for further interactions until this tRNA has unbound from the ribosome or peptidyl transfer has occurred. Peptidyl transfer is followed by translocation and arrival of the next codon in the A-site. Binding of ribosomes to an mRNA is modelled as a stochastic event based on rates derived from the observed average ribosome density in ribosome footprinting experiments (Ingolia et al, 2009). Translation termination is modelled as a single event that is fast compared to elongation cycles.
Yeast strains
The principal yeast strain used in this study is BY4741 (Brachmann et al, 1998). An adh1::KanMX4 derivative of this strain was used for the qRT-PCR assays presented in Fig 2, in order to enable detection of the recombinant mRNAs with a primer pair targeted to the invariant ADH1 derived 3′-UTRs of these constructs.
HIS3min/sta/max derivatives of BY4741 were generated as follows. The regions 600 bp upstream and 300 bp downstream of the HIS3 gene were amplified by PCR using as template genomic DNA from yeast strain Y12 (Liti et al, 2009). The three HA-tagged HIS3 alleles were amplified from plasmids pTH735, 736 and 737. Primers for these PCRs contain overlap sites which allow their fusion via Gibson assembly (Gibson et al, 2009). The PCR products as well as BamHI/EcoRI digested pRS316 (Sikorski & Hieter, 1989) were then fused using a Gibson Assembly Kit (New England Biolabs, Hitchin, UK) according to the manufacturer's instructions. Individual transformants obtained from the assembly reaction were picked, DNA isolated and Sanger sequenced. Following sequencing, HIS3 cassettes were excised from the holding plasmid, isolated from agarose gels and transformed into BY4741. The transformed cells were plated on plates lacking histidine, and stable His+ colonies were selected for further use.
Plasmids
All gene syntheses were conducted by Genscript, Piscataway, NJ. Full sequences of the codon variants used are given in supplementary Table S2. Details of plasmids used in this study are listed in supplementary Table S3, together with accession numbers for the Addgene repository. Detailed maps and sequences for each plasmid are available from the Addgene website (http://www.addgene.org). All plasmids were derived from a yeast centromeric plasmid containing a bidirectional promoter based on a fusion of the yeast TDH3 and ADH1 promoters [pTH644 (Chu et al, 2011)]. All firefly luciferase expression constructs contained different versions of the firefly luciferase cloned as BamHI/SalI fragment downstream of the TDH3 promoter, and an invariant Renilla luciferase gene with the wild-type codon sequence downstream of the ADH1 promoter which was used for internal normalisation (Chu et al, 2011). Cytoplasmic Firefly luciferase variants were generated from the full-length codon variants (Chu et al, 2011) by PCR-mediated deletion of the last three codons of the sequence.
‘Slow initiation’ CFLuc variants were constructed by inserting a 495-bp fragment containing a variant of the GCN4 5′-UTR which had the start codons of uORFs 2, 3 and 4 deleted (i.e. which contained uORF 1 as the single remaining uORF) in front of the Firefly luciferase start codon. The Gcn4 leader sequence was amplified by PCR from p206 (Grant et al, 1994), and cloned as BglII/BamHI fragment into the BamHI site of pTH645. Firefly luciferase variants were then cloned as BamHI/SalI fragments into the resulting plasmid.
Mixed codon variants containing 4, 8, 12 or 16 slow codons followed by fast codons for the remainder of the sequences were generated by amplifying the maxCFLuc gene using 5′-oligos in which the corresponding number of codons had been replaced by the slowest existing yeast codons for the respective amino acid. The PCR products were then cloned as BamHI/SalI fragments as for the CFLuc constructs described above. Codon variants containing 53, 103 or 346 slow codons followed by fast codons for the remainder of the sequence were generated by replacing DNA from the minCFLuc plasmid with maxCFLuc sequences, using naturally occurring BsiWI (min53max), KasI (min103max) or AatII (min346max) sites in the minCFLuc sequence as 5′-cloning sites, and SalI as 3′-cloning site for all constructs. maxCFLuc fragments with the relevant restriction enzyme sites were generated via PCR. To generate the max346minCFLuc construct, the first 346 codons of maxCFLuc were amplified by PCR introducing 5′ BamHI and 3′ AatII cloning sites, and the PCR product was used to replace the BamHI/AatII fragment from the minCFLuc construct.
Codon variants of Renilla luciferase and the yeast HIS3 gene were synthesised by Genscript, Piscataway, NJ. Natural codon variants of these genes were generated by PCR, using pDB688 (Salas-Marco & Bedwell, 2005) as source for the Renilla DNA, and pRS314 as source for the HIS3 gene.
Western blotting and antibodies
Yeast extracts were prepared as described (von der Haar, 2007) using 2–5 OD of cells that had been inoculated from overnight culture to OD600 0.1, and grown to a final OD600 0.8–1. Antibodies used were from Sigma-Aldrich, Gillingham, UK (rabbit anti-HA, H6908, rabbit anti-Firefly Luciferase, L0159, goat anti-rabbit FITC-labelled, F9887, goat anti-rabbit HRP-labelled, A6154) and from MBL International, Woburn, MA (anti-Renilla Luciferase, PM047, anti-RFP, PM005).
Dual luciferase assays
These assays were conducted in 96-well format as described (Merritt et al, 2010).
qPCR assays
Primer design strategies, primer sequences, mRNA isolation procedures and qPCR assays are described in detail in the supplemental information.
Statistical analyses
For comparisons between two samples we used a two-tailed homoscedastic t-test as implemented in Microsoft Excel. For comparisons between more than two samples, we used the one-way ANOVA procedure (ANOVA1) implemented in Matlab (release 2009a). Post-hoc analyses to identify individual differences within a multiple-sample comparison were based on the Matlab multiple comparison procedure (multcompare) with comparison type set to ‘Tukey-Kramer’ (which is based on ‘Tukey's honestly significant difference criterion’), and alpha set as indicated.
Acknowledgments
We are grateful to Dr. Leos Valasek (Academy of Sciences of the Czech Republic) for donating a plasmid containing the mutated Gcn4 uORF. We would like to thank Thomas Jackson (MRC Toxicology Unit, Leicester, UK) for discussion of the manuscript. This work was funded in part by the Biotechnology and Biological Sciences Research Council (BBSRC), UK (Ref I010351, to TVDH and DFC), by a Faculty of Sciences Research Fund from the University of Kent, UK (to TVDH), and by support funds and equipment grants from the School of Biosciences (University of Kent, UK; to MFT and TvdH).
Author contributions
TvdH and DFC designed the study. TVDH, EK, TS and NB conducted experiments. DFC performed computational analyses. TVDH, DFC and MFT analysed data. TVDH, DFC, EK and MFT wrote the paper.
Conflict of interests
The authors declare that they have no conflict of interest.
Supplementary information for this article is available online: http://emboj.embopress.org
References
- Aitken CE, Lorsch JR. A mechanistic overview of translation initiation in eukaryotes. Nat Struct Mol Biol. 2012;19:568–576. doi: 10.1038/nsmb.2303. [DOI] [PubMed] [Google Scholar]
- Anand N, Murthy S, Amann G, Wernick M, Porter LA, Cukier IH, Collins C, Gray JW, Diebold J, Demetrick DJ, Lee JM. Protein elongation factor EEF1A2 is a putative oncogene in ovarian cancer. Nat Genet. 2002;31:301–305. doi: 10.1038/ng904. [DOI] [PubMed] [Google Scholar]
- Brachmann CB, Davies A, Cost GJ, Caputo E, Li J, Hieter P, Boeke JD. Designer deletion strains derived from Saccharomyces cerevisiae S288C: a useful set of strains and plasmids for PCR-mediated gene disruption and other applications. Yeast. 1998;14:115–132. doi: 10.1002/(SICI)1097-0061(19980130)14:2<115::AID-YEA204>3.0.CO;2-2. [DOI] [PubMed] [Google Scholar]
- Browne GJ, Proud CG. Regulation of peptide-chain elongation in mammalian cells. Eur J Biochem. 2002;269:5360–5368. doi: 10.1046/j.1432-1033.2002.03290.x. [DOI] [PubMed] [Google Scholar]
- Carlini DB, Stephan W. In vivo Introduction of Unpreferred Synonymous Codons Into the Drosophila Adh Gene Results in Reduced Levels of ADH Protein. Genetics. 2003;163:239–243. doi: 10.1093/genetics/163.1.239. [DOI] [PMC free article] [PubMed] [Google Scholar]
- Chan CTY, Pang YLJ, Deng W, Babu IR, Dyavaiah M, Begley TJ, Dedon PC. Reprogramming of tRNA modifications controls the oxidative stress response by codon-biased translation of proteins. Nat Commun. 2012;3:937. doi: 10.1038/ncomms1938. [DOI] [PMC free article] [PubMed] [Google Scholar]
- Charneski CA, Hurst LD. Positively charged residues are the major determinants of ribosomal velocity. PLoS Biol. 2013;11:e1001508. doi: 10.1371/journal.pbio.1001508. [DOI] [PMC free article] [PubMed] [Google Scholar]
- Chu D, Barnes DJ, von der Haar T. The role of tRNA and ribosome competition in coupling the expression of different mRNAs in Saccharomyces cerevisiae. Nucleic Acids Res. 2011;39:6705–6714. doi: 10.1093/nar/gkr300. [DOI] [PMC free article] [PubMed] [Google Scholar]
- Chu D, von der Haar T. The architecture of eukaryotic translation. Nucleic Acids Res. 2012;40:10098–10106. doi: 10.1093/nar/gks825. [DOI] [PMC free article] [PubMed] [Google Scholar]
- Chu D, Zabet N, von der Haar T. A novel and versatile computational tool to model translation. Bioinformatics. 2012;28:292–293. doi: 10.1093/bioinformatics/btr650. [DOI] [PubMed] [Google Scholar]
- Ciandrini L, Stansfield I, Romano MC. Ribosome traffic on mRNAs maps to gene ontology: genome-wide quantification of translation initiation rates and polysome size regulation. PLoS Comput Biol. 2013;9:e1002866. doi: 10.1371/journal.pcbi.1002866. [DOI] [PMC free article] [PubMed] [Google Scholar]
- Dana A, Tuller T. Determinants of translation elongation speed and ribosomal profiling biases in mouse embryonic stem cells. PLoS Comput Biol. 2012;8:e1002755. doi: 10.1371/journal.pcbi.1002755. [DOI] [PMC free article] [PubMed] [Google Scholar]
- Firczuk H, Kannambath S, Pahle J, Claydon A, Beynon R, Duncan J, Westerhoff H, Mendes P, McCarthy JE. An in vivo control map for the eukaryotic mRNA translation machinery. Mol Syst Biol. 2013;9:1–13. doi: 10.1038/msb.2012.73. [DOI] [PMC free article] [PubMed] [Google Scholar]
- Fluitt A, Pienaar E, Viljoen H. Ribosome kinetics and aa-tRNA competition determine rate and fidelity of peptide synthesis. Comput Biol Chem. 2007;31:335–346. doi: 10.1016/j.compbiolchem.2007.07.003. [DOI] [PMC free article] [PubMed] [Google Scholar]
- Gibson DG, Young L, Chuang R-Y, Venter JC, Hutchison CA, Smith HO. Enzymatic assembly of DNA molecules up to several hundred kilobases. Nat Methods. 2009;6:343–345. doi: 10.1038/nmeth.1318. [DOI] [PubMed] [Google Scholar]
- Gould SJ, Keller G-A, Hosken N, Wilkinson J, Subramani S. A conserved tripeptide sorts proteins to peroxisomes. J Cell Biol. 1989;108:1657–1664. doi: 10.1083/jcb.108.5.1657. [DOI] [PMC free article] [PubMed] [Google Scholar]
- Grant CM, Miller PF, Hinnebusch AG. Requirements for intercistronic distance and level of eukaryotic initiation factor 2 activity in reinitiation on GCN4 mRNA vary with the downstream cistron. Mol Cell Proteomics. 1994;14:2616–2628. doi: 10.1128/mcb.14.4.2616. [DOI] [PMC free article] [PubMed] [Google Scholar]
- von der Haar T. Optimized protein extraction for quantitative proteomics of yeasts. PLoS ONE. 2007;2:e1078. doi: 10.1371/journal.pone.0001078. [DOI] [PMC free article] [PubMed] [Google Scholar]
- von der Haar T. A quantitative estimation of the global translational activity in logarithmically growing yeast cells. BMC Syst Biol. 2008;2:87. doi: 10.1186/1752-0509-2-87. [DOI] [PMC free article] [PubMed] [Google Scholar]
- Hense W, Anderson N, Hutter S, Stephan W, Parsch J, Carlini DB. Experimentally increased codon bias in the Drosophila Adh gene leads to an increase in larval, but not adult, alcohol dehydrogenase activity. Genetics. 2010;184:547–555. doi: 10.1534/genetics.109.111294. [DOI] [PMC free article] [PubMed] [Google Scholar]
- Hershberg R, Petrov DA. Selection on codon bias. Annu Rev Genet. 2008;42:287–299. doi: 10.1146/annurev.genet.42.110807.091442. [DOI] [PubMed] [Google Scholar]
- Hu S, Li L, Qiao J, Guo Y, Cheng L, Liu J. Codon optimization, expression, and characterization of an internalizing anti-ErbB2 single-chain antibody in Pichia pastoris. Protein Expr Purif. 2006;47:249–257. doi: 10.1016/j.pep.2005.11.014. [DOI] [PubMed] [Google Scholar]
- Ikemura T. Correlation between the abundance of yeast transfer RNAs and the occurrence of the respective codons in protein genes. Differences in synonymous codon choice patterns of yeast and Escherichia coli with reference to the abundance of isoaccepting transfer R. J Mol Biol. 1982;158:573–597. doi: 10.1016/0022-2836(82)90250-9. [DOI] [PubMed] [Google Scholar]
- Ingolia NT, Ghaemmaghami S, Newman JRS, Weissman JS. Genome-wide analysis in vivo of translation with nucleotide resolution using ribosome profiling. Science. 2009;324:218–223. doi: 10.1126/science.1168978. [DOI] [PMC free article] [PubMed] [Google Scholar]
- Ingolia NT, Lareau LF, Weissman JS. Ribosome profiling of mouse embryonic stem cells reveals the complexity and dynamics of mammalian proteomes. Cell. 2011;147:789–802. doi: 10.1016/j.cell.2011.10.002. [DOI] [PMC free article] [PubMed] [Google Scholar]
- Jeon WY, Yoon BH, Ko BS, Shim WY, Kim JH. Xylitol production is increased by expression of codon-optimized Neurospora crassa xylose reductase gene in Candida tropicalis. Bioprocess Biosyst Eng. 2012;35:191–198. doi: 10.1007/s00449-011-0618-8. [DOI] [PMC free article] [PubMed] [Google Scholar]
- Kemp AJ, Betney R, Ciandrini L, Schwenger ACM, Romano MC, Stansfield I. A yeast tRNA mutant that causes pseudohyphal growth exhibits reduced rates of CAG codon translation. Mol Microbiol. 2013;87:284–300. doi: 10.1111/mmi.12096. [DOI] [PMC free article] [PubMed] [Google Scholar]
- Kotula L, Curtis PJ. Evaluation of foreign gene codon optimization in yeast: expression of a mouse IG kappa chain. Biotechnology. 1991;9:1386–1389. doi: 10.1038/nbt1291-1386. [DOI] [PubMed] [Google Scholar]
- Kudla G, Murray AW, Tollervey D, Plotkin JB. Coding-sequence determinants of gene expression in Escherichia coli. Science. 2009;324:255–258. doi: 10.1126/science.1170160. [DOI] [PMC free article] [PubMed] [Google Scholar]
- Liti G, Carter DM, Moses AM, Warringer J, Parts L, James SA, Davey RP, Roberts IN, Burt A, Koufopanou V, Tsai IJ, Bergman CM, Bensasson D, O'Kelly MJT, Van Oudenaarden A, Barton DBH, Bailes E, Nguyen AN, Jones M, Quail MA, et al. Population genomics of domestic and wild yeasts. Nature. 2009;458:337–341. doi: 10.1038/nature07743. [DOI] [PMC free article] [PubMed] [Google Scholar]
- Liu B, Han Y, Qian S-B. Cotranslational response to proteotoxic stress by elongation pausing of ribosomes. Mol Cell. 2013;49:453–463. doi: 10.1016/j.molcel.2012.12.001. [DOI] [PMC free article] [PubMed] [Google Scholar]
- Lombardi A, Bursomanno S, Lopardo T, Traini R, Colombatti M, Ippoliti R, Flavell DJ, Flavell SU, Ceriotti A, Fabbrini MS. Pichia pastoris as a host for secretion of toxic saporin chimeras. FASEB J. 2009;24:253–265. doi: 10.1096/fj.08-118042. [DOI] [PubMed] [Google Scholar]
- McCarthy JEG. Posttranscriptional control of gene expression in yeast. Microbiol Mol Biol Rev. 1998;62:1492–1553. doi: 10.1128/mmbr.62.4.1492-1553.1998. [DOI] [PMC free article] [PubMed] [Google Scholar]
- Merritt GH, Naemi WR, Mugnier P, Webb HM, Tuite MF, von der Haar T. Decoding accuracy in eRF1 mutants and its correlation with pleiotropic quantitative traits in yeast. Nucleic Acids Res. 2010;38:5479–5492. doi: 10.1093/nar/gkq338. [DOI] [PMC free article] [PubMed] [Google Scholar]
- Mirzaei SA, Tabatabaei Yazdi M, Sepehrizadeh Z. Secretory expression and purification of a soluble NADH cytochrome b5 reductase enzyme from Mucor racemosus in Pichia pastoris based on codon usage adaptation. Biotechnol Lett. 2010;32:1705–1711. doi: 10.1007/s10529-010-0348-z. [DOI] [PubMed] [Google Scholar]
- Moriya H, Shimizu-Yoshida Y, Kitano H. In vivo robustness analysis of cell division cycle genes in Saccharomyces cerevisiae. PLoS Genet. 2006;2:e111. doi: 10.1371/journal.pgen.0020111. [DOI] [PMC free article] [PubMed] [Google Scholar]
- Mossadegh N, Gissmann L, Müller M, Zentgraf H, Alonso A, Tomakidi P. Codon optimization of the human papillomavirus 11 (HPV 11) L1 gene leads to increased gene expression and formation of virus-like particles in mammalian epithelial cells. Virology. 2004;326:57–66. doi: 10.1016/j.virol.2004.04.050. [DOI] [PubMed] [Google Scholar]
- Nagata T, Uchijima M, Yoshida A, Kawashima M, Koide Y. Codon optimization effect on translational efficiency of DNA vaccine in mammalian cells: analysis of plasmid DNA encoding a CTL epitope derived from microorganisms. Biochem Biophys Res Commun. 1999;261:445–451. doi: 10.1006/bbrc.1999.1050. [DOI] [PubMed] [Google Scholar]
- Neafsey DE, Galagan JE. Positive selection for unpreferred codon usage in eukaryotic genomes. BMC Evol Biol. 2007;7:119. doi: 10.1186/1471-2148-7-119. [DOI] [PMC free article] [PubMed] [Google Scholar]
- Outchkourov NS, Stiekema WJ, Jongsma MA. Optimization of the expression of equistatin in Pichia pastoris. Protein Expr Purif. 2002;24:18–24. doi: 10.1006/prep.2001.1523. [DOI] [PubMed] [Google Scholar]
- Patel J, McLeod LE, Vries RGJ, Flynn A, Wang X, Proud CG. Cellular stresses profoundly inhibit protein synthesis and modulate the states of phosphorylation of multiple translation factors. Eur J Biochem. 2002;269:3076–3085. doi: 10.1046/j.1432-1033.2002.02992.x. [DOI] [PubMed] [Google Scholar]
- Plant EP, Nguyen P, Russ JR, Pittman YR, Nguyen T, Quesinberry JT, Kinzy TG, Dinman JD. Differentiating between near-and non-cognate codons in Saccharomyces cerevisiae. PLoS ONE. 2007;2:e517. doi: 10.1371/journal.pone.0000517. [DOI] [PMC free article] [PubMed] [Google Scholar]
- Powell JR, Moriyama EN. Evolution of codon usage bias in Drosophila. Proc Natl Acad Sci USA. 1997;94:7784–7790. doi: 10.1073/pnas.94.15.7784. [DOI] [PMC free article] [PubMed] [Google Scholar]
- Qian W, Yang J-R, Pearson NM, Maclean C, Zhang J. Balanced codon usage optimizes eukaryotic translational efficiency. PLoS Genet. 2012;8:e1002603. doi: 10.1371/journal.pgen.1002603. [DOI] [PMC free article] [PubMed] [Google Scholar]
- Sala-Newby GB, Campbell AK. Stepwise removal of the C-terminal 12 amino acids of firefly luciferase results in graded loss of activity. Biochim Biophys Acta. 1994;1206:155–160. doi: 10.1016/0167-4838(94)90084-1. [DOI] [PubMed] [Google Scholar]
- Salas-Marco J, Bedwell DM. Discrimination between defects in elongation fidelity and termination efficiency provides mechanistic insights into translational readthrough. J Mol Biol. 2005;348:801–815. doi: 10.1016/j.jmb.2005.03.025. [DOI] [PubMed] [Google Scholar]
- Shalgi R, Hurt JA, Krykbaeva I, Taipale M, Lindquist S, Burge CB. Widespread regulation of translation by elongation pausing in heat shock. Mol Cell. 2013;49:439–452. doi: 10.1016/j.molcel.2012.11.028. [DOI] [PMC free article] [PubMed] [Google Scholar]
- Sikorski RS, Hieter P. A system of shuttle vectors and yeast host strains designed for efficient manipulation of DNA in Saccharomyces cerevisiae. Genetics. 1989;000:19–27. doi: 10.1093/genetics/122.1.19. [DOI] [PMC free article] [PubMed] [Google Scholar]
- Sinclair G, Choy FYM. Synonymous codon usage bias and the expression of human glucocerebrosidase in the methylotrophic yeast, Pichia pastoris. Protein Expr Purif. 2002;26:96–105. doi: 10.1016/s1046-5928(02)00526-0. [DOI] [PubMed] [Google Scholar]
- Slimko EM, Lester HA. Codon optimization of Caenorhabditis elegans GluCl ion channel genes for mammalian cells dramatically improves expression levels. J Neurosci Methods. 2003;124:75–81. doi: 10.1016/s0165-0270(02)00362-x. [DOI] [PubMed] [Google Scholar]
- Stadler M, Fire A. Wobble base-pairing slows in vivo translation elongation in metazoans. RNA. 2011;17:2063–2073. doi: 10.1261/rna.02890211. [DOI] [PMC free article] [PubMed] [Google Scholar]
- Stark C, Su T-C, Breitkreutz A, Lourenco P, Dahabieh M, Breitkreutz B-J, Tyers M, Sadowski I. PhosphoGRID: a database of experimentally verified in vivo protein phosphorylation sites from the budding yeast Saccharomyces cerevisiae. Database (Oxford) 2010;2010:bap026. doi: 10.1093/database/bap026. [DOI] [PMC free article] [PubMed] [Google Scholar]
- Wolin SL, Walter P. Ribosome pausing and stacking during translation of a eukaryotic mRNA. EMBO J. 1988;7:3559–3569. doi: 10.1002/j.1460-2075.1988.tb03233.x. [DOI] [PMC free article] [PubMed] [Google Scholar]
- Yadava A, Ockenhouse CF. Effect of codon optimization on expression levels of a functionally folded Malaria vaccine candidate in prokaryotic and eukaryotic expression systems. Infect Immun. 2003;71:4961–4969. doi: 10.1128/IAI.71.9.4961-4969.2003. [DOI] [PMC free article] [PubMed] [Google Scholar]
- Zhou M, Guo J, Cha J, Chae M, Chen S, Barral JM, Sachs MS, Liu Y. Non-optimal codon usage affects expression, structure and function of clock protein FRQ. Nature. 2013;495:111–115. doi: 10.1038/nature11833. [DOI] [PMC free article] [PubMed] [Google Scholar]
- Zouridis H, Hatzimanikatis V. Effects of codon distributions and tRNA competition on protein translation. Biophys J. 2008;95:1018–1033. doi: 10.1529/biophysj.107.126128. [DOI] [PMC free article] [PubMed] [Google Scholar]
Associated Data
This section collects any data citations, data availability statements, or supplementary materials included in this article.