

Abstract
Kir4.1, a glial-specific K+ channel, is critical for normal CNS development. Studies utilizing both global and glial-specific knockout of Kir4.1 reveal abnormal CNS development with the loss of the channel. Specifically, Kir4.1 knockout animals are characterized by ataxia, severe hypomyelination, and early postnatal death. Additionally, Kir4.1 has emerged as a key player in several CNS diseases. Notably, decreased Kir4.1 protein expression occurs in several human CNS pathologies including CNS ischemic injury, spinal cord injury, epilepsy, ALS, and Alzheimer’s disease. Despite the emerging significance of Kir4.1 in normal and pathological conditions, its mechanisms of regulation are unknown. Here we report the first epigenetic regulation of a K+ channel in the CNS. Robust developmental upregulation of Kir4.1 expression in rats is coincident with reductions in DNA methylation of the Kir4.1 gene, KCNJ10. Chromatin immunoprecipitation reveals a dynamic interaction between KCNJ10 and DNA methyltransferase 1 during development. Finally, demethylation of the KCNJ10 promoter is necessary for transcription. These findings indicate DNA methylation is a key regulator of Kir4.1 transcription. Given the essential role of Kir4.1 in normal CNS development, understanding the regulation of this K+ channel is critical to understanding normal glial biology.
Keywords: Astrocyte, Epigenetics, Development
Introduction
Kir4.1, an inwardly-rectifying K+ channel, is expressed in several macroglia cell populations including radial glia, astrocytes, oligodendrocytes, and NG2+ oligodendrocyte precursor cells (OPCs) (Kofuji et al., 2002; Kofuji et al., 2000; Poopalasundaram et al., 2000; Higashi et al., 2001; Maldonado et al., 2013; Neusch et al., 2001). While Kir4.1 is expressed in all of the aforementioned cell types in adulthood, during development Kir4.1 expression shifts dramatically from oligodendrocytes to astrocytes (Kalsi et al., 2004a) as well as undergoes upregulation in OPCs during the fourth and fifth postnatal week (Maldonado et al., 2013). These changes in expression are thought to reflect changes in the functional demands of the channel (Higashi et al., 2001; Maldonado et al., 2013; Kalsi et al., 2004a). In regards to astrocytes, numerous studies have underscored the importance of Kir4.1 in mediating several astrocytic functions including K+ buffering, glutamate uptake, and water regulation (Seifert et al., 2009; Olsen et al., 2006; Kofuji et al., 2000; Neusch et al., 2006; Haj-Yasein et al., 2011; Kucheryavykh et al., 2007; Djukic et al., 2007; Connors and Kofuji, 2006; Pannicke et al., 2004; Dibaj et al., 2007). Pharmacological inhibition, knock down or complete knock out of this channel results in astrocytes with increased membrane resistance, depolarized resting membrane potential and altered extracellular potassium dynamics (Kucheryavykh et al., 2007; Djukic et al., 2007; Chever et al., 2010; Olsen et al., 2006; Seifert et al., 2009; Kofuji et al., 2000; Haj-Yasein et al., 2011). Subsequent to the dysregulation of [K+]e, Kir4.1 KO animals suffer from ataxia, seizures, and early postnatal death (Neusch et al., 2001). Emphasizing the importance of the broad glial-specific expression of Kir4.1, knockout of the channel also affects oligodendrocytic maturation and results in hypomyelination of the spinal cord (Neusch et al., 2001). Loss of function mutations of this channel are causative for SESAME syndrome. These patients present with several neurological deficits including; early onset seizures, severe cognitive defects, motor extremity weakness, ataxia, and sensorineural deafness implicating this channel plays an important role in brain development (Bockenhauer D, et al. 2009; Scholl UI et al., 2009). Apart from its role in normal CNS development and glial cell physiology, genetic linkage analysis, mutational screening, and a variety of injury paradigms link Kir4.1 to a broad array of CNS pathologies ranging from epilepsy, autism spectrum disorders, Multiple Sclerosis, and CNS injury (Ferraro et al., 2004; Buono et al., 2004; Lenzen et al., 2005; Sicca et al., 2011; Srivastava et al., 2012; Stewart et al., 2010; D’Ambrosio et al., 1999; Olsen et al., 2010). Despite the essential role of Kir4.1 in normal and pathologic states, there is no information regarding its regulation.
Epigenetics refers to modifications of DNA and chromatin that alter gene expression, without a change in sequence (Bird, 2002). DNA methylation represents a heritable mechanism for regulating gene expression as patterns of DNA methylation are maintained through cell division (Bird, 2002). Despite this seeming permanence, DNA methylation is subject to change based on exposure and experience. For instance, the budding field of neuroepigenetics has highlighted the role of DNA methylation in learning and memory. Studies demonstrate altered DNA methylation of BDNF, reelin, and PP1 gene (all essential to the learning and memory process) following fear conditioning and hyper-methylation of BDNF in rodents experiencing early-life adversity (Miller and Sweatt, 2007; Lubin et al., 2008; Roth et al., 2009). One recent study conducted by Perisic et. al., demonstrated that GLT-1, the main astrocytic glutamate transporter, is regulated via DNA methylation, highlighting a role for DNA methlyation in non-neuronal genes (Perisic et al., 2012). Interestingly, the CNS possesses the highest level of DNA methylation and demonstrates robust and dynamic changes of DNA methylation during pre- and postnatal development (Tawa et al., 1990; Ono et al., 1993). Our group sought to explore whether Kir4.1, which plays a pivotal role in both normal and pathological states of the CNS, is regulated through epigenetic mechanisms, specifically DNA methylation.
Here we show developmental increases in Kir4.1 expression are coincident with reductions in DNA methylation of the Kir4.1 gene. Additionally, we found DNA methyltransferase 1 (DNMT 1), which maintains methylation patterns through cell division, exhibits a dynamic interaction with Kir4.1 gene through development. Finally, we show a global state of demethylation can drive Kir4.1 transcription, while a complete methylation of the promoter results in reduced promoter activity. Altogether, these results indicate that Kir4.1 expression is regulated by DNA methylation.
Materials and Methods
Animals
All animals were handled in accordance with the National Institutes of Health guidelines. The Animal Care and Use Committee at the University of Alabama at Birmingham approved animal use. Mixed gender, Sprague-Dawley (SD) rats were utilized from postnatal ages 0 to 28. Upon sexual maturity, only male SD rats were utilized for tissue collection. eGFP-S100β rats utilized in fluorescent-activated cell sorting experiments (FACS) generated by Itakura et., al (Itakura et al., 2007).
Immunoblotting and quantitative real time PCR (qRT-PCR)
Sprague-Dawley rats were euthanized with exposure to carbon dioxide. Following decapitation, cortices, hippocampi, cerebellum, brain stem and spinal cord were dissected. Protein lysates were prepared by homogenization in RIPA buffer (10% SDS, 10% Tris Buffer, pH 7.5 in double distilled water) using glass dounce homogenizers, followed by 2 rounds of sonication at 70% for 10 seconds. Lysates were spun at 12,000 rcf for 5 minutes. Protein concentration was determined by BCA assay (Thermo Scientific). 10μg of protein were loaded and resolved on Biorad mini-protean TGX 4-20% precast gels. Proteins were transferred onto PVDF membrane at 100V for 60 minutes. Membranes were blocked using 10% milk in TBS-T. Blots were then probed with primary antibodies, rinsed, and then probed with secondary antibody conjugated to horseradish peroxidase. Millipore Luminata Classic Western HRP substrate was used for visualization on autoradiography film. Densitometric analysis was performed utilizing Image J software. Relative density was calculated using GAPDH to normalize data. For qRT PCR, total mRNA and genomic DNA were isolated sequentially using Qiagen All Prep DNA/RNA Mini Kit. 1000 ng of mRNA was converted to cDNA using Invitrogen Superscript VILO cDNA synthesis kit. cDNA was diluted 1:3 using DEPC treated water. Applied Biosystems Taqman probes were used with Taqman Universal Mastermix II, no UNG. qPCR was performed on both Applied Biosystems StepOne and Applied Biosystems 7900HT. Cycling parameters were: 50°C for 2 min, 95°C for 10 min, 40 repeats of 95°C for 15 seconds and 60°C for 1 minute. Gapdh was used as housekeeping gene. ΔΔCt method was utilized to determine Relative Fold Expression of mRNA.
Immunohistochemistry
eGFP-S100β animals were anaesthetized with a peritoneal injection of ketamine (100mg/kg) and perfused with 4% paraformaldehyde solution for 25 minutes. The cortex was removed and stored in 4% paraformaldehyde. After washing in phosphate buffered saline, 100μM sections were cut using a Vibratome (Oxford instruments). Sections were blocked for 1h in 10% goat serum and 0.2% Triton-X100 in phosphate buffered saline (BB). Primary antibody (GFAP, Millipore) was diluted in BB 1:3 with phosphate buffered saline. Slices were incubated with primary antibody overnight at 4°C with gentle agitation. The sections were then washed three times in diluted phosphate buffered saline incubating with tetramethyl rhodamine iso-thiocyanate-conjugated secondary antibodies obtained from Molecular Probes for 60 minutes at room temperature. The slices were washed two times with diluted BB, then incubated with 4’6-diamidino-2-phenylindole (10-4mg/mL; Sigma), and finally washed twice with phosphate buffered saline before being mounted onto glass coverslips. Fluorescent images were acquired with a Zeiss LSM 510 Meta Confocal.
Fluorescent activated cell sorting (FACS)
eGFP-S100β animals were briefly anaesthetized with 30 second exposure to carbon dioxide and decapitated. Cortical tissue was dissected and dissociated using Papain Dissociation System (Worthington Biochemical Corporation). Briefly, following dissection of cortical tissue, tissue was minced into pieces, placed into papain solution (heat-activated at 37°C, equilibrated with 95%O2:5%CO2) and incubated for 15 minutes. Tissue was triturated using a 10mL pipette. Cell suspension was centrifuged at 300×g for 5 minutes at room temperature. Cell pellet was re-suspended in a DNase/albumin-inhibitor solution, and then added on top of an albumin-inhibitor solution to form a discontinuous density gradient. Suspension was centrifuged at 70×g for 6 minutes at room temperature. Supernatant was discarded and pelleted cells were resuspended into Dulbecco’s Phosphate-Buffered Saline containing 0.02% bovine serum albumin and 1mg/mL of DNase I. Cells were sorted on a Becton Dickinson FacsAria II. 488nm laser was used to excite the eGFP. Two distinct populations were visible on the forward scatter/side scatter (FSC/SSC) plot. After trial and error testing, the population that was lower on the SSC axis was identified as the target population. Out of this population we sorted the GFP+ cells. Isolated astrocytes were spun at 2,000 rcf for 5 minutes at 4°C to pellet cells. RNA and DNA were extracted using Qiagen All Prep DNA/RNA Mini Kit and analyzed via qRT-PCR and pyrosequencing, respectively.
Methylation Sensitive - High Resolution Melt Analysis (MS-HRM)
Total genomic DNA was isolated using Qiagen AllPrep DNA/RNA Mini Kit. 1000ng of gDNA from developmental samples and methylated standards 0-100% (EpiGenDx) were bisulfite converted using Zymogen EZ DNA Methylation Kit. Concentration of converted DNA was quantitated using Nanodrop and adjusted to 20ng/uL for every sample. Applied Biosystems MeltDoctor Mastermix was utilized to amplify bisulfite converted DNA. PCR primers were validated and products verified by 1% agarose gel (Table 1). PCR amplification and melt curve was performed on Applied Biosystems 7900HT. Cycling conditions were: 95°C for 10 minutes, 40 repeats of 95°C for 15 seconds and 60°C for 1 minute. Melt curve parameters were: 95°C for 10 seconds, 60°C for 1 minute, 95°C for 15 seconds (1% ramp rate), and 60°C for 15 seconds. Rat methylated standards ranging from 0-100% were run along with developmental samples. Following amplification and generation of melt curve, data was extracted and imported into Applied Biosystems HRM software, version 2.0.2. Pre and post start parameters were set at the beginning of the melt transition and were placed approximately 0.2 to 0.5°C from each other; pre and post stop parameters were similarly set. Software algorithm was utilized to observe variant calls. Peak temperature difference data was extracted from both methylated standards and unknown samples. Estimated percent methylation of unknowns was calculated using linear regression of methylated standards. Samples that demonstrated an estimated percent methylation below zero were graphed as zero.
Table I. Primers utilized for MS-HRMA.
Primers utilized for MS-HRMA are listed. CpG sites that were targeted in each amplified product are listed.
| Targeted CpG Sites | Forward Primer | Reverse Primer |
|---|---|---|
| 1 to 5 | 5’ TTGTAGGTAGAGATGGGTTTTGT 3’ | 5’ AAACTCTAACATCCCRTACAATTT 3’ |
| 6 to 11 | 5’ TTAGGAATTTAGGTTAGAATTTAGGTTAAG 3’ | 5’ CCTATCAAAATAAAAAAACCAAAAC 3’ |
| 12 to 20 | 5’ TTTGGTTTTTTTATTTTGATAGGG 3’ | 5’ ACATCCRAAAACTAAAATCCA 3’ |
| 21 to 25 (NT) | ||
| 26 to 34 | 5’ AATTTTTAGGTTYGGGTTTG 3’ | 5’ CCCTCCCTCTACAATACAAAA 3’ |
| 35 to 43 | 5’ TTGGTTTTTGTATTGTAGAGGG 3’ | 5’ AAACTCTTAAACCCCCAACTAA 3’ |
| 44 to 51 (NT) | ||
| 52 to 53 | 5’ ATTTGGATATATAAGGTAAGGTGGAA 3’ | 5’ ACTACCCCTTTAATTCTCATTCC 3’ |
| 64 to 65 | 5’ CCCTTCTCTAAAATAAATTTCTCT 3’ | 5’ TTAGTTGAGAGAGAAAAGTGGTA 3’ |
| 66 to 67 | 5’ ATGGTGAAAAGAGAGAGTTGATT 3’ | 5’ AAATTCCCTCTACCTCCTTTTAA 3’ |
| 68 to 70 | 5’ GGAATGTGATGTTAGGATTGTA 3’ | 5’CTTTACCTTTCATCTACAAAAA3’ |
| 71 to 73 | 5’ AAATTCTTCCTACTACCAAAAA 3’ | 5’ AGTAGATGTTTTTTGTTTTGTT 3’ |
| 74 to 78 | 5’ TTGTTTTGTTTTTTGTAGATGA 3’ | 5’ CTTTTATCAAAACCCTCCTC 3’ |
| 79 to 84 | 5’ CTCCTCCCAAAACTATTTTC 3’ | 5’ AAAAACCAAATACCTACAAAAAT 3’ |
| 85 to 87 (NT) |
Pyrosequencing
Amplification primers were designed with a biotin-label on either the forward or reverse primer and used to amplify bisulfite converted DNA on the Applied Biosystems 7900HT (Table 2). Cycling conditions were same as those described in HRM experiments. 5 μL of each amplified PCR product was immobilized in 70μL of 1X Binding Buffer pH 7.6 (10mM Tris, 2M sodium chloride, 1mM EDTA, and 0.1% Tween 20), and Streptavidin Sepharose™ High Performance beads (GE healthcare). The resulting mixture was then processed with the PyroMark™ Vacuum Prep Workstation. The processed beads and single-stranded DNA were placed in a solution of 1X annealing buffer (20mM Tris, and 2mN Magnesium acetate-tetrahydrate) and specific sequencing primer (20 pmole/μL) respective to the amplification PCR primers used (Table 2). The pyrosequencing reactions and sequence analyses were performed using the PyroMark™HS96 sequencer (Qiagen) and PyroMark MD software. Methylated standards were run in tandem with all samples as controls for pyrosequencing. All standards were within +/-5% of expected percent methylation for all analyzed regions, except for CpG sites 54-63 and CpG sites 85-87 which demonstrated skewing towards more highly methylated states than expected (>+/- 5%).
Table II. Primers utilized for pyrosequencing.
Primers utilized for PCR amplification and pyrosequencing are listed. Biotin-labeled primer is denoted with “biosg”. Sites targeted with each sequencing primer are listed in bold. Note that depending on whether reaction is forward or reverse, sites will be read in forward or reverse order as listed in table.
| CpG site | Amplification primer | Sequencing primer: Sites targeted |
|---|---|---|
| 1 to 5 | F: 5’ TTTTAGGTGAAGTTGTTGTAGGT 3’ | 5’ AGGTAGAGATGGGTTTTGTA 3’: 1, 2,3 |
| R: 5’ /5biosg/TCCCRTACAATTTCCAAAATTT 3’ | 5’ TATATAGGGAATAA 3’: 4, 5 | |
| 6 to 11 | F: 5’ TTAGGAATTTAGGTTAGAATTTAGGTTAAG 3’ | 5’ AGGTTAAGTTTGTTATAG 3’: 6, 7 |
| R: 5 ‘/5biosg/CCTATCAAAATAAAAAAACCAAAAC 3’ | 5’ ATTAATTGGGGTTTAGT 3’: 8, 9, 10, 11 | |
| 12 to 25 | Not targeted | Not targeted |
| 26-34 | F: 5’ /5biosg/ TGTATTTATTTTTTTAATTTTTAGG 3’ | 5’ TTTTTAGGTTYGGGTTTGGTG 3’: 28, 29 |
| (26;27; 30-34 not targeted) | R:5’/5biosg/CCCTCCCTCTACAATACAAAA 3’ | |
| 35 to 43 | F: 5’ /5-biosg/TTGGTTTTTGTATTGTAGAGGG 3’ | 5’ GGTTTAATTTTGTTTT 3’: 35, 36, 37, 38, 39, 40 |
| R: 5’ /5’biosg/AAACTCTTAAACCCCCAACTAA 3’ | 5’ GTTTTYGGTYGGTTYGATTT 3’: 41, 42, 43 | |
| 44 to 49 | F: 5’ AGTTGGGGGTTTAAGAGTTTTGG 3’ | 5’ GGTTTTGGTAGTGGTATAGT 3’: 44, 45, 46 |
| R: 5’ /5’biosg/AAAACCCTTCCCAAAAAAATCC 3’ | 5’ GGTGTTGGGTTTTATTTATTTAG 3’: 47, 48 | |
| 5’ GGTTTTTAGGAAAGTTGTTTGG 3’: 49, 50 | ||
| 51 | F: 5’/ 5biosg/GGGAAGGGTTTTTTATTAAGAG 3’ | 5’ AATAAAAAACCTAAAATAAC 3’: 51 |
| R: AACCCCATACAACTACAAATATAC 3’ | ||
| 52 to 53 | F: 5’ ATTTGGATATATAAGGTAAGGTGGAA 3’ | 5’ TGATATTGTGGAGATTGG 3’: 52, 53 |
| R: 5’ /5biosg/ACTACCCCTTTAATTCTCATTCC 3’ | ||
| 54 to 63 | F: 5’GATTGGGCGCGTAGTATTTTTAG 3’ | 5’ TGAGAATTAAAGGGGTAGT 3’: 54, 55, 56, 57 |
| R: 5’ /5’biosg/AACTCTATTCCCCACTAAACCAAC 3’ | 5’TTYGTGYGTTTTYGAGTGYGTG 3’: 58, 59, 60,61 | |
| 5’ TGTGTGTGATGTATAAGAAATG 3’: 62, 63 | ||
| 64 to 65 | F: 5’ GGGAAGAGATTTTATTTAAAGAGA 3’ | 5’TAAAAGTAAATAGAGGGTAG 3’: 64 |
| R: 5’ /5biosg/AATCAACTCTCTCTTTTCACCAT 3’ | 5’ TAAGTTTGATTATATGATTTTGAT 3’: 65 | |
| 66 to 67 | F: 5’ /5biosg/ATGGTGAAAAGAGAGAGTTGATT 3’ | 5’ CATTTACTCTATAAATAC 3’: 66 |
| R: 5’ AAATTCCCTCTACCTCCTTTTAA 3’ | 5’ CTCTACCTCCTTTTAAAC 3’: 67 | |
| 68 to 70 | F: 5’ /5biosg/GGAATGTGATGTTAGGATTGTA 3’ | 5’ CCAACTCCTCTTAAATTC 3’: 68, 69, 70 |
| R: 5’ CTTTACCTTTCATCTACAAAAA 3’ | ||
| 71 to 73 (71 not targeted) | F: 5’ /5biosg/TTTAAGAAGGATGATGGTTTTT 3’ | 5’ AAAATAATTACCAAAATC 3’: 72 |
| R: 5’ TCATCTACAAAAAACAAAACAA 3’ | ||
| 5’ TCATCTACAAAAAACAAAACAAC 3’: 73 | ||
| 74 to 78 | F: 5’TTGTTTTGTTTTTTGTAGATGA 3’ | 5’ GTTAAGGTTTATTATAGTTAG 3’ : 74, 75, 76 |
| R: 5’/5biosg/ CTTTTATCAAAACCCTCCTC 3’ | 5’ TTAGTGGTTTTAGGAATA 3’: 77, 78 | |
| 79 to 84 | F: 5’ GAGGAGGGTTTTGATAAAAG 3’ | 5’ GGTTTTGATAAAAGATGG 3’ : 79, 80 |
| R: 5’ /5biosg/AAAAACCAAATACCTACAAAAAT 3’ | 5’ GAGTATATTGTTGATAAG 3’: 81 | |
| 5’ ATTTTAAGGATTTATGG 3’ : 82 | ||
| 5’ GATTTTTATTGATATGTAGT 3’: 83 | ||
| 5’ TTATAAGTTTTTGTTTTTTT 3’: 84 | ||
| 85 to 87 | F: 5’/5biosg/CGATTTTTATTGATATGTAGTGGC 3’ | 5’ACRACCAAATACCACACCAC 3’: 85 |
| R: TTAACAAAAAATCCCAACTCCAAC 3’ | 5’ AACTCCAACAAATCCCC 3’: 86, 87 |
Cell culture and DNMT inhibitors
Human embryonic kidney (HEK-293T) cells were seeded onto 10cm dishes at 15% confluency for 4 day drug treatment. 24 hours after plating, cells were treated with DNMT inhibitors – 5-Azacytidine (5-aza-CR), Zebularine (Zeb), and RG-108. Doses of each drug were: 10μM for 5-aza-CR, 300 μM for Zeb, and 300μM for RG-108 (Tocris Bioscience). Re-application of 5-aza-CR was performed every 24 hours and Zeb every 48 hours. Due to extended half-life of RG-108, re-application of drug was not necessary. Cells were collected at 4 days after drug treatment and mRNA extracted for qRT-PCR analysis.
Chromatin Immunoprecipitation assay
Cortical and spinal cord tissue was dissected and minced into small pieces on ice. Total weight of processed tissue was 400-1200mg. Millipore Magna ChIP G Tissue Kit was utilized for ChIP assays. Briefly, samples were sheared in Tissue Stabilizing solution with protease inhibitor. Samples were then fixed with 1% formaldehyde for 10 minutes at room temperature. Glycine was added to samples and incubated at room temperature for 5 minutes. Samples were then washed 3x with PBS. Tissues were lysed by incubation on ice for 15 minutes in Tissue Lysis buffer with protease inhibitor. Following lysis, samples were centrifuged at 800×g for 5 minutes at 4°C. Pellet was resuspended in 500uL of Dilution buffer and protease inhibitor. Mature animal samples were sonicated on ice at 30% amplitude for 5 rounds of 20 second pulse and 50 second rest. Young animal samples were sonicated on ice at 20% amplitude for 1 round of 10 second pulse and 25 second rest. For each age, these sonication parameters produced fragments that were 200-1000 bp in size. Following sonication, samples were centrifuged at 12,000 rcf for 10 minutes at 4°C. Dilution buffer and protease inhibitor was added to each sample. For each immunoprecipitation, 1% total was removed and stored for input. Protein G magnetic beads were added to each immunoprecipitation reaction. Samples were immunoprecipitated using either IgG as a negative control, RNA polymerase II as a positive control, and DNMT1 (Abcam). All probes were used at 2.5μg and incubated at 4°C overnight. Following overnight incubation, a magnetic separator was used to remove protein G magnetic beads. Protein G bead-antibody/chromatin complex underwent serial washes with 5 minute incubation in the following order: Low Salt Immune Complex Wash buffer, High Salt Immune Complex Wash buffer, and LiCl Immune Complex Wash buffer. Finally, beads were resuspended in TE buffer. ChIP Elution buffer with proteinase K was prepared and added to each sample including input. Samples were incubated for 2 hours at 62°C in a dry incubator, followed by 10 minutes at 95°C. Magnetic separator was used to pellet beads. Supernatant was transferred to a new tube. Cleanup of DNA was performed using provided DNA purification columns. Samples were eluted from column into 50μL of Elution Buffer C. DNA samples were diluted 1:2 with TE buffer before being analyzed by quantitative PCR. Primers targeting CpG sites in CpG Island 1 (sites 20-43) and CpG Island 2 (sites 62-67) of Kir4.1 were used. Fold expression analysis relative to IgG negative control was used determine DNMT interaction with Kir4.1 DNA at targeted regions.
Generation of methylated and non-methylated 4.1-CpG-luc plasmids
CpG islands 1 -3 sequence (CpG 1: from -886 to +311; CpG 2: from +15,549 to +16062; CpG 3: from +28,050 to +28,488) was amplified by PCR and cloned upstream of the luc2 Firefly luciferase reporter gene (pGL4.10 vector, Promega). 4.1-CpG-luc plasmids were linearized with SacI-HF. Plasmids were treated with CpG methylase (M.SssI, ZymoResearch) overnight at 30°C or left un-methylated. Following cleanup using Qiagen, methylated and non-methylated plasmids were subjected to double restriction digest overnight at 37°C. Digested DNA was run on 1% agarose gel; methylated and non-methylated insert and non-methylated vector were excised from gel and purified using phenol extraction (Fisher BioReagents). Methylated and non-methylated inserts were re-ligated using T4 DNA ligase (NEB) to non-methylated vector. Ligated samples were purified using QIAquick ® Gel Extraction Kit (Qiagen).
Luciferase reporter assay
D54 cells were seeded onto 12-well plate at 0.14×10⁶ cells/well. After 24 hours, equal concentrations of methylated or non-methylated 4.1-CpG-luc plasmids were transfected into D54 cells using Lipofectamine ® LTX and Plus Reagent (Invitrogen by Life Technologies). 200ng of pGL4.74[hRluc/TK] (Renilla luciferase Promega) vector was co-transfected as a control reporter gene. Dual luciferase assay was performed according to manufacturer’s recommendations (Dual-Luciferase Reporter Assay System, Promega). Briefly, 24 hours after transfection cells were lysed using Passive Lysis Buffer for 15 minutes with agitation. Luminometer (TD-20/20 Luminometer Turner Designs) was used to read samples. 20μL of cell lysis was added to 100μL of Luciferase Assay Reagent II. Sample was mixed by pipetting and Firefly luciferase activity was measured. Immediately after, 100μL of Stop and Glo ® Reagent was added; sample was vortexed and Renilla luciferase activity measured. Ratio of Firefly luciferase activity to Renilla luciferase activity was obtained. Data presented as relative light units normalized to non-methylated plasmid activity.
Statistics
Kruskal-Wallis test was performed on MS-HRMA and pyrosequencing data. Kruskal-Wallis was chosen to taken into account that data represented percentages that fell outside of 30-70%. One-way ANOVA analysis was utilized to determine significance in HEK and DNMT inhibitor in vitro assay and FACS methylation studies. Two way ANOVA was performed for analysis of ChIP data. One-tailed t-test was performed to determine statistical significance for methylated versus non-methylated promoter activity. For all data sets, the mean is reported with error bars representing s.e.m. Number of Ns is indicated and P-values are reported in text.
Results
Developmental upregulation of Kir4.1 is coincident with increased mRNA transcription
Astrocytes represent a heterogeneous cell population; once unappreciated variable protein expression is now recognized as providing the means for diverse phenotypes and functions (Oberheim et al., 2012). Acknowledging the significant role astrocytic heterogeneity plays in CNS functioning, we commenced with a detailed examination of Kir4.1 protein expression through development in various regions of the CNS including the cortex (C), hippocampus (H), cerebellum (M), brain stem (BS), and spinal cord (SC) in rats. Western blot analysis of Kir4.1 protein demonstrates robust developmental increases in Kir4.1 protein irrespective of the brain region from postnatal day 0 (p0) and continuing through p7, p14, p28, and p100 (representative western blots shown, n=2 for each age) (Fig. 1A-E). Densitometric analysis of the cortical western blot serves as a representative quantification of developmental increases in Kir4.1 expression (Fig. 1G). Interestingly, we found that while each assessed region demonstrates robust developmental upregulation, there are region-specific differences of Kir4.1 expression. In general, there is an increase in Kir4.1 expression moving along the rostrocaudal axis. Examining Kir4.1 protein expression at one developmental time point, p28, we observed dramatic increases in protein expression in the brain stem and spinal cord relative to protein expression levels observed in the cortex (Fig. 1F and 1H).
Figure 1. Kir4.1 protein undergoes robust developmental upregulation, with region-specific levels of expression.
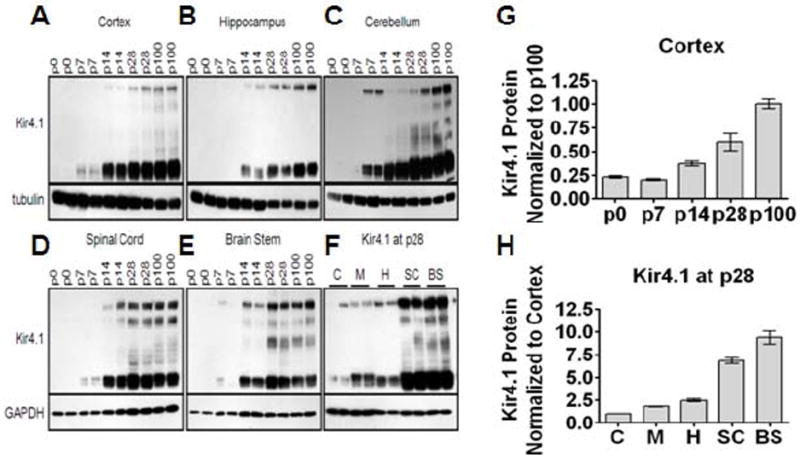
(A-E) Western blotting shows that Kir4.1 protein increases with increasing age from p0 to p100 in various brain regions. Kir4.1 appears as a monomer and tetramer at approximately 50 kDa and 200 kDa, respectively. Tubulin or gapdh were used as loading controls. (G) Densitometric analysis of cortical western blot provides representative quantification of developmental upregulation of Kir4.1. (F) Protein analysis of various brain regions at one age, p28, reveals region-specific expression levels of Kir4.1. Cortex (C), hippocampus (H), and cerebellum (M) possess lower levels of Kir4.1 protein compared to spinal cord (SC) and brain stem (BS) which demonstrate highest levels of Kir4.1 protein. (H) Densitometric analysis quantifies region-specific levels of Kir4.1 expression in the CNS.
To determine if Kir4.1 protein expression is transcriptionally regulated, we next examined mRNA levels of Kir4.1 through development across multiple brain regions. We observed that increases in Kir4.1 protein during early development are paralleled by increased transcription of the Kir4.1 gene, KCNJ10 (n=3 for each age and brain region, samples ran in triplicate) (Fig. 2A). KCNJ10 mRNA expression increases 10-fold in hippocampus and cortex from birth to young adulthood. During this same time period, mRNA expression levels peak over 25-fold in brainstem and spinal cord; and initial gene expression in these caudal brain regions precedes that seen in the forebrain. Because the astrocyte population is rapidly expanding during the first three postnatal weeks (Bandeira et al., 2009), we next sought to address whether these increases were due to increased numbers of astrocytes, or rather, increased transcription of Kir4.1 in individual astrocytes. To address this question, we employed transgenic rats expressing enhanced green fluorescent protein (eGFP) under the S100β promoter. S100β is a soluble calcium binding protein that is used as a marker for astrocytes (Ludwin et al., 1976;Cahoy et al., 2008). Representative images obtained from the cortex of a 4-week old eGFP-S100β are shown in Figure 2B and Figure 2C. Double labeling with GFAP (red) indicated eGFP expression was confined to GFAP-positive astrocytes (Fig. 2C). The eGFP expression in astrocytes enabled fluorescent activated cell sorting (FACS) to isolate an enriched astrocyte population. As expected, GFAP mRNA was significantly increased, while MAP2, a neuronal marker, was significantly decreased (Fig. 2D and 2E). qPCR from FACS sorted and non-FACS sorted cortical tissue demonstrates a significant enrichment of Kir4.1 mRNA (2.5-fold and 12.6-fold increase in Kir4.1 was observed in 1 week (p5-7) and three week (p20-21) FACS sorted animals, respectively, compared to their non-FACS, sorted age-matched counterparts, n=3 for each age and sorted versus non-sorted samples) (Fig. 2F). Furthermore, these data demonstrate that in a relatively pure astrocyte population with stable expression of GAPDH during the examined developmental time points. Kir4.1 expression is enhanced 10-fold in three week old animals relative to animals in the first postnatal week, indicating Kir4.1 expression is upregulated in individual astrocytes.
Figure 2. KCNJ10 mRNA levels parallel developmental increases in Kir4.1 protein.
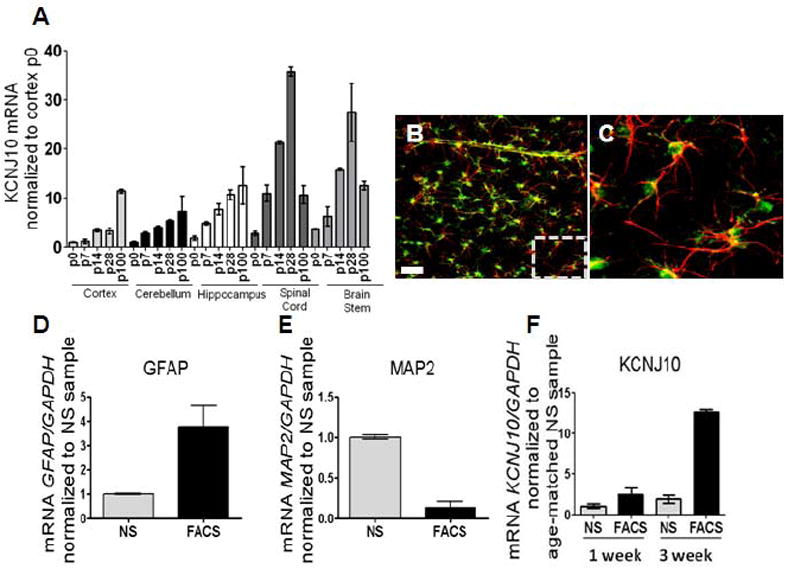
(A) qPCR analysis shows increases in KCNJ10 transcript from p0 to p100 in cortex, cerebellum, and hippocampus. A 25- and 15-fold decrease of KCNJ10 transcript is observed in spinal cord and brain stem, respectively at p100. For qPCR analysis, fold expression is relative to gapdh and normalized to p0 of the cortex (n=3 for all brain regions and ages). (B and C) Representative image of cortical brain slice from transgenic eGFP-S100β animals used in FACS sorting experiments are shown. GFAP (red) staining demonstrates co-localization of eGFP expression with GFAP positive astrocytes. Dashed box denotes zoomed region displayed in Fig. 2C. Scale bar is 50μm. (D and E) qPCR analysis of GFAP and MAP2 was utilized as a control for FACS; simultaneous increases in GFAP with reductions in MAP2 are observed in FACS cells compared to not sorted (NS). (F) Compared to not sorted (NS) samples, FACS of eGFP+ astrocytes (FACS) demonstrate a 2.5- and 12.6-fold enrichment of KCNJ10 transcript at one week (p5-7) and three week (p20-21) aged animals, respectively. Error bars represent s.e.m.
Kir4.1 transcription levels correlate with decreased methylation of the gene
We next sought to understand how transcriptional regulation of Kir4.1 was occurring. Several studies suggest DNA methylation is involved in astrocyte development (Shimozaki et al., 2005;Fan et al., 2005;Teter et al., 1996). Given the coincident changes in mRNA and protein, we hypothesized that developmental increases in Kir4.1 protein are mediated by transcriptional regulation, specifically a decrease in DNA methylation of the Kir4.1 gene. To investigate the role of DNA methylation in developmental regulation of Kir4.1 expression, we first performed an in silico analysis of the Kir4.1 gene, KCNJ10. A schematic of the in silico analysis of KCNJ10 indicates three cytosine-phosphodiester-guanine (CpG) islands (Fig. 3). CpG islands are regions of DNA that contain a high percentage of CpG dinucleotides and are sites of transcriptional regulation by DNA methylation. A total of 87 CpG sites were found in all the 3 CpG islands of Kir4.1.
Figure 3. In silico analysis of KCNJ10 gene reveals 3 CpG islands.
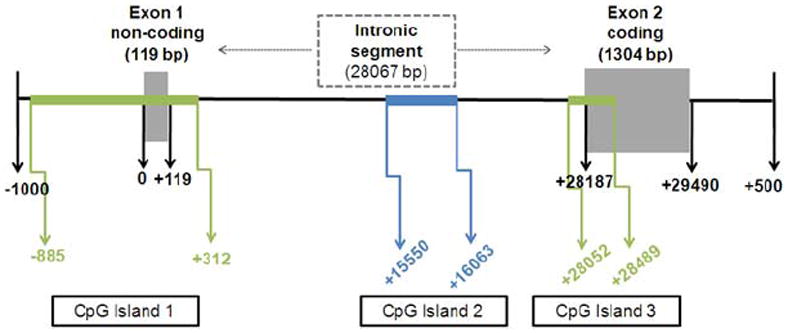
Kir4.1 rat sequence was entered into Applied Biosystems Methyl Primer Express. 3 CpG islands were identified. CpG Island 1 is 1198 bp and spans the first non-coding exon. CpG island 2 is 514 bp and is found in the intronic segment. CpG island 3 is 438 bp and overlaps with the second coding exon, including the transcriptional start site of this exon.
Using two complimentary techniques, methylation-sensitive high resolution melt analysis (MS-HRMA) and pyrosequencing, the methylation status of Kir4.1 CpG islands was examined. While we utilized FACS to isolate an enriched population of astrocytes for mRNA analysis of Kir4.1, we opted to utilize whole tissue due to the low viability of cells acquired when disrupting tissue for FACS from animals aged >p20. For the MS-HRMA experiments, primers were designed to target each CpG island in its entirety (Table 1). Because the cortex and spinal cord demonstrated significantly different levels and patterns of protein and mRNA expression, we focused our efforts on examining these two contrasting brain regions (Fig. 1F). Cortical and spinal cord DNA was extracted from animals aged p0, p28 and p60 and subjected to bisulfite conversion. Melt curves of the amplified product at each age from cortex and spinal cord were compared to a methylated standard ranging from 0 to 100%. The estimated percent methylation of each amplicon was calculated utilizing a linear regression analysis against the methylated standards. Using this method, we found a significant decrease (n=4, p<0.05, Kruskal Wallis) in the methylation status in 9 of 12 targeted regions in the cortex (Fig. 4A) and 7 of 12 targeted regions in the spinal cord through development (Fig. 4B). While MS-HRMA provides semi-quantitative information on the methylation status of a group of CpG sites, pyrosequencing was utilized to provide highly quantitative methylation status of single nucleotides. Therefore, we next generated amplification primers with a biotinylated tag on either forward or reverse amplification primer and sequencing primers to target each CpG site in the KCNJ10 gene for pyrosequencing (Table 2). For these experiments we were able to target 80% of all CpG sites associated with the Kir4.1 CpG islands. Data obtained from these experiments demonstrates that of the sites that were successfully targeted, approximately 54% (cortex) and 42% (spinal cord) demonstrated a significant decrease in methylation with increasing age (n=4, except p60 SC where n=3, Kruskal Wallis) (Fig. 4C and Table 3 and Table 4). For cortex and spinal cord, CpG island 1 possessed a lower state of methylation (of sites demonstrating statistically significant change, the median % methylation was 31.95 and 13.13 at p60 in cortex (C) and spinal cord (SC), respectively) compared to CpG island 2 (median % methylation of 72.53 (C) and 50.48 (SC) at p60) and CpG island 3 (median % methylation of 80.06 (C) and 71.1 (SC) at p60) (Table 3 and Table 4). Despite the similar trends, we found that the spinal cord demonstrated lower states of methylation at earlier developmental time points. These data parallel mRNA and protein expression levels of Kir4.1 in the cortex and spinal cord and support the hypothesis that developmental increases in Kir4.1 are mediated, at least in part, by alterations in DNA methylation patterns of the gene.
Figure 4. KCNJ10 demonstrates differential methylation during development.
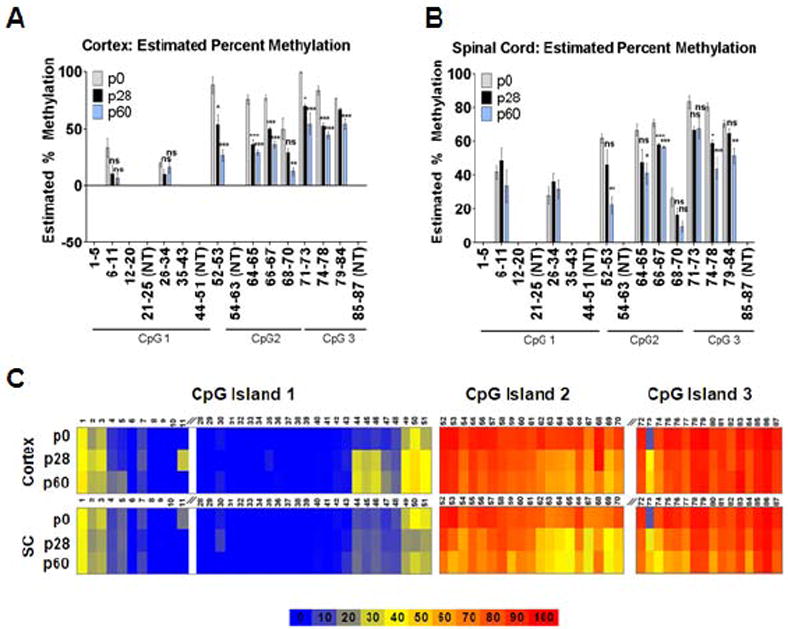
Methylation status of Kir4.1 CpG islands was assessed via MS-HRMA in cortical (A) and spinal cord tissue (B) from animals aged p0, p28 and p60. CpG sites within each region are labeled. Sites that were not targeted (NT) are indicated. CpG 1 demonstrates lowest levels of methylation in both cortex and spinal cord. 9 of 12 regions and 7 of 12 regions in cortex and spinal cord, respectively, demonstrate decreases in methylation with increasing age. For both brain regions: n=4; error bars represent s.e.m.; * (P<0.05); ** (P<0.01) *** (P<0.001). (C) Heat map representation of percent methylation of CpG sites found in Kir4.1 CpG islands 1-3 is shown. Sites were analyzed via pyrosequencing at ages p0, p28, and 60 in both cortex and spinal cord (SC). Cortex and spinal cord demonstrate parallel patterns of methylation; however SC shows lower levels of methylation at 54.3% of total targeted CpG sites. Of the sites that demonstrated significant changes in both cortex and spinal cord, 95.5% of these possess lower levels of methylation in SC. Table S3 and Table S4 summarizes sites that demonstrate significant changes over age. For each age n=4, except SC at p60 n=3.
Table III. Sites demonstrating significant change in methylation in cortex.
CpG sites that demonstrated statistically significant change over age in cortex. Statistically significant sites are listed with associated p-values.
| Age | p-value | |||||
|---|---|---|---|---|---|---|
| CpG Site | p0 | p28 | p60 | p0 vs p28 | p0 vs p60 | p28 vs p60 |
| Site 1 | 35.275 | 37.625 | 41.7 | 0.2933 | 0.0138 | 0.0849 |
| Site 2 | 21.775 | 29.5 | 25.725 | 0.0034 | 0.0751 | 0.0867 |
| Site 7 | 9.55 | 12.725 | 7.975 | 0.0451 | 0.2785 | 0.007 |
| Site 44 | 6.975 | 30.95 | 32.775 | 0.0001 | 0.0001 | 0.1853 |
| Site 45 | 6.1 | 27.3 | 28.35 | 0.0001 | 0.0001 | 0.3576 |
| Site 46 | 8.25 | 29.825 | 31.95 | 0.0001 | 0.0001 | 0.023 |
| Site 47 | 5.55 | 15.2 | 20.075 | 0.0001 | 0.0001 | 0.0001 |
| Site 48 | 9.975 | 12.175 | 14.775 | 0.0356 | 0.0004 | 0.0171 |
| Site 49 | 25.15 | 35.775 | 39.9 | 0.0001 | 0.0001 | 0.0074 |
| Site 50 | 34.95 | 44.7 | 45.275 | 0.002 | 0.0014 | 0.8062 |
| Site 51 | 25.25 | 37.175 | 36.4 | 0.0001 | 0.0001 | 0.4211 |
| Site 52 | 94.3 | 91.15 | 90.525 | 0.0114 | 0.0042 | 0.5453 |
| Site 54 | 84.425 | 73.875 | 69.9667 | <0.0001 | <0.001 | 0.1159 |
| Site 55 | 90.6 | 85.825 | 84.2333 | 0.0012 | 0.0003 | 0.1715 |
| Site 56 | 92.75 | 79.1 | 74.8333 | <0.0001 | <0.001 | 0.006 |
| Site 57 | 91.2 | 85.45 | 82.1 | <0.0001 | <0.0001 | 0.0005 |
| Site 59 | 84.525 | 78.85 | 73.6 | 0.0551 | 0.004 | 0.0909 |
| Site 60 | 85.9 | 78.875 | 75.5 | 0.0013 | 0.0002 | 0.065 |
| Site 61 | 82.4 | 76.8 | 72.5333 | 0.0047 | 0.0002 | 0.0255 |
| Site 62 | 90.025 | 67.225 | 68.4667 | <0.0001 | 0.0002 | 0.7247 |
| Site 63 | 83.15 | 64.25 | 59.5 | <0.0001 | <0.0001 | 0.0027 |
| Site 64 | 84.35 | 62.1 | 59.7 | <0.0001 | <0.0001 | 0.1159 |
| Site 65 | 85.8 | 58.675 | 55.5 | <0.0001 | <0.0001 | 0.0964 |
| Site 66 | 87.725 | 78.4 | 74.925 | 0.0007 | <0.0001 | 0.0945 |
| Site 68 | 92.45 | 94.225 | 68.975 | 0.7367 | 0.0013 | 0.0008 |
| Site 70 | 84.45 | 66.45 | 61.35 | <0.0001 | <0.0001 | 0.0569 |
| Site 72 | 91.45 | 83.2 | 80.275 | <0.0001 | <0.0001 | 0.0436 |
| Site 74 | 83.325 | 67.975 | 64.8 | <0.0001 | <0.0001 | 0.002 |
| Site 75 | 93.8 | 84.225 | 80.075 | <0.0001 | <0.0001 | 0.0031 |
| Site 76 | 92.4 | 83.4 | 83.875 | 0.0024 | 0.0033 | 0.8306 |
| Site 77 | 84.5 | 76.575 | 74.8 | 0.0002 | <0.0001 | 0.2051 |
| Site 78 | 95.05 | 91.175 | 91.225 | 0.0212 | 0.0225 | 0.9721 |
| Site 79 | 97.575 | 90.575 | 92.725 | 0.0043 | 0.0277 | 0.2748 |
| Site 80 | 86.825 | 80.05 | 78.125 | 0.0022 | 0.0004 | 0.2595 |
| SIte 84 | 86.9 | 78.725 | 78.525 | <0.0001 | <0.0001 | 0.8216 |
| Site 85 | 93.375 | 91.05 | 91.375 | 0.0053 | 0.0119 | 0.6216 |
| Site 86 | 98.075 | 95.1 | 94.925 | 0.0149 | 0.0112 | 0.8638 |
| Site 87 | 91.55 | 85.125 | 84.475 | <0.0001 | <0.0001 | 0.2106 |
Table IV. Sites demonstrating significant change in methylation in spinal cord.
CpG sites that demonstrated statistically significant change over age in SC. Statistically significant sites are listed with associated p-values.
| Age | p-value | |||||
|---|---|---|---|---|---|---|
| CpG Site | p0 | p28 | p60 | p0 vs p28 | p0 vs p60 | p28 vs p60 |
| Site 7 | 10.725 | 5.375 | 9.83333 | 0.0227 | 0.6756 | 0.0617 |
| Site 11 | 17 | 0 | 0 | 0.032 | 0.0432 | 1 |
| Site 46 | 11.7667 | 14 | 14.6667 | 0.0092 | 0.0034 | 0.3228 |
| Site 47 | 7.26667 | 9.35 | 11.6 | 0.0047 | 0.0001 | 0.0032 |
| Site 50 | 38 | 20.35 | 30.3 | 0.0391 | 0.3359 | 0.1966 |
| Site 51 | 33.3 | 23.375 | 26.4667 | <0.0001 | 0.0004 | 0.0198 |
| Site 52 | 91.75 | 85.55 | 70.9333 | <0.0001 | <0.0001 | <0.0001 |
| SIte 53 | 94.6 | 74.5 | 55.1 | <0.0001 | <0.0001 | <0.0001 |
| Site 54 | 77.9667 | 58.675 | 60.8333 | <0.0001 | <0.0001 | 0.2604 |
| Site 57 | 87.25 | 78.35 | 70.5667 | 0.0004 | <0.0001 | 0.0004 |
| Site 64 | 69.9 | 44.05 | 39.5333 | <0.0001 | <0.0001 | 0.0334 |
| Site 65 | 72.95 | 38.325 | 35.5333 | <0.0001 | <0.0001 | 0.1445 |
| Site 66 | 84.675 | 69.4 | 57.5333 | 0.0002 | <0.0001 | 0.0015 |
| Site 67 | 66.725 | 33.525 | 34.1333 | 0.0025 | 0.0043 | 0.9433 |
| Site 69 | 71.55 | 37.275 | 35.4 | <0.0001 | <0.0001 | 0.5678 |
| Site 70 | 80.5 | 48.675 | 45.8667 | <0.0001 | <0.0001 | 0.057 |
| Site 72 | 88.025 | 75.4 | 71.2333 | <0.0001 | <0.0001 | 0.016 |
| Site 74 | 79.45 | 53.775 | 40.7 | <0.0001 | <0.0001 | <0.0001 |
| Site 75 | 92.025 | 74 | 57.9333 | <0.0001 | <0.0001 | <0.0001 |
| Site 76 | 88.4 | 75.7 | 61.3 | <0.0001 | <0.0001 | 0.0001 |
| Site 77 | 81.225 | 68.075 | 55.2 | <0.0001 | <0.0001 | <0.0001 |
| Site 78 | 93.075 | 87.9 | 83.2 | 0.0307 | 0.0017 | 0.0587 |
| Site 79 | 93.825 | 88.7 | 82.4333 | 0.026 | 0.0005 | 0.015 |
| Site 80 | 80.525 | 70.7 | 58.3667 | 0.0002 | <0.0001 | 0.0001 |
| Site 81 | 85.5 | 80.45 | 76.4 | 0.0018 | <0.0001 | 0.0094 |
| Site 82 | 80.475 | 79 | 70.9667 | 0.3779 | 0.0005 | 0.0015 |
| Site 83 | 91.175 | 88.075 | 82.8333 | 0.0063 | <0.0001 | 0.0004 |
| Site 84 | 83.025 | 73.075 | 58.3667 | <0.0001 | <0.0001 | <0.0001 |
| Site 85 | 92.3333 | 91.45 | 84.8 | 0.7744 | 0.0491 | 0.0598 |
| Site 87 | 89.9333 | 82.8 | 76.6333 | <0.0001 | <0.0001 | <0.0001 |
We questioned whether we would observe similar changes in the methylation status of KCNJ10 in an isolated population of astrocytes. Thus, using FACS sorted astrocytes from animals aged 1 week (p3-4), 3 week (p19-22), and 7 week (p41-54), we assessed the methylation status of KCNJ10 in CpG island 2 and 3, two regions that demonstrate significant changes in methylation during development (Fig. 5A and 5B). Parallel to our studies in whole-tissue homogenate, we observed reductions in the methylation status during development (Fig. 5). Interestingly, the methylation status of KCNJ10 was lower in nearly every CpG site in FACS sorted astrocytes compared to whole-tissue homogenate. These data suggests that the inclusion of cell types that do not express Kir4.1 skewed the data towards higher states of methylation as these cell types would be silencing the gene via methylation. Overall, these studies demonstrate that reductions in DNA methylation of the KCNJ10 occur in astrocytes during development.
Figure 5. FACS sorted astrocytes demonstrate similar reductions in the DNA methylation status of KCNJ10.
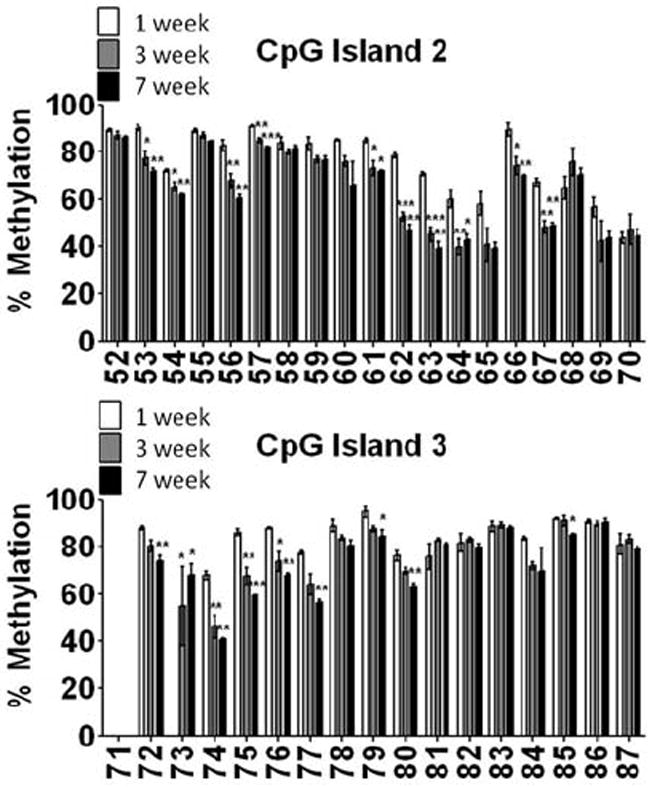
EGFP+ astrocytes were FACS sorted and genomic DNA isolated from 1 week, 3 week and 7 week old animals (3-4 animals/group). Pyrosequencing was performed to assess the DNA methylation levels of each individual CpG site in CpG island 2 (A) and CpG island 3 (B) at each time point, error bars represent s.e.m.; * (P<0.05); ** (P<0.01) *** (P<0.001). Similar to that observed in DNA isolated from whole brain homogenate, DNA isolated from an enriched population of astrocytes demonstrated reduced levels of DNA methylation with maturation.
DNA methyltransferase 1 (DNMT1) physically interacts with Kir4.1 gene
DNMT1 is implicated in maintenance of DNA methylation (Teter et al., 1996). Additionally, multiple studies suggest this enzyme is active in astrocytes (Shimozaki et al., 2005;Fan et al., 2005;Teter et al., 1996). Our data shows that early in astrocyte development, the Kir4.1 gene is hyper-methylated at several CpG sites. We postulated that there would be an augmented interaction between DNMT-1 and CpG sites shown to possess high levels of DNA methylation during this same early developmental period. To test this, we performed a ChIP analysis probing for DNMT1 protein interaction with Kir4.1 CpG sites (Fig. 6). Because spinal cord demonstrates a more robust and continued incremental decrease from p28 to p60 in more CpG sites compared to the cortex (Table 3 and Table 4), we utilized spinal cord tissue for our ChIP analysis. Results from these experiments show that CpG sites with decreased levels of methylation (CpG sites 20-43) have lower levels of interaction with DNMT1 with no significant change in interaction with DNMT1 during the observed ages (3.7- and 3.9-fold enrichment, from p0 to p60, respectively – data relative to IgG background signal; n=3, one-way ANOVA) (Fig. 6A). Conversely, highly methylated CpG sites (CpG sites 62-67) have high levels of interaction with DNMT1 in early development, with robust reductions of this interaction through development (14.0- to 1.8-fold enrichment, from p0 to p60, respectively; n=3, one-way ANOVA) (Fig. 6B). Our data suggest a dynamic interaction of DNMT1 with Kir4.1 CpG sites. Notably, sites that demonstrate the most robust decreases in DNA methylation during development also show the most significant decreases in DNMT1 interaction. Given the role of DNMT-1 in mediating DNA methylation, these data provide mechanistic support for how observed changes in the DNA methylation of Kir4.1 may be occurring during development.
Figure 6. DNMT1 demonstrates dynamic interaction with Kir4.1 DNA during development.
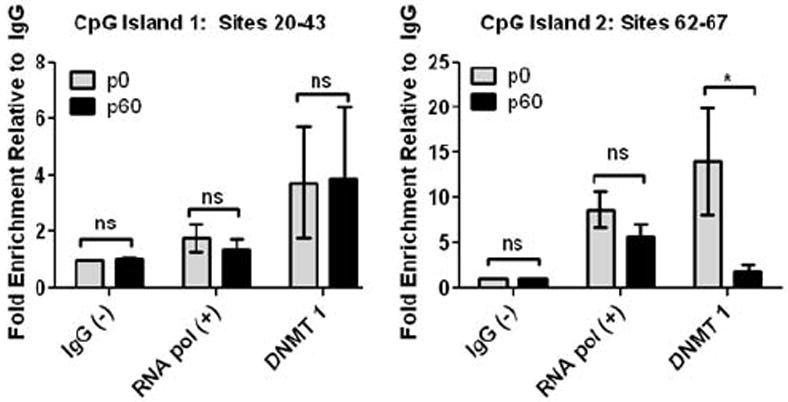
Chromatin immunoprecipitation and subsequent qPCR analysis (ChIP-qPCR) was used to assess DNMT1 interaction with Kir4.1 at two regions that demonstrated contrasting levels and age-related changes in methylation. IgG was used as a negative control and for normalization of background signal. RNA polymerase II was used as a positive control. Sites 20-43 found in CpG Island 1 contained low, stagnant levels of methylation during aging, while sites 62-67 found in CpG Island 2 contained higher levels of methylation that decreased significantly during aging. (A) ChIP analysis reveals that sites assessed in CpG island 1 demonstrate little change in DNMT1 interaction during aging from p0 to p60, fold enrichment of 3.74 and 3.89, respectively. (B) Conversely, sites assessed in CpG island 2 exhibit a decrease in DNMT 1 interaction during development, fold enrichment of 14.02 at p0 versus 1.81 at p60. For each age n=3; error bars represent s.e.m. * (P<0.05).
DNA methylation governs Kir4.1 transcription
Given the coincident hypo-methylation of the Kir4.1 gene and increased gene transcription during development, we next postulated that a global decrease in methylation would be sufficient to drive Kir4.1 transcription. We utilized human embryonic kidney cells 293 (HEK293) - a cell line that normally does not express Kir4.1 - in an in vitro system to drive Kir4.1 expression (Fig. 7A). DNA methyltransferase (DNMT) inhibitors – 5-Azacytidine (5-aza), Zebularine (Zeb), and RG-108 - each with unique half-life properties and mechanisms for preventing DNA methylation were employed to prevent DNA methylation. We found an increase in Kir4.1 transcription as measured by qPCR using each DNMT inhibitor at 4 days of treatment. Application of 10μM 5-aza produced a nearly 5-fold increase (n=3, p<0.0001, one-way ANOVA). Zebularine and RG 108 were well tolerated by the cells and produced a nearly 9- and 3- fold increase in Kir4.1 transcription, respectively n=3, p<0.001 and p<0.05, one-way ANOVA) (Fig. 7A). These data suggest that DNA demethylation is sufficient to drive Kir4.1 transcription.
Figure 7. DNMT inhibitors can drive Kir4.1 transcription in vitro.
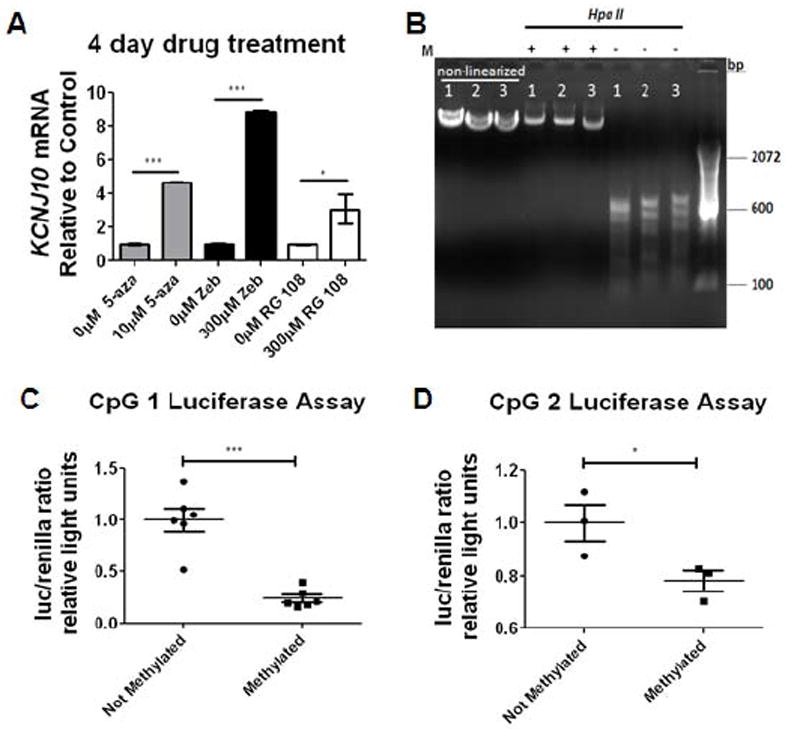
(A) Application of 5-aza, Zebularine (zeb), and RG-108 results in significant increases of Kir4.1 transcription at 4 days following drug treatment. Samples were normalized to gapdh and fold expression is relative to control of each drug (indicated by 0μM). n=3 individual experiments; error bars represent s.e.m.; * (P<0.05); ** (P<0.01) *** (P<0.001). (B) Schematic of methylation of CpG Kir4.1 CpG island is diagrammed. Plasmids were cut releasing Kir4.1 CpG island and then methylated using CpG methylase. Following methylation, CpG island was re-ligated back to non-methylated luc2 (luciferase) plasmid. Methylation (M) of 4.1-CpG 1-3-luc was verified by Hpa II digestion. Hpa II only digests non-methylated DNA. (C, D) Luciferase reporter assay demonstrates that methylation of CpG island 1 and 2 resulted in reduced promoter activity (***p<0.0001 and * p=0.0257; n=6 and n=3). Error bars represent s.e.m.
DNMT inhibition using pharmacological methods results in global, non specific demethylation of DNA. We next wished to specifically assess the activity of a highly methylated versus non-methylated Kir4.1 promoter. In a final set of experiments, we utilized an in vitro luciferase assay system to measure promoter activity of Kir4.1 in a glial-derived human brain tumor cell line, D54. Each CpG island of the Kir4.1 gene was PCR amplified and cloned upstream of the luciferase reporter (luc2) to produce 4.1-CpG1-, 4.1-CpG2-, and 4.1-CpG3-luc plasmid. Plasmids were linearized and either treated with CpG methylase (M.Sssl) to methylate the plasmid or left un-methylated (non-methylated control plasmids were generated similarly to methylated plasmids, except they received no exposure to CpG methylase) (Fig 7B). Methylation status of both methylated and non-methylated plasmids were verified by HpaII digestion which only digests un-methylated sites (Fig. 7B). To ensure methylation of luc2 gene did not compromise results, both methylated and non-methylated plasmids were restriction digested to relinquish 4.1-CpG1-3 insert. Non-methylated vector was re-ligated to either methylated insert or non-methylated insert. Either methylated or non-methylated 4.1-CpG-luc plasmids were transfected into D54 cells (Fig. 7C and 7D). Luciferase levels were assessed as an indicator of promoter activity. Our data demonstrates a significant decrease in luciferase reporter activity in cells transfected with a methylated 4.1-CpG 1-luc (Fig. 7C) and 4.1-CpG 2-luc (Fig. 7D) (n=6 and n=3, p<0.0001 and p=0.0257, one-tailed t-test). In contrast, we found no significant change in the transcriptional activity of methylated compared to non-methylated 4.1-CpG 3-luc (data not shown). Overall, these studies provide a casual role for DNA methylation regulating transcription levels of the Kir4.1 gene.
Discussion
Here we examine the epigenetic regulation of Kir4.1, a glial-specific K + channel, known to be essential for normal CNS development. With a growing list of CNS illnesses being linked to Kir4.1 – ALS, MS, seizures and epilepsy, SeSAME, and injury – the importance of better understanding the normal and pathological role as well as regulation of Kir4.1 cannot be overstated (Scholl et al., 2009; Sicca et al., 2011; Buono et al., 2004; Bockenhauer et al., 2009; Srivastava et al., 2012; Bataveljic et al., 2012). We provide substantial evidence that DNA methylation functions as a powerful regulator of Kir4.1 transcription in the CNS during development.
Region-specific expression of Kir4.1 in the CNS: an emergent player in the specialization of astrocytes
In the CNS it has been demonstrated that a single action potential can increase [K+]e by as much as 1 mM (Ransom et al., 2000). Kir4.1 mediated K+ buffering is a mechanism for removing this [K+]e, which requires no energy. The importance of Kir4.1 in brain and spinal cord astrocytes, and its role in K+ homeostasis, has been demonstrated using Kir4.1 targeted siRNA in rats and mice (Kucheryavykh et al., 2007), and in situ using conventional and conditional knockout animals (Djukic et al., 2007; Neusch et al., 2001). Collectively, these studies examining astrocytes from the cortex, hippocampus, spinal cord and retina show astrocytes lacking Kir4.1 are devoid of inwardly rectifying current, have significantly increased input resistances, are depolarized and demonstrate deficient potassium clearance. Notably, this inadequate K+ clearance occurs in conditions when [K+]e reaches abnormally high levels as would be seen during high frequency discharge. Interestingly, Kir4.1 global and glial specific knock-out animals exhibit seizures, ataxia and premature death (p12-p25) (Djukic et al., 2007). It should be noted that while we focus on the expression of Kir4.1 in astrocytes and its role in potassium buffering, Kir4.1 is expressed in other glial cell populations including oligodendrocytes and oligodendrocyte precursor cells (OPCs) (Kalsi et al., 2004b; Maldonado et al., 2013). Naturally, the consequences of losing Kir4.1 expression within these cell populations should not be underestimated and likely contributes to the abnormal phenotype observed in Kir4.1 KO animals.
Given the increased clinical relevance of Kir4.1 expression, we sought to develop a more comprehensive understanding of the protein expression pattern of Kir4.1 in the CNS. In accordance with past studies, we found a significant increase during early postnatal development of Kir4.1 expression in all CNS regions examined. These data are supported by many electrophysiology studies demonstrating Kir4.1 channel activity increases during the first several postnatal weeks both in vitro (MacFarlane and Sontheimer, 2000; Olsen and Sontheimer, 2004) and in situ (Seifert et al., 2009; Bordey and Sontheimer, 1997). The most striking increase in expression occurred in postnatal week two and three. Interestingly, we found brain-region specific differences in the expression pattern of Kir4.1 suggesting specialization of distinct astrocyte populations. The spinal cord and brain stem demonstrate earlier and more robust increases in Kir4.1 protein. Differential protein expression pattern of Kir4.1 may reflect differing demands on K+ clearance. Recent work demonstrated modest elevations in [K+]e was sufficient to induce motor neuron cell death (Pineda and Ribera, 2008;Kaiser et al., 2006). Furthermore, in the developing spinal cord, an increase in [K+]e of approximately 2 mM over baseline for 24 hours altered motor neuronal excitability by altering the number of functional potassium channels on the neuron itself (Pineda and Ribera, 2008). These data suggest this region of the CNS is highly specialized; neurons here appear particularly sensitive to fluctuations in [K+]e, thus necessitating a more effective mechanism for K+ clearance. This idea is substantiated by findings in both Kir4.1 global and glial specific KO animals, where the most profound pathology, including hypomyelination, axonal swelling and degeneration occurred in the spinal cord (Neusch et al., 2001).
A role for DNA methylation in the regulation of Kir4.1 gene expression
Astrocytes derive from neural precursor cells late in development (Shimozaki et al., 2005). This cellular specialization requires epigenetic regulation of gene transcription (Shimozaki et al., 2005). Astrocyte specific genes are often demethylated in late stage neural precursor cells allowing for transcription just prior to astrocyte differentiation (Hatada et al., 2008; Teter et al., 1996). Interestingly, conditional knock-out of DNA methyltransferase-1 (DNMT1) in neural precursor cells leads to DNA hypo-methylation which is sufficient to induce precocious astrocyte differentiation (Fan et al., 2005). These studies suggest epigenetic regulation of gene transcription, particularly DNA methylation, plays an important role in astrocyte development. To gain insight into the regulation of Kir4.1 protein expression during normal development, we assessed mRNA levels of Kir4.1 during development. We found that increases in Kir4.1 protein are paralleled by increases in mRNA. Our findings demonstrate that mRNA levels are highly reflective of the region-specific variances of Kir4.1 protein expression found in the CNS during development, suggesting transcriptional regulation of Kir4.1.
Using two complimentary techniques to assess DNA methylation levels – MS-HRMA and pyrosequencing - we found that levels of DNA methylation of the Kir4.1 CpG islands correlate strongly with gene transcription levels. For example, the spinal cord which exhibits higher levels of gene transcription possesses lower levels of methylation at all examined ages – p0, p28, and p60 – compared to the cortex. Additionally, decreases in methylation status were evident at earlier time points in the spinal cord compared to cortex. These data suggest DNA methylation functions as a classic negative regulator of Kir4.1 expression and may play a role in mediating region-specific expression patterns of Kir4.1. We opted to determine whether observed changes in DNA methylation were specific to a glial cell population. Using eGFP FACS sorted astrocytes, we confirmed similar reductions in the methylation status of KCNJ10 during development. As expected, isolation of an enriched astrocytic population resulted in lower states of methylation at all analyzed ages as cell types that do not expression Kir4.1 (neurons, microglia, and endothelial cells) were excluded. Despite the overall lower state of methylation, we observed significant reductions in the methylation status of KCNJ10 during development that corresponded to increased Kir4.1 expression. Mechanistically, the role of DNA methylation in regulating Kir4.1 transcription are supported by ChIP analysis which reveals robust and dynamic interaction of DNMT1 with Kir4.1 CpG sites; this interaction with DNMT1 appears to parallel levels of methylation as well as occur in concert with changes in methylation status through development.
As noted in other studies, the majority of CpG islands associated with promoter regions and transcriptional start sites (TSS) possess low levels of methylation (Maunakea et al., 2010; Deaton and Bird, 2011). Consistent with these studies, we found that Kir4.1 CpG Island 1 (which contains the TSS and promoter region) possesses a low level of methylation throughout development. Recent studies suggest that TSS-associated CpG islands, such as the CpG Island 1 of Kir4.1, are not involved in tissue-specific transcription. Rather, these studies propose that intragenic DNA methylation (which more commonly contains high levels of methylation) plays a more significant role in mediating cell-type and tissue specific transcription (Maunakea et al., 2010; Lorincz et al., 2004). Interestingly, it is within the intragenic CpG Island 2 and CpG Island 3 (which also contains a TSS) that we observe robust changes in methylation. It should be noted that we observe decreased levels of methylation in the gene-body, specifically CpG islands 2 and 3, which correlates to enhanced Kir4.1 transcription and expression during development. This finding is in contrast to the poorly understood concept of “the DNA methylation paradox” where DNA methylation in the promoter is inversely correlated with gene expression, while DNA methylation in the gene body is positively correlated with gene expression (Jones, 1999). While the role of gene-body methylation remains highly debated and unresolved (Suzuki and Bird, 2008; Jjingo et al., 2012), our observations provide both correlative and causal evidence that the levels of gene body methylation are inversely correlated to the transcriptional activity of the KCNJ10 gene. Given the observed methylation pattern of Kir4.1, we postulate that embryonic demethylation of CpG Island 1 – which contains the promoter – may function as a permissive signal that allows for expression of Kir4.1, while CpG Island 2 and 3 may work, in concert or independently, to mediate the region-specific expression levels of Kir4.1 we observe in the cortex and spinal cord.
Finally, we provide evidence that DNA methylation can bi-directionally influence Kir4.1 transcription. Our in vitro assay utilizing HEK cells and DNMT inhibitors demonstrate that global demethylation is sufficient to drive Kir4.1 transcription in cell types that normally do not express the channel. Furthermore, observed reductions in the luciferase activity of methylated 4.1-CpG1-luc and 4.1-CpG2-luc compared to non-methylated demonstrate that DNA methylation specifically of Kir4.1 CpG promoter and islands can reduce Kir4.1 transcription. While we cannot rule out other epigenetic mechanisms that may be playing a role in mediating Kir4.1 transcription, our data suggests that DNA methylation of Kir4.1 CpG islands plays a prominent role in regulating Kir4.1 transcription during development.
Epigenetic regulation of Kir4.1 represents a plausible therapeutic target
Numerous studies have highlighted Kir4.1 as a potential therapeutic target (Olsen et al., 2010; Sicca et al., 2011; Srivastava et al., 2012; Steinhauser et al., 2012; Wilcock et al., 2009). However, studies have yet to provide a plausible avenue for targeting Kir4.1 expression or channel activation. We report for the first time an epigenetic mechanism regulating Kir4.1 transcription, DNA methylation, and suggest that this represents the first step in targeting Kir4.1 expression epigenetically. Future studies focused on understanding the epigenetic regulation of Kir4.1, under normal and pathological states, may unveil DNA methylation and other epigenetic markers as drug-modifiable mechanisms that can be actively exploited for therapeutic relief of a variety of CNS diseases and illnesses.
Acknowledgments
This work was supported by NIH Grants 1P30NS069324-02 (M.L.O) and 5T32NS061788-05 (S.E.N.). Authors wish to thank S. Phillips from the IDDRC core at UAB (core supported by P30 HD38395) for developing plasmids and technical assistance with luciferase assay; S. Nozell for her technical assistance with the ChIP and luciferase assays; E. Keyser from the UAB Flow Cytometry Facility (core supported by P30 AR048311) who performed FACS sorting of eGFP+ astrocytes; and M. Walker from University of Alabama at Birmingham for kindly providing HEK and D54 cultures
Footnotes
Author Contributions
S.E.N performed all experiments. SE.L. designed pyrosequencing primers and ran pyrosequencing reactions. S.R.P. isolated astrocytes for FACS pyrosequencing experiments. M.L.O. provided technical assistance with all experiments. Study design, analysis and interpretation of data, as well as writing of manuscript were performed collaboratively between S.E.N and M.L.O.
References
- Bandeira F, Lent R, Herculano-Houzel S. Changing numbers of neuronal and non-neuronal cells underlie postnatal brain growth in the rat. Proc Natl Acad Sci U S A. 2009;106:14108–14113. doi: 10.1073/pnas.0804650106. [DOI] [PMC free article] [PubMed] [Google Scholar]
- Bataveljic D, Nikolic L, Milosevic M, Todorovic N, Andjus PR. Changes in the astrocytic aquaporin-4 and inwardly rectifying potassium channel expression in the brain of the amyotrophic lateral sclerosis SOD1(G93A) rat model. Glia. 2012;60:1991–2003. doi: 10.1002/glia.22414. [DOI] [PubMed] [Google Scholar]
- Bird A. DNA methylation patterns and epigenetic memory. Genes Dev. 2002;16:6–21. doi: 10.1101/gad.947102. [DOI] [PubMed] [Google Scholar]
- Bockenhauer D, et al. Epilepsy, ataxia, sensorineural deafness, tubulopathy, and KCNJ10 mutations. N Engl J Med. 2009;360:1960–1970. doi: 10.1056/NEJMoa0810276. [DOI] [PMC free article] [PubMed] [Google Scholar]
- Bordey A, Sontheimer H. Postnatal development of ionic currents in rat hippocampal astrocytes in situ. J Neurophysiol. 1997;78:461–477. doi: 10.1152/jn.1997.78.1.461. [DOI] [PubMed] [Google Scholar]
- Buono RJ, Lohoff FW, Sander T, Sperling MR, O’Connor MJ, Dlugos DJ, Ryan SG, Golden GT, Zhao H, Scattergood TM, Berrettini WH, Ferraro TN. Association between variation in the human KCNJ10 potassium ion channel gene and seizure susceptibility. Epilepsy Res. 2004;58:175–183. doi: 10.1016/j.eplepsyres.2004.02.003. [DOI] [PubMed] [Google Scholar]
- Cahoy JD, Emery B, Kaushal A, Foo LC, Zamanian JL, Christopherson KS, Xing Y, Lubischer JL, Krieg PA, Krupenko SA, Thompson WJ, Barres BA. A transcriptome database for astrocytes, neurons, and oligodendrocytes: a new resource for understanding brain development and function. J Neurosci. 2008;28:264–278. doi: 10.1523/JNEUROSCI.4178-07.2008. [DOI] [PMC free article] [PubMed] [Google Scholar]
- Chever O, Djukic B, McCarthy KD, Amzica F. Implication of Kir4.1 Channel in Excess Potassium Clearance: An In Vivo Study on Anesthetized Glial-Conditional Kir4.1 Knock-Out Mice. J Neurosci. 2010;30:15769–15777. doi: 10.1523/JNEUROSCI.2078-10.2010. [DOI] [PMC free article] [PubMed] [Google Scholar]
- Connors NC, Kofuji P. Potassium channel Kir4.1 macromolecular complex in retinal glial cells. Glia. 2006;53:124–131. doi: 10.1002/glia.20271. [DOI] [PubMed] [Google Scholar]
- D’Ambrosio R, Maris DO, Grady MS, Winn HR, Janigro D. Impaired K(+) homeostasis and altered electrophysiological properties of post-traumatic hippocampal glia. J Neurosci. 1999;19:8152–8162. doi: 10.1523/JNEUROSCI.19-18-08152.1999. [DOI] [PMC free article] [PubMed] [Google Scholar]
- Deaton AM, Bird A. CpG islands and the regulation of transcription. Genes Dev. 2011;25:1010–1022. doi: 10.1101/gad.2037511. [DOI] [PMC free article] [PubMed] [Google Scholar]
- Dibaj P, Kaiser M, Hirrlinger J, Kirchhoff F, Neusch C. Kir4.1 channels regulate swelling of astroglial processes in experimental spinal cord edema. J Neurochem. 2007;103:2620–2628. doi: 10.1111/j.1471-4159.2007.04979.x. [DOI] [PubMed] [Google Scholar]
- Djukic B, Casper KB, Philpot BD, Chin LS, McCarthy KD. Conditional knock-out of Kir4.1 leads to glial membrane depolarization, inhibition of potassium and glutamate uptake, and enhanced short-term synaptic potentiation. J Neurosci. 2007;27:11354–11365. doi: 10.1523/JNEUROSCI.0723-07.2007. [DOI] [PMC free article] [PubMed] [Google Scholar]
- Fan G, Martinowich K, Chin MH, He F, Fouse SD, Hutnick L, Hattori D, Ge W, Shen Y, Wu H, ten HJ, Shuai K, Sun YE. DNA methylation controls the timing of astrogliogenesis through regulation of JAK-STAT signaling. Development. 2005;132:3345–3356. doi: 10.1242/dev.01912. [DOI] [PubMed] [Google Scholar]
- Ferraro TN, Golden GT, Smith GG, Martin JF, Lohoff FW, Gieringer TA, Zamboni D, Schwebel CL, Press DM, Kratzer SO, Zhao H, Berrettini WH, Buono RJ. Fine mapping of a seizure susceptibility locus on mouse Chromosome 1: nomination of Kcnj10 as a causative gene. Mamm Genome. 2004;15:239–251. doi: 10.1007/s00335-003-2270-3. [DOI] [PubMed] [Google Scholar]
- Haj-Yasein NN, Jensen V, Vindedal GF, Gundersen GA, Klungland A, Ottersen OP, Hvalby O, Nagelhus EA. Evidence that compromised K+ spatial buffering contributes to the epileptogenic effect of mutations in the human kir4.1 gene (KCNJ10) Glia. 2011;59:1635–1642. doi: 10.1002/glia.21205. [DOI] [PubMed] [Google Scholar]
- Hatada I, Namihira M, Morita S, Kimura M, Horii T, Nakashima K. Astrocyte-specific genes are generally demethylated in neural precursor cells prior to astrocytic differentiation. PLoS One. 2008;3:e3189. doi: 10.1371/journal.pone.0003189. [DOI] [PMC free article] [PubMed] [Google Scholar]
- Higashi K, Fujita A, Inanobe A, Tanemoto M, Doi K, Kubo T, Kurachi Y. An inwardly rectifying K(+) channel, Kir4.1, expressed in astrocytes surrounds synapses and blood vessels in brain. Am J Physiol Cell Physiol. 2001;281:C922–C931. doi: 10.1152/ajpcell.2001.281.3.C922. [DOI] [PubMed] [Google Scholar]
- Itakura E, Odaira K, Yokoyama K, Osuna M, Hara T, Inoue K. Generation of transgenic rats expressing green fluorescent protein in S-100beta-producing pituitary folliculo-stellate cells and brain astrocytes. Endocrinology. 2007;148:1518–1523. doi: 10.1210/en.2006-1390. [DOI] [PubMed] [Google Scholar]
- Jjingo D, Conley AB, Yi SV, Lunyak VV, Jordan IK. On the presence and role of human gene-body DNA methylation. Oncotarget. 2012;3:462–474. doi: 10.18632/oncotarget.497. [DOI] [PMC free article] [PubMed] [Google Scholar]
- Jones PA. The DNA methylation paradox. Trends Genet. 1999;15:34–37. doi: 10.1016/s0168-9525(98)01636-9. [DOI] [PubMed] [Google Scholar]
- Kaiser M, Maletzki I, Hulsmann S, Holtmann B, Schulz-Schaeffer W, Kirchhoff F, Bahr M, Neusch C. Progressive loss of a glial potassium channel (KCNJ10) in the spinal cord of the SOD1 (G93A) transgenic mouse model of amyotrophic lateral sclerosis. J Neurochem. 2006;99:900–912. doi: 10.1111/j.1471-4159.2006.04131.x. [DOI] [PubMed] [Google Scholar]
- Kalsi AS, Greenwood K, Wilkin G, Butt AM. Kir4.1 expression by astrocytes and oligodendrocytes in CNS white matter: a developmental study in the rat optic nerve. J Anat. 2004a;204:475–485. doi: 10.1111/j.0021-8782.2004.00288.x. [DOI] [PMC free article] [PubMed] [Google Scholar]
- Kalsi AS, Greenwood K, Wilkin G, Butt AM. Kir4.1 expression by astrocytes and oligodendrocytes in CNS white matter: a developmental study in the rat optic nerve. J Anat. 2004b;204:475–485. doi: 10.1111/j.0021-8782.2004.00288.x. [DOI] [PMC free article] [PubMed] [Google Scholar]
- Kofuji P, Biedermann B, Siddharthan V, Raap M, Iandiev I, Milenkovic I, Thomzig A, Veh RW, Bringmann A, Reichenbach A. Kir potassium channel subunit expression in retinal glial cells: implications for spatial potassium buffering. Glia. 2002;39:292–303. doi: 10.1002/glia.10112. [DOI] [PubMed] [Google Scholar]
- Kofuji P, Ceelen P, Zahs KR, Surbeck LW, Lester HA, Newman EA. Genetic Inactivation of an Inwardly Rectifying Potassium Channel (Kir4.1 Subunit) in Mice: Phenotypic Impact in Retina. J Neurosci. 2000;20:5733–5740. doi: 10.1523/JNEUROSCI.20-15-05733.2000. [DOI] [PMC free article] [PubMed] [Google Scholar]
- Kucheryavykh YV, Kucheryavykh LY, Nichols CG, Maldonado HM, Baksi K, Reichenbach A, Skatchkov SN, Eaton MJ. Downregulation of Kir4.1 inward rectifying potassium channel subunits by RNAi impairs potassium transfer and glutamate uptake by cultured cortical astrocytes. Glia. 2007;55:274–281. doi: 10.1002/glia.20455. [DOI] [PubMed] [Google Scholar]
- Lenzen KP, Heils A, Lorenz S, Hempelmann A, Hofels S, Lohoff FW, Schmitz B, Sander T. Supportive evidence for an allelic association of the human KCNJ10 potassium channel gene with idiopathic generalized epilepsy. Epilepsy Res. 2005;63:113–118. doi: 10.1016/j.eplepsyres.2005.01.002. [DOI] [PubMed] [Google Scholar]
- Lorincz MC, Dickerson DR, Schmitt M, Groudine M. Intragenic DNA methylation alters chromatin structure and elongation efficiency in mammalian cells. Nat Struct Mol Biol. 2004;11:1068–1075. doi: 10.1038/nsmb840. [DOI] [PubMed] [Google Scholar]
- Lubin FD, Roth TL, Sweatt JD. Epigenetic regulation of BDNF gene transcription in the consolidation of fear memory. J Neurosci. 2008;28:10576–10586. doi: 10.1523/JNEUROSCI.1786-08.2008. [DOI] [PMC free article] [PubMed] [Google Scholar]
- Ludwin SK, Kosek JC, Eng LF. The topographical distribution of S-100 and GFA proteins in the adult rat brain: an immunohistochemical study using horseradish peroxidase-labelled antibodies. J Comp Neurol. 1976;165:197–207. doi: 10.1002/cne.901650206. [DOI] [PubMed] [Google Scholar]
- MacFarlane SN, Sontheimer H. Changes in ion channel expression accompany cell cycle progression of spinal cord astrocytes. Glia. 2000;30:39–48. doi: 10.1002/(sici)1098-1136(200003)30:1<39::aid-glia5>3.0.co;2-s. [DOI] [PubMed] [Google Scholar]
- Maldonado PP, Velez-Fort M, Levavasseur F, Angulo MC. Oligodendrocyte precursor cells are accurate sensors of local K+ in mature gray matter. J Neurosci. 2013;33:2432–2442. doi: 10.1523/JNEUROSCI.1961-12.2013. [DOI] [PMC free article] [PubMed] [Google Scholar]
- Maunakea AK, et al. Conserved role of intragenic DNA methylation in regulating alternative promoters. Nature. 2010;466:253–257. doi: 10.1038/nature09165. [DOI] [PMC free article] [PubMed] [Google Scholar]
- Miller CA, Sweatt JD. Covalent modification of DNA regulates memory formation. Neuron. 2007;53:857–869. doi: 10.1016/j.neuron.2007.02.022. [DOI] [PubMed] [Google Scholar]
- Neusch C, Papadopoulos N, Muller M, Maletzki I, Winter SM, Hirrlinger J, Handschuh M, Bahr M, Richter DW, Kirchhoff F, Hulsmann S. Lack of the Kir4.1 channel subunit abolishes K+ buffering properties of astrocytes in the ventral respiratory group: impact on extracellular K+ regulation. J Neurophysiol. 2006;95:1843–1852. doi: 10.1152/jn.00996.2005. [DOI] [PubMed] [Google Scholar]
- Neusch C, Rozengurt N, Jacobs RE, Lester HA, Kofuji P. Kir4.1 Potassium Channel Subunit Is Crucial for Oligodendrocyte Development and In Vivo Myelination. J Neurosci. 2001;21:5429–5438. doi: 10.1523/JNEUROSCI.21-15-05429.2001. [DOI] [PMC free article] [PubMed] [Google Scholar]
- Oberheim NA, Goldman SA, Nedergaard M. Heterogeneity of astrocytic form and function. Methods Mol Biol. 2012;814:23–45. doi: 10.1007/978-1-61779-452-0_3. [DOI] [PMC free article] [PubMed] [Google Scholar]
- Olsen ML, Campbell SC, McFerrin MB, Floyd CL, Sontheimer H. Spinal cord injury causes a wide-spread, persistent loss of Kir4.1 and glutamate transporter 1: benefit of 17 beta-oestradiol treatment. Brain. 2010;133:1013–1025. doi: 10.1093/brain/awq049. [DOI] [PMC free article] [PubMed] [Google Scholar]
- Olsen ML, Higashimori H, Campbell SL, Hablitz JJ, Sontheimer H. Functional expression of Kir4.1 channels in spinal cord astrocytes. Glia. 2006;53:516–528. doi: 10.1002/glia.20312. [DOI] [PMC free article] [PubMed] [Google Scholar]
- Olsen ML, Sontheimer H. Mislocalization of Kir channels in malignant glia. Glia. 2004;46:63–73. doi: 10.1002/glia.10346. [DOI] [PMC free article] [PubMed] [Google Scholar]
- Ono T, Uehara Y, Kurishita A, Tawa R, Sakurai H. Biological significance of DNA methylation in the ageing process. Age Ageing. 1993;22:S34–S43. doi: 10.1093/ageing/22.suppl_1.s34. [DOI] [PubMed] [Google Scholar]
- Pannicke T, Iandiev I, Uckermann O, Biedermann B, Kutzera F, Wiedemann P, Wolburg H, Reichenbach A, Bringmann A. A potassium channel-linked mechanism of glial cell swelling in the postischemic retina. Mol Cell Neurosci. 2004;26:493–502. doi: 10.1016/j.mcn.2004.04.005. [DOI] [PubMed] [Google Scholar]
- Perisic T, Holsboer F, Rein T, Zschocke J. The CpG island shore of the GLT-1 gene acts as a methylation-sensitive enhancer. Glia. 2012;60:1345–1355. doi: 10.1002/glia.22353. [DOI] [PubMed] [Google Scholar]
- Pineda RH, Ribera AB. Dorsal-Ventral Gradient for Neuronal Plasticity in the Embryonic Spinal Cord. J Neurosci. 2008;28:3824–3834. doi: 10.1523/JNEUROSCI.0242-08.2008. [DOI] [PMC free article] [PubMed] [Google Scholar]
- Poopalasundaram S, Knott C, Shamotienko OG, Foran PG, Dolly JO, Ghiani CA, Gallo V, Wilkin GP. Glial heterogeneity in expression of the inwardly rectifying K+ channel, Kir4.1, in adult rat CNS. Glia. 2000;30:362–372. doi: 10.1002/(sici)1098-1136(200006)30:4<362::aid-glia50>3.0.co;2-4. [DOI] [PubMed] [Google Scholar]
- Ransom CB, Ransom BR, Sontheimer H. Activity-dependent extracellular K+ accumulation in rat optic nerve: the role of glial and axonal Na+ pumps. J Physiol. 2000;522(Pt 3):427–442. doi: 10.1111/j.1469-7793.2000.00427.x. [DOI] [PMC free article] [PubMed] [Google Scholar]
- Roth TL, Lubin FD, Funk AJ, Sweatt JD. Lasting epigenetic influence of early-life adversity on the BDNF gene. Biol Psychiatry. 2009;65:760–769. doi: 10.1016/j.biopsych.2008.11.028. [DOI] [PMC free article] [PubMed] [Google Scholar]
- Scholl UI, Choi M, Liu T, Ramaekers VT, Hausler MG, Grimmer J, Tobe SW, Farhi A, Nelson-Williams C, Lifton RP. Seizures, sensorineural deafness, ataxia, mental retardation, and electrolyte imbalance (SeSAME syndrome) caused by mutations in KCNJ10. Proc Natl Acad Sci U S A. 2009;106:5842–5847. doi: 10.1073/pnas.0901749106. [DOI] [PMC free article] [PubMed] [Google Scholar]
- Seifert G, Huttmann K, Binder DK, Hartmann C, Wyczynski A, Neusch C, Steinhauser C. Analysis of Astroglial K+ Channel Expression in the Developing Hippocampus Reveals a Predominant Role of the Kir4.1 Subunit. J Neurosci. 2009;29:7474–7488. doi: 10.1523/JNEUROSCI.3790-08.2009. [DOI] [PMC free article] [PubMed] [Google Scholar]
- Shimozaki K, Namihira M, Nakashima K, Taga T. Stage- and site-specific DNA demethylation during neural cell development from embryonic stem cells. J Neurochem. 2005;93:432–439. doi: 10.1111/j.1471-4159.2005.03031.x. [DOI] [PubMed] [Google Scholar]
- Sicca F, Imbrici P, D’Adamo MC, Moro F, Bonatti F, Brovedani P, Grottesi A, Guerrini R, Masi G, Santorelli FM, Pessia M. Autism with seizures and intellectual disability: possible causative role of gain-of-function of the inwardly-rectifying K+ channel Kir4.1. Neurobiol Dis. 2011;43:239–247. doi: 10.1016/j.nbd.2011.03.016. [DOI] [PubMed] [Google Scholar]
- Srivastava R, Aslam M, Kalluri SR, Schirmer L, Buck D, Tackenberg B, Rothhammer V, Chan A, Gold R, Berthele A, Bennett JL, Korn T, Hemmer B. Potassium channel KIR4.1 as an immune target in multiple sclerosis. N Engl J Med. 2012;367:115–123. doi: 10.1056/NEJMoa1110740. [DOI] [PMC free article] [PubMed] [Google Scholar]
- Steinhauser C, Seifert G, Bedner P. Astrocyte dysfunction in temporal lobe epilepsy: K+ channels and gap junction coupling. Glia. 2012;60:1192–1202. doi: 10.1002/glia.22313. [DOI] [PubMed] [Google Scholar]
- Stewart TH, Eastman CL, Groblewski PA, Fender JS, Verley DR, Cook DG, D’Ambrosio R. Chronic dysfunction of astrocytic inwardly rectifying K+ channels specific to the neocortical epileptic focus after fluid percussion injury in the rat. J Neurophysiol. 2010;104:3345–3360. doi: 10.1152/jn.00398.2010. [DOI] [PMC free article] [PubMed] [Google Scholar]
- Suzuki MM, Bird A. DNA methylation landscapes: provocative insights from epigenomics. Nat Rev Genet. 2008;9:465–476. doi: 10.1038/nrg2341. [DOI] [PubMed] [Google Scholar]
- Tawa R, Ono T, Kurishita A, Okada S, Hirose S. Changes of DNA methylation level during pre- and postnatal periods in mice. Differentiation. 1990;45:44–48. doi: 10.1111/j.1432-0436.1990.tb00455.x. [DOI] [PubMed] [Google Scholar]
- Teter B, Rozovsky I, Krohn K, Anderson C, Osterburg H, Finch C. Methylation of the glial fibrillary acidic protein gene shows novel biphasic changes during brain development. Glia. 1996;17:195–205. doi: 10.1002/(SICI)1098-1136(199607)17:3<195::AID-GLIA2>3.0.CO;2-0. [DOI] [PubMed] [Google Scholar]
- Wilcock DM, Vitek MP, Colton CA. Vascular amyloid alters astrocytic water and potassium channels in mouse models and humans with Alzheimer’s disease. Neuroscience. 2009;159:1055–1069. doi: 10.1016/j.neuroscience.2009.01.023. [DOI] [PMC free article] [PubMed] [Google Scholar]