

Abstract
As increasing evidence suggests that multiple correlated genetic variants could jointly influence the outcome, a multilocus test that aggregates association evidence across multiple genetic markers in a considered gene or a genomic region may be more powerful than a single-marker test for detecting susceptibility loci. We propose a multilocus test, AdaJoint, which adopts a variable selection procedure to identify a subset of genetic markers that jointly show the strongest association signal, and defines the test statistic based on the selected genetic markers. The P-value from the AdaJoint test is evaluated by a computationally efficient algorithm that effectively adjusts for multiple-comparison, and is hundreds of times faster than the standard permutation method. Simulation studies demonstrate that AdaJoint has the most robust performance among several commonly used multilocus tests. We perform multilocus analysis of over 26 000 genes/regions on two genome-wide association studies of pancreatic cancer. Compared with its competitors, AdaJoint identifies a much stronger association between the gene CLPTM1L and pancreatic cancer risk (6.0 × 10⁻⁸), with the signal optimally captured by two correlated single-nucleotide polymorphisms (SNPs). Finally, we show AdaJoint as a powerful tool for mapping cis-regulating methylation quantitative trait loci on normal breast tissues, and find many CpG sites whose methylation levels are jointly regulated by multiple SNPs nearby.
Keywords: genome-wide association study, cis-regulating meQTLs mapping, multilocus test, variable selection, multiple comparisons, pathway analysis
Introduction
Genome-wide association studies (GWAS) have emerged as an effective approach in identifying susceptibility loci underlying various complex traits. The single-marker test, which evaluates the association between the outcome and one genetic marker, that is single-nucleotide polymorphism (SNP), at a time, is the most commonly used approach in the search for promising chromosome regions associated with the outcome. A chromosome region or gene that contains a SNP exhibiting a strong association signal would be considered for further study in order to fine-map the functional loci. Although it is computationally convenient to use, the single-marker test is not always the most effective approach for the detection of relevant regions. As demonstrated by Yang et al1 and Ke2, it is likely that information at a single SNP might not fully capture the association evidence in the considered region in situations when there are multiple causal loci in the region, or when the only functional variant cannot be directly measured and a single SNP is not its best surrogate. Thus, a multilocus test, which evaluates the association between the outcome and all SNPs in the gene/region jointly, can be a valuable alternative to the single-marker approach.
The major challenge facing the construction of a multilocus test is how to synthesize the information contained in multiple SNPs within the considered gene. In general, there are three types of approaches to consider. The first approach designs a test statistic that summarizes all genetic variation in the region and assesses its association with the outcome.3, 4, 5, 6, 7, 8, 9, 10, 11 The second approach uses an unsupervised dimension reduction procedure, such as principal component (PC) analysis, to select a proportion of genetic variation (contained in either a subset of SNPs or selected PCs) without referring to their association with the outcome, and then relates the selected components to the outcome.12, 13, 14, 15 The third approach employs a supervised variable selection (SVS) procedure to identify a subset of variables that are most relevant to the outcome and then designs a test statistic based on the selected variables.16, 17
For the first and second approaches, it is possible to design a test statistic with a known asymptotic distribution. As a result, its significant level can be easily obtained and thus the method is suitable for large-scale genome-wide gene-based analysis, where we typically evaluate over 20 000 genes/regions. But these two approaches can suffer from major power loss as they tend to include irrelevant information blindly in the test statistic. Due to the correlation among SNPs within a gene, some SNPs might not contribute additional association evidence after conditioning upon genotypes at a set of SNPs that capture sufficiently all the measured information about the risk loci. In this regard, the third approach with a SVS procedure is more appealing, as a sensitive variable selection strategy can help to maximize the association signal by selecting the most relevant SNPs while filtering out the redundant ones. One major drawback of the multilocus testing strategy with a SVS procedure is its high computational demand. It is well known that supervised variable selection can lead to various over-fitting problems.18 Thus, it usually requires a time-consuming resampling-based procedure for evaluating the significance level of the final test statistic in an unbiased manner. The computational burden associated with the SVS approach, such as the one by Yu et al,17 would become the major hurdle for GWA studies. Huang et al16 proposed a gene-based test based on a computationally efficient Bayesian greedy search algorithm. But the test is only designed for the study of continuous outcomes.
We propose a novel adaptive joint test procedure as a multilocus test that takes the linkage disequilibrium (LD) structure into account and adopts a variable selection procedure to maximize the signal-to-noise ratio. The significance level of the proposed test is evaluated by a computationally efficient algorithm that can be hundreds of times faster than the standard permutation-based method. We demonstrate the advantage of the new procedure through extensive simulation studies, as well as two real data applications.
Methods
Adaptive joint test
We will first focus on the binary outcome, e.g. disease status in case-control study. The extension to continuous outcome will be described later. Suppose we have n subjects in total. For the ith subject with covariates Xi, let yi and Gi be its binary outcome and the vector of genotypes on all the testing SNPs in a gene. Under the null hypothesis that none of the SNPs is associated with the disease, we fit the reduced logistic regression model,
 |
and get the maximum likelihood estimate  of α. Define
 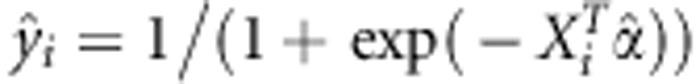 and the diagonal matrix
 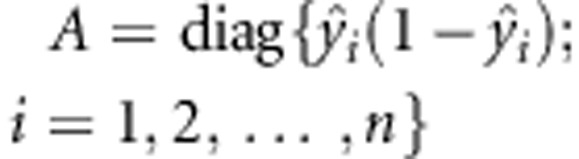 . Let y=(y1,y2,…,yn)T, X=(X1,X2,…,Xn)T and G=(G1,G2,⋯,Gn)T. Based on the observed data
  , we can test any given set of SNPs with joint genotype
  in the gene by the following score test:
where the score 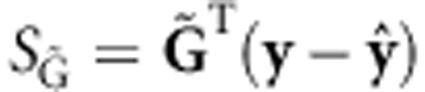 , and the covariance matrix
  19
19
Yang et al1 and Ke2 demonstrated empirically that joint testing of multiple SNPs can sometimes detect more association signal than the single-marker analysis. Here we show in a simplified scenario how the power of single-marker analysis varies according to an underlying risk model with two correlated risk factors. We consider a balance case-control study with a total of n subjects, and a true risk model of the form logit (P(y=1|G1,G2))=α+β1G1+β2G2, with G1 and G2 being the two binary risk factors with correlation ρ. Let pi=P(Gi=1), i=1, 2. Under this risk model, we derive the power of the single-marker test for H0: β1=0, which is the score test of the risk factor G1, as a function of n, ρ, βi and pi, i=1, 2 (see Supplemental Materials). Figure 1 illustrates the case when p1=p2=0.4, n=2000, β2=0.1 with varying ρ and β1. It is evident from the figure that the power of the single-marker test for G1 is very sensitive to the correlation level between the two risk factors. For example, when β1=0.2, the power of the single-marker test for G1 is 0.79 with ρ=0.5, and drops to 0.38 with ρ=−0.5. This illustrates the importance of using the joint test approach when there are multiple correlated risk SNPs in the gene, as the single-marker analysis can have much diminished power due to this ‘curse of correlation'.
Figure 1.

The power of marginal score test as a function of regression coefficient of targeting binary risk factor G1 and its correlation ρ with the other risk factor G2. The risk model is assumed as the logistic regression model with the form logit(P(y=1|G1,G2))=α+β1G1+β2G2. The heat map shows the power for a study with 1000 cases and 1000 controls under scenarios where β2=0.1, p1=p2=0.4.
In a gene or an annotated region with multiple SNPs, a multilocus test using all SNPs, such as (1), might not be optimal as some SNPs could be independent of the outcome after conditioning on the relevant SNPs (either the causal ones, or the ones tagging the ungenotyped functional variants). To enhance the power of the multilocus test, we use the following supervised variable selection strategy to identify the most relevant SNPs. We want to find the optimal risk model Mk with mk SNPs, k=1,…,K, where K and mk are pre-specified by the user, and define the corresponding joint score test statistic  based on each identified model. Clearly, we cannot find the optimal risk model Mk exactly unless mk or the total number of SNPs in the gene is small. Instead, we propose to use a modified forward stepwise variable selection strategy, which first finds the optimal one-SNP and two-SNP models with the largest joint score test statistics, respectively. Starting with the optimal two-SNP model, the algorithm then sequentially expands the currently identified risk model by one more SNP in such a way that the resulting risk model has the largest possible joint score test statistic. As we do not know the size for the true risk model, we define the final multilocus test statistic as
  , where
  is the significance level of
  . Typically
  can be calculated by computationally intensive permutation. The outcomes are reshuffled many times when computing the joint score statistics under the null. Note that for large sample size, the computational burden for calculating the score
  can be the bottleneck so that the standard permutation strategy is infeasible when assessing extremely small P-values. We adopt the direct simulation approach (DSA) to generate the null score S through a multivariate normal distribution.20
where V=GTAG−GTAX(XTAX)−1XTAG, then the score test statistics under the null are computed accordingly, along with the variable selection mentioned before. Here is a brief summary of the basic steps for conducting the multilocus test, called AdaJoint. More detailed can be found in the Supplemental Materials.
Identify the optimal models with m1,m2,…,mK SNPs by the stepwise forward selection, and obtain score test statistics
 accordingly.
Compute the empirical P-values
 for
for  by the DSA procedure. Define
  as the final multilocus test statistic.
Evaluate the significance of
 by the algorithm in Ge et al
21.
by the algorithm in Ge et al
21.
As there might not be too many risk variants in a gene or genetic region, we recommend to set K as a small integer, e.g. 5, and mk=k, k=1,2,…,5. Let k* be the index where  reaches the minimum level. The identified risk model consisting of the first mk* selected SNP(s) can be regarded as the most optimal risk model that shows the strongest association evidence for the gene.
Extension to continuous outcome
Under the null, the asymptotic normality of the score vectors in (2) still holds for a continuous outcome y when the linear regression model is assumed, except that the covariance matrix has a different form
where  is the maximum likelihood estimate of the variance parameter in linear regression model. The previously described adaptive joint test is then applicable to the continuous outcomes without other modifications.
Other multilocus tests
There are many multilocus tests proposed in the literature. Here we consider just the following three representative ones. One is the Min-p test, which focuses on the SNP with the smallest marginal P-value and uses it as the test statistic.22 Notice that the Min-p test is a special case of the AdaJoint test, with K=1 and m1=1. Another multilocus test to consider is the sequence kernel association test (SKAT23) which is derived from a random-effects model. When the linear kernel is adopted, the SKAT statistic is essentially a sum of marginal score test statistics on individual SNPs. The third one is a speeded-up version of the adaptive rank truncated product (ARTP) method,24 which combines the marginal P-values on a set of selected SNPs. In this improved version, we replace the time-consuming resampling-based procedure used in the original algorithm with the DSA described above.
Results
Application to GWAS of pancreatic cancer
We demonstrated the application of the proposed method by applying it on two GWAS of pancreatic cancer. We downloaded the two GWAS data sets from the Database of Genotypes and Phenotypes.25 The first GWAS (PanScan I) genotyped about 550 000 SNPs from 1896 individuals with pancreatic cancer and 1939 controls drawn from 12 prospective cohorts and one hospital-based case-control study.26 The second GWAS (PanScan II) genotyped about 620 000 SNPs in 1679 cases and 1725 controls from seven case-control studies.27 The downloaded PanScan II GWAS did not include the 546 subjects from the PACIFIC study. For our analysis, we focused on people primarily of European ancestry, i.e. people with their European admixture coefficient larger than 0.85 estimated by STRUCTURE.28 There were 3275 cases and 3376 controls left for the multilocus analysis. We conducted a multilocus analysis on a total of 26 247 genes or annotated regions extracted by the software GLU (http://code.google.com/p/glu-genetics/). We extracted SNPs within 20 kb upstream and 10 kb downstream of a gene or annotated region. We set the threshold for genome-wide significance at 2.0 × 10⁻⁶ (≈0.05/26247) according to the Bonferroni correction for all 26 247 gene-based tests.
Multilocus analysis
The logistic regression model was adjusted for study, age, sex and the 10 PCs (five from each of the two GWAS) for the adjustment of population stratification. The genotype at each SNP was coded as 0, 1 or 2, according to the number of minor alleles. The SNPs with missing rate larger than 2%, or minor allele frequencies (MAFs) less than 0.02 were excluded from the analysis. Missing genotypes of the remaining SNPs were simply imputed as the population average. Given the low missing rate of genotyping, the results were not sensitive to the way how we imputed the genotype. For two SNPs with pairwise LD coefficient r2 larger than 0.99, the one with a smaller MAF was discarded. This can avoid the occurrence of a singular matrix when calculating the inversion. When applying the AdaJoint test, we chose K=5, with mk=k, k=1, 2, …,5 and used 106 direct simulation steps to evaluate the significance level. For genes with estimated P-values less than 10−4, we further refined their P-value estimates with 109 direct simulation steps.
Table 1 lists the multilocus analysis results for genes and annotated regions that had multilocus P-value less than 10−4 by at least one of four considered tests, including AdaJoint, ARTP, Min-p and SKAT. Among the three established genes, CLPTM1L, NR5A2 and ABO, AdaJoint can detect two (CLPTM1L and NR5A2) with P-values below the threshold 2.0 × 10⁻⁶, whereas failed to identify ABO (P=7.3 × 10⁻⁶, which was close to global significance level). ARTP, Min-p and SKAT each detected one but missed two genes. Notice that the sample size used in this analysis was smaller than the original two GWAS combined, as we focused on people with European ancestry and did not include subjects from the PACIFIC study.
Table 1. Testing results for top 17 genes. These are genes on which at least one of the four considered tests produce a P-value no more than 1.04 × 10⁻⁴.
| Gene | Location | AdaJoint | ARTP | Min-p | SKAT | ||||
|---|---|---|---|---|---|---|---|---|---|
| P-value | Rank | P-value | Rank | P-value | Rank | P-value | Rank | ||
| CLPTM1L | 5p15.33 | 6.0 × 10⁻⁸ | 1 | 4.4 × 10⁻⁶ | 3 | 1.1 × 10⁻⁵ | 3 | 7.3 × 10⁻⁷ | 1 |
| NR5A2 | 1q32.1 | 7.9 × 10⁻⁷ | 2 | 4.1 × 10⁻⁷ | 1 | 3.2 × 10⁻⁷ | 1 | 4.0 × 10⁻⁴ | 9 |
| ABO | 9q34.2 | 7.3 × 10⁻⁶ | 3 | 3.5 × 10⁻⁶ | 2 | 2.6 × 10⁻⁶ | 2 | 1.4 × 10⁻⁵ | 2 |
| CTRB2 | 16q23.1 | 1.6 × 10⁻⁵ | 4 | 3.2 × 10⁻⁴ | 15 | 1.5 × 10⁻⁴ | 15 | 8.9 × 10⁻⁴ | 11 |
| HNF1A | 12q24.31 | 5.5 × 10⁻⁵ | 6 | 4.2 × 10⁻⁵ | 6 | 2.2 × 10⁻⁵ | 5 | 7.4 × 10⁻⁵ | 3 |
| C12orf27 | 12q24.31 | 5.5 × 10⁻⁵ | 6 | 3.6 × 10⁻⁵ | 5 | 2.1 × 10⁻⁵ | 4 | 1.2 × 10⁻⁴ | 6 |
| LOC100131601 | 16q23.1 | 5.8 × 10⁻⁵ | 7 | 8.1 × 10⁻⁵ | 8 | 4.0 × 10⁻⁵ | 7 | 5.4 × 10⁻⁴ | 10 |
| TERT | 5q15.33 | 6.9 × 10⁻⁵ | 8 | 3.2 × 10⁻⁵ | 4 | 4.5 × 10⁻⁵ | 8 | 8.0 × 10⁻⁵ | 4 |
| SMTN | 22q12.2 | 8.0 × 10⁻⁵ | 10 | 1.0 × 10⁻⁴ | 12 | 4.0 × 10⁻⁵ | 7 | 3.2 × 10⁻³ | 14 |
| LOC387646 | 10p12.1 | 8.0 × 10⁻⁵ | 10 | 8.3 × 10⁻⁵ | 9 | 5.5 × 10⁻⁵ | 10 | 2.4 × 10⁻⁴ | 7 |
| LOC100130177 | 5q33.3 | 1.0 × 10⁻⁴ | 14 | 9.0 × 10⁻³ | 16 | 3.7 × 10⁻² | 16 | 1.1 × 10⁻² | 15 |
| LOC442426 | 9q21.32 | 1.0 × 10⁻⁴ | 14 | 6.6 × 10⁻² | 17 | 9.1 × 10⁻² | 17 | 6.1 × 10⁻² | 17 |
| TMEM213 | 7q34 | 1.0 × 10⁻⁴ | 14 | 1.1 × 10⁻⁴ | 13 | 5.0 × 10⁻⁵ | 9 | 1.6 × 10⁻³ | 12 |
| CTRB1 | 16q23.1 | 1.0 × 10⁻⁴ | 14 | 2.5 × 10⁻⁴ | 14 | 1.2 × 10⁻⁴ | 14 | 2.5 × 10⁻⁴ | 8 |
| BCAR1 | 16q23.1 | 1.2 × 10⁻⁴ | 15 | 1.0 × 10⁻⁴ | 12 | 6.0 × 10⁻⁵ | 11 | 2.0 × 10⁻³ | 13 |
| ANKRD12 | 18p11.22 | 2.0 × 10⁻⁴ | 16 | 1.0 × 10⁻⁴ | 12 | 1.0 × 10⁻⁴ | 13 | 1.7 × 10⁻² | 16 |
| SHH | 7q36.3 | 2.4 × 10⁻⁴ | 17 | 5.5 × 10⁻⁵ | 7 | 9.8 × 10⁻⁵ | 12 | 1.2 × 10⁻⁴ | 6 |
The advantage of the AdaJoint is most evident when applying to the gene CLPTM1L (Table 2). The most significant SNP (rs401681) in the gene had a marginal P-value of 1.8 × 10⁻⁶ and an adjusted P-value of 1.1 × 10⁻⁵ after accounting for multiple comparisons within the gene, suggesting that this locus cannot be identified by a single-marker analysis. AdaJoint yielded a more significant gene-level P-value (P=6.0 × 10⁻⁸) by identifying a risk model consisting of two moderately correlated SNPs rs401681 and rs10073340 with r2=0.26. Even though rs10073340 showed no marginal effect (P=0.14), it turned out to carry substantial association signal after conditioning on rs401681 (P=7.0 × 10⁻⁶). Although the conditional P-value is biased because of variable selection, the result from AdaJoint indicates that the joint test of rs401681 and rs10073340 indeed enhances the power. The weakened marginal signal of the SNP rs10073340 is due to the ‘curse of correlation',1 a phenomenon illustrated in Figure 1. In this example, AdaJoint achieved a net gain of power after paying for the penalty of multiple-comparison occurred during the search for the best risk model.
Table 2. Results of marginal tests and joint score tests for the top five SNPs selected by AdaJoint in gene CLPTM1L.
| Selected SNP | Marginal P-value | Joint test P-valuea | Adjusted joint test P valueb |
|---|---|---|---|
| rs401681 | 1.8 × 10⁻⁶ | 1.7 × 10⁻⁶ | 1.1 × 10⁻⁵ |
| rs10073340 | 0.14 | 4.4 × 10⁻¹⁰ | 3.0 × 10⁻⁸ |
| rs27061 | 1.5 × 10⁻³ | 1.1 × 10⁻⁹ | 4.0 × 10⁻⁸ |
| rs4635969 | 5.9 × 10⁻⁶ | 3.3 × 10⁻⁹ | 5.0 × 10⁻⁸ |
| rs4975616 | 1.9 × 10⁻⁵ | 7.2 × 10⁻⁹ | 4.0 × 10⁻⁸ |
Unadjusted P-values of the joint score test on the set of selected SNPs.
Adjusted P-values for the joint score test accounting for model selection (defined as  in the text).
Application to methylation QTL data
Identifying genetic variants contributing to the variation of site-specific methylation levels is crucial to understand the genetic control of epigenetic regulation. The standard approach for detecting methylation quantitative trait loci (meQTLs) is based on single-marker analysis.29, 30, 31 Here, we demonstrated that multiple SNPs may jointly regulate the methylation at a CpG site, and that the joint analysis, such as AdaJoint can improve the power of detecting meQTLs.
We applied AdaJoint for continuous outcome to identify meQTLs in 67 normal breast tissue samples from The Cancer Genome Atlas.32 For each sample, the levels of methylation for 485 511 CpG cites were measured using the Illumina Infinium HumanMethylation450 BeadChip array, whereas approximately 900 000 SNPs were genotyped using the Genome-Wide Human SNP Array 6.0. As a demonstration, we only analyzed the 163 CpG sites that had the largest methylation variation among subjects. Each methylation trait was transformed to follow the standard normal distribution. We focused on identifying cis-regulating SNPs, i.e. SNPs within 100 kb from the target CpG site. The SNPs with missing rate larger than 2%, or MAFs less than 0.1 (due to the small sample size) were excluded from the analysis. For two SNPs with pairwise LD coefficient r2 larger than 0.9, the one with a smaller MAF was discarded. Genetic-association testing was adjusted for three PC vectors based on PC analysis of GWAS SNPs to correct for potential population stratification, and further adjusted for three PC vectors based on PC analysis of 485 511 methylation traits to remove potential systematic methylation measurement bias.29 Out of the 163 CpG sites, there were 14 sites with Bonferroni corrected P-values less than 1.0 × 10⁻⁶, therefore were not considered for further analysis.
Due to the limited sample size, the covariance approximation in (3) that was adopted in AdaJoint, ARTP, and Min-p may not be appropriate, especially when evaluating small P-values. We therefore performed AdaJoint, ARTP and Min-p by 109 replicates of permutation in which the genotypes were shuffled while maintaining the relationship between methylation traits and the covariates. We searched for the best risk models with up to three SNPs when applying AdaJoint and ARTP.
We applied AdaJoint, ARTP, Min-p and SKAT to the remaining 149 sites, and compared their P-values in Figure 2. AdaJoint identified a single-marker model as the best risk model for 58 CpG sites (shown as blue solid circles in Figure 2), and a multi-marker model as the best risk model for the other 91 CpG sites (shown as red solid circles and triangles in Figure 2). In Table 3, we listed CpG sites where there were multiple nearby SNPs jointly influencing the methylation level (P≤1.0 × 10⁻⁵ ). It is clear from Figure 2 that AdaJoint is more powerful than other considered methods for detecting cis-acting meQTLs.
Figure 2.

Comparison of the five tests when applied to meQTLs data. The P-values of AdaJoint, ARTP and Min-p were calculated from 109 replicates of permutation. For each methylation trait, we tested its association with the SNPs within 100 kb from the target CpG site. The blue solid circles represent the CpG sites where AdaJoint identified a single-marker model as the best risk model. The red solid circles and triangles represent the CpG sites where AdaJoint identified a best risk model with multiple SNPs. The red solid triangles represent the seven CpG sites where AdaJoint identified a best model with multiple SNPs and had the P-value less than 1.0 × 10⁻⁵. More results about these seven CpG sites are given in Table 3.
Table 3. Summary of the most significant loci in the methylation QTLs data.
| P-valuesb | |||||||
|---|---|---|---|---|---|---|---|
| chr | Location (bp) | # of SNPsa | Best risk model detected by AdaJoint | AdaJoint | ARTP | Min-p | SKAT |
| 5 | 179740914 | 47 | rs2112594, rs2386854, rs10479572 | 1.6 × 10⁻⁸ | 1.2 × 10⁻⁵ | 1.1 × 10⁻⁵ | 4.0 × 10⁻⁶ |
| 5 | 179741104 | 47 | rs2112594, rs2386854, rs17080199 | 2.8 × 10⁻⁸ | 1.0 × 10⁻⁵ | 2.3 × 10⁻⁵ | 5.1 × 10⁻⁶ |
| 5 | 179740743 | 47 | rs6879260, rs2892152, rs10479573 | 2.0 × 10⁻⁸ | 6.6 × 10⁻⁵ | 3.5 × 10⁻⁴ | 9.6 × 10⁻⁶ |
| 6 | 32551749 | 7 | rs9272346, rs9272535, rs9271720 | 1.8 × 10⁻⁸ | 3.2 × 10⁻⁶ | 1.6 × 10⁻⁶ | 2.0 × 10⁻³ |
| 12 | 740100 | 48 | rs10849372, rs2075032, rs11063749 | 5.0 × 10⁻⁸ | 1.1 × 10⁻⁵ | 3.0 × 10⁻⁵ | 5.2 × 10⁻⁴ |
| 16 | 419975 | 24 | rs11649268, rs8063821, rs4984666 | 6.3 × 10⁻⁶ | 4.7 × 10⁻⁶ | 1.0 × 10⁻⁵ | 4.6 × 10⁻⁵ |
| 21 | 43528205 | 63 | rs11701371, rs220110, rs220120 | 8.1 × 10⁻⁷ | 7.6 × 10⁻⁵ | 9.4 × 10⁻⁵ | 1.2 × 10⁻³ |
The number of SNPs involved in final analysis, which are less than 100 kb from the target probe. The SNPs with missing rate larger than 2%, or the minor allele frequencies (MAFs) less than 0.1 were excluded from the analysis. For two SNPs with r2 larger than 0.9, the one with a smaller MAF is discarded.
The P-values of AdaJoint, ARTP and Min-p were calculated based on 109 replicates of permutation.
Simulation studies
We conducted extensive simulation studies to compare performances among AdaJoint, Min-p, ARTP and SKAT. We used genotypes generated by the two pancreatic cancer GWAS as a template for the simulation. We first focused on selected genes with different sizes, RP11-35N6.1 with 57 SNPs, and ADAMTS12 with 108 SNPs. For each gene, we considered a variety of scenarios for the underlying risk models, which are summarized in Supplementary Table 1. Each simulated data set consisted of 3000 cases and 3000 controls. The log odds ratio for each scenario was chosen such that the powers of the considered tests were reasonably large. Genotypes for controls were directly sampled from the GWAS with their LD pattern maintained. For cases, their genotypes at the considered gene were assigned by sampling from the same data set with weights specified by the risk model (see Yu et al 17 for more details on how the genotypes were assigned). In Table 4, we investigated the empirical type I errors of the five tests at the level α=0.05 and α=1.0 × 10⁻⁴ based on 106 replicated null data sets. All tests appeared to have proper type I error under the level 0.05. However, SKAT had some inflation under the level α=1.0 × 10⁻⁴ while the other four tests still maintaining the expected type I error.
Table 4. Empirical type I errors based on 106 replicates of simulation conducted at gene RP11-35N6.1 and ADAMTS12.
| Level | AdaJoint | ARTP | SKAT | Min-p |
|---|---|---|---|---|
| RP11-35N6.1 | ||||
| 0.05 | 0.049 | 0.051 | 0.047 | 0.051 |
| 1.0·10−4 | 1.0 × 10⁻⁴ | 9.8 × 10⁻⁵ | 1.6 × 10⁻⁴ | 8.3 × 10⁻⁵ |
| ADAMTS12 | ||||
| 0.05 | 0.049 | 0.047 | 0.047 | 0.049 |
| 1.0 × 10⁻⁴ | 9.2 × 10⁻⁵ | 9.6 × 10⁻⁵ | 2.2 × 10⁻⁴ | 1.2 × 10⁻⁴ |
The power simulations were summarized based on 1000 replicated data sets at the nominal level of 0.05. The empirical powers at the gene RP11-35N6.1 are summarized in Figure 3 (a). All tests had comparable powers under scenarios 1–4. However, when there were two causal SNPs (with r2=0.54) and their minor alleles affected the disease risk in opposite directions, the power advantage of the AdaJoint test was obvious (with power of 0.92, 0.34, 0.34 and 0.25 for AdaJoint, Min-p, ARTP and SKAT, respectively).
Figure 3.
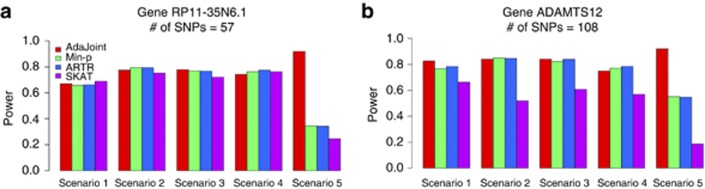
Power comparison based on simulations conducted at gene (a) RP11-35N6.1 with 57 SNPs and (b) ADAMTS12 with 108 SNPs. The risk model scenarios are summarized in Supplementary Table 1 (Supplemental Materials).
We also compared the performance of those five tests at the larger gene ADAMTS12, where the signal-to-noise ratio can be very low if there are just one or two causal SNPs. The results are summarized in Figure 3 (b). The aggregation approach used by SKAT did not perform well in all considered scenarios as it included too many irrelevant SNPs. AdaJoint, Min-p, and ARTP had similar performance under scenario 1–4. But once again, under scenario 5, when the minor allele for one of two causal SNPs was protective and the other was deleterious, AdaJoint showed a clear advantage over the remaining tests (with power of 0.92, 0.55, 0.55 and 0.19 for AdaJoint, Min-p, ARTP and SKAT, respectively).
Finally, we compared the power of the four tests using a simulation study design similar to that in Wu et al 23. We focused on the gene MYO9B, with 25 relatively common SNPs (MAFs 0.079–0.49). In this simulation, we considered 25 scenarios. Under each scenario, one of the 25 SNPs was designated as the causal SNP, with its genotype not available for analysis. We generated 1000 data sets, each consisting of 3000 cases and 3000 controls. Genotypes at 24 SNPs (excluding the one chosen as the causal SNP) were available for the gene-based analysis. The odds ratio for each causal SNP was chosen such that the power of the 1-df score test for detecting the causal SNP was 0.9 under the type I error rate of 0.05, given the minor allele frequency (MAF) of the causal SNP and the sample sizes. Figure 4 illustrated the powers of the five considered tests for each of 25 scenarios. In the figure, these 25 scenarios were arranged on the horizontal axis according to the mean of the top five r2's measured between the designated causal SNP and each of the other 24 SNPs. We can see from the figure that no method can completely dominate the others. The SKAT test showed some advantages when the unmeasured causal SNP was in high LD with the other measured SNPs (the mean of the top five r2 is over 0.4), but the AdaJoint test was more favorable in other cases.
Figure 4.

Power comparison based on simulations conducted at gene MYO9B. Each bar corresponds to the case where the only causal SNP is excluded from the samples and the five tests aggregate the signals from the remaining SNPs. The odds ratio of the causal SNP is chosen such that the power of its 1-df score test is 0.9 under the level 0.05, given its MAFs and 3000/3000 case-control sample sizes. The number under the bar is the mean of the top five r2's measured between the designated causal SNP and each of the other 24 SNPs.
Overall, we demonstrated that the AdaJoint test has the most robust performance over other considered methods, especially in situations where there were multiple correlated causal SNPs in the considered gene or region.
Computational efficiency
The proposed AdaJoint test benefits from several computationally efficient algorithms and it is suitable for genome-wide gene-based analysis. We showed in Supplementary Table 2 (Supplemental Materials) the running time of the AdaJoint test with two different simulation strategies, the DSA and the standard permutation procedure, for the evaluation of P-value. For each gene, the simulated data set included 3000 cases and 3000 controls. The experiment was carried out on a 2.8 GHz Xeon CPU Linux machine, with 105 iterations for each simulation strategy. At each of the iterations, calculating the sum of scores over individuals takes time O(n) (n is the sample size), which is time consuming. This is the main reason why the standard permutation procedure is much slower, compared with the DSA. With 104 iterations, AdaJoint took less than 36 h to scan all of the 26 247 genes in the gene-based analysis of the pancreatic cancer GWAS dataset (3275 cases and 3376 controls). In practice, we can further save computing time by choosing the number of iterations adaptively, based on the current estimate of the P-value, as the main goal is often to identify genes with P-values less than a given threshold.
Discussion
We propose a novel adaptive joint test (AdaJoint) as a multilocus test that takes the LD structure into account and adopts a proper variable selection procedure to maximize the association signal. The significance of the multilocus test is evaluated by a computationally efficient algorithm that can be hundreds of times faster than the standard permutation-based method. We also extended the test to analyze quantitative outcome. We demonstrate the advantage of the new test through a large-scale GWAS of pancreatic cancer and a methylation study on normal breast tissues. Extensive simulation studies are conducted to further investigate the performance of the test.
When conducting a gene-based test screening for all genes/regions in the genome, we inevitably will encounter very small P-values, given that there are usually over 20 000 genes/regions to scan in an agnostic search throughout the genome, even under the complete null scenario, i.e. none of the considered genes is related to the outcome. Assuming a family-wide false-positive rate of 0.05, the P-value threshold for a gene to reach the global significance level is around 0.05/20 000=2.5 × 10⁻⁶, which requires about 108 resampling iterations in order to reach a reasonably accurate estimate.24 Even with the DSA method, which generates samples directly from a multivariate normal distribution, it still can be computationally demanding if the calculation of the test statistic is not straightforward. We can adopt the recently developed stochastic approximation Monte Carlo algorithm24, 33 to evaluate extremely small P-values when the DSA method becomes too time consuming.
The idea of the AdaJoint test can be easily extended to pathway analysis in which multiple genes are considered simultaneously and the statistical conclusion will be reached via a pathway approach.34 For example, we can use the AdaJoint test statistic as the gene-level summary in the pathway analysis framework proposed by Yu et al.17 We have created an R package, AdaJoint, for both multilocus test and pathway analysis using the AdaJoint test (URL: http://dceg.cancer.gov/bb/tools/AdaJoint).
We used the score test statistic to summarize association signal from multiple SNPs in the AdaJoint test. The use of the score statistic is appropriate for SNPs with relatively large MAFs (eg larger than 2%), but is not optimal for studying rare variants, because the optimality of the score test statistic is not valid anymore when dealing with nearly independent rare variants. We can replace the score test statistic with any test statistic targeting rare variants, such as the burden test,35 and use the same framework as the AdaJoint test does to study a group of rare variants. A detailed investigation of this approach and its comparison with existing methods are beyond the scope of this paper, and would be a future research topic.
GWAS and other genetic studies have created a gold mine of information that can be explored for deciphering the genetic code underlying various traits. So far, the single-marker analysis is still the more dominant approach for detecting susceptibility loci. As recent studies have suggested, a joint analysis of multiple loci can uncover some of the missing heritability; thus it should be considered as a valuable alternative, complementing the single-marker approach. The proposed method provides a much needed and powerful tool for such a purpose.
Acknowledgments
We thank three anonymous referees for their helpful comments. This study utilized the high-performance computational capabilities of the Biowulf Linux cluster at the National Institutes of Health, Bethesda, MD. (http://biowulf.nih.gov). The work of H Zhang, J Shi, R Stolzenberg-Solomon and K Yu were supported by the Intramural Program of the National Institutes of Health and the National Cancer Institute. The work of F Liang was supported in part by the National Science Foundation (DMS-0607755, CMMI-0926803); and the award (KUS-C1-016-04) made by the King Abdullah University of Science and Technology.
The authors declare no conflict of interest.
Footnotes
Supplementary Information accompanies this paper on European Journal of Human Genetics website (http://www.nature.com/ejhg)
Supplementary Material
References
- Yang J, Ferreira T, Morris AP, et al. Conditional and joint multiple-SNP analysis of GWAS summary statistics identifies additional variants influencing complex traits. Nat Genet. 2012;44 (369-375:S361–S363. doi: 10.1038/ng.2213. [DOI] [PMC free article] [PubMed] [Google Scholar]
- Ke X. Presence of multiple independent effects in risk loci of common complex human diseases. Am J Hum Genet. 2012;91:185–192. doi: 10.1016/j.ajhg.2012.05.020. [DOI] [PMC free article] [PubMed] [Google Scholar]
- Bacanu SA. On optimal gene-based analysis of genome scans. Genet Epidemiol. 2012;36:333–339. doi: 10.1002/gepi.21625. [DOI] [PubMed] [Google Scholar]
- Fan R, Knapp M. Genome association studies of complex diseases by case-control designs. Am J Hum Genet. 2003;72:850–868. doi: 10.1086/373966. [DOI] [PMC free article] [PubMed] [Google Scholar]
- Han F, Pan W. Powerful multi-marker association tests: unifying genomic distance-based regression and logistic regression. Genet Epidemiol. 2010;34:680–688. doi: 10.1002/gepi.20529. [DOI] [PMC free article] [PubMed] [Google Scholar]
- Li M, Wang K, Grant SF, Hakonarson H, Li C. ATOM: a powerful gene-based association test by combining optimally weighted markers. Bioinformatics. 2009;25:497–503. doi: 10.1093/bioinformatics/btn641. [DOI] [PMC free article] [PubMed] [Google Scholar]
- Li MX, Gui HS, Kwan JS, Sham PC. GATES: a rapid and powerful gene-based association test using extended Simes procedure. Am J Hum Genet. 2011;88:283–293. doi: 10.1016/j.ajhg.2011.01.019. [DOI] [PMC free article] [PubMed] [Google Scholar]
- Liu JZ, McRae AF, Nyholt DR, et al. A versatile gene-based test for genome-wide association studies. Am J Hum Genet. 2010;87:139–145. doi: 10.1016/j.ajhg.2010.06.009. [DOI] [PMC free article] [PubMed] [Google Scholar]
- Schaid DJ, McDonnell SK, Hebbring SJ, Cunningham JM, Thibodeau SN. Nonparametric tests of association of multiple genes with human disease. Am J Hum Genet. 2005;76:780–793. doi: 10.1086/429838. [DOI] [PMC free article] [PubMed] [Google Scholar]
- Wessel J, Schork NJ. Generalized genomic distance-based regression methodology for multilocus association analysis. Am J Hum Genet. 2006;79:792–806. doi: 10.1086/508346. [DOI] [PMC free article] [PubMed] [Google Scholar]
- Zaykin DV, Meng Z, Ehm MG. Contrasting linkage-disequilibrium patterns between cases and controls as a novel association-mapping method. Am J Hum Genet. 2006;78:737–746. doi: 10.1086/503710. [DOI] [PMC free article] [PubMed] [Google Scholar]
- Bacanu SA, Nelson MR, Ehm MG. Comparison of association methods for dense marker data. Genet Epidemiol. 2008;32:791–799. doi: 10.1002/gepi.20347. [DOI] [PubMed] [Google Scholar]
- Chen LS, Hutter CM, Potter JD, et al. Insights into colon cancer etiology via a regularized approach to gene set analysis of GWAS data. Am J Hum Genet. 2010;86:860–871. doi: 10.1016/j.ajhg.2010.04.014. [DOI] [PMC free article] [PubMed] [Google Scholar]
- Gauderman WJ, Murcray C, Gilliland F, Conti DV. Testing association between disease and multiple SNPs in a candidate gene. Genet Epidemiol. 2007;31:383–395. doi: 10.1002/gepi.20219. [DOI] [PubMed] [Google Scholar]
- Wang K, Abbott D. A principal components regression approach to multilocus genetic association studies. Genet Epidemiol. 2008;32:108–118. doi: 10.1002/gepi.20266. [DOI] [PubMed] [Google Scholar]
- Huang H, Chanda P, Alonso A, Bader JS, Arking DE. Gene-based tests of association. PLoS Genet. 2011;7:e1002177. doi: 10.1371/journal.pgen.1002177. [DOI] [PMC free article] [PubMed] [Google Scholar]
- Yu K, Li Q, Bergen AW, et al. Pathway analysis by adaptive combination of P-values. Genet Epidemiol. 2009;33:700–709. doi: 10.1002/gepi.20422. [DOI] [PMC free article] [PubMed] [Google Scholar]
- Hastie T, Tibshirani R, Friedman JH.The elements of statistical learning: data mining, inference, and prediction2nd edn.Springer: New York, NY; 2009 [Google Scholar]
- McCullagh P, Nelder J.1989Generalized Linear Models2nd ednBoca Raton: Chapman and Hall/CRC; ISBN 0-412-31760-5. [Google Scholar]
- Conneely KN, Boehnke M. So many correlated tests, so little time! Rapid adjustment of P values for multiple correlated tests. Am J Hum Genet. 2007;81:1158–1168. doi: 10.1086/522036. [DOI] [PMC free article] [PubMed] [Google Scholar]
- Ge Y, Dudoit S, Speed T. Resampling-based multiple testing for microarray data analysis. Test. 2003;12:1–77. [Google Scholar]
- Seaman SR, Muller-Myhsok B. Rapid simulation of P values for product methods and multiple-testing adjustment in association studies. Am J Hum Genet. 2005;76:399–408. doi: 10.1086/428140. [DOI] [PMC free article] [PubMed] [Google Scholar]
- Wu MC, Kraft P, Epstein MP, et al. Powerful SNP-set analysis for case-control genome-wide association studies. Am J Hum Genet. 2010;86:929–942. doi: 10.1016/j.ajhg.2010.05.002. [DOI] [PMC free article] [PubMed] [Google Scholar]
- Yu K, Liang F, Ciampa J, Chatterjee N. Efficient P-value evaluation for resampling-based tests. Biostatistics. 2011;12:582–593. doi: 10.1093/biostatistics/kxq078. [DOI] [PMC free article] [PubMed] [Google Scholar]
- Mailman MD, Feolo M, Jin Y, et al. The NCBI dbGaP database of genotypes and phenotypes. Nat Genet. 2007;39:1181–1186. doi: 10.1038/ng1007-1181. [DOI] [PMC free article] [PubMed] [Google Scholar]
- Amundadottir L, Kraft P, Stolzenberg-Solomon RZ, et al. Genome-wide association study identifies variants in the ABO locus associated with susceptibility to pancreatic cancer. Nat Genet. 2009;41:986–990. doi: 10.1038/ng.429. [DOI] [PMC free article] [PubMed] [Google Scholar]
- Petersen GM, Amundadottir L, Fuchs CS, et al. A genome-wide association study identifies pancreatic cancer susceptibility loci on chromosomes 13q22.1, 1q32.1 and 5p15.33. Nat Genet. 2010;42:224–228. doi: 10.1038/ng.522. [DOI] [PMC free article] [PubMed] [Google Scholar]
- Pritchard JK, Stephens M, Donnelly P. Inference of population structure using multilocus genotype data. Genetics. 2000;155:945–959. doi: 10.1093/genetics/155.2.945. [DOI] [PMC free article] [PubMed] [Google Scholar]
- Bell JT, Pai AA, Pickrell JK, et al. DNA methylation patterns associate with genetic and gene expression variation in HapMap cell lines. Genome Biol. 2011;12:R10. doi: 10.1186/gb-2011-12-1-r10. [DOI] [PMC free article] [PubMed] [Google Scholar]
- Gibbs JR, van der Brug MP, Hernandez DG, et al. Abundant quantitative trait loci exist for DNA methylation and gene expression in human brain. PLoS Genet. 2010;6:e1000952. doi: 10.1371/journal.pgen.1000952. [DOI] [PMC free article] [PubMed] [Google Scholar]
- Zhang D, Cheng L, Badner JA, et al. Genetic control of individual differences in gene-specific methylation in human brain. Am J Hum Genet. 2010;86:411–419. doi: 10.1016/j.ajhg.2010.02.005. [DOI] [PMC free article] [PubMed] [Google Scholar]
- The Cancer Genome Atlas Network Comprehensive molecular portraits of human breast tumours. Nature. 2012;490:61–70. doi: 10.1038/nature11412. [DOI] [PMC free article] [PubMed] [Google Scholar]
- Liang F, Liu C, Carroll RJ. Stochastic approximation in Monte Carlo computation. J Am Stat Assoc. 2007;102:305–320. [Google Scholar]
- Wang K, Li M, Hakonarson H. Analysing biological pathways in genome-wide association studies. Nat Rev Genet. 2010;11:843–854. doi: 10.1038/nrg2884. [DOI] [PubMed] [Google Scholar]
- Madsen BE, Browning SR. A groupwise association test for rare mutations using a weighted sum statistic. PLoS Genet. 2009;5:e1000384. doi: 10.1371/journal.pgen.1000384. [DOI] [PMC free article] [PubMed] [Google Scholar]
Associated Data
This section collects any data citations, data availability statements, or supplementary materials included in this article.