

Abstract
Chinese strong-flavored liquor (CSFL) accounts for more than 70% of all Chinese liquor production. Microbes in pit mud play key roles in the fermentation cellar for the CSFL production. However, microbial diversity, community structure, and cellar-age-related changes in pit mud are poorly understood. Here, we investigated the prokaryotic community structure and diversity in pit-mud samples with different cellar ages (1, 10, 25, and 50 years) using the pyrosequencing technique. Results indicated that prokaryotic diversity increased with cellar age until the age reached 25 years and that prokaryotic community structure changed significantly between three cellar ages (1, 10, and 25 years). Significant correlations between prokaryotic communities and environmental variables (pH, NH4+, lactic acid, butyric acid, and caproic acid) were observed. Overall, our study results suggested that the long-term brewing operation shapes unique prokaryotic community structure and diversity as well as pit-mud chemistry. We have proposed a three-phase model to characterize the changes of pit-mud prokaryotic communities. (i) Phase I is an initial domestication period. Pit mud is characterized by abundant Lactobacillus and high lactic acid and low pH levels. (ii) Phase II is a transition period. While Lactobacillus abundance decreases dramatically, that of Bacteroidetes and methanogens increases. (iii) Phase III is a relative mature period. The prokaryotic community shows the highest diversity and capability to produce more caproic acid as a precursor for synthesis of ethyl caproate, the main flavor component in CSFL. This research provides scientific evidence to support the practical experience that old fermentation cellars produce high-quality liquor.
INTRODUCTION
Chinese strong-flavored liquor (CSFL), also called “Luzhou flavor liquor,” accounts for more than 70% of Chinese liquor production (1). It is produced by the unique and traditional Chinese solid-state fermentation technique, which has a history of several thousand years. In brief, a cellar is constructed by digging a rectangular soil pit in which the entire inner wall is covered with precultured pit mud. The precultured pit mud is usually prepared by mixing aged pit mud (as an inoculum), fresh common soil, and water and incubating the mixture for about a year in an anaerobic cellar before use. The raw materials for the fermentation, including wheat, sorghum, and corn, are mixed, crushed, and distilled by steaming. The steamed raw material is supplied with 2% to 3% (wt/wt) Daqu-starter, which mainly includes mold and yeast, and placed into the cellar. The cellar is sealed with common mud, and fermentation is allowed to proceed for 60 days. Fermented material is then taken out of the cellar and distilled to make Chinese liquor. The process described above is periodically repeated after new fermentation materials are supplied.
Microbes in the pit mud produce various flavor components such as butyric acid, caproic acid, and ethyl caproate. In particular, ethyl caproate is recognized as a key component affecting the CSFL flavor and quality. In general, CSFL quality improves with increasing cellar age. High-quality liquor is produced only in old cellars, which are maintained at least for 20 years by continuous use (2, 3). In particular, some long-aged cellars have been used for several hundred years without interruption, and well-known CSFLs such as Wuliangye, Jiannanchun, and Luzhoulaojiao are brewed in such long-aged cellars (1, 4). High CSFL quality is attributed to the maturing process of pit mud, which results in a well-balanced microbial community structure and diversity in the pit mud to produce distinctive flavors.
The pit mud acts as a source of inoculum and a habitat of microbes in the brewing fermentation cellar for the CSFL production. Previously, the pit-mud microbiota had been studied using cultivation-dependent and -independent approaches. Members of Clostridium, Bacillus, and Sporolactobacillus genera were isolated and identified from the pit-mud samples (5, 6). Members of six bacterial phyla, including Firmicutes, Bacteroidetes, Chloroflexi, Actinobacteria, unclassified Bacteria, and Proteobacteria, and of one archaeal phylum, Euryarchaeota, were identified from the pit-mud samples using denaturing gradient gel electrophoresis (DGGE) and clone library analysis of the 16S rRNA gene (7, 8). However, big discrepancies in microbial composition existed among previous investigations. This may be attributable to differences in sampling locations in a pit, cellar ages, and laboratory techniques employed to characterize the community structure. In addition, most of the previous studies on the pit-mud microbiota using traditional cultural and molecular methods cannot provide details of the phylogenetic composition and cellar-age-related changes of the pit-mud microbial community. Without such information, the specific microbes controlling the CSFL quality cannot be identified.
In this study, we investigated prokaryotic communities in the pit mud from different-aged cellars used for CSFL production with the 16S rRNA gene pyrosequencing technique. Pit-mud samples were collected from a famous CSFL manufacturer located in Sichuan province, China. The aims were to (i) characterize prokaryotic community structure and diversity and their cellar-age-related changes in the pit mud, (ii) identify important prokaryotic populations in the maturing process of pit mud and their possible roles in the CSFL quality, and (iii) unveil the relationships between chemical properties of pit mud and prokaryotic community structure and diversity.
MATERIALS AND METHODS
Sample collection.
Pit mud samples were collected from a famous brewing manufacturer located in Mianzhu city, Sichuan province, China. We selected cellars used for 1, 10, 25, and 50 years for sampling. Five cellars were selected for each cellar age. Triplicate samples were collected in each cellar. Thus, 60 samples were obtained from 20 cellars representing four ages. After sequencing, we found that prokaryotic communities were similar among triplicate samples from the same cellar. Thus, sequencing data of triplicate samples from the same cellar were merged and used for the downstream analysis. Samples were transferred to the laboratory on ice and kept at −80°C.
Chemical property analysis.
Pit-mud moisture was determined with a gravimetric method by drying soils at 60°C for 48 h immediately after the sampling. The pH was measured by a pH meter in the slurry, with a 1:5 ratio of pit mud to deionized water. Total nitrogen (TN) was determined with the Kjeldahl method (9). NH4+ concentration was determined using the sodium salicylate method (10). Humic acid content was determined according to the method described by Mehlich (11). Major organic acids (lactic acid, acetic acid, butyric acid, and caproic acid) were quantified using an ion chromatograph (Metrohm 761 Compact IC) equipped with a conductivity detector and an ion exclusion column (Metrosep Organic Acids 6.1005.200) following the method described by Rozendal et al. (12).
DNA extraction, PCR amplification, and pyrosequencing.
Genomic DNA was extracted using a PowerSoil DNA isolation kit (MoBio Laboratories). For pyrosequencing, the V4-V5 hypervariable region of 16S rRNA genes was amplified with universal primers 515F (5′-GTGYCAGCMGCCGCGGTA-3′) and 909R (5′-CCCCGYCAATTCMTTTRAGT-3′) (13). The detailed PCR conditions were as described by Li et al. (14). The bar-coded amplicons were pooled with equimolar concentrations of the samples and sequenced using a GS FLX+ pyrosequencing system (454 Life Sciences).
Pyrosequencing data processing.
The raw sequences were sorted based on unique sample tags, trimmed for sequence quality, and denoised using QIIME pipeline (15). Chimera sequences were removed using the Uchime algorithm (16). The sequences were clustered by the complete-linkage clustering method incorporated in the QIIME pipeline. Operational taxonomic units (OTUs) were classified using 97% of 16S rRNA gene sequence similarity as a cutoff. Only the OTUs containing at least 5 reads were considered to be valid OTUs in this study. Shannon index and Chao1 estimator values were calculated in RDP at 97% sequence similarity (http://pyro.cme.msu.edu/). The phylogenetic affiliation of each sequence was analyzed by RDP Classifier at a confidence level of 80%. The original pyrosequencing data are available at the European Nucleotide Archive (see below).
Statistical analysis.
Overall structural changes of prokaryotic communities were evaluated by principal coordinates analysis (PCoA) in Fast UniFrac (http://bmf.colorado.edu/fastunifrac/). The cluster analysis (CA) was conducted with the unweighted-pair group method using average linkages (UPGMA) based on the Bray-Curtis distance in PAST (17). The statistical significance among data sets was assessed by PerMANOVA using the weighted PCoA scores in PAST (http://folk.uio.no/ohammer/past/). The Mantel test was applied to evaluate the correlations between prokaryotic communities and environmental variables using PASSaGE (18). Environmental variables providing the highest Pearson's correlation coefficients with prokaryotic communities were selected using the BioEnv procedure, and variance partitioning analysis (VPA) was performed to quantify the relative contributions of environmental variables using the varpart procedure in the R package Vegan (http://cran.r-project.org/web/packages/vegan/index.html). Redundancy analysis (RDA) was performed using CANOCO 4.5 software (Microcomputer Power, Ithaca, NY). The statistical significance of the difference between the means of samples was tested by one-way analysis of variance (ANOVA) with the Tukey post hoc test.
Nucleotide sequence accession number.
The original pyrosequencing data are available at the European Nucleotide Archive (accession no. PRJEB4986).
RESULTS
Pit-mud chemical properties.
Levels of pit-mud moisture, humic content, TN, and acetic acid from different cellar samples did not significantly differ. However, the pH, NH4+, humic matter, caproic acid, butyric acid, and lactic acid contents changed significantly with increasing cellar age (Table 1). 1-year samples had the highest concentrations of lactic acid and butyric acid but the lowest pH and concentrations of NH4+ and caproic acid. While pH and NH4+ were significantly increased (P < 0.05) in the 10-year samples, the lactic acid content declined by 65% in the 10-year samples compared to that in the 1-year samples (P < 0.01) and continued to decline in the 25-year and 50-year samples. Caproic acid content increased significantly after 25 years. Moreover, significant differences between the 25-year and 50-year samples were not observed in most measured variables.
TABLE 1.
Chemical properties in the pit mud
| Variable | Values for cellar of age (yr)a: |
|||
|---|---|---|---|---|
| 1 | 10 | 25 | 50 | |
| pH | 3.57 ± 0.06a | 5.00 ± 0.78ac | 5.51 ± 0.64bc | 5.81 ± 0.33bc |
| NH4+ (g kg−1) | 1.86 ± 0.06a | 2.70 ± 0.47ac | 4.21 ± 0.67b | 3.55 ± 0.68bc |
| Moisture (%) | 43.3 ± 1.9a | 44.5 ± 2.9a | 45.1 ± 2.5a | 44.1 ± 5.0a |
| Humic matter (%) | 30.1 ± 3.6a | 26.4 ± 1.2a | 24.9 ± 7.3a | 21.4 ± 5.6b |
| TN (%) | 16.0 ± 0.6a | 16.8 ± 2.0a | 18.1 ± 2.1a | 16.2 ± 1.7a |
| Acetic acid (g kg−1) | 4.13 ± 0.63a | 2.94 ± 0.70a | 4.37 ± 0.98a | 3.98 ± 0.86a |
| Butyric acid (g kg−1) | 2.89 ± 0.20a | 1.77 ± 0.1b | 2.02 ± 0.63b | 1.63 ± 0.24b |
| Caproic acid (g kg−1) | 5.79 ± 0.72a | 6.51 ± 3.35a | 20.0 ± 8.66b | 15.2 ± 7.7b |
| Lactic acid (g kg−1) | 166.5 ± 12.5a | 59.1 ± 21.3b | 26.2 ± 10.3b | 29.8 ± 4.5b |
All data are presented as means ± standard deviations (n = 5). Values with different letters in a row mean significant differences at P < 0.05 as determined by ANOVA.
Overall prokaryotic community structure and diversity.
In total, 494,293 qualified reads with an average length of 397 bp were obtained from all pit-mud samples and each sample contained 6,568 to 10,992 reads (see Table S1 in the supplemental material). A total of 796 OTUs were obtained based on 3% dissimilarity in 16S rRNA sequences, considering those OTUs with ≥5 sequences to be valid ones. Rarefaction analysis indicated that all prokaryotic communities were well represented since the rarefaction curves were approaching the saturation plateau (see Fig. S1 in the supplemental material).
Based on the relative abundances of OTUs, prokaryotic communities in 20 cellars formed three clusters as follows: (i) group I contained all the 1-year samples and a 10-year sample, (ii) group II contained three 10-year samples, and (iii) group III contained all the 25- and 50-year samples and a 10-year sample (Fig. 1a). The grouping patterns determined on the basis of all the taxonomic ranks from the order to the OTU level were similar (data not shown).
FIG 1.
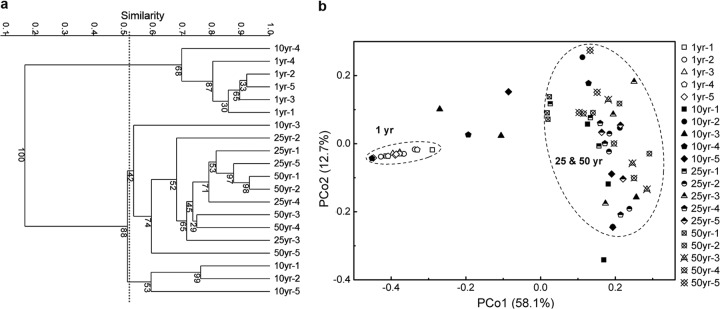
Data represent cluster analysis of pit-mud prokaryotic communities based on Bray-Curtis distances (a) and principal coordinate analysis using weighted UniFrac (b). Five replicate samples with same cellar age are shown as “#yr-1” to “#yr-5”; e.g., “10yr-1” represents the first replicate sample from 10-year-old cellars.
PCoA analysis was conducted to evaluate similarities in different communities using Unifrac approaches. Although there was a slight difference between the cluster analysis and PCoA results, similar clustering patterns were observed. One-year samples tended to form clusters, and 25- and 50-year samples formed clusters as well. The 10-year samples were either distributed close to the 1-year cluster or dispersed within the 25- and 50-year cluster, suggesting that they were in a transitional state. The differences among 25-year and 50-year samples were larger than those among 1-year samples. Cellar age was the main factor in the first principal coordinate axis (PCo1) and contributed 58.1% of the total variation (Fig. 1b).
The lowest diversity was observed in the 1-year samples. Shannon's diversity index increased significantly with cellar age (P < 0.05) from 1-year-old to 25-year-old pit mud, and it became constant in the 25-year-old to 50-year-old pit mud. Richness levels (OTUs) were similar in the 1-year and 10-year samples and significantly increased in the 25-year and 50-year samples (P < 0.05). In general, no significant differences between the 25-year and 50-year samples in the diversity and richness indices were observed (Table 2).
TABLE 2.
Prokaryotic diversity indices calculated based on a cutoff of 97% similarity of 16S rRNA gene sequences and 5,652 reads per samplea
| Cellar age (yr) | Chao1 | Observed OTU | Shannon index |
|---|---|---|---|
| 1 | 403.2 ± 72.1ac | 247.2 ± 18.0ac | 3.26 ± 0.55a |
| 10 | 335.1 ± 33.1bc | 221.2 ± 17.3a | 4.70 ± 0.74b |
| 25 | 457.1 ± 62.0a | 287.5 ± 19.2b | 5.61 ± 0.16c |
| 50 | 413.3 ± 69.5ac | 275.0 ± 33.8bc | 5.50 ± 0.30c |
All data are presented as means ± standard deviations (n = 5). Values with different letters in a column mean significant differences at P < 0.05 as determined by ANOVA.
General phylogenetic composition of pit-mud community.
In total, 91% of total reads were affiliated with bacterial phyla and 9.0% of total reads were assigned to archaeal phyla. The dominant bacterial phyla (>5% of total reads) were Firmicutes (64.5%) and Bacteroidetes (16.6%) (see Table S2 in the supplemental material). Archaea were dominated by Euryarchaeota (9.0%). Crenarchaeota reads (0.007%) were rare. The relative abundance of archaeal reads increased in the 10-year and older samples.
Prokaryotic compositions in the 10- to 50-year samples were not significantly changed. We defined core prokaryotic genera as those detected in all pit-mud samples and with relative abundance higher than 1.0% in the 10- to 50-year samples. These dominant genera included 10 bacterial genera, Lactobacillus, Petrimonas, Clostridium IV, Sedimentibacter, Syntrophomonas, Spirochaetes SHA-4, unclassified Porphyromonadaceae, Anaerobrancaceae, Clostridiaceae 1, and Ruminococcaceae, and 4 archaeal genera, Methanoculleus, Methanosarcina, Methanobacterium, and Methanobrevibacter (Table 3). In general, these genera constituted 66% to 68% of the total abundance and they significantly changed in abundance with cellar age.
TABLE 3.
Relative abundances of core prokaryotic communities in the pit mud from cellars of different ages
| Phylum and genus | % relative abundance in cellars of age (yr)a: |
|||
|---|---|---|---|---|
| 1 | 10 | 25 | 50 | |
| Bacteroidetes | 1.37 ± 0.63a | 20.83 ± 9.22b | 23.32 ± 4.45b | 18.62 ± 6.01b |
| Petrimonas | 0.94 ± 0.45a | 11.19 ± 5.31b | 16.69 ± 2.73b | 12.02 ± 4.95b |
| Unclassified Porphyromonadaceae | 0.28 ± 0.14a | 6.45 ± 4.04b | 3.71 ± 1.13b | 4.39 ± 1.51b |
| Euryarchaeota | 0.58 ± 0.29a | 10.36 ± 4.29b | 11.44 ± 1.77b | 12.61 ± 3.32b |
| Methanobacterium | 0.15 ± 0.11a | 1.85 ± 1.30ac | 2.85 ± 2.42bc | 4.57 ± 1.74b |
| Methanobrevibacter | 0.12 ± 0.06a | 1.42 ± 0.76b | 1.94 ± 0.37b | 2.05 ± 0.68b |
| Methanoculleus | 0.16 ± 0.13a | 5.43 ± 4.73bc | 1.56 ± 0.35a | 2.05 ± 1.93ac |
| Methanosarcina | 0.12 ± 0.05a | 1.00 ± 1.04a | 4.52 ± 1.11b | 3.05 ± 1.94b |
| Firmicutes | 95.68 ± 0.95a | 63.12 ± 9.06b | 53.99 ± 5.71b | 54.42 ± 9.95b |
| Unclassified Anaerobrancaceae | 0.11 ± 0.06a | 1.21 ± 0.64b | 2.62 ± 0.92c | 2.46 ± 0.75c |
| Unclassified Clostridiaceae 1 | 0.16 ± 0.06a | 0.96 ± 0.42a | 4.97 ± 1.10b | 7.27 ± 2.93b |
| Sedimentibacter | 1.57 ± 0.20a | 4.05 ± 1.58b | 4.78 ± 0.84b | 3.34 ± 1.11b |
| Lactobacillus | 62.28 ± 7.88a | 16.07 ± 16.85b | 3.28 ± 2.25b | 4.23 ± 4.60b |
| Clostridium IV | 1.12 ± 0.23a | 8.79 ± 6.27b | 9.57 ± 2.91b | 12.71 ± 7.38b |
| Unclassified Ruminococcaceae | 0.50 ± 0.14a | 1.39 ± 0.43ac | 3.43 ± 1.29b | 1.96 ± 0.85c |
| Syntrophomonas | 0.45 ± 0.09a | 4.74 ± 1.47b | 4.53 ± 1.32b | 3.48 ± 1.68b |
| Spirochaetes | 0.12 ± 0.05a | 1.58 ± 1.84a | 3.88 ± 1.78b | 3.35 ± 2.13b |
| Spirochaetes SHA-4 | 0.12 ± 0.04a | 1.58 ± 1.84a | 3.60 ± 1.78b | 3.16 ± 2.10b |
All data are presented as means ± standard deviations (n = 5). Values with different letters in a row mean significant differences at P < 0.05 as determined by ANOVA.
Among 796 OTUs detected in all the pit-mud samples, the relative abundances of 90% OTUs were less than 1%. A total of 232 OTUs (29.1% of total OTU numbers) were shared by all samples. In addition, 91 (11.4%) unique phylotypes were observed in only one of the samples (see Fig. S2 in the supplemental material). These data indicated that the cellar-age-related changes occurred at the OTU level.
Cellar-age-related changes of prokaryotic community structure.
At the phylum level, Firmicutes dominated in the 1-year samples (95.7% of total reads) and dramatically decreased in abundance in the 10-year and older samples. However, Bacteroidetes, Euryarchaeota, and Spirochaetes increased significantly in the 10-year samples compared to the 1-year samples (Fig. 2 and Table 3). The decrease in Firmicutes was mainly driven by the decrease in the abundance of genus Lactobacillus, corresponding to the decrease in lactic acid concentration (Table 1). However, some Firmicutes groups, such as unclassified Anaerobrancaceae, unclassified Clostridiaceae 1, Sedimentibacter, Clostridium IV, unclassified Ruminococcaceae, and Syntrophomonas, increased their relative abundances in this process; those increases corresponded to the increase in methanogens and caproic acid concentration. These prokaryotic groups included recognized syntrophs, e.g., Syntrophomonas. Few Euryarchaeota sequences were detected in the 1-year samples. However, Euryarchaeota abundance significantly increased in the 10-year and older samples. Methanogens were mainly composed of hydrogenotrophic Methanobacterium, Methanobrevibacter, and Methanoculleus and acetoclastic Methanosarcina that utilize both hydrogen/CO2 and acetate. Pure acetoclastic methanogens, such as Methanosaeta, were not detected in pit-mud samples.
FIG 2.

Taxonomic classification of prokaryotic reads retrieved from different pit-mud samples at the phylum level using the RDP classifier with a confidence threshold of 80%.
In the 1-year samples, bacteria were dominated by OTU1574 (62.3% ± 7.9%), affiliated with Lactobacillus, followed by other abundant (>1%) OTUs belonging to OTU3924 (Bacillus), OTU811 (Garciella), OTU2976 (Clostridium XlVa), and OTU1593 (Desmospora). In the 10-year and older samples, the relative abundance of Lactobacillus OTU1574 decreased to up to 2.6% to 15.8% of total reads, and other dominant OTUs in the 1-year samples affiliated with Bacillus, Garciella, and Desmospora decreased to up to <0.1% of total reads. In contrast, the most abundant OTUs in the 10-year and older samples were mainly affiliated with Petrimonas (OTU1171, 2564), Clostridium IV (OTU2212), Sedimentibacter (OTU3437), unclassified Clostridia (OTU3893), Methanoculleus (OTU1262), Methanosarcina (OTU1750), Methanobacterium (OTU1234), and Methanobrevibacter (OTU1474) (see Fig. S3 in the supplemental material).
Relationships between prokaryotic communities and environmental variables.
Redundancy analysis (RDA) was performed to discern the possible relationship between prokaryotic community structure and environmental parameters (Fig. 3). Overall, the two axes explained 69.2% of the variation in microbial community differentiation, suggesting the remarkable correlation between prokaryotic community structure and environmental factors. Lactic acid levels mainly correlated positively with prokaryotic communities in the 1-year samples. However, caproic acid levels mainly correlated with those in the 25- and 50-year samples. TN, humic acid, and moisture content levels were not significantly correlated with the changes of prokaryotic community.
FIG 3.
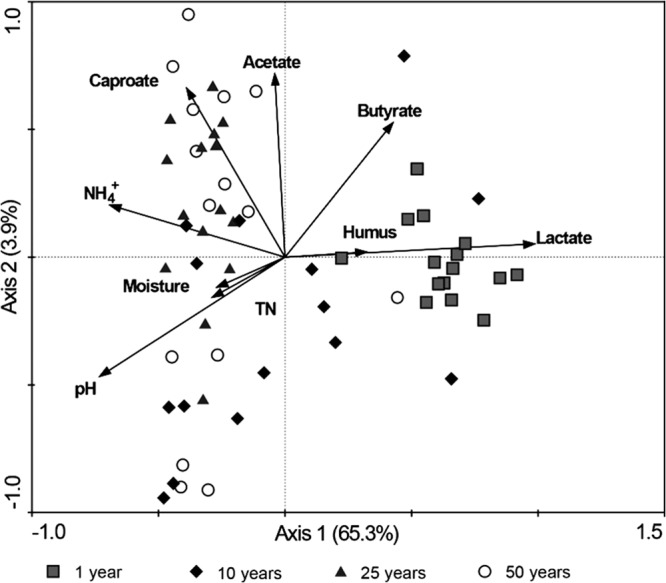
Redundancy analysis of prokaryotic community structure and measurable variables in the pit-mud samples. Arrows indicate the direction and magnitude of measurable variables associated with prokaryotic community structures.
The Mantel test further demonstrated that lactic acid, pH, NH4+, and butyric acid levels in the pit mud were significantly correlated with prokaryotic community structure at the OTU level (P < 0.01). Pearson's correlation analysis showed that pH and NH4+ content were positively correlated with the relative abundances of Bacteroidetes and Euryarchaeota but negatively with that of Firmicutes (see Table S3 in the supplemental material); however, lactic acid and butyric acid concentration levels showed contrasting correlations. The pH and NH4+ content increased with cellar age, corresponding to the increase in community diversity and caproic acid levels but to the decline in lactic acid levels and the relative abundance of Lactobacillus (Table 1 and 3).
Variance partitioning analyses (VPA) indicated that 64.7% of the variance in prokaryotic community structure could be explained by three major variables, lactic acid, pH, and NH4+, which could independently explain 62.9%, 34.8%, and 30.4% of the total variation. Moreover, significant interactive effects among three major variables, such as interaction of lactic acid with pH (33.7%), lactic acid with NH4+ (29.5%), and pH with NH4+ (17%), were observed (see Fig. S4 in the supplemental material).
DISCUSSION
The pit-mud microbiota is recognized to play important roles in the quality of Chinese liquor. For the first time, we unveiled prokaryotic community structure and diversity and their cellar-age-related changes in pit mud from CSFL fermentation cellars by the high-throughput pyrosequencing technique. Our results provided mechanistic explanations to link prokaryotic community structure and cellar-age-related changes with CSFL quality.
Cellar-age-related changes in prokaryotic community structure.
PCoA analysis indicated that prokaryotic communities in the 1-year samples were different from those in the 25-year and 50-year samples. The diversity of prokaryotes increased with cellar age and kept constant in the 25-year and 50-year samples (Fig. 1 and Table 2), while those in the 10-year pit-mud samples were in the transition state. On the basis of the observations reported above, we can separate the changes of pit-mud prokaryotic communities into three distinct phases. Phase I is the initial domestication period. During this phase, the starting microbial community is selected and niche assembled under specific environmental conditions (e.g., low pH and high lactic acid) created by the fermentation process in the cellar. The number of species (200 to 300 OTUs) was significantly lower than in most soil, generally harboring more than 1,000 OTUs (19). The loss in diversity and species richness had likely resulted from niche selection and the filtering out of species that could not tolerate the pit-mud environment. Although we did not investigate the prokaryotic community composition of parental soil used for the preparation of pit mud in this study, many studies have revealed that the bacterial community in aerobic soil is mainly composed of Acidobacteria, Actinobacteria, Proteobacteria, Bacteroidetes, and Firmicutes (19, 20). However, the pit-mud prokaryotic community was dominated by phylum Firmicutes (95.7%) after 1-year of domestication. This suggested that Firmicutes were selected by pit-mud conditions as the most acclimated prokaryotes.
Phase II is a transitional period during which the community structure changes dramatically. At this stage, we observed a significant increase in prokaryotic diversity. While the abundance of Firmicutes decreased, the abundances of Bacteroidetes, Spirochaetes, and archaea (mainly methanogens) increased (Table 3). It is likely that niche-selected populations from soil, the fermentation inoculum (Daqu-starter), or the surrounding air environment have gradually adapted to the biogeochemical environment of pit mud. In addition, long-term and periodic brewing fermentation lead to the production of organic acids and H2 and CO2 in pit mud, facilitating the growth of methanogens.
Phase III is the relative mature period of the pit-mud prokaryotic community. Prokaryotic diversity and richness are stable during this period and are markedly higher than in the young pit mud. The specific microbiota in the pit mud is selected by periodic fermentation and enrichment for more than 25 years without interruption. As a result, mutual collaborations and interactions among different prokaryotic species lead to a well-balanced prokaryotic community in the pit mud, which produces more caproic acid than in phases I and II; this also results in CSFL quality improvement.
Influence of environmental variables on the prokaryotic community.
This study revealed that lactic acid and pH were the most important factors influencing prokaryotic community structure in the pit mud. The pH was very low in the 1-year pit mud and increased in the older cellars. This corresponded to the high concentration of lactic acid in the 1-year pit mud and the high abundance of Lactobacillus bacteria, which produce lactic acid as the major end product in carbohydrate fermentation. The accumulation of lactic acid was likely to lower the pH in the 1-year pit-mud samples. This is consistent with a report that lactic acid accumulation led to the decline of ruminal pH (21). Belenguer et al. (22) also found that lactate and butyrate levels were largely correlated with pH. A decrease in soil pH tends to reduce overall diversity and to change the composition of prokaryotic communities (23, 24). Interestingly, a strong correlation of the prokaryotic community with the NH4+ level was also observed. The balance of NH4+ and fatty acid content may influence pH directly and, indirectly, the prokaryotic community structure. Niche-driven changes in the pit-mud prokaryotic community supported that environmental factors, not historical factors, determine the shift in the structure of a prokaryotic community (20, 25) in the pit mud.
Core prokaryotic communities and their relationships to CSFL quality.
The core microbiota (also called the core genera or populations) consists of dominant generalists. The genera Petrimonas, unclassified Clostridiaceae, Methanoculleus, Methanosarcina, and Methanobacterium were identified from pit-mud samples by DGGE or clone library methods in previous studies (7, 8, 26, 27). Here, we identified 14 genera, including 5 previously identified genera and Lactobacillus, Clostridium IV, Sedimentibacter, Syntrophomonas, Spirochaetes SHA-4, Methanobrevibacter, and unclassified Porphyromonadaceae, Anaerobrancaceae, and Ruminococcaceae, as the core microbiota in the pit mud using the pyrosequencing technique. The core microbiota contains fermentation bacteria, syntrophs, and methanogens, which play important roles in the maturing process of pit mud. The Lactobacillus species produce lactic acid as the major end product in carbohydrate fermentation (28). Petrimonas is reported to produce acetic acid, hydrogen, and CO2 during glucose fermentation (29). Sedimentibacter ferments amino acids and glycine to ethanol or to acetic acid and butyric acid (30, 31). Syntrophomonas can syntrophically degrade long-chain fatty acids into acetic acid and H2 in a coculture with methanogens (32, 33). The roles of some core genera in the pit mud, such as those of Clostridium IV, Spirochaetes SHA-4, and unclassified Porphyromonadaceae, Anaerobrancaceae, and Ruminococcaceae, were not well understood. Methanoculleus and Methanobacterium are hydrogenotrophic methanogens, while Methanosarcina utilize both H2 and acetic acid (34). The Methanosaeta, characterized by exclusive use of acetate, were not detected, suggesting that the hydrogenotrophic pathway predominated the CH4 production in the pit mud.
It is recognized that the quality of CSFL is highly correlated with ethyl caproic acid production through esterification of ethanol and caproic acid (35, 36). RDA indicated that caproic acid was mainly correlated with those prokaryotic communities in the 25- and 50-year samples (Fig. 3), indicating the importance of prokaryotes in the production of caproic acid. Caproic acid is a side product in the acidogenic fermentation of a complex biomass or sugars (37, 38). It is generally produced by anaerobic bacteria such as Clostridium kluyveri (39) and Eubacterium pyruvativorans (40) or by cocultures of C. kluyveri with ruminal cellulolytic bacteria using cellulose as a substrate (41). In this study, we observed significant correlations between caproic acid content and the relative abundances of four core prokaryotic populations (Lactobacillus, Clostridium IV [OTU2212], unclassified Clostridiaceae 1 [OTU3893], and unclassified Anaerobrancaceae [OTU3251]) (P < 0.01). Among them, Lactobacillus abundance was negatively correlated with caproic acid formation. It has been previously reported that the lactic acid producers restrain the production of caproic acid (42). In contrast, the relative abundances of three other core genera showed positive correlations to caproic acid production, and they were more abundant in old pit-mud samples. To our knowledge, no isolates closely related to these core genera or OTUs have been reported. We speculate that these core bacterial populations are involved in the formation of caproic acid or other flavoring components.
The abundances of methanogens were significantly higher in the 10-year to 50-year pit mud than in the 1-year pit mud. Although methanogens do not directly produce caproic acid, they can enhance caproic acid production through syntrophic cooperation between caproic-acid-producing bacteria and methanogens (5). Caproic acid formation and many other fermentation reactions are hydrogenogenic (38) under anaerobic conditions. The interspecies hydrogen transfer between caproic acid-producing or fermenting bacteria and methanogens controls hydrogen partial pressure under a certain threshold, which makes caproic acid formation and fermentation reactions thermodynamically more favorable.
In summary, this study revealed prokaryotic community structure and diversity in the pit mud from CSFL cellars of different ages using the pyrosequencing technique and identified the main factors influencing community structure. Fourteen core prokaryotic genera were identified whose species might play important roles in the maturing process of pit mud. Prokaryotic diversity and community structure became stable after 25 years or longer, which corresponded to the accumulation of caproic acid. Cellar-age-related changes of the prokaryotic community and diversity in the pit mud provided scientific evidence to support the practical experience that old fermentation cellars produce high-quality CSFL. Further research will be aimed at elucidating metabolic pathways and multiple syntrophic networks in the pit mud using metagenomic and metatranscriptomic approaches and at isolating representative key species for characterization of their biochemical pathways related to CSFL production.
Supplementary Material
ACKNOWLEDGMENTS
We thank the anonymous reviewers for the valuable comments and suggestions and Anna Doloman for manuscript editing.
This study was supported by the National Natural Science Foundation of China (31270531) and 973 project of China (no. 2013CB733502).
Footnotes
Published ahead of print 31 January 2014
Supplemental material for this article may be found at http://dx.doi.org/10.1128/AEM.04070-13.
REFERENCES
- 1.Zhao J, Zheng J, Zhou R, Shi B. 2012. Microbial community structure of pit mud in a Chinese strong aeomatic liquor fermentation pit. J. Inst. Brew. 118:356–360. 10.1002/jib.52 [DOI] [Google Scholar]
- 2.Xiong ZS. 2001. Origin and development of Chinese first fermentation pit-record of Luzhou laojiao liquor. Liquor-Mak. Sci. Technol. 104:17–22 (In Chinese.) 10.3969/j.issn.1001-9286.2001.02.001 [DOI] [Google Scholar]
- 3.Fu JQ. 2008. Liquor-making microbes in China research and application. China Light Industry Press, Beijing, China: (In Chinese.) [Google Scholar]
- 4.Xu Y, Wang D, Fan WL, Mu XQ, Chen J. 2010. Traditional Chinese biotechnology. Adv. Biochem. Eng. Biotechnol. 122:189–233. 10.1007/10_2008_36 [DOI] [PubMed] [Google Scholar]
- 5.Wu Y, Xue T, Chen Z, Lu S, Liu A, Lin S, Tang W, Tang H, Zhao X. 1991. Study on the distribution and action of anaerobic bacteria in Wuliangye old fermented pits. Acta Microbiol. Sin. 31:299–307 (In Chinese.) [Google Scholar]
- 6.Yue Y, Zhang W, Liu X, Hu C, Zhang S. 2007. Isolation and identification of facultative anaerobes in the pit mud of Chinese Luzhou-flavor liquor. Microbiol. Chin. 34:251–255 (In Chinese.) 10.3969/j.issn.0253-2654.2007.02.013 [DOI] [Google Scholar]
- 7.Wang M, Zhang W, Wang H, Liu C. 2012. Phylogenetic diversity analysis of archaeal in the pit mud with different cellar age. Chin. J. Appl. Environ. Biol. 18:1043–1048 (In Chinese.) http://www.cibj.com/en/oa/DArticle.aspx?type=view&id=201204035 [Google Scholar]
- 8.Wang M, Zhang W, Wang H, Liu C. 2013. Analysis of bacterial phylogenetic diversity of pit muds with different cellar ages. Food Sci. 34:177–181 (In Chinese.) http://www.spkx.net.cn/EN/abstract/abstract31149.shtml [Google Scholar]
- 9.Bremner JM, Mulvaney CS. 1982. Nitrogen—total, p 595–624 In Page AL, Miller RH, Keeney DR. (ed), Methods of soil analysis, part 2—chemical and microbiological properties, 2nd ed. American Society of Agronomy, Madison, WI [Google Scholar]
- 10.Mulvaney RL. 1996. Nitrogen—inorganic forms, p 1123–11184 In Sparks DL. (ed), Methods of soil analysis, Part 3—chemical methods. SSSA book series no. 5. SSSA and ASA, Inc, Madison, WI [Google Scholar]
- 11.Mehlich A. 1984. Photometric determination of humic matter in soils, a proposed method. Commun. Soil Sci. Plant Anal. 15:1417–1422. 10.1080/00103628409367569 [DOI] [Google Scholar]
- 12.Rozendal RA, Hamelers HVM, Euverink GJW, Metz SJ, Buisman CJN. 2006. Principle and perspectives of hydrogen production through biocatalyzed electrolysis. Int. J. Hydrogen Energy 31:1632–1640. 10.1016/j.ijhydene.2005.12.006 [DOI] [Google Scholar]
- 13.Tamaki H, Wright CL, Li X, Lin Q, Hwang C, Wang S, Thimmapuram J, Kamagata Y, Liu WT. 2011. Analysis of 16S rRNA amplicon sequencing options on the Roche/454 next-generation titanium sequencing platform. PLoS One 6:e25263. 10.1371/journal.pone.0025263 [DOI] [PMC free article] [PubMed] [Google Scholar]
- 14.Li X, Rui J, Mao Y, Yannarell A, Mackie R. 2014. Dynamics of the bacterial community structure in the rhizosphere of a maize cultivar. Soil Biol. Biochem. 68:392–401. 10.1016/j.soilbio.2013.10.017 [DOI] [Google Scholar]
- 15.Caporaso JG, Kuczynski J, Stombaugh J, Bittinger K, Bushman FD, Costello EK, Fierer N, Pena AG, Goodrich JK, Gordon JI, Huttley GA, Kelley ST, Knights D, Koenig JE, Ley RE, Lozupone CA, McDonald D, Muegge BD, Pirrung M, Reeder J, Sevinsky JR, Turnbaugh PJ, Walters WA, Widmann J, Yatsunenko T, Zaneveld J, Knight R. 2010. QIIME allows analysis of high-throughput community sequencing data. Nat. Methods 7:335–336. 10.1038/nmeth.f.303 [DOI] [PMC free article] [PubMed] [Google Scholar]
- 16.Edgar RC, Haas BJ, Clemente JC, Quince C, Knight R. 2011. UCHIME improves sensitivity and speed of chimera detection. Bioinformatics 27:2194–2200. 10.1093/bioinformatics/btr381 [DOI] [PMC free article] [PubMed] [Google Scholar]
- 17.Hammer Ø, Harper DAT, Ryan PD. 2001. PAST: paleontological statistics software package for education and data analysis. Palaeontol. Electron. 4:9 [Google Scholar]
- 18.Rosenberg MS, Anderson CD. 2011. PASSaGE: pattern analysis, spatial statistics and geographic exegesis. Version 2. Methods Ecol. Evol. 2:229–232. 10.1111/j.2041-210X.2010.00081.x [DOI] [Google Scholar]
- 19.Lauber CL, Hamady M, Knight R, Fierer N. 2009. Pyrosequencing-based assessment of soil pH as a predictor of soil bacterial community structure at the continental scale. Appl. Environ. Microbiol. 75:5111–5120. 10.1128/AEM.00335-09 [DOI] [PMC free article] [PubMed] [Google Scholar]
- 20.Ferrenberg S, O'Neill SP, Knelman JE, Todd B, Duggan S, Bradley D, Robinson T, Schmidt SK, Townsend AR, Williams MW, Cleveland CC, Melbourne BA, Jiang L, Nemergut DR. 2013. Changes in assembly processes in soil bacterial communities following a wildfire disturbance. ISME J. 7:1102–1111. 10.1038/ismej.2013.11 [DOI] [PMC free article] [PubMed] [Google Scholar]
- 21.Sun YZ, Mao SY, Zhu WY. 2010. Rumen chemical and bacterial changes during stepwise adaptation to a high-concentrate diet in goats. Animal 4:210–217. 10.1017/S175173110999111X [DOI] [PubMed] [Google Scholar]
- 22.Belenguer A, Duncan SH, Holtrop G, Anderson SE, Lobley GE, Flint HJ. 2007. Impact of pH on lactate formation and utilization by human fecal microbial communities. Appl. Environ. Microbiol. 73:6526–6533. 10.1128/AEM.00508-07 [DOI] [PMC free article] [PubMed] [Google Scholar]
- 23.Hartman WH, Richardson CJ, Vilgalys R, Bruland GL. 2008. Environmental and anthropogenic controls over bacterial communities in wetland soils. Proc. Natl. Acad. Sci. U. S. A. 105:17842–17847. 10.1073/pnas.0808254105 [DOI] [PMC free article] [PubMed] [Google Scholar]
- 24.Wang X, Hu M, Xia Y, Wen X, Ding K. 2012. Pyrosequencing analysis of bacterial diversity in 14 wastewater treatment systems in China. Appl. Environ. Microbiol. 78:7042–7047. 10.1128/AEM.01617-12 [DOI] [PMC free article] [PubMed] [Google Scholar]
- 25.Chase JM, Myers JA. 2011. Disentangling the importance of ecological niches from stochastic processes across scales. Philos. Trans. R. Soc. Lond. B Biol. Sci. 366:2351–2363. 10.1098/rstb.2011.0063 [DOI] [PMC free article] [PubMed] [Google Scholar]
- 26.Shi S, Zhang WX, Deng Y, Zhang FD, Hu F. 2010. Construction of microbial fingerprint in Chinese liquor production by DGGE technique. China Brew. 3:118–120 (In Chinese.) 10.3969/j.issn.0254-5071.2010.01.042 [DOI] [Google Scholar]
- 27.Tang Y, Zhong F, Zhang W. 2011. Analysis of the diversity and system development of bacterial flora in luzhou-flavor Xijiu pit mud. Liquor-Mak. Sci. Technol. 12:24–28 (In Chinese.) [Google Scholar]
- 28.Rattanachaikunsopon P, Phumkhachorn P. 2010. Lactic acid bacteria: their antimicrobial compounds and their uses in food production. Ann. Biol. Res. 1:218–228 [Google Scholar]
- 29.Grabowski A, Tindall BJ, Bardin V, Blanchet D, Jeanthon C. 2005. Petrimonas sulfuriphila gen. nov., sp. nov., a mesophilic fermentative bacterium isolated from a biodegraded oil reservoir. Int. J. Syst. Evol. Microbiol. 55(Pt 3):1113–1121. 10.1099/ijs.0.63426-0 [DOI] [PubMed] [Google Scholar]
- 30.Breitenstein A, Wiegel J, Haertig C, Weiss N, Andreesen JR, Lechner U. 2002. Reclassification of Clostridium hydroxybenzoicum as Sedimentibacter hydroxybenzoicus gen. nov., comb. nov., and description of Sedimentibacter saalensis sp. nov. Int. J. Syst. Evol. Microbiol. 52(Pt 3):801–807. 10.1099/ijs.0.01998-0 [DOI] [PubMed] [Google Scholar]
- 31.Obst M, Krug A, Luftmann H, Steinbuchel A. 2005. Degradation of cyanophycin by Sedimentibacter hongkongensis strain KI and Citrobacter amalonaticus strain G isolated from an anaerobic bacterial consortium. Appl. Environ. Microbiol. 71:3642–3652. 10.1128/AEM.71.7.3642-3652.2005 [DOI] [PMC free article] [PubMed] [Google Scholar]
- 32.Zhang C, Liu X, Dong X. 2004. Syntrophomonas curvata sp. nov., an anaerobe that degrades fatty acids in co-culture with methanogens. Int. J. Syst. Evol. Microbiol. 54:969–973. 10.1099/ijs.0.02903-0 [DOI] [PubMed] [Google Scholar]
- 33.Shi S, Wang H, Wenxue Z, Deng Y, Lai D, Fan A. 2011. Analysis of microbial communities characteristics in different pit mud of Luzhou-flavor liquor. Liquor-Mak. Sci. Technol. 203:38–41 (In Chinese.) [Google Scholar]
- 34.Madigan MT, Martinko JM, Stahl DA, Clark DP. 2012. Brock biology of microorganisms, 13th ed. Pearson Education Inc, San Francisco, CA [Google Scholar]
- 35.Liu GY, Lu SH, Huang DY, Wu YY. 1995. Ethyl caproate synthesis by extracellular lipase of monascus fulginosus. Chin. J. Biotechnol. 3:288–290 (In Chinese.) [Google Scholar]
- 36.Cao XZ, Liu F, Li SX, Wu P, Li LL. 2012. Study on properties of esterifying enzyme from Rhizopus. Int. J. Food Nutr. Safety 1:137–143 [Google Scholar]
- 37.Steinbusch KJ, Arvaniti E, Hamelers HV, Buisman CJ. 2009. Selective inhibition of methanogenesis to enhance ethanol and n-butyrate production through acetate reduction in mixed culture fermentation. Bioresour. Technol. 100:3261–3267. 10.1016/j.biortech.2009.01.049 [DOI] [PubMed] [Google Scholar]
- 38.Ding HB, Tan GY, Wang JY. 2010. Caproate formation in mixed-culture fermentative hydrogen production. Bioresour. Technol. 101:9550–9559. 10.1016/j.biortech.2010.07.056 [DOI] [PubMed] [Google Scholar]
- 39.Barker HA, Kamen MD, Bornstein BT. 1945. The synthesis of butyric and caproic acids from ethanol and acetic acid by Clostridium kluyveri. Proc. Natl. Acad. Sci. U. S. A. 31:373–381. 10.1073/pnas.31.12.373 [DOI] [PMC free article] [PubMed] [Google Scholar]
- 40.Wallace RJ, McKain N, McEwan NR, Miyagawa E, Chaudhary LC, King TP, Walker ND, Apajalahti JH, Newbold CJ. 2003. Eubacterium pyruvativorans sp. nov., a novel non-saccharolytic anaerobe from the rumen that ferments pyruvate and amino acids, forms caproate and utilizes acetate and propionate. Int. J. Syst. Evol. Microbiol. 53:965–970. 10.1099/ijs.0.02110-0 [DOI] [PubMed] [Google Scholar]
- 41.Kenealy WR, Cao Y, Weimer PJ. 1995. Production of caproic acid by cocultures of ruminal cellulolytic bacteria and Clostridium kluyveri grown on cellulose and ethanol. Appl. Microbiol. Biotechnol. 44:507–513. 10.1007/BF00169952 [DOI] [PubMed] [Google Scholar]
- 42.Yao W, Chen M, Zhen D, Guo Y. 2010. Isolation of lactate-producing microbes from fermented grains of Luzhou-flavor liquor and their effect on simulative solid-state fermentation. Liquor Mak. 37:37–41 (In Chinese.) 10.3969/j.issn.1002-8110.2010.03.013 [DOI] [Google Scholar]
Associated Data
This section collects any data citations, data availability statements, or supplementary materials included in this article.