

ABSTRACT
Gene amplification is believed to play an important role in antibiotic resistance but has been rarely documented in clinical settings because of its unstable nature. We report a rise in MICs from 0.5 to 16 μg/ml in successive Acinetobacter baumannii isolated over 4 days from a patient being treated with tobramycin for an infection by multidrug-resistant A. baumannii, resulting in therapeutic failure. Isolates were characterized by whole-genome sequencing, real-time and reverse transcriptase PCR, and growth assays to determine the mechanism of tobramycin resistance and its fitness cost. Tobramycin resistance was associated with two amplification events of different chromosomal fragments containing the aphA1 aminoglycoside resistance gene part of transposon Tn6020. The first amplification event involved low amplification (6 to 10 copies) of a large DNA fragment that was unstable and conferred tobramycin MICs of ≤8 μg/ml. The second event involved moderate (10 to 30 copies) or high (40 to 110 copies) amplification of Tn6020. High copy numbers were associated with tobramycin MICs of 16 μg/ml, impaired fitness, and genetic instability, whereas lower copy numbers resulted in tobramycin MICs of ≤8 μg/ml and no fitness cost and were stably maintained in vitro. Exposure in vitro to tobramycin of the initial susceptible isolate and of the A. baumannii AB0057 reference strain led to similar aphA1 amplifications and elevated tobramycin MICs. To the best of our knowledge, this is the first report of in vivo development of antibiotic resistance secondary to gene amplifications resulting in therapy failure.
IMPORTANCE
A combination of whole-genome sequencing and mapping were used to detect an antibiotic resistance mechanism, gene amplification, which has been presumed for a long time to be of major importance but has rarely been reported in clinical settings because of its unstable nature. Two gene amplification events in a patient with an Acinetobacter baumannii infection treated with tobramycin were identified. One gene amplification event led to high levels of resistance and was rapidly reversible, while the second event led to low and more stable resistance since it incurred low fitness cost on the host. Gene amplification, with an associated rise in tobramycin MICs, could be readily reproduced in vitro from initially susceptible strains exposed to increasing concentrations of tobramycin, suggesting that gene amplification in A. baumannii may be a more common mechanism than currently believed. This report underscores the importance of rapid molecular techniques for surveillance of drug resistance.
INTRODUCTION
Acinetobacter baumannii has a remarkable ability to develop resistance to antibiotics by horizontal acquisition of foreign genetic information (1) or by mutation (2). These mechanisms have made A. baumannii a highly successful human nosocomial pathogen (3). In the clinical setting, point mutations in two-component regulatory systems can result in multiple antibiotic resistance in a single step by overexpression of efflux pumps (4) or resistance to colistin, the last resort antibiotic against this species (5).
Despite moderate side effects and increasing resistance, the aminoglycosides continue to be of therapeutic value. Several mechanisms of aminoglycoside resistance have been observed in Acinetobacter spp., the most frequent involving drug inactivation by N-acetylation, O-adenylylation, or O-phosphorylation (6).
Resistance genes in A. baumannii are generally part of integrons or resistance islands (AbaR) (7–9). The first island described, AbaR1, includes a large array of laterally transferred antimicrobial resistance genes intermixed with a diverse set of transposons and integrons (10). Since then, truncated derivatives of AbaR3, the ancestral resistance island, all integrated at the same site in the comM ATPase gene, have been reported. They are the result of 5′-ward deletions mediated by IS26 (11, 12).
Gene duplication and amplification (GDA) are believed to play an important role in antibiotic resistance (13). However, because of its unstable nature, its relevance in the clinical setting is difficult to assess. Nevertheless, duplication of a 36.4-kb region encompassing blaSHV-11 in a clinical isolate of Klebsiella pneumoniae linked to a 16-fold increase in amoxicillin resistance has been reported (14). Similarly, resistance to sulfonamide and trimethoprim was associated in a clinical isolate of Streptococcus agalactiae with the unstable amplification of a 13.5-kb region carrying five genes involved in dihydrofolate synthesis (15). Duplication of the plasmid-borne blaOXA-58 gene has been shown to be responsible for reduced susceptibility to carbapenems in A. baumannii (16) and Acinetobacter genospecies 3 (17).
We report the in vivo occurrence of tobramycin resistance in A. baumannii from a patient undergoing tobramycin therapy via gene amplification. Tobramycin resistance emerged by two distinct amplification events. The first event involved low amplification of an approximately 15-kb region containing the aminoglycoside resistance gene aphA1, which is part of transposon Tn6020. The second event was moderate- or high-level amplification of Tn6020. In both cases, tobramycin MICs increased with gene copy number up to a plateau at 16 μg/ml. Very high gene copy numbers (>40) resulted in reduced fitness of the host and were transient in the absence of selection, as opposed to low copy numbers which could be maintained in vitro for at least 1 month.
RESULTS
Six A. baumannii strains were isolated from the same patient over 10 days and were tested for susceptibility to three clinically important aminoglycosides (Table 1). All were resistant to gentamicin and susceptible to amikacin. Initial isolates (MRSN 3361, MRSN 3363, MRSN 3364, and MRSN 56) were susceptible to tobramycin, but MRSN 57 and MRSN 58 were categorized as intermediate (MIC = 8 μg/ml) and resistant (MIC = 16 μg/ml), respectively. Multilocus sequence typing (MLST) assigned them to sequence type 1 (ST1) (Pasteur scheme) of clonal complex CCI, one of three major A. baumannii clonal groups strongly associated with multidrug resistance and hospital outbreaks in many countries (18).
TABLE 1 .
Phenotypic characteristics of strains
| MRSNa | Isolation |
Tobramycin MIC (μg/ml)c | |
|---|---|---|---|
| Dayb | Site | ||
| 3361 | 3 | Left hip | 0.5 |
| 3363 | 3 | Right hip | 0.5 |
| 3364 | 8 | Left hip | 0.5 |
| 56 | 11 | Left hip | 0.5 |
| 57 | 12 | Right hip | 8 |
| 58 | 13 | Left hip | 16 |
De-identified number used to track isolates throughout the Multidrug-resistant Organism Repository and Surveillance Network (MRSN).
Day after initial injury.
MICs were determined in quintuplicate. A. baumannii CLSI breakpoints (μg/ml) for tobramycin are as follows: susceptible, ≤4; intermediate, 8; resistant, ≥16.
Detection of gene amplification by whole-genome mapping.
Whole-genome mapping showed that all isolates were closely related but that MRSN 57 and MRSN 58 had diverged from the main cluster (Fig. 1). This difference was attributable to a localized and unique restriction pattern that was not present in the other four strains. In MRSN 57, this pattern consisted of six identical and tandem restriction fragments approximately 15 kb in size and in MRSN 58 of a single approximately 270-kb region with no NcoI restriction sites. When these fragments were artificially removed, both isolates shared >99% identity with the remaining strains.
FIG 1 .

Dendrogram (a) and optical genome map (b) of clinical isolates of A. baumannii and reference strains. Strain relatedness was calculated using the unweighted-pair group method using average linkages (UPGMA) (5). Optical maps were compared with in silico optical maps of A. baumannii reference strains AB0057, AYE, and ACICU generated from GenBank sequences. Blue areas represent regions of alignment compared to isolate MRSN 3361, and white areas represent unaligned regions. Vertical black bars indicate NcoI restriction sites. The areas corresponding to the amplified regions are enclosed in red rectangles.
Whole-genome sequencing of clinical isolates.
Comparative analysis of the genomes of MRSN 56, MRSN 57, and MRSN 58 clinical isolates and reference strain AB0057 identified AbaR28 (Fig. 2a), a novel deletion derivative of AbaR3 (11, 19), in the three clinical isolates. AbaR28 consisted of 20 open reading frames (ORFs) identical to the 3′ end of AbaR3 in A. baumannii AB0057 (19). A truncated comM, a gene encoding an ATPase which is a hot spot for insertion of resistance islands in A. baumannii (9, 11), was present at the 3′ end of the island alongside the characteristic 5-bp duplication (AACGC) generated upon AbaR3 insertion (20). However, unlike other derivatives of AbaR3 (11), AbaR28 was missing the 5′ remnant of comM, most likely following a 5′-ward IS26-mediated deletion that extended 37 bp downstream from dapA, a chromosomal gene for a dihydrodipicolinate synthase (Fig. 2a).
FIG 2 .

Schematic representation of AbaR28 and amplified units (a) and the genetic environment of Tn6020 (top) and the amplified unit (bottom) in A. baumannii isolate MRSN 58 (b). (a) Resistance island AbaR28 is indicated by a thick black line at the top of the panel. Amplified units are indicated by thin black lines. The sizes of the resistance island or amplified units are in kilobases. The open arrows represent coding sequences (yellow arrows, IS26; red arrows, aminoglycoside resistance genes; blue arrows, genes associated with DNA mobility) and indicate the direction of transcription. The notched arrows represent the truncated comM and sup genes. The chromosomal genes flanking AbaR28 are indicated in black. AbaR28 is a truncated version of AbaR3 generated by a 5′-ward deletion mediated by the IS26 copy located at the left end of Tn6020 which is now the extremity of the island. This element is known to create deletions in adjacent regions (20, 37). The deletion removed the 5′ end of Tn6019 and the 5′ portion of the comM target gene. The right end of AbaR28 corresponds to the 26-bp terminal right inverted repeat (IRR) of Tn6019, known to be associated with AbaRs (arrow) (11), and flanked by a 5-bp (ACCGC) duplication of target DNA (5 bp), the characteristic footprint of AbaR3 insertions (20). (b) The vertical black arrow indicates the insertion site of Tn6020 in isolate MRSN 58. The duplicated target sequence is in blue lettering and the sequence carried over 8 bp is in red. Tn6020 is indicated by a double-head arrow, and its size is shown in kilobases. Gene nomenclature was assigned based on the closest BLAST match from GenBank (http://blast.ncbi.nlm.nih.gov/Blast.cgi, last accessed February 2014) using reference strain AB0057.
Analysis of average genome read coverage identified one area in isolate MRSN 57 and one in MRSN 58 with significantly higher coverage than in MRSN 56. In MRSN 57, this area consisted of a 15.21-kb region, encompassing 19 of the 20 ORFs of AbaR28 (Fig. 2a), that had a mean depth coverage approximately 6 times higher than that of the corresponding region in MRSN 56 and MRSN 58 (see Fig. S1 in the supplemental material). IS26 formed the 5′ end, and the amplified unit terminated 332 bp into the sulfate permease gene (Fig. 2a). In isolate MRSN 58, amplification occurred in a smaller 3.9-kb region, comprising Tn6020 of AbaR28, with mean depth coverage approximately 65 times higher than that of MRSN 56 and MRSN 57 (Fig. S1). Tn6020 is composed of aphA1 flanked by two directly repeated copies of IS26 (Fig. 2b). In isolate MRSN 58, a single copy of the transposon was found at the original position, but approximately 65 tandem copies of Tn6020 were identified 281 kb downstream, inserted in a gene for a hypothetical protein (Fig. 2b). The presence of the characteristic 8-bp direct repeat of target DNA confirmed that IS26 mediated transposition at this new locus. Surprisingly, rather than direct tandem copies of Tn6020, each copy of the transposon was connected to the next by 8 bp identical to those upstream from Tn6020 at the original location (Fig. 2b). This short sequence (GAATGTTT) was not part of the unit amplified in MRSN 57. The genomes of MRSN 56, MRSN 57, and MRSN 58 were identical outside the amplified regions.
Confirmation of gene amplification and expression by qPCR.
When normalized to the single-copy genes secE and rpiN (21) by quantitative PCR (qPCR), isolate MRSN 57 had an average of 10 (±2) copies of aphA1, aacC1, and uspA (encoding a universal stress protein at the 3′ end of the amplified unit) and MRSN 58 had an average of 75 (±14) copies of aphA1 but a single copy of aacC1 and uspA (see Fig. S3 in the supplemental material). Whole-genome mapping and qPCR demonstrated that aphA1 copy numbers in 3 colonies of MRSN 58 from the same overnight culture were 60, 69, and 71, corresponding to approximate sizes of 259 kb, 278 kb, and 286 kb, respectively (Fig. S2).
Stability of gene amplification.
When the bacteria were grown on antibiotic-free solid medium over 30 days, aphA1, aacC1, and uspA copy number (Fig. 3) and expression (see Fig. S3A in the supplemental material) displayed a gradual decrease from 10 copies in isolate MRSN 57. By day 17, a single copy of the genes was present and thereafter oscillated between 1 and 2, indicating that the 15.2-kb sequence was amplified or lost en bloc. When cultured with tobramycin (4 μg/ml), the number of amplification units and gene expression increased rapidly during the first 2 days from approximately 9 to 60, followed by a gradual decrease through day 6 to approximately 15 copies before rising to 30 copies by day 15 and stayed above 20 for the remainder of the exposure (Fig. 3 and Fig. S3A).
FIG 3 .
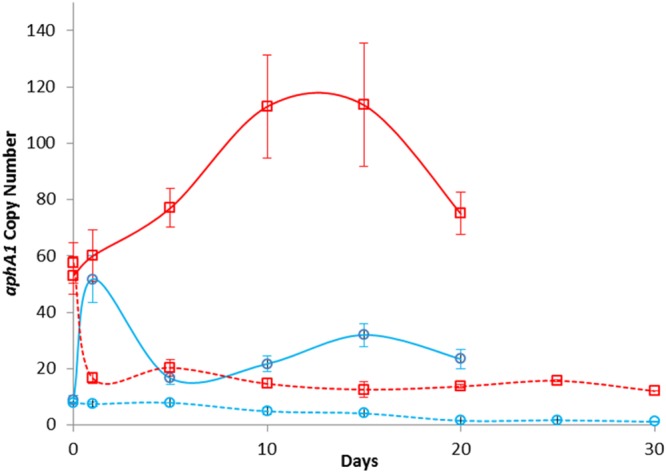
Relative gene copy numbers. Number of copies of aphA1 in isolates MRSN 57 (blue line) and MRSN 58 (red line) as determined by qPCR during growth with (solid line) and without (dashed line) tobramycin (4 μg/ml). Data are the averages from three independent experiments; error bars represent 1 standard deviation.
The aphA1 copy number in strain MRSN 58 declined rapidly from 57 to 17 after the first overnight subculture on antibiotic-free medium and remained moderate with a daily average of 16 (±4) copies over the ensuing 28 days (Fig. 3). When grown in the presence of tobramycin (4 μg/ml), copy number (Fig. 3) and expression (see Fig. S3B in the supplemental material) increased rapidly, reaching 120 (±19) copies on day 10, before gradually declining to 78 (±9) copies by day 20. In all instances, mRNA synthesis was proportional to gene copy number.
Gene amplification can be induced in vitro.
Tobramycin-susceptible A. baumannii MRSN 56 and AB0057 were subcultured daily in the presence of increasing concentrations of tobramycin. Isolate MRSN 56 displayed robust growth on 8 μg/ml tobramycin on days 8 and 9 but failed to grow on 16 μg/ml. This evolving phenotype correlated with a change in aphA1, aacC1, and uspA copy number (Fig. 4) and expression (data not shown), which increased moderately from 1 to 10 copies when grown on 4 μg/ml to approximately 70 copies on 8 μg/ml of tobramycin. However, unlike MRSN 57, the fragment downstream from comM was also amplified. Whole-genome sequencing of tobramycin-resistant MRSN 56 on day 8, named MRSN 56T, showed a 19.9-kb region with 30-fold-higher coverage than the remainder of the genome. This DNA portion had the same 5′ end as that in MRSN 57 but extended 4 kb further in the 3′ direction encompassing all of AbaR28, truncated comM, a gene for a conserved hypothetical protein, and terminated 55 bp upstream from glnB encoding the nitrogen regulatory protein P-II (Fig. 2A).
FIG 4 .
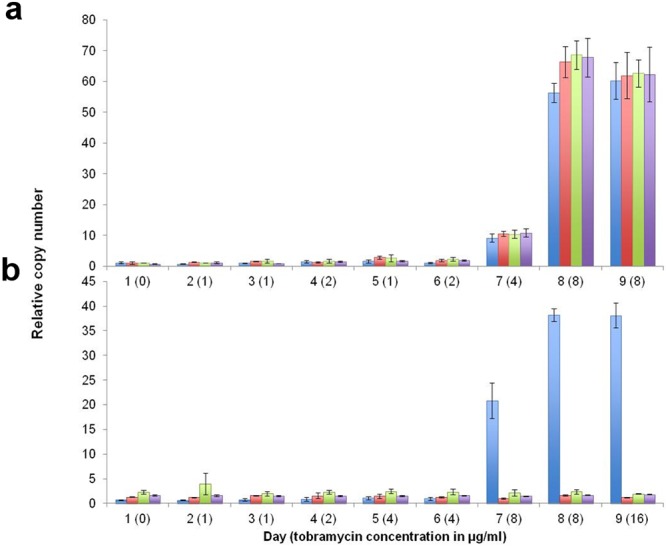
In vitro
induction of gene amplification. (a and b) Number of copies of aphA1 (blue), aacC1 (red), uspA (green), and comM (purple) genes as determined by qPCR in isolate MRSN 56 (a) and strain AB0057 (b) following growth on increasing concentrations of tobramycin. Data are the averages of three independent experiments; error bars represent 1 standard deviation. No growth was observed for MRSN 56 on 16 μg/ml of tobramycin.
Strain AB0057, which carries AbaR3 including Tn6020, eventually grew on 8 μg/ml after 7 days and moderately on day 9 on 16 μg/ml. Similarly to MRSN 58, increased resistance correlated with changes in aphA1 copy number only, from 1 copy on day 6 to >70 copies on day 9 (Fig. 4). Whole-genome sequencing of the tobramycin-resistant AB0057 derivative on day 9, termed AB0057T, identified a 6.4-kb region with 50-fold-higher coverage than the rest of the genome, ca. twice the size of the unit in MRSN 58. This fragment encompassed Tn6020 but extended 3 kb beyond the 5′ IS26, terminating in the tnpA gene (see Fig. S4 in the supplemental material). This gene is present in AbaR3 but has been deleted in AbaR28. Amplification occurred in situ, but we did not detect repeat sequences at the joint points.
High-level aphA1 amplification results in reduced fitness.
Whether an increase in gene copy number affects fitness can be evaluated by growth rate (GR) determination (22, 23). Initial data indicated that there were no significant differences between the growth rate of tobramycin-susceptible strain MRSN 56 and those of MRSN 57 and MRSN 58 when measured in the absence of antibiotic (the GR of MRSN 57 and MRSN 58 relative to that of MRSN 56 was 1.00 ± 0.02). However, individual colonies from the initial culture of MRSN 58 displayed variable aphA1 amplification: among 18 colonies studied, 12 had an aphA1 copy number between 8 and 13, and five had a copy number between 39 and 72. The GRs of the eighteen colonies were determined, and the same suspension of each colony was used to (i) determine the tobramycin MIC, (ii) prepare DNA to quantify aphA1 copy number by qPCR, and (iii) purify RNA for quantification of aphA1 expression by quantitative reverse transcriptase PCR (qRT-PCR). The level of mRNA production was proportional to gene copy number (see Fig. S3 in the supplemental material).
The group of 12 colonies with low aphA1 copy numbers (from 8 to 13) had tobramycin MICs of 4 to 8 μg/ml and a relative GR of ≥0.95. The five colonies with high aphA1 copy numbers (39 to 72) had tobramycin MICs of 16 μg/ml and a significantly diminished relative GR of ≤0.92 (P < 0.001). Interestingly, a colony with an intermediate aphA1 copy number (n = 34) presented with an intermediate loss of fitness (relative GR of 0.95) and a tobramycin MIC of 16 μg/ml (Fig. 5).
FIG 5 .
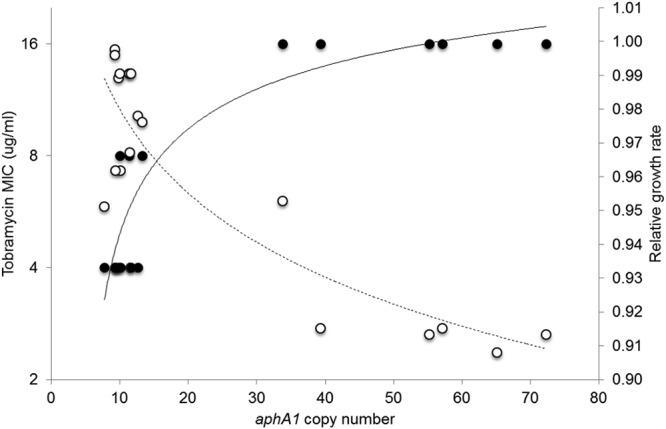
Biological cost and resistance associated with gene amplification. Tobramycin MICs (filled circles) and relative growth rates (open circles) of individual colonies of isolate MRSN 58 containing various copy numbers of the aphA1 gene. Eighteen individual colonies were grown at 37°C up to an OD600 of 0.9 in BHI broth, and the growth rates and tobramycin MICs by microdilution were determined. The same bacterial suspension was used to purify DNA for aphA1 gene copy number determination by qPCR. Experiments were performed at least three times independently. The logarithmic tendency curves have R2 values of 0.9 (solid line) and 0.8 (dashed line).
Altogether, there was a significant decrease in the growth rate of cells with high copy numbers of aphA1, whereas there was no detectable burden for the cells with an average of 10 copies of the gene, which was the predominant group in strain MRSN 58. The latter genotype was stable over a period of 30 days even in the absence of selection and incurred little or no fitness cost.
DISCUSSION
Collection of serial A. baumannii isolates from the same patient provided the opportunity to investigate antibiotic resistance by two independent but related events involving amplification of the aminoglycoside phosphotransferase gene aphA1. The first event was moderate amplification of a 15.2-kb region, including transposon Tn6020, composed of aphA1 flanked by two directly repeated copies of IS26, and the second event was replicative transposition and subsequent amplification of Tn6020 (Fig. 2). Tobramycin MICs (Table 1) and gene transcription (see Fig. S3 in the supplemental material) were crudely related to the aphA1 gene copy number but reached a plateau at 16 μg/ml above 30 copies of the gene, and high gene copy number incurred a fitness cost on the host bacterium (Fig. 5).
All clinical isolates contained antibiotic resistance island AbaR28 (Fig. 2), and the gene amplification events in these strains involved portions of AbaR28.
In isolate MRSN 57, a 15.2-kb region containing 19 of the 20 ORFs in AbaR28 (Fig. 2) was amplified in situ from 2 to 61 times (Fig. 3). The 5′ end was formed by IS26, and part of the supA gene for a sulfate permease constituted the 3′ end of the amplified fragment. A similar event was observed in MRSN 56T, following in vitro amplification by passage of the initial susceptible isolate MRSN 56 on medium with increasing concentrations of tobramycin. The two events could be accounted for by IS26-mediated amplification via formation of deletion circles and reinsertion (24).
In strain MRSN 58, a smaller 3.2-kb unit composed of Tn6020 underwent replicative transposition at another site in the chromosome followed by amplification at the new locus through nonequal homologous recombination between directly repeated copies of IS26 (25). We previously reported tandem amplification of aphA1 by similar homologous recombination between two flanking IS15 direct copies in Tn1525 from Salmonella enterica serovar Panama when challenged by kanamycin (26).
In strain AB0057, which carries AbaR3, a larger 6.4-kb region was amplified in situ after growth in the presence of tobramycin (see Fig. S4 in the supplemental material) by a mechanism likely similar to that in MRSN 57 and MRSN 56T.
Measurement of the fitness cost associated with gene amplification has shown that the growth rate of the host might be indistinguishable from that of the single-copy counterpart or it may be greatly reduced under nonselective conditions depending on the size and location of the amplification (13). In agreement with these observations, we found no biological cost associated with amplification when the growth rate was measured by the usual method (22). However, when individual colonies from the same plate were examined, we observed a diminished growth rate and higher tobramycin MIC (16 μg/ml) for the rare colonies that harbored high copy numbers (>35) of the aphA1 gene. Hence, greater amplification results in higher levels of resistance to tobramycin but exerts a toll on the host that results in a significant fitness cost.
The mechanism by which Aph(3′)-I confers tobramycin resistance is of interest, as tobramycin lacks the 3′ hydroxyl group which is the target of this phosphotransferase (27). Tobramycin resistance in Escherichia coli by overproduction of Aph(3′)-I has been reported (28). In that study, high-level expression of aphA1 was due to the presence of a strong promoter upstream of the structural gene for the enzyme, and resistance resulted from the formation of a complex between the protein and tobramycin in a stoichiometric manner (28). Thus, trapping of tobramycin by the enzyme could account for the reproducible correlation between increasing tobramycin MICs and higher aphA1 copy number (Fig. 5). As in E. coli, the resistance achieved, although of clinical relevance, was of intermediate level and reached a plateau at 16 μg/ml (Fig. 5). The saturable intracellular sequestration of the drug suggests that the binding between tobramycin and Aph(3′)-I is not very tight. Our observations are compatible with the notion that a tobramycin concentration of 4 μg/ml represents a crude threshold: at higher concentrations, the aphA1 copy number appeared to coalesce between ca. 30 and 55 in isolate MRSN 57 and between 60 to 120 copies in MRSN 58. At lower drug concentrations, the copy number was maintained at approximately 8 and 15 copies in MRSN 57 and MRSN 58, respectively (Fig. 3).
Detection of gene amplification is difficult due to its transient nature, and thus, its role in antibiotic resistance is thought to be considerably underestimated (13). Typically, amplification is rapidly lost from the bacterial population in the absence of selective pressure (29) primarily by homologous recombination between repeated sequences mediated through recA (30, 31). The decrease in copy number was evident in both isolates MRSN 57 and MRSN 58, eventually leading to a single copy in MRSN 57 (Fig. 3). Consistent with this mechanism, analysis of recA in the clinical isolates did not reveal any mutation in the gene or in its upstream regulatory elements. In MRSN 58, the Tn6020 copy number decreased rapidly from 60 to 17 after a single passage on antibiotic-free medium, but amplification was maintained at an average of 16 (±4) copies over the ensuing 28 days (Fig. 3). As both the size and location play a role in determining the stability and fitness cost of amplification (29), we speculate that these factors may explain the contrasting evolution of aphA1 copy numbers in MRSN 57 and MRSN 58. The growth rate of clones of MRSN 58 carrying less than 30 copies of the transposon was indistinguishable from that of the progenitor, susceptible MRSN 56, confirming that the fitness cost of the additional genes was minimal.
We provide the first description of in vivo gene amplifications that resulted in the development of antibiotic resistance with subsequent treatment failure. Resistance emerged through two IS26-mediated events involving the amplification of a large or small chromosomal region, both containing the aphA1 resistance gene. As a result of gene dosage effect, production of the aminoglycoside phosphotransferase increased over 50-fold, resulting in the intracellular sequestration of the drug, as demonstrated subsequently for a truncated aminoglycoside acetyltransferase (32). Detection and analysis of gene amplification in clinical isolates were achievable only through a combination of active surveillance with translational research, a strategy that has been alluded to for the detection of these transient events (13). Finally, our data demonstrate that GDA are very dynamic processes that could be readily reproduced in vitro and may play a heretofore underappreciated role in clinical antibiotic resistance.
MATERIALS AND METHODS
Case report.
All isolates (Table 1) were cultured from a 20-year-old male polytrauma victim sustained in combat operations in Afghanistan (day 1). Cultures obtained from day 3 grew A. baumannii (isolates MRSN 3361 and MRSN 3363) susceptible to tobramycin (MIC = 0.5 µg/ml). Tobramycin-susceptible MRSN 3364 was cultured on day 8 from a tissue sample collected from the left hip injury. Upon stabilization of the patient, he was transferred to the United States for definitive care, arriving on day 9, where antibiotics were changed to intravenous tobramycin, meropenem, and vancomycin based on culture results. A. baumannii MRSN 56 was cultured from the left hip wound on day 11 and was susceptible to tobramycin (MIC = 0.5 µg/ml). Throughout this escalation of care, tobramycin was continuously administered. On day 12, MRSN 57 was cultured from a tissue sample collected from the right hip but had an MIC of tobramycin of 8 µg/ml. The following day, MRSN 58 was cultured from a tissue sample collected from the left hip. MRSN 58 had a tobramycin MIC of = 16 µg/ml, which denotes resistance by CLSI guidelines (33). Consequently, tobramycin therapy was discontinued, and the patient was prescribed colistin while continuing meropenem.
Whole-genome mapping.
Whole-genome mapping (WGM) with NcoI using the Argus system (OpGen Inc., MD, USA) was performed as described previously (5).
Determination of gene copy number by real-time PCR (qPCR).
DNA was collected using a modified rapid extraction method (34). Briefly, a 10-µl loopful of bacterial cells was suspended in 300 µl of sterile water, and 20 µl was added to 40 µl of lysis buffer (1% Triton X-100, 0.5% Tween 20, 10 mM Tris-HCl [pH 8.0], and 1 mM EDTA). The resulting solution was heated to 95°C for 12 min, and 2 µl was used for qPCR.
Primers (see Table S1 in the supplemental material) targeting seven loci within or flanking the amplified unit in A. baumannii MRSN 57 were designed using Primer Express 2.0 (Life Technologies, NY) and tested for sensitivity and specificity using MIQE (minimum information for publication of quantitative real-time PCR experiments) guidelines (35). Standard curves were generated using serial dilutions of DNA from 107 to 101 genome copies of A. baumannii AB0057 as described previously (21). The gene copy number was normalized to the single-copy genes secE and rpiN to calculate relative copy number per genome (21). Experiments were performed from a minimum of three biological replicates with two technical replicates per run.
RNA extraction and qRT-PCR.
Total RNA extraction and subsequent quantitative reverse transcriptase PCR (qRT-PCR) were performed as described previously (5).
Whole-genome sequencing.
Whole-genome sequencing was performed on isolates MRSN 56, MRSN 57, and MRSN 58 using a MiSeq benchtop sequencer (Illumina Inc., CA). Libraries were generated from 550-bp fragments of high-quality DNA using the TruSeq DNA PCR-free LT sample preparation kit (Illumina Inc.). Paired-end sequencing (250 bp) was performed using the MiSeq reagent kit v2 (500-cycle) kit. Newbler version 2.7 (454 Life Sciences, CT) was used to assemble MiSeq sequencing reads into de novo contigs and sequencing reads against reference DNA sequences. A. baumannii AB0057 and AYE were used for comparative genomic analyses. Reference and de novo contigs were combined using Geneious (Biomatters, Auckland, New Zealand) to construct a scaffold genome assembly and verified using a whole-genome map (36).
Stability of gene copy number.
A single colony of isolates MRSN 57 and MRSN 58 was plated in triplicate onto Mueller-Hinton (MH) agar with and without tobramycin (4 µg/ml). After growth overnight at 37°C, half of the cells of two individual colonies was inoculated separately onto fresh MH agar plates and the other half was used to isolate DNA for qPCR as described above. This process was repeated daily for 20 and 30 days in the presence or absence of tobramycin, respectively. MRSN 56, the progenitor susceptible strain, was cultured in parallel on antibiotic-free medium, and 15 colonies were recovered on days 0, 6, 12, and 20 for mRNA extraction and gene expression studies.
In vitro induction of gene amplification.
A. baumannii MRSN 56 and AB0057 were cultured on MH agar supplemented with tobramycin (1 µg/ml) in triplicate. Strain AB0057 was selected, as it is of the same sequence type (ST1) as the clinical isolates and carries the AbaR3 resistance island with an intact copy of Tn6020 (19). Single colonies were transferred daily onto plates with increasing concentrations of tobramycin from 1 to 16 µg/ml. Bacteria were harvested for RNA and DNA extraction daily.
Growth rates.
Growth rates were determined in microplates coupled to a Multiskan spectrophotometer (Thermo Fisher Scientific, MA). Strains were grown overnight at 37°C, the cultures were diluted in 5 ml of LB to an optical density at 600 nm (OD600) of 0.15 and grown at 37°C with shaking. At the beginning of the stationary phase, i.e., at an OD600 of 0.9, the cultures were diluted 105-fold to inoculate approximately 1 × 10⁴ bacteria into 200 µl of LB in a 96-well microplate that was incubated at 37°C with shaking. Absorbance was measured at 600 nm every 3 min. Each culture was replicated three times in the same microplate. Growth rates, performed in two independent experiments, were determined at the beginning of the exponential phase, and relative growth rates were calculated as the ratio of the growth rate of the strains versus that of susceptible MRSN 56.
SUPPLEMENTAL MATERIAL
Average read coverage of aphA1, aacC1, and sul1 in clinical isolates MRSN 56, MRSN 57, and MRSN 58 as determined by whole-genome sequence using the Illumina MiSeq. Read coverage was calculated from raw reads using Geneious (Biomatters, Auckland, New Zealand) software. Download
Optical genome maps generated from three colonies of isolate MRSN 58 from the same overnight culture plate. The region corresponding to the amplification of Tn6020 is enclosed in red rectangles. The relative aphA1 copy number, as determined by qPCR, is indicated on the right. Download
Comparison of relative gene copy number (blue) and mRNA transcript levels (red) of usp in isolate MRSN 57 (A) and aphA1 in isolate MRSN 58 (B). Cells were harvested on days 0, 6, 12, and 20 from cultures grown on MH agar with tobramycin at a final concentration of 4 µg/ml (see Materials and Methods for details). Half of the collected cells were used for DNA extraction and qPCR, and the remaining half were used for RNA extraction for qRT-PCR. Data are the averages of three independent experiments. Error bars represent 1 standard deviation. Download
Schematic representation of the amplified unit in AB0057T. The AbaR3 resistance island is indicated by a thick black line, the amplified unit is indicated by a thin black line, and their sizes are shown in kilobases. The open arrows represent coding sequences (yellow arrows, IS26; red arrows, aminoglycoside resistance genes; blue arrows, genes associated with DNA mobility). The 5′ and 3′ portions of the truncated comM gene flanking AbaR3 are represented by black broken open arrows. The portions of AbaR3 not shown are indicated by the dotted lines. Gene nomenclature was assigned based on the closest BLAST match from GenBank (http://blast.ncbi.nlm.nih.gov/Blast.cgi, last accessed January 2014) using reference strain AB0057. Download
Primers used in this study
ACKNOWLEDGMENTS
This study was funded by the U.S. Army Medical Command, the Global Emerging Infections Surveillance and Response System, and the Defense Medical Research and Development Program. This work was supported in part by the European Union FP7-PAR grant, which included a fellowship in support of E-J. Yoon.
We thank all laboratory personnel without whose help we could not have done this study. We thank Jun Hang and the Viral Disease group, WRAIR, for assistance in initial genome sequencing and Matthew Riley for initial assistance with whole-genome mapping. We thank M. Chandler for helpful discussions.
This material has been reviewed by the Walter Reed Army Institute of Research. There is no objection to its presentation. The opinions or assertions contained herein are the private views of the authors and are not to be construed as official or reflecting the views of the Department of the Army or the Department of Defense.
Footnotes
Citation McGann P, Courvalin P, Snesrud E, Clifford RJ, Yoon E-J, Onmus-Leone F, Ong AC, Kwak YI, Grillot-Courvalin C, Lesho E, Waterman PE. 2014. Amplification of aminoglycoside resistance gene aphA1 in Acinetobacter baumannii results in tobramycin therapy failure. mBio 5(2):e00915-14. doi:10.1128/mBio.00915-14.
REFERENCES
- 1. Goldstein FW, Labigne-Roussel A, Gerbaud G, Carlier C, Collatz E, Courvalin P. 1983. Transferable plasmid-mediated antibiotic resistance in Acinetobacter. Plasmid 10:138–147. 10.1016/0147-619X(83)90066-5 [DOI] [PubMed] [Google Scholar]
- 2. Marchand I, Damier-Piolle L, Courvalin P, Lambert T. 2004. Expression of the RND-type efflux pump AdeABC in Acinetobacter baumannii is regulated by the AdeRS two-component system. Antimicrob. Agents Chemother. 48:3298–3304. 10.1128/AAC.48.9.3298-3304.2004 [DOI] [PMC free article] [PubMed] [Google Scholar]
- 3. Perez F, Endimiani A, Bonomo RA. 2008. Why are we afraid of Acinetobacter baumannii? Expert Rev. Anti Infect. Ther. 6:269–271. 10.1586/14787210.6.3.269 [DOI] [PMC free article] [PubMed] [Google Scholar]
- 4. Yoon EJ, Courvalin P, Grillot-Courvalin C. 2013. RND-type efflux pumps in multidrug-resistant clinical isolates of Acinetobacter baumannii: major role for AdeABC overexpression and AdeRS mutations. Antimicrob. Agents Chemother. 57:2989–2995. 10.1128/AAC.02556-12 [DOI] [PMC free article] [PubMed] [Google Scholar]
- 5. Lesho E, Yoon EJ, McGann P, Snesrud E, Kwak Y, Milillo M, Onmus-Leone F, Preston L, St. Clair K, Nikolich M, Viscount H, Wortmann G, Zapor M, Grillot-Courvalin C, Courvalin P, Clifford R, Waterman PE. 2013. Emergence of colistin-resistance in extremely drug-resistant Acinetobacter baumannii containing a novel pmrCAB operon during colistin therapy of wound infections. J. Infect. Dis. 208:1142–1151. 10.1093/infdis/jit293 [DOI] [PubMed] [Google Scholar]
- 6. Ramirez MS, Tolmasky ME. 2010. Aminoglycoside modifying enzymes. Drug Resist. Updat. 13:151–171 [DOI] [PMC free article] [PubMed] [Google Scholar]
- 7. Bonomo RA, Szabo D. 2006. Mechanisms of multidrug resistance in Acinetobacter species and Pseudomonas aeruginosa. Clin. Infect. Dis. 43(Suppl 2):S49–S56. 10.1086/504804 [DOI] [PubMed] [Google Scholar]
- 8. Nemec A, Dolzani L, Brisse S, van den Broek P, Dijkshoorn L. 2004. Diversity of aminoglycoside-resistance genes and their association with class 1 integrons among strains of pan-European Acinetobacter baumannii clones. J. Med. Microbiol. 53:1233–1240. 10.1099/jmm.0.45716-0 [DOI] [PubMed] [Google Scholar]
- 9. Post V, Hall RM. 2009. AbaR5, a large multiple-antibiotic resistance region found in Acinetobacter baumannii. Antimicrob. Agents Chemother. 53:2667–2671. 10.1128/AAC.01407-08 [DOI] [PMC free article] [PubMed] [Google Scholar]
- 10. Fournier PE, Vallenet D, Barbe V, Audic S, Ogata H, Poirel L, Richet H, Robert C, Mangenot S, Abergel C, Nordmann P, Weissenbach J, Raoult D, Claverie JM. 2006. Comparative genomics of multidrug resistance in Acinetobacter baumannii. PLoS Genet. 2:e7. 10.1371/journal.pgen.0020007 [DOI] [PMC free article] [PubMed] [Google Scholar]
- 11. Krizova L, Dijkshoorn L, Nemec A. 2011. Diversity and evolution of AbaR genomic resistance islands in Acinetobacter baumannii strains of European clone I. Antimicrob. Agents Chemother. 55:3201–3206. 10.1128/AAC.00221-11 [DOI] [PMC free article] [PubMed] [Google Scholar]
- 12. Post V, White PA, Hall RM. 2010. Evolution of AbaR-type genomic resistance islands in multiply antibiotic-resistant Acinetobacter baumannii. J. Antimicrob. Chemother. 65:1162–1170. 10.1093/jac/dkq095 [DOI] [PubMed] [Google Scholar]
- 13. Sandegren L, Andersson DI. 2009. Bacterial gene amplification: implications for the evolution of antibiotic resistance. Nat. Rev. Microbiol. 7:578–588. 10.1038/nrmicro2174 [DOI] [PubMed] [Google Scholar]
- 14. Duvernay C, Coulange L, Dutilh B, Dubois V, Quentin C, Arpin C. 2011. Duplication of the chromosomal blaSHV-11 gene in a clinical hypermutable strain of Klebsiella pneumoniae. Microbiology 157:496–503. 10.1099/mic.0.043885-0 [DOI] [PubMed] [Google Scholar]
- 15. Brochet M, Couvé E, Zouine M, Poyart C, Glaser P. 2008. A naturally occurring gene amplification leading to sulfonamide and trimethoprim resistance in Streptococcus agalactiae. J. Bacteriol. 190:672–680. 10.1128/JB.01357-07 [DOI] [PMC free article] [PubMed] [Google Scholar]
- 16. Bertini A, Poirel L, Bernabeu S, Fortini D, Villa L, Nordmann P, Carattoli A. 2007. Multicopy blaOXA-58 gene as a source of high-level resistance to carbapenems in Acinetobacter baumannii. Antimicrob. Agents Chemother. 51:2324–2328. 10.1128/AAC.01502-06 [DOI] [PMC free article] [PubMed] [Google Scholar]
- 17. Evans BA, Hamouda A, Towner KJ, Amyes SG. 2010. Novel genetic context of multiple blaOXA-58 genes in Acinetobacter genospecies 3. J. Antimicrob. Chemother. 65:1586–1588. 10.1093/jac/dkq180 [DOI] [PubMed] [Google Scholar]
- 18. Diancourt L, Passet V, Nemec A, Dijkshoorn L, Brisse S. 2010. The population structure of Acinetobacter baumannii: expanding multiresistant clones from an ancestral susceptible genetic pool. PLoS One 5:e10034. 10.1371/journal.pone.0010034 [DOI] [PMC free article] [PubMed] [Google Scholar]
- 19. Adams MD, Goglin K, Molyneaux N, Hujer KM, Lavender H, Jamison JJ, MacDonald IJ, Martin KM, Russo T, Campagnari AA, Hujer AM, Bonomo RA, Gill SR. 2008. Comparative genome sequence analysis of multidrug-resistant Acinetobacter baumannii. J. Bacteriol. 190:8053–8064. 10.1128/JB.00834-08 [DOI] [PMC free article] [PubMed] [Google Scholar]
- 20. Maragakis LL, Perl TM. 2008. Acinetobacter baumannii: epidemiology, antimicrobial resistance, and treatment options. Clin. Infect. Dis. 46:1254–1263. 10.1086/529198 [DOI] [PubMed] [Google Scholar]
- 21. Clifford RJ, Milillo M, Prestwood J, Quintero R, Zurawski DV, Kwak YI, Waterman PE, Lesho EP, McGann P. 2012. Detection of bacterial 16S rRNA and identification of four clinically important bacteria by real-time PCR. PLoS One 7:e48558. 10.1371/journal.pone.0048558 [DOI] [PMC free article] [PubMed] [Google Scholar]
- 22. Foucault ML, Courvalin P, Grillot-Courvalin C. 2009. Fitness cost of VanA-type vancomycin resistance in methicillin-resistant Staphylococcus aureus. Antimicrob. Agents Chemother. 53:2354–2359. 10.1128/AAC.01702-08 [DOI] [PMC free article] [PubMed] [Google Scholar]
- 23. Foucault ML, Depardieu F, Courvalin P, Grillot-Courvalin C. 2010. Inducible expression eliminates the fitness cost of vancomycin resistance in enterococci. Proc. Natl. Acad. Sci. U. S. A. 107:16964–16969. 10.1073/pnas.1006855107 [DOI] [PMC free article] [PubMed] [Google Scholar]
- 24. Waggoner BT, Gonzalez NS, Taylor AL. 1974. Isolation of heterogeneous circular DNA from induced lysogens of bacteriophage Mu-1. Proc. Natl. Acad. Sci. U. S. A. 71:1255–1259 [DOI] [PMC free article] [PubMed] [Google Scholar]
- 25. Andersson DI, Hughes D. 2009. Gene amplification and adaptive evolution in bacteria. Annu. Rev. Genet. 43:167–195. 10.1146/annurev-genet-102108-134805 [DOI] [PubMed] [Google Scholar]
- 26. Labigne-Roussel A, Briaux-Gerbaud S, Courvalin P. 1983. Tn1525, a kanamycin R determinant flanked by two direct copies of IS15. Mol. Gen. Genet. 189:90–101. 10.1007/BF00326060 [DOI] [PubMed] [Google Scholar]
- 27. Courvalin P, Carlier C. 1981. Resistance towards aminoglycoside-aminocyclitol antibiotics in bacteria. J. Antimicrob. Chemother. 8(Suppl A):57–69. 10.1093/jac/8.suppl_E.57 [DOI] [PubMed] [Google Scholar]
- 28. Menard R, Molinas C, Arthur M, Duval J, Courvalin P, Leclercq R. 1993. Overproduction of 3′-aminoglycoside phosphotransferase type I confers resistance to tobramycin in Escherichia coli. Antimicrob. Agents Chemother. 37:78–83. 10.1128/AAC.37.1.78 [DOI] [PMC free article] [PubMed] [Google Scholar]
- 29. Pettersson ME, Sun S, Andersson DI, Berg OG. 2009. Evolution of new gene functions: simulation and analysis of the amplification model. Genetica 135:309–324. 10.1007/s10709-008-9289-z [DOI] [PubMed] [Google Scholar]
- 30. Anderson RP, Roth JR. 1978. Tandem chromosomal duplications in Salmonella typhimurium: fusion of histidine genes to novel promoters. J. Mol. Biol. 119:147–166. 10.1016/0022-2836(78)90274-7 [DOI] [PubMed] [Google Scholar]
- 31. Haack KR, Roth JR. 1995. Recombination between chromosomal IS200 elements supports frequent duplication formation in Salmonella typhimurium. Genetics 141:1245–1252 [DOI] [PMC free article] [PubMed] [Google Scholar]
- 32. Magnet S, Smith TA, Zheng R, Nordmann P, Blanchard JS. 2003. Aminoglycoside resistance resulting from tight drug binding to an altered aminoglycoside acetyltransferase. Antimicrob. Agents Chemother. 47:1577–1583. 10.1128/AAC.47.5.1577-1583.2003 [DOI] [PMC free article] [PubMed] [Google Scholar]
- 33. Clinical and Laboratory Standards Institute 2012. Performance standards for antimicrobial susceptibility testing. M100–S22. Clinical and Laboratory Standards Institute, Wayne, PA [Google Scholar]
- 34. Reischl U, Linde HJ, Metz M, Leppmeier B, Lehn N. 2000. Rapid identification of methicillin-resistant Staphylococcus aureus and simultaneous species confirmation using real-time fluorescence PCR. J. Clin. Microbiol. 38:2429–2433 [DOI] [PMC free article] [PubMed] [Google Scholar]
- 35. Bustin SA, Benes V, Garson JA, Hellemans J, Huggett J, Kubista M, Mueller R, Nolan T, Pfaffl MW, Shipley GL, Vandesompele J, Wittwer CT. 2009. The MIQE guidelines: minimum information for publication of quantitative real-time PCR experiments. Clin. Chem. 55:611–622. 10.1373/clinchem.2008.112797 [DOI] [PubMed] [Google Scholar]
- 36. Kearse M, Moir R, Wilson A, Stones-Havas S, Cheung M, Sturrock S, Buxton S, Cooper A, Markowitz S, Duran C, Thierer T, Ashton B, Meintjes P, Drummond A. 2012. Geneious Basic: an integrated and extendable desktop software platform for the organization and analysis of sequence data. Bioinformatics 28:1647–1649. 10.1093/bioinformatics/bts199 [DOI] [PMC free article] [PubMed] [Google Scholar]
- 37. Dijkshoorn L, Nemec A, Seifert H. 2007. An increasing threat in hospitals: multidrug-resistant Acinetobacter baumannii. Nat. Rev. Microbiol. 5:939–951. 10.1038/nrmicro1789 [DOI] [PubMed] [Google Scholar]
Associated Data
This section collects any data citations, data availability statements, or supplementary materials included in this article.
Supplementary Materials
Average read coverage of aphA1, aacC1, and sul1 in clinical isolates MRSN 56, MRSN 57, and MRSN 58 as determined by whole-genome sequence using the Illumina MiSeq. Read coverage was calculated from raw reads using Geneious (Biomatters, Auckland, New Zealand) software. Download
Optical genome maps generated from three colonies of isolate MRSN 58 from the same overnight culture plate. The region corresponding to the amplification of Tn6020 is enclosed in red rectangles. The relative aphA1 copy number, as determined by qPCR, is indicated on the right. Download
Comparison of relative gene copy number (blue) and mRNA transcript levels (red) of usp in isolate MRSN 57 (A) and aphA1 in isolate MRSN 58 (B). Cells were harvested on days 0, 6, 12, and 20 from cultures grown on MH agar with tobramycin at a final concentration of 4 µg/ml (see Materials and Methods for details). Half of the collected cells were used for DNA extraction and qPCR, and the remaining half were used for RNA extraction for qRT-PCR. Data are the averages of three independent experiments. Error bars represent 1 standard deviation. Download
Schematic representation of the amplified unit in AB0057T. The AbaR3 resistance island is indicated by a thick black line, the amplified unit is indicated by a thin black line, and their sizes are shown in kilobases. The open arrows represent coding sequences (yellow arrows, IS26; red arrows, aminoglycoside resistance genes; blue arrows, genes associated with DNA mobility). The 5′ and 3′ portions of the truncated comM gene flanking AbaR3 are represented by black broken open arrows. The portions of AbaR3 not shown are indicated by the dotted lines. Gene nomenclature was assigned based on the closest BLAST match from GenBank (http://blast.ncbi.nlm.nih.gov/Blast.cgi, last accessed January 2014) using reference strain AB0057. Download
Primers used in this study