

ABSTRACT
Cells within biofilms exhibit physiological heterogeneity, in part because of chemical gradients existing within these spatially structured communities. Previous work has examined how chemical gradients develop in large biofilms containing >108 cells. However, many bacterial communities in nature are composed of small, densely packed aggregates of cells (≤105 bacteria). Using a gelatin-based three-dimensional (3D) printing strategy, we confined the bacterium Pseudomonas aeruginosa within picoliter-sized 3D “microtraps” that are permeable to nutrients, waste products, and other bioactive small molecules. We show that as a single bacterium grows into a maximally dense (1012 cells ml−1) clonal population, a localized depletion of oxygen develops when it reaches a critical aggregate size of ~55 pl. Collectively, these data demonstrate that chemical and phenotypic heterogeneity exists on the micrometer scale within small aggregate populations.
IMPORTANCE
Before developing into large, complex communities, microbes initially cluster into aggregates, and it is unclear if chemical heterogeneity exists in these ubiquitous micrometer-scale aggregates. We chose to examine oxygen availability within an aggregate since oxygen concentration impacts a number of important bacterial processes, including metabolism, social behaviors, virulence, and antibiotic resistance. By determining that oxygen availability can vary within aggregates containing ≤105 bacteria, we establish that physiological heterogeneity exists within P. aeruginosa aggregates, suggesting that such heterogeneity frequently exists in many naturally occurring small populations.
INTRODUCTION
Chemical gradients frequently arise in nature and consequently affect the physiology of organisms within their breadth. Such chemical heterogeneity exists within spatially structured communities of microbes called biofilms; this heterogeneity molds environmental microniches, influencing species diversity and the three-dimensional (3D) organization of cells (1–3). For example, the physical location of a bacterium within the substrata of a biofilm will impact viability, metabolic activity, gene expression, and phenotypes such as resistance to antimicrobials (1, 4, 5). The chemical gradients within biofilms develop because of multiple variables, including the diffusive properties of substrates, the number and spatial organization of cells, and their metabolic activity.
Before forming a large complex cell consortium, immature biofilms exist as smaller aggregates containing 101 to 105 cells (1, 6). In natural environments, bacteria are frequently found growing as aggregates, such as well-separated clusters on the skin surface, at infection sites, or as components of larger soil biofilm communities (7–10). Aggregates are pervasive in nature and are particularly clinically relevant, as many infections are thought to be seeded by aggregates of pathogenic bacteria (11–17). Even under planktonic conditions, where bacteria are often assumed to be single celled, bacteria are frequently clustered into aggregates (1, 6). Yet, remarkably little is known about the physiology of microbes within an aggregate.
Studying microbial aggregates of relevant size (≤105 cells) is challenging. While some techniques have provided a platform for isolating cells in picoliter-scale volumes (18–20), these strategies often do not provide conditions conducive to cell growth. Most techniques that confine small, actively growing populations (21–23) cannot organize cells within customized 3D arrangements and often do not enable rapid mass transport through the confined environment. Here we used gelatin-based 3D printing to confine single bacterial cells within micrometer-sized “houses” (referred to here as microtraps) constructed by covalently linking proteins by multiphoton lithography (24). This printing method is an advancement of the bacterial “lobster trap” technology that we previously described for isolating small bacterial populations (25), though the main principles behind this lithographic technique remain the same. While confining cells within “lobster traps” required cells to swim into a microtrap through a small opening, our new technique temporarily immobilizes cells within a thermally set gel matrix. Then, a picoliter-sized microtrap is constructed around a single bacterium and the thermally set gel is melted and removed by washing with warm (37°C) medium (24). Protein-based walls define aggregate size and shape in three dimensions on the micrometer scale and are permeable to nutrients, waste products, and other small molecules. Individual cells confined within microtraps grow at normal rates and reach extremely high densities (1012 cells ml−1) while maintaining cell numbers typical of naturally occurring aggregates (≤105 cells) (25).
Since nutrients diffuse readily through the walls of the microtrap, this experimental system allows examination of whether aggregates possess biofilm-like chemical gradients (25). Here we examined oxygen gradients within aggregates of the ubiquitous opportunistic pathogen Pseudomonas aeruginosa. Oxygen depletion is biologically relevant in P. aeruginosa since it influences outer membrane chemistry, polysaccharide production, quorum sensing, virulence factor production, and antibiotic resistance (4, 26–31). We provide evidence that an oxygen gradient develops within a densely packed aggregate of ≤105 cells, resulting in physiological adaptation of a subpopulation of cells within the aggregate. We also demonstrate that both the population size and surface area of the aggregate affect the oxygen gradient.
RESULTS
Previous work has shown that biofilms possess genetic and physiological heterogeneity in part because of chemical gradients within microenvironments (1, 4, 5). New biofilms generally begin as aggregates of cells (1, 6); however, the minimal population size required to generate these chemical gradients remains unclear, and this is a critical gap in our understanding of the physiology of structured populations. Despite their ubiquitous presence in nature, little is known about how growth proceeds within densely packed aggregates. Quantifying the growth kinetics of a single aggregate is difficult, as motility and environmental flux often change the shape and size of an aggregate (12, 32). These changing variables complicate observation-based time course studies, even for making simple measurements of aggregate growth rate and cell density. For this reason, we initiated this study by examining aggregate growth of P. aeruginosa confined within picoliter-sized, porous microtraps generated by gelatin-based 3D printing (24).
Protein walls porous to nutrients, waste products, and other small molecules (25) confine a single cell within a fully enclosed microtrap (Fig. 1). Initially, one confined cell is locally (within the microtrap) present at a density of 109 cells ml−1; however, because the microtrap walls are porous, cells within the microtrap can be supplied with a constant source of nutrients. Single cells grew rapidly within the microtraps, reaching a density of 1012 cells ml−1 within ~8 to 10 h, and continued to stretch the flexible, gelatin-based walls for several hours due to their increasing cell mass (Fig. 2A and B; see Fig. S1A in the supplemental material). The microtrap’s wall flexibility enabled cells to continue to double for multiple hours while at densities of 1011 to 1012 ml−1 (Fig. 2A and B; see Fig. S1A). Our previously published quantifications of aggregate growth rate examined populations at densities of 109 to 1010 cells ml−1 at 37°C (25) because with our prior approach we could only examine the first five generations of clonal growth by light microscopy. Here, we used fluorescence microscopy to measure aggregate growth rates between 7 and 14 h postinoculation, where, depending on the microtrap volume, populations were consistently at a density of 1011 to 1012 cells ml−1, the density at which we predicted populations would develop steep nutrient gradients (Fig. 2). To our knowledge, growth rates of P. aeruginosa at densities exceeding 1010 cells ml−1 have never before been quantitated, as cells grown in flasks do not naturally reach densities of >109 to 1010 cells ml−1. Moreover, biofilm growth rates are difficult to quantify precisely, as cells constantly change location or often leave a biofilm via dispersion. Cells continued to double while at extremely high densities (at 25°C, generation times averaged 78 ± 16 min, Fig. 2), and the microtrap size did not significantly affect their generation time (Fig. 2C and D).
FIG 1 .
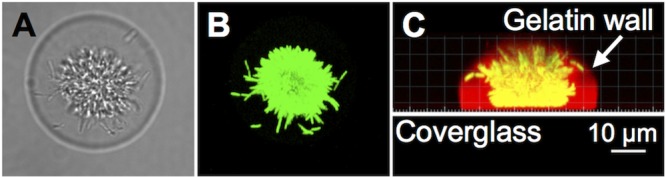
A P. aeruginosa aggregate confined within a 3D printed microtrap. (A, B) Transmitted light image and green channel images of a gelatin-based microtrap containing ∼104 P. aeruginosa constitutively expressing GFP (green). Shown are views from the top of the microtrap. (C) Side view image of the microtrap shown in panels A and B with walls (red) surrounding bacteria (yellow in this image). Images were acquired by confocal microscopy, and a 3D reconstruction of red and green channel stacks was prepared with Imaris.
FIG 2 .
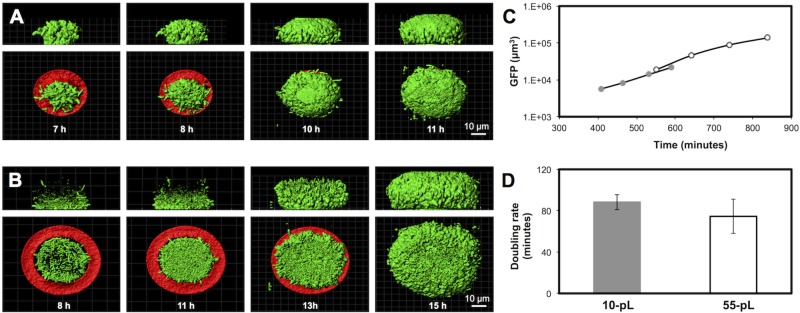
P. aeruginosa grows at normal rates when confined to densities of >108 cells ml−1. (A, B) P. aeruginosa PAO1 constitutively expressing gfp was captured inside a small microtrap (A) or a large microtrap (B) surrounded by 500 µl of growth medium. Images represent confocal fluorescence data within the microtrap over time (analyzed in Imaris, Isosurface mode). In the aggregate side view (top panels), the microtrap was digitally removed for clarity. In the bottom panels, the microtrap base is displayed (red) but the walls were digitally removed. The growth rate was calculated by determining the total GFP voxels detected inside the microtrap at multiple time points. (C) Representative P. aeruginosa growth curves for small microtraps (closed gray circles) and large microtraps (open circles). (D) Average growth rates (in minutes) in small and large microtraps. Error bars represent standard deviations, n = ≥3.
Since the substrata of biofilms can develop zones of nutrient depletion (2, 4), we sought to determine the size of an aggregate required to locally deplete nutrients. The concentration of any nutrient within a cell population is dictated by two main factors, the rate of nutrient diffusion into the population and the rate of nutrient consumption. This reaction-diffusion system concept can be used to describe the spatial distribution of one or more substances in natural environments (2, 33–35). In the present study, we examined oxygen depletion since it regulates important phenotypes in P. aeruginosa, including outer membrane modifications, polysaccharide production, quorum sensing, virulence factor production, and antibiotic resistance (4, 26–31). To predict the minimum size required for oxygen depletion, we used a previously described model for predicting the minimum size of a spherical aggregate necessary to deplete a solute at its center (where the oxygen concentration reaches zero [i.e., anaerobic] at the core point of the aggregate) (2). This aggregate size is defined by the radius, Rmin (Fig. 3A; see also Fig. S1A in the supplemental material), in the following equation:
FIG 3 .

Prediction of the minimum aggregate size required for oxygen depletion within an aggregate. (A, B) A previously described calculation that predicts the minimum size of a spherical aggregate necessary to deplete a solute at its center was used (2). (A) The diffusion coefficient (De) of oxygen through a population of densely packed bacteria is 1.12 × 10⁻⁵ cm2 s−1 (35, 36), and the concentration of oxygen (So) in the aqueous environment at 25°C is 8.24 mg liter−1, the maximum amount that can be dissolved in water under ambient conditions. (B) The volumetric reaction rate of oxygen within the aggregate (ko = 46 mg s−1 liter−1) was calculated by using a P. aeruginosa specific growth rate of 0.56 h−1 (75 min) and the density of cells within the aggregate, 250 mg cm−3 (1012 cells ml−1) (for a more thorough explanation see Fig. 2; see Fig. S1A in the supplemental material) (2, 37). On the basis of these values, an Rmin of 35 µm was calculated. (C, D) Surface-attached 15- and 60-pl populations (radii of 17 and 27 µm, respectively) generated from representative aggregate measurements were used to predict the steady-state oxygen concentration profile within the aggregate microenvironment, given by ∇2c = −ko, where c is the oxygen concentration and ko is the oxygen uptake rate per unit volume of cells. The oxygen concentration in the external medium is assumed to be at saturation. The equation was solved via finite-element simulations in three dimensions, assuming that there was no penetration at the glass coverslip boundary. The highly porous microtrap wall was assumed not to pose a significant diffusive barrier to oxygen (24, 25). The simulations for each representative aggregate size and shape were implemented in COMSOL.
| (1) |
To calculate Rmin, we made the following assumptions about the microenvironment of a P. aeruginosa aggregate grown at room temperature (25°C). (i) The diffusion coefficient of oxygen (De) through a population of densely packed bacteria is 1.12 × 10⁻⁵ cm2 s−1 (33, 36), and (ii) the concentration of oxygen (So) in the aqueous environment is 8.24 mg liter−1, the maximum amount that can be dissolved in water under ambient conditions (25°C). We can estimate the volumetric reaction rate of oxygen within the aggregate (consumption rate of oxygen [2, 37], see Fig. 3B and Materials and Methods), based on the experimentally determined specific growth rate and the density of cells within an aggregate (Fig. 2; see Fig. S1A in the supplemental material).
We used an average specific growth rate of 0.56 h−1 and a cell density of 250 mg cm−3 (75-min doubling time at a density of 1012 cells ml−1) to calculate the value of ko, 46 mg s−1 liter−1 (2) (Fig. 3B). These data allowed us to predict an Rmin value of 35 µm (Fig. 3A). This value is similar to existing predictions in the literature, where at depths of greater than ~60 µm, oxygen cannot be detected with probes (4, 38). At these same depths, multiple clinically important phenotypes arise, such as antibiotic resistance (1, 4).
Naturally occurring aggregates are often irregularly shaped and are sometimes attached to a surface. Equation 1 can only make predictions based on a spherical aggregate, addressing the development of an oxygen gradient over a 1D radius, and cannot account for nondiffusive surfaces (Fig. 3A). For this reason, we used COMSOL to model the 3D oxygen environment within irregularly shaped (i.e., not spherical), surface-attached aggregates. In these simulations, the steady-state oxygen concentration profile in the cell population is given by
| (2) |
where c is the oxygen concentration and ko is the oxygen uptake rate per unit volume of cells (Fig. 3A and B). Because we wanted to model a surface-attached population, we set a no-penetration (∇c = 0) boundary condition at the aggregate base to account for the lack of oxygen diffusion at the cover glass of our microtrap aggregates. For aggregate shape, dimensions representative of small and large surface-attached microtrap populations were used. This modeling advancement allowed us to predict the oxygen gradient in three dimensions, improving upon the predictions made by equation 1.
We first modeled two aggregate sizes with a previously reported oxygen uptake rate of 12 mg s−1 liter−1 (39), finding that both small and large aggregates display similar oxygen gradient profiles (Fig. 3C). The lowest concentration of oxygen present within the smaller aggregate model was 7.8 mg liter−1, whereas the lowest oxygen concentration in the larger aggregate was 6.9 mg liter−1. Because we predicted that our aggregates would consume oxygen at 46 mg s−1 liter−1 (Fig. 3A and B), 2- to 4-fold faster than some previously measured rates (39, 40), we also modeled oxygen levels with this higher ko value (Fig. 3D) and found that this intensified the oxygen depletion within the aggregates; the lowest oxygen concentration within the small aggregate was 6.4 mg liter−1, whereas the larger aggregate developed the steepest gradient, reaching as low as 3.2 mg liter−1 (Fig. 3D). These simulations indicate that an ~4-fold increase in the oxygen uptake rate can significantly alter the oxygen gradient within a larger (60-pl) aggregate.
To determine whether such oxygen gradients develop in P. aeruginosa aggregates, we assessed the oxygen concentration within confined bacterial populations in real time. Although there are numerous methods to quantify oxygen concentrations with electrochemical and optical probes (41–44), they generally provide only 1D or 2D detail and in some cases cannot provide micrometer-scale resolution. Though some probes can be motorized to provide 3D data, the movement of probes through a micrometer-sized aggregate would dramatically alter the aggregate shape. For this reason, we developed a cell-based biosensor to detect oxygen levels. In the assay, green fluorescent protein (GFP) expression serves as a proxy for the expression of an operon encoding the high-affinity terminal oxidase, cbb3-2, which has previously been shown to be transcriptionally induced when oxygen is depleted to ~2% (45, 46). Characterization of this biosensor strain revealed that GFP expression steadily increases as the oxygen concentration decreases to 2% (see Fig. S2 in the supplemental material), and GFP was detectable within 1 h upon exposure to these low-oxygen conditions. It should be noted that GFP requires the presence of oxygen for maturation of the chromophore; therefore, anaerobic conditions cannot be assessed with this biosensor (47).
To determine the aggregate size required for oxygen gradients to develop, the P. aeruginosa biosensor was confined in microtraps and allowed to grow and fill the microtrap, achieving cell densities of 1011 to 1012 cells ml−1. Aggregate sizes with radii smaller than those predicted by the Rmin equation were initially tested. Since the aggregates increased in volume over time and often formed nonuniform shapes, we use the term “radius” loosely, defined here as half of the widest width of the aggregate. A microtrap fabricated with an initial inner volume of 2 pl stretches because of cell growth to ~10 pl, with a radius of ~16 µm (Fig. 2A and 4B, left panel). Within these small aggregates, we did not detect appreciable amounts of GFP (Fig. 4A and B, left panels), demonstrating that oxygen levels do not diminish below our threshold (~2%) within this aggregate. However, increasing the microtrap size to ~55 pl (radius of ~27 µm) resulted in significant GFP production (Fig. 4A and B, center panels). These data support our 3D simulations, demonstrating the development of a region with <4 mg liter−1 oxygen near the base of a surface-associated aggregate with a radius of ~27 µm, but not in a smaller surface-associated aggregate with a radius of ~16 µm (Fig. 4). In addition, the faster of the two uptake rates simulated appears to more accurately reflect the experimental data (Fig. 4, left and center panels, and 3C and D); therefore, we reasoned that our mathematical simulations using the higher uptake rate (Fig. 3D) can make accurate predictions regarding the existence and character of oxygen gradients.
FIG 4 .

Oxygen gradients within aggregates of various sizes and shapes. (A, B) P. aeruginosa carrying a cbb3-2::gfp transcriptional fusion (pAW9) was captured inside microtraps with different inner volumes. When they are filled to capacity, no GFP expression is observed in the small microtraps (left), while significant GFP expression is observed in the larger microtraps (center). P < 0.04 via two-tailed Student t test (n = ≥13). When a 55-pl microtrap is raised on stilts, GFP is not observed (right). (A) Average volumes (± standard deviations) are listed below the bar graph. For simplicity in the text, the volumes have been rounded to the nearest 5-pl increment. (B) Representative side view confocal images display small and large surface-attached aggregates and a large aggregate suspended above the coverslip floor (represented as a white bar at the base). Portions of the microtrap walls have been digitally removed for clarity. The average volume of the large suspended aggregates (right panel) contained the same average volume as the large surface-attached aggregates (center panel) but with an additional exposed surface at the aggregate base. With an increased surface area-to-volume ratio, the suspended aggregate did not express detectable levels of GFP. (C) Lateral slices generated from mathematical simulations by using representative aggregate shapes (see Materials and Methods for details of the simulation parameters).
Since diffusion is impaired at the glass surface (Fig. 4B, left and center panels), our simulations predicted that this diffusion barrier inhibits oxygen penetration at the aggregate base. We hypothesized that increasing the diffusive surface area of an aggregate would result in an increased oxygen concentration throughout the aggregate, as predicted by our mathematical simulation of an aggregate not attached to a surface (Fig. 4C, right panel). To test this hypothesis, we capitalized on our ability to customize 3D printed shapes and raised this larger aggregate on stilts, away from the cover glass. This process exposed the bottom surface of the aggregate to a fluid interface where additional oxygen diffusion occurs in place of the glass diffusion barrier (Fig. 4B, right panel). We found that GFP was not detectable within large 55-pl aggregates lifted on stilts (Fig. 4A and B, right panels), demonstrating that increasing the (diffusive) surface area-to-volume ratio of a population will increase the oxygen available in the environment. Interestingly, when such suspended populations grew larger (65 pl) and touched the coverslip floor, significant diffusive surface area was lost and GFP expression was detected (see Fig. S3A and B in the supplemental material). In one replicate, an aggregate grew to 95 pl without touching the floor and significant GFP expression was detected (see Fig. S3C). These data are in agreement with our predictive Rmin equation and 3D simulations.
DISCUSSION
Using custom-fabricated protein microtraps and a low-oxygen biosensor, we determined that a surface-associated P. aeruginosa aggregate of ~55 pl possesses microaerophilic microenvironments near the surface. Because GFP is not immediately detected upon exposure to low oxygen (since gfp must be transcribed and translated to be detected), the precise time at which oxygen levels decreased to ≤2% cannot be determined; thus, it is likely that some aggregates smaller than 55 pl possess microaerophilic regions. However, since the P. aeruginosa biosensor produces detectable GFP within 1 h of exposure to 2% oxygen and the generation time of P. aeruginosa under these conditions is approximately 1 h, the earliest point at which oxygen limitation likely occurs is 1 h before the aggregate reaches a volume of 55 pl (i.e., half the size of the 55-pl trap or ~27 pl).
This study also developed a model to predict oxygen levels within P. aeruginosa aggregates of different sizes and shapes. This model is an advancement of previous models that estimated the minimum aggregate size required to produce anoxic growth conditions in spherical aggregates. Although our simulations generally agreed with the empirical data, some discrepancies between predicted and observed microaerophilic regions were observed, which could be attributable to the parameter values chosen to represent our experimental conditions. For example, we assumed that the concentration of oxygen in the growth medium was the maximum amount that can be dissolved in water, yet the growth medium used in this study contains high solute concentrations and therefore likely possesses lower dissolved oxygen concentrations. Additionally, the simulations assume that cells within the aggregate have uniform oxygen consumption rates and that the oxygen consumption rate does not depend on oxygen availability. Regardless, these simulations should be valuable for making predictions about more complex spatially organized microbial populations. For instance, modeling could yield insight into physiological heterogeneity and multispecies interactions within polymicrobial populations, providing predictions about solute gradients and resulting phenotypes in nature, where growth under laboratory conditions is not achievable or environmentally representative.
Beyond assessment of oxygen gradients in aggregates of distinct sizes and shapes, this work also demonstrated that P. aeruginosa continues to grow at normal rates when confined at extremely high cell densities (~1012 ml−1) in aggregates with volumes of up to ~55 pl. These data indicate that while levels of oxygen and potentially other nutrients may decrease in such aggregates, growth of the population is not measurably affected.
Collectively, this study provides new information regarding the physiology and growth of P. aeruginosa aggregates of sizes likely abundant in nature. Indeed, it is likely that many metabolically active naturally occurring aggregates become limited for oxygen and in response undergo clinically relevant phenotypic adaptations, such as altered production of virulence factors (30). Oxygen limitation has previously been correlated with increased antibiotic resistance; however, recent results from our lab indicate that as few as a few hundred P. aeruginosa bacteria can acquire antibiotic resistance when confined in microtraps (25). Our results here show that P. aeruginosa depletes oxygen in aggregates of ~105 cells, suggesting that antibiotic resistance cannot be explained by oxygen deprivation alone.
The approaches used in this study will be valuable for ascertaining the presence of other chemical gradients within bacterial aggregates, as well as environmental characteristics such as pH. Ultimately, it will be important to combine this 3D printing technology with analytical techniques such as scanning electrochemical microscopy and imaging mass spectrometry to provide precise, real-time measurement of chemicals of interest within aggregates.
MATERIALS AND METHODS
Bacterial strains, plasmids, and growth conditions.
The bacterial strains and plasmids used in this study are listed in Table 1. P. aeruginosa PAO1 constitutively expressing gfp from pMRP9-1 (48) was used in all growth studies, and PAO1 carrying the pAW9 oxygen reporter plasmid (see below) was used in all oxygen depletion studies. Escherichia coli and P. aeruginosa cultures were grown at 37°C with shaking at 250 rpm in tryptic soy broth (TSB), unless otherwise noted. Antibiotics were used at the following concentrations for plasmid selection: ampicillin, 100 µg ml−1 for E. coli; carbenicillin, 300 µg ml−1 for P. aeruginosa; gentamicin, 20 µg ml−1 for E. coli and 100 µg ml−1 for P. aeruginosa. For P. aeruginosa plasmid maintenance, the following concentrations were used: gentamicin, 50 µg ml−1; carbenicillin, 150 µg ml−1. Before cells were trapped within gelatin microstructures, P. aeruginosa strains were grown overnight in 0.5× TSB. Before initiation of growth rate studies and oxygen depletion studies, cultures were highly aerated by shaking a 5-ml culture volume in a 250-ml flask for a minimum of 2 h to reduce GFP levels within PAO1 carrying pAW9. During this 2-h period, the culture cell density did not exceed an optical density at 600 nm (OD600) of 1.0.
TABLE 1 .
Strains, plasmids, and primers used in this study
| Strain, plasmid, or primer | Description or sequence | Source or reference |
|---|---|---|
| Strains | ||
| E. coli DH5α | endA1 hsdR17 supE44 thi-1 recA1 Δ(lacZYA-argF)U169 deoR [φ80dlac Δ(lacZ)M15] | 51 |
| P. aeruginosa PAO1 | Wild type | |
| Plasmids | ||
| pGEMTeasy | Sequencing vector, Apr | Promega |
| pMRP9-1 | lac promoter-dependent GFP expression plasmid, Apr | 48 |
| pAW9 | cbb3-2-gfp reporter plasmid, Apr Gmr | This study |
| pGJB5 | rsaL-gfp reporter plasmid, Apr Gmr | 25 |
| Primers | ||
| cbb3-2-for | CGGAATTCGGTGCTGCTCGTGGGTCAG | This study |
| cbb3-2-rev | GCTCTAGATCAATCAATCACCACGGTTATACGCTATGGC | This study |
Microstructure fabrication around a single cell.
Photo-cross-linked gelatin microstructures were fabricated by a dynamic-mask multiphoton lithography technique as described elsewhere (24, 49, 50), with some modifications. Structures were printed from a precursor solution containing 200 mg ml−1 gelatin type A (porcine), 25 mg ml−1 bovine serum albumin, and 5 mM Rose Bengal as a photosensitizer in a buffer consisting of 20 mM HEPES and 0.1 M NaCl (pH 7.4) on the surface of a chambered no. 1 borosilicate cover glass (Lab-Tek; Thermo Fisher Scientific). Bacterial cultures were diluted into the fabrication solution to an OD600 of 0.01, and cells remained in fabrication precursor for no longer than 2.5 h. Warmed fabrication reagent containing bacteria was spotted onto the chambered cover glass, and printing was performed at room temperature once the precursor had cooled to form a gel. The output from a mode-locked titanium sapphire laser operating at 740 nm was scanned over an electronic photomask, and the reflected beam was collimated to overfill the back aperture of a 60× oil immersion objective (Olympus PlanApo, numerical aperture 1.4) situated on an inverted microscope (Zeiss Axiovert). In this work, all 3D microstructures were printed in a layer-by-layer manner at 5.0 s per plane with 0.50-µm steps in the optical axis between fabrication layers and an average laser power of ~45 mW (measured at the back aperture of the objective). After fabrication, samples were warmed to 37°C and washed repeatedly with 37°C TSB to melt and remove gelatin solution that was not photo-cross-linked. Samples were washed with TSB by pipetting three times at ~1, ~3, and ~7 h after microtrap fabrication. After washing, each sample remained on the chambered cover glass bathed in 500 µl of TSB.
Microscopy and analysis.
For up to 7 h after fabrication, cell growth was monitored via light microscopy (Nikon TS100) and the temperature was maintained at 37°C by placing the samples inside a microscope incubator (InVivo Scientific). After ~7 h, trapped cells were removed from the incubator and transported to the confocal microscope, where cells grew at room temperature (~25°C). Images were acquired as a z series with an SP2 acousto-optical beam splitter confocal microscope equipped with a 63×, numerical aperture 1.4 objective ~7 to 16 h after microtrap fabrication around either PAO1 constitutively expressing gfp from pMRP9-1 or PAO1 carrying the pAW9 reporter. Confocal fluorescence images were acquired as previously described, with some modifications (25). Green-channel images were acquired using 488-nm excitation and emission centered at 515 nm (35-nm slit width), while red-channel images (of fluorescence from microtrap walls) were collected using 543-nm excitation and emission centered at 640 nm (120-nm slit width). The inner dimensions and volume of each microtrap, the volume of cells constitutively expressing GFP, and the total voxels of GFP-positive PAO1 pAW9 reporter cells were quantified with Imaris software (Bitplane AG, Switzerland). To detect the walls of the gelatin microtraps, the Isosurface mode of the Surpass module was used to generate isosurfaces of the red channel stacks. The threshold for the red channel isosurfaces was determined manually. The inner volume of the microtrap was quantified at multiple time points by generating an isosurface from the nonfluorescent red channel pixels present within the confines of the red isosurface walls. For simplicity, we refer to “small” and “large” microtraps by their average volumes in picoliters when filled to maximum capacity (1012 cells ml−1), rounding to the nearest 5-pl increment.
Because microtraps also emit some fluorescence in the green channel, a modified green channel was generated by masking the green channel with the isosurface of the red trap walls (see paragraph above), so that the green fluorescence from the microtrap walls was set to zero. Resultant modified green channels contained only fluorescence originating from GFP-positive cells. The number of cells present within a microtrap was determined by trapping PAO1 constitutively expressing GFP and generating an isosurface image of the modified green channel stacks, which determined the total amount of green fluorescence above the background. The generation time was calculated by determining the volume of GFP within each microtrap over three successive time points after the populations grew to maximum cell densities (1011 to 1012 ml−1). The total GFP-positive voxels from PAO1 pAW9 oxygen reporter cells within microtraps was determined by generating an isosurface image of the modified green channel stacks. For determination of GFP-positive voxels, see the paragraph on oxygen reporter construction and characterization below.
Mathematical modeling of the aggregate microenvironment.
To predict the radius of the minimum spherical aggregate size required to deplete oxygen at its center (Rmin), we made a simple prediction by using equation 1 (as defined above; see also reference 2), which assumes zero-order kinetics (i.e., the reaction rate [oxygen consumption rate] does not depend on the concentration of the solute [oxygen]). Equation 1 was solved using a diffusion coefficient of oxygen through densely packed bacteria, 1.12 × 10⁻⁵ cm2 s−1 (De was estimated by using the average reported relative effective diffusivity of oxygen) (33, 36), and the maximum amount of oxygen that can be dissolved in pure water at 25°C (So; 8.24 mg liter−1). To determine the volumetric reaction rate of oxygen (oxygen consumption rate) given by ko = μ X/YxO2, we quantified μ, the specific growth rate of cells, and X, the density of cells within an aggregate (2, 37). We assumed a yield coefficient of Pseudomonas biomass on oxygen (YxO2) of 0.85 (2, 37) and solved for ko (ko = 46 mg s−1 liter−1; Fig. 2 shows specific growth rate and cell density determinations; see Fig. S1 in the supplemental material).
To model the oxygen concentration in three dimensions, we employed more sophisticated modeling, where the steady-state oxygen concentration profile in the cell population is given by equation 2 (as defined above).
Two ko values were used in the models in Fig. 3. Figure 3C employed a previously measured rate (39), and Fig. 3D used a rate estimated for the experimental design used in this study (Fig. 3A and B). Equation 2 was solved via finite-element simulations in three dimensions. A no-penetration (∇c = 0) boundary condition was applied at the glass substrate, while the oxygen concentration at the porous microtrap wall was assumed to equal that in the external medium. The simulations were implemented in COMSOL Multiphysics Engineering Simulation Software v 3.5a, employing standard Galerkin finite elements. Fewer than 25,000 second order Lagrange elements were found to be sufficient for convergence for all of the aggregates simulated.
Oxygen reporter construction and characterization.
To construct an oxygen depletion reporter plasmid, the region upstream of the cbb3-2 operon was amplified from P. aeruginosa chromosomal DNA (the primers used are described in Table 1). pGJB5 (25) and the PCR product were digested with EcoRI and XbaI. The larger ~6.6-kb fragment resulting from the pGJB5 digestion was gel purified and subsequently ligated with the purified digested PCR product. The resulting circularized plasmid, pAW9, was confirmed by sequencing and transformed into P. aeruginosa PAO1 by electroporation. To characterize the reporter response to low oxygen levels, the oxygen reporter strain PAO1 containing the pAW9 plasmid was grown overnight in 0.5× TSB with 50 µg ml−1 gentamicin. Since cells were oxygen limited in overnight cultures, GFP was highly expressed; therefore, fully aerated cultures were grown with shaking at 250 rpm in a 1:50 culture volume to flask volume ratio at low cell densities (≤108 ml−1) for 2 h to dilute the residual GFP in cells. Cells were then grown to log phase and added to medium in sealed Balch culture tubes, where the final concentration of molecular oxygen in each tube was estimated to be 21, 10, 5, 2, or 0.4% atmospheric oxygen. To produce the respective oxygen conditions, unsealed Balch tubes containing medium were initially made anaerobic by overnight incubation in an anaerobic chamber (5% H2, 10% CO2, and 85% N2 atmosphere; Coy). The Balch tubes were then sealed with rubber stoppers, and a syringe was used to replace anaerobic gas with appropriate volumes of ambient air (21% O2). We did not test 0% oxygen, since GFP does not fluoresce when expressed anaerobically. Reporter cells in sealed Balch tubes were grown while shaking at 250 rpm at room temperature (25°C) for 2 h and washed once with phosphate-buffered saline (PBS), and a Bio-Tek Synergy MX (Bio-Tek) microplate reader was used to detect sample fluorescence (excitation wavelength, 475 nm; emission wavelength, 515 nm) and cell density (OD600) in triplicate. The fluorescence and cell density values detected by the plate reader were used to determine the fluorescence intensity per cell, which was correlated to the fluorescence intensity per cell detected by confocal microscopy (see above). Green channel voxels of >83 digitization units on an 8-bit scale were considered GFP positive, as this included intensity values within 1 standard deviation of the average of cells exposed to 2% oxygen (~1 mg liter−1) and some of the higher-intensity values detected for cells exposed to 5% oxygen. This confocal intensity value correlates with ~60,000 arbitrary fluorescence units in our plate reader assay (see Fig. S2 in the supplemental material).
SUPPLEMENTAL MATERIAL
Microtrap wall stretching due to cell growth. (A) In the representative set of images, microtrap walls (red) expand and the inner volume (false colored blue) increases over time because of an increase in cell mass. The inner volume is quantified by determining the negative space within the microtrap (see Materials and Methods). (B) In all experiments using the cbb3-2::gfp reporter, inner volumes were quantified with Imaris. Confocal stacks were acquired approximately every 60 to 90 min. Because gelatin walls were flexible and expanded as the bacterial population grew, oxygen depletion within a range of aggregate volumes (5 to 95 pl) at maximum cell density could be assessed. GFP expression did not occur until the aggregate reached a critical volume (right panels). The images displayed are representative of the large aggregates. Download
Response of a P. aeruginosa low-oxygen reporter. P. aeruginosa cells carrying the cbb3-2::gfp reporter were exposed to various amounts of oxygen in sealed Balch culture tubes containing growth medium. After 2 h, the cells were washed with PBS and the amount of fluorescence per cell was determined in triplicate with a microplate reader. Fluorescence intensity per cell increases as the oxygen concentration decreases. Bars represent standard deviations. Download
Changing the diffusive surface area of a suspended aggregate. Side view confocal images display P. aeruginosa carrying a cbb3-2::gfp transcriptional fusion and captured inside microtraps suspended above the coverslip floor (represented as a white bar at the base). Portions of the microtrap walls have been digitally removed for clarity. (A, B) As the aggregate volume increases (from left to right), some aggregates eventually touch the floor and lose diffusive surface area, resulting in GFP expression (n = 2). (C) Image of a single aggregate that remained suspended and expressed GFP after reaching a size of 95 pl (n = 1). Download
ACKNOWLEDGMENTS
We are thankful for the financial support of the Cystic Fibrosis Foundation (WHITEL11G0 to M.W.), the National Institutes of Health (1R21AI097929 to M.W. and J.B.S.), the Welch Foundation (F-1331 to J.B.S.), and the Norman Hackerman Advanced Research Program (003658-0273-2007 to J.B.S.). M.W. is a Burroughs Wellcome investigator in the pathogenesis of infectious disease. A.K.W. is a National Institutes of Health predoctoral fellow (F31DE021648).
We thank members of the Whiteley lab for critical reading of the manuscript and Keith Turner and Apollo Stacy for discussions regarding data analysis.
Footnotes
Citation Wessel AK, Arshad TA, Fitzpatrick M, Connell JL, Bonnecaze RT, Shear JB, Whiteley M. 2014. Oxygen limitation within a bacterial aggregate. mBio 5(2):e00992-14. doi:10.1128/mBio.00992-14.
REFERENCES
- 1. Stewart PS, Franklin MJ. 2008. Physiological heterogeneity in biofilms. Nat. Rev. Microbiol. 6:199–210. 10.1038/nrmicro1838 [DOI] [PubMed] [Google Scholar]
- 2. Stewart PS. 2003. Diffusion in biofilms. J. Bacteriol. 185:1485–1491. 10.1128/JB.185.5.1485-1491.2003 [DOI] [PMC free article] [PubMed] [Google Scholar]
- 3. Costerton JW, Lewandowski Z, DeBeer D, Caldwell D, Korber D, James G. 1994. Biofilms, the customized microniche. J. Bacteriol. 176:2137–2142 [DOI] [PMC free article] [PubMed] [Google Scholar]
- 4. Walters MC, III, Roe F, Bugnicourt A, Franklin MJ, Stewart PS. 2003. Contributions of antibiotic penetration, oxygen limitation, and low metabolic activity to tolerance of Pseudomonas aeruginosa biofilms to ciprofloxacin and tobramycin. Antimicrob. Agents Chemother. 47:317–323. 10.1128/AAC.47.1.317-323.2003 [DOI] [PMC free article] [PubMed] [Google Scholar]
- 5. Lenz AP, Williamson KS, Pitts B, Stewart PS, Franklin MJ. 2008. Localized gene expression in Pseudomonas aeruginosa biofilms. Appl. Environ. Microbiol. 74:4463–4471. 10.1128/AEM.00710-08 [DOI] [PMC free article] [PubMed] [Google Scholar]
- 6. Schleheck D, Barraud N, Klebensberger J, Webb JS, McDougald D, Rice SA, Kjelleberg S. 2009. Pseudomonas aeruginosa PAO1 preferentially grows as aggregates in liquid batch cultures and disperses upon starvation. PLoS One 4:e5513. 10.1371/journal.pone.0005513 [DOI] [PMC free article] [PubMed] [Google Scholar]
- 7. Singh PK, Schaefer AL, Parsek MR, Moninger TO, Welsh MJ, Greenberg EP. 2000. Quorum-sensing signals indicate that cystic fibrosis lungs are infected with bacterial biofilms. Nature 407:762–764. 10.1038/35037627 [DOI] [PubMed] [Google Scholar]
- 8. Costerton JW, Lewandowski Z, Caldwell DE, Korber DR, Lappin-Scott HM. 1995. Microbial biofilms. Annu. Rev. Microbiol. 49:711–745. 10.1146/annurev.mi.49.100195.003431 [DOI] [PubMed] [Google Scholar]
- 9. Holt RJ. 1971. Aerobic bacterial counts on human skin after bathing. J. Med. Microbiol. 4:319–327. 10.1099/00222615-4-3-319 [DOI] [PubMed] [Google Scholar]
- 10. Somerville DA, Noble WC. 1973. Microcolony size of microbes on human skin. J. Med. Microbiol. 6:323–328. 10.1099/00222615-6-3-323 [DOI] [PubMed] [Google Scholar]
- 11. Faruque SM, Biswas K, Udden SM, Ahmad QS, Sack DA, Nair GB, Mekalanos JJ. 2006. Transmissibility of cholera: in vivo-formed biofilms and their relationship to infectivity and persistence in the environment. Proc. Natl. Acad. Sci. U. S. A. 103:6350–6355. 10.1073/pnas.0601277103 [DOI] [PMC free article] [PubMed] [Google Scholar]
- 12. Hall-Stoodley L, Stoodley P. 2005. Biofilm formation and dispersal and the transmission of human pathogens. Trends Microbiol. 13:7–10. 10.1016/j.tim.2004.11.004 [DOI] [PubMed] [Google Scholar]
- 13. Kamruzzaman M, Udden SM, Cameron DE, Calderwood SB, Nair GB, Mekalanos JJ, Faruque SM. 2010. Quorum-regulated biofilms enhance the development of conditionally viable, environmental Vibrio cholerae. Proc. Natl. Acad. Sci. U. S. A. 107:1588–1593. 10.1073/pnas.0913404107 [DOI] [PMC free article] [PubMed] [Google Scholar]
- 14. Kolenbrander PE. 1995. Coaggregations among oral bacteria. Methods Enzymol. 253:385–397. 10.1016/S0076-6879(95)53033-9 [DOI] [PubMed] [Google Scholar]
- 15. Schaber JA, Triffo WJ, Suh SJ, Oliver JW, Hastert MC, Griswold JA, Auer M, Hamood AN, Rumbaugh KP. 2007. Pseudomonas aeruginosa forms biofilms in acute infection independent of cell-to-cell signaling. Infect. Immun. 75:3715–3721. 10.1128/IAI.00586-07 [DOI] [PMC free article] [PubMed] [Google Scholar]
- 16. Stoodley P, Wilson S, Hall-Stoodley L, Boyle JD, Lappin-Scott HM, Costerton JW. 2001. Growth and detachment of cell clusters from mature mixed-species biofilms. Appl. Environ. Microbiol. 67:5608–5613. 10.1128/AEM.67.12.5608-5613.2001 [DOI] [PMC free article] [PubMed] [Google Scholar]
- 17. Heydorn A, Nielsen AT, Hentzer M, Sternberg C, Givskov M, Ersbøll BK, Molin S. 2000. Quantification of biofilm structures by the novel computer program COMSTAT. Microbiology 146(Pt 10):2395–2407 [DOI] [PubMed] [Google Scholar]
- 18. Baca HK, Ashley C, Carnes E, Lopez D, Flemming J, Dunphy D, Singh S, Chen Z, Liu N, Fan H, López GP, Brozik SM, Werner-Washburne M, Brinker CJ. 2006. Cell-directed assembly of lipid-silica nanostructures providing extended cell viability. Science 313:337–341. 10.1126/science.1126590 [DOI] [PubMed] [Google Scholar]
- 19. Boedicker JQ, Vincent ME, Ismagilov RF. 2009. Microfluidic confinement of single cells of bacteria in small volumes initiates high-density behavior of quorum sensing and growth and reveals its variability. Angew. Chem. Int. Ed. Engl. 48:5908–5911. 10.1002/anie.200901550 [DOI] [PMC free article] [PubMed] [Google Scholar]
- 20. Carnes EC, Lopez DM, Donegan NP, Cheung A, Gresham H, Timmins GS, Brinker CJ. 2010. Confinement-induced quorum sensing of individual Staphylococcus aureus bacteria. Nat. Chem. Biol. 6:41–45. 10.1038/nchembio.264 [DOI] [PMC free article] [PubMed] [Google Scholar]
- 21. Balaban NQ, Merrin J, Chait R, Kowalik L, Leibler S. 2004. Bacterial persistence as a phenotypic switch. Science 305:1622–1625. 10.1126/science.1099390 [DOI] [PubMed] [Google Scholar]
- 22. Balagaddé FK, You L, Hansen CL, Arnold FH, Quake SR. 2005. Long-term monitoring of bacteria undergoing programmed population control in a microchemostat. Science 309:137–140. 10.1126/science.1109173 [DOI] [PubMed] [Google Scholar]
- 23. Cho H, Jönsson H, Campbell K, Melke P, Williams JW, Jedynak B, Stevens AM, Groisman A, Levchenko A. 2007. Self-organization in high-density bacterial colonies: efficient crowd control. PLoS Biol. 5:e302. 10.1371/journal.pbio.0050302 [DOI] [PMC free article] [PubMed] [Google Scholar]
- 24. Connell JL, Ritschdorff ET, Whiteley M, Shear JB. 2013. 3D printing of microscopic bacterial communities. Proc. Natl. Acad. Sci. U. S. A. 110:18380–18385. 10.1073/pnas.1309729110 [DOI] [PMC free article] [PubMed] [Google Scholar]
- 25. Connell JL, Wessel AK, Parsek MR, Ellington AD, Whiteley M, Shear JB. 2010. Probing prokaryotic social behaviors with bacterial “lobster traps.” mBio 1:e00202-10. 10.1128/mBio.00202-10 [DOI] [PMC free article] [PubMed] [Google Scholar]
- 26. Schobert M, Jahn D. 2010. Anaerobic physiology of Pseudomonas aeruginosa in the cystic fibrosis lung. Int. J. Med. Microbiol. 300:549–556. 10.1016/j.ijmm.2010.08.007 [DOI] [PubMed] [Google Scholar]
- 27. Worlitzsch D, Tarran R, Ulrich M, Schwab U, Cekici A, Meyer KC, Birrer P, Bellon G, Berger J, Weiss T, Botzenhart K, Yankaskas JR, Randell S, Boucher RC, Döring G. 2002. Effects of reduced mucus oxygen concentration in airway Pseudomonas infections of cystic fibrosis patients. J. Clin. Invest. 109:317–325. 10.1172/JCI200213870 [DOI] [PMC free article] [PubMed] [Google Scholar]
- 28. Bragonzi A, Worlitzsch D, Pier GB, Timpert P, Ulrich M, Hentzer M, Andersen JB, Givskov M, Conese M, Doring G. 2005. Nonmucoid Pseudomonas aeruginosa expresses alginate in the lungs of patients with cystic fibrosis and in a mouse model. J. Infect. Dis. 192:410–419. 10.1086/431516 [DOI] [PMC free article] [PubMed] [Google Scholar]
- 29. Sabra W, Lünsdorf H, Zeng AP. 2003. Alterations in the formation of lipopolysaccharide and membrane vesicles on the surface of Pseudomonas aeruginosa PAO1 under oxygen stress conditions. Microbiology 149:2789–2795. 10.1099/mic.0.26443-0 [DOI] [PubMed] [Google Scholar]
- 30. Schertzer JW, Brown SA, Whiteley M. 2010. Oxygen levels rapidly modulate Pseudomonas aeruginosa social behaviours via substrate limitation of PqsH. Mol. Microbiol. 77:1527–1538. 10.1111/j.1365-2958.2010.07303.x [DOI] [PMC free article] [PubMed] [Google Scholar]
- 31. Hentzer M, Teitzel GM, Balzer GJ, Heydorn A, Molin S, Givskov M, Parsek MR. 2001. Alginate overproduction affects Pseudomonas aeruginosa biofilm structure and function. J. Bacteriol. 183:5395–5401. 10.1128/JB.183.18.5395-5401.2001 [DOI] [PMC free article] [PubMed] [Google Scholar]
- 32. Rendueles O, Ghigo JM. 24 January 2012. Multi-species biofilms: how to avoid unfriendly neighbors. FEMS Microbiol. Rev. (Epub ahead of print.) 10.1111/j.1574-6976.2012.00328.x [DOI] [PubMed] [Google Scholar]
- 33. Stewart PS. 1998. A review of experimental measurements of effective diffusive permeabilities and effective diffusion coefficients in biofilms. Biotechnol. Bioeng. 59:261–272. [DOI] [PubMed] [Google Scholar]
- 34. de Beer D, Stoodley P, Roe F, Lewandowski Z. 1994. Effects of biofilm structures on oxygen distribution and mass transport. Biotechnol. Bioeng. 43:1131–1138. 10.1002/bit.260431118 [DOI] [PubMed] [Google Scholar]
- 35. Stewart PS, Robertson CR. 1989. Microbial growth in a fixed volume: studies with entrapped Escherichia coli. Appl. Microbiol. Biotechnol. 30:34–40 [Google Scholar]
- 36. Han P, Bartels DM. 1996. Temperature dependence of oxygen diffusion in H2O and D2O. J. Phys. Chem. 100:5597–5602. 10.1021/jp952903y [DOI] [Google Scholar]
- 37. Bailey JE, Ollis DF. 1986. Biochemical engineering fundamentals, 2nd ed. McGraw-Hill, New York, NY. [Google Scholar]
- 38. Dietrich LE, Okegbe C, Price-Whelan A, Sakhtah H, Hunter RC, Newman DK. 2013. Bacterial community morphogenesis is intimately linked to the intracellular redox state. J. Bacteriol. 195:1371–1380. 10.1128/JB.02273-12 [DOI] [PMC free article] [PubMed] [Google Scholar]
- 39. Gomez E, Santos VE, Alcon A, Martin AB, Garcia-Ochoa F. 2006. Oxygen-uptake and mass-transfer rates on the growth of Pseudomonas putida CECT5279: influence on biodesulfurization (BDS) capability. Energy Fuels 20:1565–1571. 10.1021/ef050362y [DOI] [Google Scholar]
- 40. Geckil H, Stark BC, Webster DA. 2001. Cell growth and oxygen uptake of Escherichia coli and Pseudomonas aeruginosa are differently effected by the genetically engineered Vitreoscilla hemoglobin gene. J. Biotechnol. 85:57–66. 10.1016/S0168-1656(00)00384-9 [DOI] [PubMed] [Google Scholar]
- 41. Kühl M, Rickelt LF, Thar R. 2007. Combined imaging of bacteria and oxygen in biofilms. Appl. Environ. Microbiol. 73:6289–6295. 10.1128/AEM.01574-07 [DOI] [PMC free article] [PubMed] [Google Scholar]
- 42. Staal M, Borisov SM, Rickelt LF, Klimant I, Kühl M. 2011. Ultrabright planar optodes for luminescence life-time based microscopic imaging of O2 dynamics in biofilms. J. Microbiol. Methods 85:67–74. 10.1016/j.mimet.2011.01.021 [DOI] [PubMed] [Google Scholar]
- 43. Revsbech NP. 2005. Analysis of microbial communities with electrochemical microsensors and microscale biosensors. Methods Enzymol. 397:147–166. 10.1016/S0076-6879(05)97009-2 [DOI] [PubMed] [Google Scholar]
- 44. Klimant I, Meyer V, Kuhl M. 1995. Fiberoptic oxygen microsensors, a new tool in aquatic biology. Limnol. Oceanogr. 40:1159–1165. 10.4319/lo.1995.40.6.1159 [DOI] [Google Scholar]
- 45. Alvarez-Ortega C, Harwood CS. 2007. Responses of Pseudomonas aeruginosa to low oxygen indicate that growth in the cystic fibrosis lung is by aerobic respiration. Mol. Microbiol. 65:153–165. 10.1111/j.1365-2958.2007.05772.x [DOI] [PMC free article] [PubMed] [Google Scholar]
- 46. Kawakami T, Kuroki M, Ishii M, Igarashi Y, Arai H. 2010. Differential expression of multiple terminal oxidases for aerobic respiration in Pseudomonas aeruginosa. Environ. Microbiol. 12:1399–1412. 10.1111/j.1462-2920.2009.02109.x [DOI] [PubMed] [Google Scholar]
- 47. Heim R, Prasher DC, Tsien RY. 1994. Wavelength mutations and posttranslational autoxidation of green fluorescent protein. Proc. Natl. Acad. Sci. U. S. A. 91:12501–12504. 10.1073/pnas.91.26.12501 [DOI] [PMC free article] [PubMed] [Google Scholar]
- 48. Davies DG, Parsek MR, Pearson JP, Iglewski BH, Costerton JW, Greenberg EP. 1998. The involvement of cell-to-cell signals in the development of a bacterial biofilm. Science 280:295–298. 10.1126/science.280.5361.295 [DOI] [PubMed] [Google Scholar]
- 49. Kaehr B, Shear JB. 2007. Mask-directed multiphoton lithography. J. Am. Chem. Soc. 129:1904–1905. 10.1021/ja068390y [DOI] [PubMed] [Google Scholar]
- 50. Nielson R, Kaehr B, Shear JB. 2009. Microreplication and design of biological architectures using dynamic-mask multiphoton lithography. Small 5:120–125. 10.1002/smll.200801084 [DOI] [PubMed] [Google Scholar]
- 51. Sambrook J, Fritsch EF, Maniatis T. 1989. Molecular cloning: a laboratory manual, 2nd ed. Cold Spring Harbor Laboratory Press, Cold Spring Harbor, NY [Google Scholar]
Associated Data
This section collects any data citations, data availability statements, or supplementary materials included in this article.
Supplementary Materials
Microtrap wall stretching due to cell growth. (A) In the representative set of images, microtrap walls (red) expand and the inner volume (false colored blue) increases over time because of an increase in cell mass. The inner volume is quantified by determining the negative space within the microtrap (see Materials and Methods). (B) In all experiments using the cbb3-2::gfp reporter, inner volumes were quantified with Imaris. Confocal stacks were acquired approximately every 60 to 90 min. Because gelatin walls were flexible and expanded as the bacterial population grew, oxygen depletion within a range of aggregate volumes (5 to 95 pl) at maximum cell density could be assessed. GFP expression did not occur until the aggregate reached a critical volume (right panels). The images displayed are representative of the large aggregates. Download
Response of a P. aeruginosa low-oxygen reporter. P. aeruginosa cells carrying the cbb3-2::gfp reporter were exposed to various amounts of oxygen in sealed Balch culture tubes containing growth medium. After 2 h, the cells were washed with PBS and the amount of fluorescence per cell was determined in triplicate with a microplate reader. Fluorescence intensity per cell increases as the oxygen concentration decreases. Bars represent standard deviations. Download
Changing the diffusive surface area of a suspended aggregate. Side view confocal images display P. aeruginosa carrying a cbb3-2::gfp transcriptional fusion and captured inside microtraps suspended above the coverslip floor (represented as a white bar at the base). Portions of the microtrap walls have been digitally removed for clarity. (A, B) As the aggregate volume increases (from left to right), some aggregates eventually touch the floor and lose diffusive surface area, resulting in GFP expression (n = 2). (C) Image of a single aggregate that remained suspended and expressed GFP after reaching a size of 95 pl (n = 1). Download