Abstract
Previous methods to estimate the inherent accuracy of deformable image registration (DIR) have typically been performed relative to a known ground truth, such as tracking of anatomic landmarks or known deformations in a physical or virtual phantom. In this study, we propose a new approach to estimate the spatial geometric uncertainty of DIR using statistical sampling techniques that can be applied to the resulting deformation vector fields (DVFs) for a given registration. The proposed DIR performance metric, the distance discordance metric (DDM), is based on the variability in the distance between corresponding voxels from different images, which are co-registered to the same voxel at location (X) in an arbitrarily chosen “reference” image. The DDM value, at location (X) in the reference image, represents the mean dispersion between voxels, when these images are registered to other images in the image set. The method requires at least four registered images to estimate the uncertainty of the DIRs, both for inter-and intra-patient DIR. To validate the proposed method, we generated an image set by deforming a software phantom with known DVFs. The registration error was computed at each voxel in the “reference” phantom and then compared to DDM, inverse consistency error (ICE), and transitivity error (TE) over the entire phantom. The DDM showed a higher Pearson correlation (Rp) with the actual error (Rp ranged from 0.6 to 0.9) in comparison with ICE and TE (Rp ranged from 0.2 to 0.8). In the resulting spatial DDM map, regions with distinct intensity gradients had a lower discordance and therefore, less variability relative to regions with uniform intensity. Subsequently, we applied DDM for intra-patient DIR in an image set of 10 longitudinal computed tomography (CT) scans of one prostate cancer patient and for inter-patient DIR in an image set of 10 planning CT scans of different head and neck cancer patients. For both intra- and inter-patient DIR, the spatial DDM map showed large variation over the volume of interest (the pelvis for the prostate patient and the head for the head and neck patients). The highest discordance was observed in the soft tissues, such as the brain, bladder, and rectum, due to higher variability in the registration. The smallest DDM values were observed in the bony structures in the pelvis and the base of the skull. The proposed metric, DDM, provides a quantitative tool to evaluate the performance of DIR when a set of images is available. Therefore, DDM can be used to estimate and visualize the uncertainty of intra- and/or inter-patient DIR based on the variability of the registration rather than the absolute registration error.
Keywords: Deformable image registration, distance discordance, uncertainty, inaccuracy
1. Introduction
Deformable image registration (DIR) is a key tool in radiation oncology for adaptive radiotherapy, including contour propagation, atlas-based segmentation, and dose accumulation (Wu et al., 2009; Jaffray et al., 2010; Thor et al., 2011; Schwartz et al., 2012). DIR is an ill-posed problem since multiple solutions to the matching process may be found with degenerate objective function values. The resulting deformation vector fields (DVFs) are therefore associated with a level of uncertainty that depends upon the image content (Bernd and Jan, 2008; Sotiras et al., 2013). These uncertainties can often be attributed to a lack of features in relatively homogeneous image regions, misaligned edges in heterogeneous regions, and missing/added tissue after surgery (Hub et al., 2009; Nithiananthan, 2012) and will likely introduce significant errors in dose mapping across a series of images, especially in regions of high-dose gradients (Jaffray et al., 2010; Saleh-Sayah et al., 2011; Salguero et al., 2011; Bender et al., 2012; Murphy et al., 2012; Thor et al., 2013a).
Several similarity metrics, such as the Dice index, Hausdorff distance, and mean surface distance, have been proposed to evaluate the performance of intra- and inter-patient DIR (Dice, 1945; Castadot et al., 2008; Klein et al., 2010; Teguh et al., 2011; Varadhan et al., 2013). However, these metrics often rely on the availability of manually delineated structures and the associated inter- and intra-observer variability (Allozi et al., 2010), rather than being observer-independent measures, which for instance relies on fiducial markers or anatomical landmarks.
To estimate the uncertainties related to DIR in the absence of a ground truth, stochastic approaches using local variations in the image registration or repeated registrations from different starting points have been applied (Hub et al., 2009; Murphy et al., 2012; Hub and Karger, 2013). Other previously investigated approaches using the inverse consistency error (ICE) and transitivity error (TE) metrics have been shown to correlate only weakly with the registration error (Bender and Tomé, 2009; Varadhan et al., 2013). Several statistical methods using iterative or bootstrap techniques have been proposed to estimate the accuracy of the registration for a pair of images (Kybic, 2010; Salguero et al., 2011). These methods however rely on re-sampling from the same image and the potential underlying inconsistency of the DIR algorithm. Altogether, these studies have found that the local variability in the registration is weakly connected to the registration error and is in addition influenced by the DIR algorithm applied and the amount of information available in the images.
In this study, we propose a new approach, which utilizes all DVFs available from multiple DIRs between a series of images in an image set in order to spatially quantify the DIR-related uncertainty. This metric is based on a sampling technique, which assesses the mean distance between voxels from arbitrary images that are registered across a series of images in the image set. The metric is denoted as the distance discordance metric (DDM) and is used as an estimate of the uncertainty of the underlying DIR. We address the implementation of DDM, computational challenges, and some of the metric’s limitations.
2. Materials and methods
2.1 Deformable image registration: Terminology and algorithm
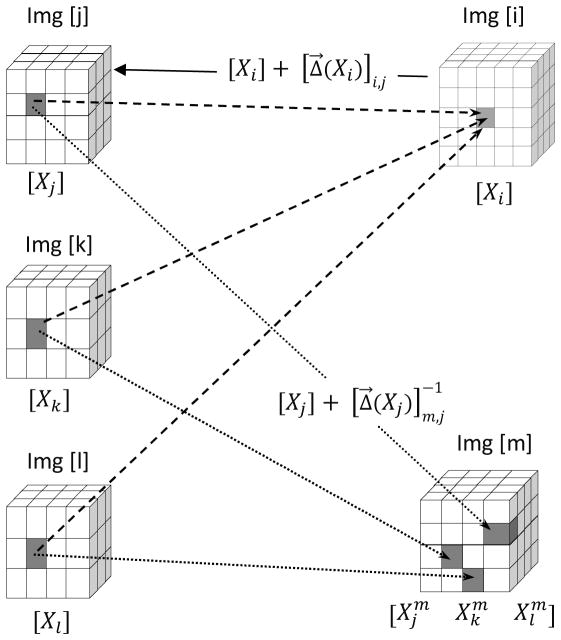
In order to register image [j] to image [i] as shown in figure 1, the task of DIR is to spatially deform image [i], also known as the moving image, in order to match image [j], the fixed image (Klein et al., 2010). Image [j] is referred to as being registered to image [i]. The resulting DVF, denoted as , is the forward transformation which maps voxels that are located in image [i] to their corresponding counterparts in image [j]. In this notation the first subscript indicates the index of the image, which will be used as the reference; the second subscript refers to the index of any arbitrary registered image and X represents the Cartesian coordinate (x, y, z). Therefore the location of the voxel in image [j], which corresponds to the voxel located at Xi in “reference” image [i], can be traced using the formulation
Figure 1.
Schematic diagram to illustrate the DDM concept. Voxels at locations Xj, Xk, Xl in the images [j], [k], and [l] that are co-registered at the same voxel Xi in image [i] (dashed lines) are typically registered at different locations in another image [m] (dotted lines). The mean distances between these voxels correspond to DDM.
In order to track the voxel located at Xj in image [j], when [j] is registered to another reference image [m], we use the inverse deformation vector field
Typically, the forward DVFs are defined on a regular grid on the reference image and usually end up on irregular grid points on the registered image and conversely for the inverse DVFs. Therefore, tracing voxels from the source to target requires interpolation.
For the purpose of this study we used an intensity-based B-Spline DIR algorithm incorporated in Plastimatch (Sharp et al., 2009). Forward registration is performed using B-Spline interpolation. Inverse DVFs are generated by computing a forward transform from the reference coordinate system to the target coordinate system, and then using relaxation to solve the inverse transform that minimizes the mean squared vector difference to reach an approximate inverse DVF. The B-Spline registration algorithm does not guarantee invertible DVFs; however, non-invertible DVFs were not observed in our analysis. Plastimatch also implements a multi-stage framework in order to perform automatic image registration (Shackleford et al., 2012). The first stage consisted of rigid registration (rotation and translation) for image alignment followed by four stages of DIR. At each DIR stage, the grid spacing (mm) for the B-spline control points and the down-sampling resolution (voxels) was varied accordingly. The applied optimization algorithm used at each stage is the so-called ‘L-BFGS-B algorithm’, which is used to solve large-scale optimization problems (Zhu et al., 1997). The objective of the cost function of the DIR was to minimize the mean squared error (MSE) of the voxel intensities between the fixed and moving image. The B-Spline algorithm uses a regularization penalty term (λ) on the bending energy of the DVF to avoid unrealistic deformations.
2.2 The distance discordance metric (DDM)
Consider the situation in figure 1 where we have an image set which consists of five images. Image [j], [k], and [l] are registered to reference image [i]. Consequently, for each voxel located at Xi in image [i], there exist voxels at Xj, Xk, Xl in image [j], [k], and [l] which are co-registered to the same voxel. Theoretically, if the registration is error-free, these co-registered voxels should map to the same location in other images. However, this is rarely the case, and when images [j], [k], and [l] are registered to another reference image [m] in the image set, these voxels would likely be registered at different (yet likely nearby) locations. The level of dispersion among these voxels, which we denote as distance discordance, is a measure of the uncertainty of the registration. DDM is therefore, the mean distance between these points.
The detailed process of computing DDM can be divided into the following steps:
Step 1) First we perform group-wise registration. In this stage all images are registered to each other, which results in a set of forward DVFs and corresponding inverses. This step requires N*(N-1) registrations. Step 2) We now choose an image [i], which will be used as the “fixed” reference to evaluate our metric. For each voxel located at Xi in image [i], we find the location of the corresponding voxels Xj, Xk, Xl in the registered images [j], [k], and [l] using the forward DVFs indicated by a solid arrow in figure 1. Step 3) By means of the inverse DVFs, we trace the voxels located at Xj, Xk, Xl in [j], [k], and [l] to their locations in another reference image [m]. The superscript is used to indicate the index of the new reference image. Step 4) Finally we calculate the distance discordance (DD), which represents the difference between these points on reference image [m]:
The total number of DD combinations between these points would be (N-2)*(N-3)/2. All images are permutated while the reference image [i] remains fixed. The total number of permutations for a fixed reference [i] and arbitrary reference [m] in a set of N images would be (N-1). Therefore, the total number of DD values, which correspond to location Xi in image [i] will be:
Ultimately the mean of the distance discordance, DDM(Xi) is evaluated:
2.3 Error analysis
We calculated the mean local registration error based on the difference between the known DVFs and the DVFs obtained from the B-Spline registration at each voxel location Xi in the non-deformed reference image for all registrations.
In order to compare DDM to other metrics, we applied two additional metrics (inverse consistency (ICE) and transitivity (TE) error), which have previously been widely used to evaluate DIR performance (Christensen and Johnson, 2003; Bender and Tomé, 2009; Varadhan et al., 2013). Similarly, we calculated the mean ICE and TE metrics at each location Xi in the reference phantom in order to perform a direct comparison with DDM and registration error.
2.4. Evaluation of DDM
2.4.1 Phantom studies
To demonstrate and validate the proposed method, we generated a set of simulated phantom images with known ground truth DVFs as shown in figure 2. The non-deformed “reference” image in figure 2A comprises a high-intensity cube in the center, surrounded by a spatial checkerboard pattern, which is in turn surrounded by a narrow low intensity layer at the image boundaries. This black layer is similar to the air surrounding the body image on a typical CT scan. The phantom consists of 128×128×128 voxels (1 mm each) with a checkerboard pattern of 15×15×15 voxels while the central cube is 20×20×20 voxels in dimensions. In order to simulate volume changes such as growth and shrinkage, known DVFs corresponding to different isotropic expansion and contraction of the central cube were applied to the non-deformed image as shown in figures 2B and 2C. These DVFs are smooth, and their magnitude decreases near the boundaries of the image. In total six deformed instances of the phantom were generated which corresponds to three expansions and three contractions of 5, 10, and 15% each.
Figure 2.
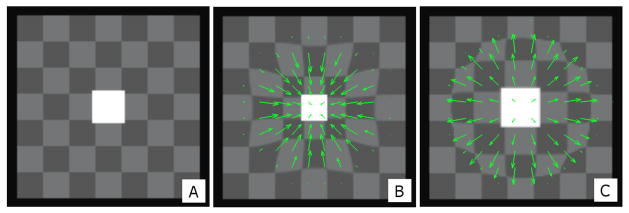
(A) The non-deformed “reference” software phantom consisting of a checkerboard pattern with a high-intensity cube object at the center. (B) Deformation corresponding to 15% contraction of the central cube. (C) Deformation corresponding to 15% expansion of the central cube. The DVFs represented by green arrows are scaled for illustration purposes.
2.4.2 Intra-patient DIR
In order to evaluate DDM for intra-patient DIR, we used an image set of 10 longitudinal CT scans of a patient previously treated with intensity-modulated radiotherapy for prostate cancer at Haukeland University Hospital, Bergen, Norway (Thor et al., 2013b). The initial planning CT, with a resolution of 1 × 1 × 3 mm3, was acquired in supine position with contrast in the bladder. The patient was CT-scanned twice weekly over the RT course in the same position but without any contrast in the bladder. To evaluate DDM for intra-patient DIR, we used the CT scan during the first week of treatment as our reference (scan-1). The DIR between different CT scans was performed over the entire volume. However, due to computational time and computer memory limitations, we computed DDM only over the key volume of interest (VOI), which encompassed the rectum, the prostate, and the bladder.
2.4.3 Inter-patient DIR
For inter-patient DIR, we used the planning CT scan for each of 10 head and neck cancer patients, treated at Memorial Sloan-Kettering Cancer Center, NY (Setton et al., 2012). These patients were scanned in supine position with either a 3- or 5-point mask for immobilization. Patients were scanned, with moderate neck extension, from the top of the skull to below the mediastinum with a resolution of 1×1×3 mm3. Similarly as for the intra-patient DIR, the entire CT scan volume was registered and DDM was computed only for the head region (DD-VOI), which encompassed the region from top of skull to the mandible including the relevant organs at risk such as the brainstem and parotid glands.
3. Results
3.1 Phantom studies
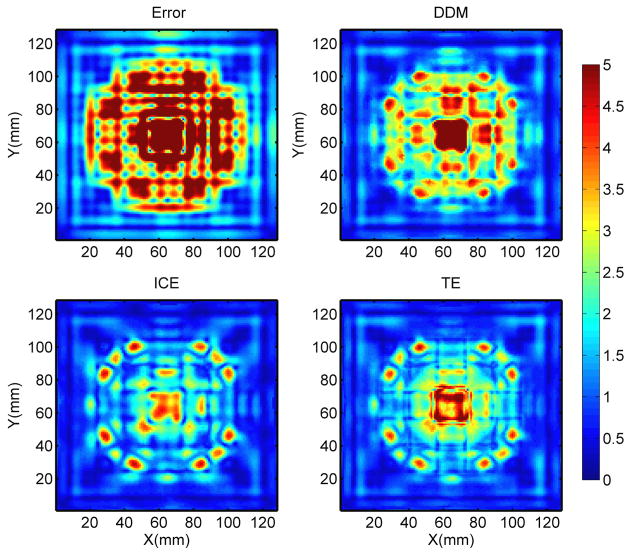
The error map in figure 3 (upper left) shows large variation in the registration errors across the phantom. Larger errors are observed near the center in the homogeneous region inside the center of the cube and the checkerboard pattern. Meanwhile, regions of high contrast near the edges and the corners of the cubes have the smallest errors. Figure 3 also shows that among all three investigated metrics, the DDM map agreed the most to the actual registration error map.
Figure 3.
Color wash representation of, from upper left to lower right, the absolute registration error, DDM, ICE and TE on an axial slice. The DDM map clearly shows a more similar pattern to the actual error map. The X and Y represent the pixel location. The color bar units are in mm.
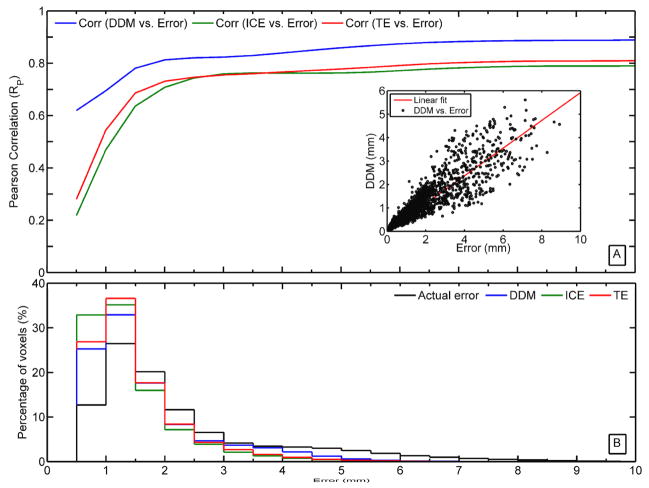
Since the registration error, DDM, ICE, and TE are known at each voxel in the entire phantom, we performed a voxel-by-voxel Pearson correlation (Rp) between these three metrics and the registration error for different thresholds (Error < Threshold). Figure 4A clearly shows that DDM is highly correlated with the registration error (Rp ranged from 0.6 to 0.9). Meanwhile, there is a poor correlation between the registration error and consistency metrics (ICE and TE) especially for errors < 1 mm (Rp ranged from 0.2 to 0.7), which is on the scale of one voxel dimension. This is also reflected in the distributions between the registration error and DDM as shown in figure 4B. In addition a linear relationship was identified between DDM and the registration error as indicated by the linear fit (red line: linearity coefficient=0.6; R2=0.76) in the inset in figure 4A. The results in figures 3 and 4 correspond to the DIRs performed without regularization. Applying a regularization parameter (λ=0.01) to the DIRs resulted in an overall reduction in the range of all metrics. Nonetheless, the correlation with the registration error remained significantly higher with DDM (Rp > 0.7), while reduced with the ICE and the TE (Rp < 0.5).
Figure 4.
(A) The correlation between DDM, ICE, TE, and absolute registration error. The inset is a scatter plot and linear fit between DDM and registration error. (B) The voxel distribution for the registration error, DDM, ICE, and TE over the entire voxel space of the reference phantom.
3.2 Intra-patient DIR
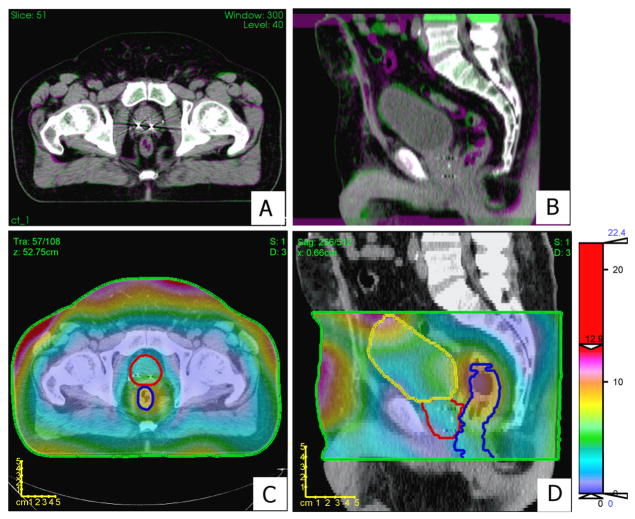
A representative intra-patient DIR, more specifically when registering scan-9 to scan-1, is shown in figures 5A and 5B. DDM was computed on reference scan-1 over the selected VOI, which encompassed the bladder, the rectum and the prostate as shown in figures 5C and 5D. The performance of the DIR was found to be accurate in the muscles and bones whereas less accurate within the rectum and the bladder. Regions with the highest discordance were located on the boundary near the skin area and regions of soft tissues such as the rectum and the bladder. Bones and, less pronounced, muscles, showed the smallest DDM values.
Figure 5.
Panels A and B show an axial and sagittal view, respectively, of the intra-patient DIR of scan-9 on the reference image (scan-1). Green or red-violet indicates inconsistency in the registration between the images. Panels C and D show a color wash representation of DDM (mm) superimposed over an axial slice and a sagittal slice, respectively, on scan-1. The color bar is scaled to emphasize DDM values in the prostate region. Contours are shown for the rectum (blue), prostate (red), bladder (yellow), and DDM-VOI (green).
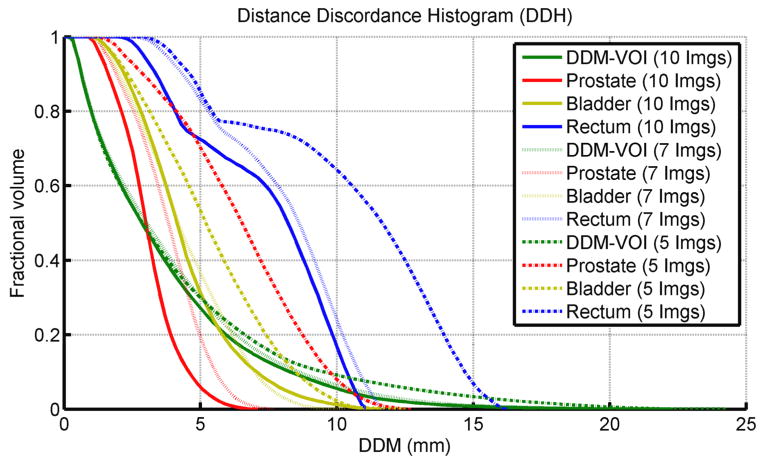
The cumulative distance discordance histogram (DDH) – similarly to the concept of a dose/volume histogram – is shown in figure 6. DDM was computed on each voxel on reference CT scan-1 using the first 5, 7, and all 10 scans (including scan-1). The histogram, for the full image set (solid line), shows that 20% of the DDM-VOI had a DDM > 6 mm (max = 25 mm). It also shows that 80% of voxels in the rectum had a DDM value > 4 mm (max = 8 mm). Meanwhile, the prostate had a moderately high DDM value < 4 mm and the bladder had a max DDM of 12 mm. The DDH of the rectum also reveals more variation over the course of treatment (using 5, 7 and 10 scans) and this is also reflected on the registration of the prostate while the registration in the bladder remained relatively consistent.
Figure 6.
The cumulative DDH calculated for different organs in the pelvic region for the intra-patient DIRs. DDM was computed using the first 5 (dashed), 7 (dotted), and 10 (solid) scans in the image set.
3.3 Inter-patient DIR
The DDM map shown in figure 7, computed on an arbitrarily chosen reference patient, shows the lowest DDM values (< 3 mm) in the bony structures along the cervical vertebrae and base of the skull. However, regions of soft tissue in the brain as well as in the mandible displayed higher discordance (> 6 mm).
Figure 7.
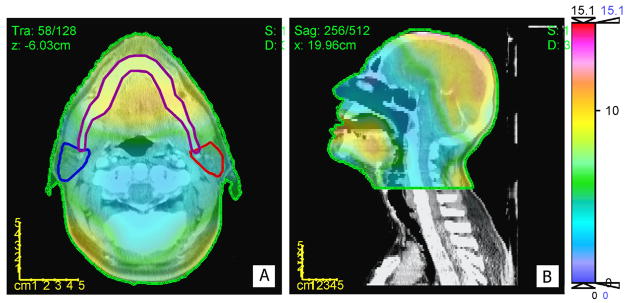
A color wash representation of DDM for inter-patient DIRs superimposed over an axial slice (A) and a sagittal slice (B). The color bar units are in mm.
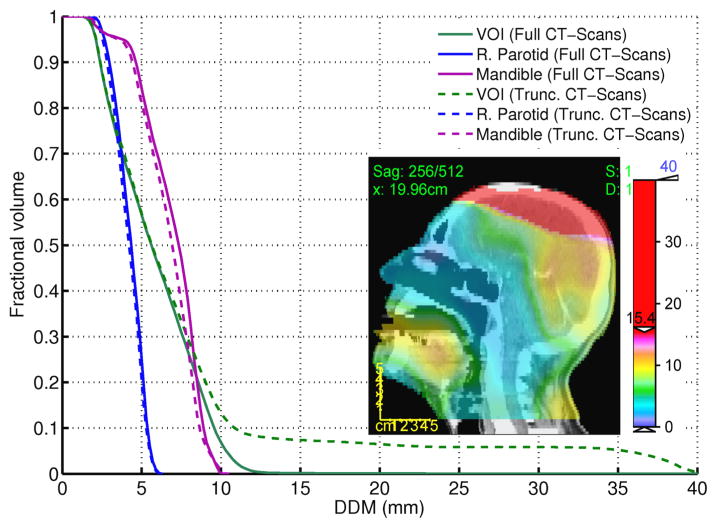
For demonstration purposes, we replaced one of the patients, with full CT scan, by another one with truncated CT scan (Top of the skull), to study the influence on DDM. The cumulative DDH in figure 8 for the VOI shows a long tail which corresponds to the high DDM values due to large disagreement in the registration near the top of the skull (also highlighted in the inset figure). Meanwhile, this did not influence the results for other organs (The Mandible and the right parotid) and their DDHs did not vary considerably as indicated in figure 8.
Figure 8.
The cumulative histogram of DDM for inter-patient DIRs in the head and neck region for two different scenarios (full (solid line) vs. truncated (dashed line) CT scan). The inset highlights the high DDM values near the top of the skull due to poor registration.
4. Discussion
The proposed distance discordance metric (DDM) provides an estimate of the uncertainty of DIR based on registration variability. Although this metric requires four or more images, it can be used to estimate the performance of DIRs, both for inter- and intra-patient DIR purposes, and does not require manual delineation of landmarks or structures.
The results of the DIRs in the software phantom revealed a large variation in the registration error. Large errors were observed in the regions of large deformations near the center and in regions of uniform intensities. Meanwhile, smaller errors were observed in regions of small deformations and high contrast, such as edges and corners. Evaluation of DDM in the software phantom showed a much similar pattern to the registration errors for this particular phantom and DIR. The results also showed a higher correlation between the registration error and DDM in comparison to ICE and TE, which have been widely used in the literature to evaluate DIR uncertainties. There is also a linear relationship between the registration error and DDM, although DDM tends to underestimate the actual error (linearity coefficient = 0.6).
For intra-patient DIR, the DDM metric quantified the DIR variability in different regions of the pelvis. Regions of bony anatomy and surrounding muscles, where registration is expected to perform well due to high-intensity gradients, yielded the lowest DDM values (< 2 mm). On the other hand, regions with more variable intensity information, such as the rectum and the bladder, had higher DDM values. These patterns are similar to previous findings of DIR in the pelvic region (Brock and Consortium, 2010; Jonsson et al., 2011). Including more images did not influence the overall pattern but tended to reduce DDM value. The results of DDM, which included 5, 7, or 10 scans at different time points, also revealed the influence of anatomic variation due to changes in volume of individual organs, such as in the case with the bladder and rectum. The variations were more pronounced in the rectum, likely due to the more irregular motion patterns (presence/absence of air), as compared to the bladder. These variations become less evident over the entire DD-VOI, where the contrast does not vary widely and the entire volume is dominated by bone and muscles.
Evaluating the performance for inter-patient DIR is more challenging. On average, more pronounced uncertainties are expected for inter- vs. intra-patient DIR, where the anatomical variations are larger due to differences in the anatomy across patients (Klein et al., 2010; Dréan et al., 2012; Hardcastle et al., 2012; Daisne and Blumhofer, 2013). This was also illustrated in our study by higher DDM values especially in the mandible and brain. DDM had the lowest values in the bony structures near the base of the skull, whereas the performance of the DIR was challenged in the mandible region due to the presence of dental artifacts. The choice of different reference images to generate DDM yields similar results for comparable images in an image set (results not shown). However, the metric was able to detect regions of poor registrations, as was shown in the case of the truncated CT scan.
In addition to spatial maps, DDM can also be displayed as a cumulative histogram. The DDH inevitably varies depending on the choice of initial reference image. The goal is to choose a reference image in an image set that produces the lowest DDM values. Based on histogram characteristics (e.g., mean, variance, skewness), it should be feasible to exclude certain images or set a confidence level that is based on the accuracy of registration in regions of high discordance. We demonstrated this idea for inter-patient DIR by including a truncated CT scan for a head and neck patient in the registration. DDM can also be applied to DIRs across different image modalities (e.g. magnetic resonance imaging, ultrasound), since it inherently only relies on the resulting DVFs. For practical purposes, we used CT images to demonstrate the application of the proposed metric due to availability of the CT data and the present maturity of the DIR algorithms.
Furthermore, DDM could potentially also be utilized to achieve a more accurate accumulated dose on a reference planning CT, with some level of uncertainty, which is an important step in adaptive radiotherapy (Jaffray et al., 2010). This also becomes equally important for deforming patient data on a template in order to perform voxel-wise analysis of normal tissue complication probability or tumor control probability (Witte et al., 2010; Acosta et al., 2013; Thor et al., 2013b; Heemsbergen et al., 2010). In order to accumulate dose (D) at a location X in a reference image (ref) from another source image (src), the corresponding vector field, which points to the location in the source image , is perturbed by a certain value that corresponds to the DD value at X. Using a bootstrap technique, we can resample from the DD(X) distribution to generate a distribution of doses and then take the mean of this distribution as shown in the equation below.
In principle, for a given reference image, low mean values for DDM indicate accurate registration with other images; in contrast, high mean values would indicate relatively poor registration. However, this metric is susceptible to systematic failure in the registration due to lack of intensity information in the underlying images. Under those circumstances, one should be cautious and visually inspect the image difference of the resulting DIR, as in common practice. Reliance on multiple registrations among different image pairs in the image set and using different references might help to avoid the problem. We also note that numerical errors from the computation of the inverse DVFs and from interpolation between irregular grid points might contribute to the overall uncertainties in DDM evaluation. However, we expect the magnitude of these errors to be small (less than a voxel size).
One of the limitations of our method is that it requires at least four images in order to compute DDM, in contrast to two images required for ICE and three images for TE. The availability of more images might reveal the daily variations in the registration for different organs due to volumetric changes and increase the level of confidence of the DDM. However, since daily image acquisition is not yet the clinical standard at all institutions, DDM could be pre-computed on a set of patients with repeat scans. These “pseudo” DDM maps could then be deformed onto new patient scans and serve as a priori information of the uncertainties related to DIR. We also acknowledge that the generation of DDM requires the deformation of each image onto every other image in the image set, which is computationally time consuming. This process can likely be accelerated by utilizing parallel processing on general-purpose graphical processing units, which would allow DDM to be computed over the entire volume in a short amount of time, making it potentially useful for real-time clinical applications.
5. Conclusions
We have proposed a new metric, DDM, which estimates the magnitude of spatial uncertainty of a DIR on a point-by-point basis. The proposed metric showed higher Pearson correlation with the actual registration error, as compared to the corresponding correlation with other commonly used metrics (i.e., ICE and TE). In contrast to previously proposed metrics to estimate registration uncertainties, this metric does not rely on a ‘ground truth.’ It quantitatively estimates the DIR- related uncertainty based on reproducibility, rather than absolute registration error, which likely differs from the uncertainty of the registration algorithm for a given dataset. A limitation of DDM is that it requires multiple samples of the images to be registered. We have shown that DDM provides an intuitive and quantitative tool for evaluating uncertainty related to intra- and inter-patient DIR. The DDM could possibly be extended to set an uncertainty level for dose accumulation on a representative CT scan (e.g., the planning CT).
Acknowledgments
The authors would like to thank Per Munck af Rosenschold from the Department of Radiation Oncology at Rigshospitalet for valuable comments on the initial manuscript during his visit to MSKCC. This research was partially supported by NIH Grant R01 CA85181.
Footnotes
Conflict of interest: none
References
- Acosta O, Drean G, Ospina JD, Simon A, Haigron P, Lafond C, de Crevoisier R. Voxel-based population analysis for correlating local dose and rectal toxicity in prostate cancer radiotherapy. Phys Med Biol. 2013;58:2581–95. doi: 10.1088/0031-9155/58/8/2581. [DOI] [PMC free article] [PubMed] [Google Scholar]
- Allozi R, Li XA, White J, Apte A, Tai A, Michalski JM, Bosch WR, El Naqa I. Tools for consensus analysis of experts’ contours for radiotherapy structure definitions. Radiother Oncol. 2010;97:572–8. doi: 10.1016/j.radonc.2010.06.009. [DOI] [PMC free article] [PubMed] [Google Scholar]
- Bender ET, Hardcastle N, Tomé WA. On the dosimetric effect and reduction of inverse consistency and transitivity errors in deformable image registration for dose accumulation. Med Phys. 2012;39:272. doi: 10.1118/1.3666948. [DOI] [PubMed] [Google Scholar]
- Bender ET, Tomé WA. The utilization of consistency metrics for error analysis in deformable image registration. Phys Med Biol. 2009;54:5561–77. doi: 10.1088/0031-9155/54/18/014. [DOI] [PMC free article] [PubMed] [Google Scholar]
- Bernd F, Jan M. Ill-posed medicine—an introduction to image registration. IOP SCIENCE 2008 [Google Scholar]
- Brock KK Consortium DRA. Results of a multi-institution deformable registration accuracy study (MIDRAS) Int J Radiat Oncol Biol Phys. 2010;76:583–96. doi: 10.1016/j.ijrobp.2009.06.031. [DOI] [PubMed] [Google Scholar]
- Castadot P, Lee JA, Parraga A, Geets X, Macq B, Grégoire V. Comparison of 12 deformable registration strategies in adaptive radiation therapy for the treatment of head and neck tumors. Radiother Oncol. 2008;89:1–12. doi: 10.1016/j.radonc.2008.04.010. [DOI] [PubMed] [Google Scholar]
- Christensen GE, Johnson HJ. Invertibility and transitivity analysis for nonrigid image registration. Journal of Electronic Imaging. 2003;12:106–17. [Google Scholar]
- Daisne JF, Blumhofer A. Atlas-based automatic segmentation of head and neck organs at risk and nodal target volumes: a clinical validation. Radiat Oncol. 2013;8:154. doi: 10.1186/1748-717X-8-154. [DOI] [PMC free article] [PubMed] [Google Scholar]
- Dice LR. Measures of the amount of ecologic association between species. Ecology. 1945;26:297–302. [Google Scholar]
- Dréan G, Oscar A, Antoine S, Renaud DC, Pascal H. Inter-individual organ-driven CT registration for dose mapping in prostate cancer radiotherapy (International Symposium on Biomedical Imaging) 2012 [Google Scholar]
- Hardcastle N, Tomé WA, Cannon DM, Brouwer CL, Wittendorp PW, Dogan N, Guckenberger M, Allaire S, Mallya Y, Kumar P, Oechsner M, Richter A, Song S, Myers M, Polat B, Bzdusek K. A multi-institution evaluation of deformable image registration algorithms for automatic organ delineation in adaptive head and neck radiotherapy. Radiat Oncol. 2012;7:90. doi: 10.1186/1748-717X-7-90. [DOI] [PMC free article] [PubMed] [Google Scholar]
- Heemsbergen WD, Al-Mamgani A, Witte MG, van Herk M, Pos FJ, Lebesque JV. Urinary obstruction in prostate cancer patients from the Dutch trial (68 Gy vs. 78 Gy) relationships with local dose, acute effects. Int J Radiat Oncol Biol Phys. 2010;78:19–25. doi: 10.1016/j.ijrobp.2009.07.1680. [DOI] [PubMed] [Google Scholar]
- Hub M, Karger CP. Estimation of the uncertainty of elastic image registration with the demons algorithm. Phys Med Biol. 2013;58:3023–36. doi: 10.1088/0031-9155/58/9/3023. [DOI] [PubMed] [Google Scholar]
- Hub M, Kessler ML, Karger CP. A Stochastic Approach to Estimate the Uncertainty Involved in B-Spline Image Registration. Medical Imaging, IEEE Transactions. 2009;28(11):0278–062. doi: 10.1109/TMI.2009.2021063. [DOI] [PubMed] [Google Scholar]
- Jaffray DA, Lindsay PE, Brock KK, Deasy JO, Tomé WA. Accurate accumulation of dose for improved understanding of radiation effects in normal tissue. Int J Radiat Oncol Biol Phys. 2010;76:S135–9. doi: 10.1016/j.ijrobp.2009.06.093. [DOI] [PMC free article] [PubMed] [Google Scholar]
- Jonsson JH, Brynolfsson P, Garpebring A, Karlsson M, Söderström K, Nyholm T. Registration accuracy for MR images of the prostate using a subvolume based registration protocol. Radiat Oncol. 2011;6:73. doi: 10.1186/1748-717X-6-73. [DOI] [PMC free article] [PubMed] [Google Scholar]
- Klein S, Staring M, Murphy K, Viergever MA, Pluim JP. elastix: a toolbox for intensity-based medical image registration. IEEE Trans Med Imaging. 2010;29:196–205. doi: 10.1109/TMI.2009.2035616. [DOI] [PubMed] [Google Scholar]
- Kybic J. Bootstrap resampling for image registration uncertainty estimation without ground truth. IEEE Trans Image Process. 2010;19:64–73. doi: 10.1109/TIP.2009.2030955. [DOI] [PubMed] [Google Scholar]
- Murphy MJ, Salguero FJ, Siebers JV, Staub D, Vaman C. A method to estimate the effect of deformable image registration uncertainties on daily dose mapping. Med Phys. 2012;39:573–80. doi: 10.1118/1.3673772. [DOI] [PMC free article] [PubMed] [Google Scholar]
- Nithiananthan S. Extra-dimensional Demons: A method for incorporating missing tissue in deformable image registration. Med Phys. 2012;39:5718. doi: 10.1118/1.4747270. [DOI] [PMC free article] [PubMed] [Google Scholar]
- Saleh-Sayah NK, Weiss E, Salguero FJ, Siebers JV. A distance to dose difference tool for estimating the required spatial accuracy of a displacement vector field. Med Phys. 2011;38:2318–23. doi: 10.1118/1.3572228. [DOI] [PMC free article] [PubMed] [Google Scholar]
- Salguero FJ, Saleh-Sayah NK, Yan C, Siebers JV. Estimation of three-dimensional intrinsic dosimetric uncertainties resulting from using deformable image registration for dose mapping. Med Phys. 2011;38:343–53. doi: 10.1118/1.3528201. [DOI] [PMC free article] [PubMed] [Google Scholar]
- Schwartz DL, Garden AS, Thomas J, Chen Y, Zhang Y, Lewin J, Chambers MS, Dong L. Adaptive Radiotherapy for Head-and-Neck Cancer: Initial Clinical Outcomes From a Prospective Trial. Int J Radiat Oncol Biol Phys. 2012;83:986–93. doi: 10.1016/j.ijrobp.2011.08.017. [DOI] [PMC free article] [PubMed] [Google Scholar]
- Setton J, Caria N, Romanyshyn J, Koutcher L, Wolden SL, Zelefsky MJ, Rowan N, Sherman EJ, Fury MG, Pfister DG, Wong RJ, Shah JP, Kraus DH, Shi W, Zhang Z, Schupak KD, Gelblum DY, Rao SD, Lee NY. Intensity-modulated radiotherapy in the treatment of oropharyngeal cancer: an update of the Memorial Sloan-Kettering Cancer Center experience. Int J Radiat Oncol Biol Phys. 2012;82:291–8. doi: 10.1016/j.ijrobp.2010.10.041. [DOI] [PubMed] [Google Scholar]
- Shackleford JA, Shusharina N, Verberg J, Warmerdam G, Winey B, Neuner M, Steininger P, AmeliaArbisser Golland P, Lou Y, Paganelli C, Peroni M, Riboldi M, Baroni G, Zano P, Spadea MF, Apte A, Saleh Z, Deasy JO, Mori S, Kandasamy N, Sharp GC. Plastimatch 1.6 – Design, Architecture, and Future Directions. MICCAI Workshop 2012 [Google Scholar]
- Sharp G, Li R, Wolfgang J, Chen G, Peroni M, Spadea M, Mori S, Zhang J, Shackleford J, Kandasamy N. Plastimatch – An Open Source Software Suite for Radiotherapy Image Processing. Computer Engineering 2009 [Google Scholar]
- Sotiras A, Bavatzikos C, Paragios N. Deformable Medical Image Registration: A Survey. Medical Imaging, IEEE Transactions. 2013 doi: 10.1109/TMI.2013.2265603. [DOI] [PMC free article] [PubMed] [Google Scholar]
- Teguh DN, Levendag PC, Voet PW, Al-Mamgani A, Han X, Wolf TK, Hibbard LS, Nowak P, Akhiat H, Dirkx ML, Heijmen BJ, Hoogeman MS. Clinical validation of atlas-based auto-segmentation of multiple target volumes and normal tissue (swallowing/mastication) structures in the head and neck. Int J Radiat Oncol Biol Phys. 2011;81:950–7. doi: 10.1016/j.ijrobp.2010.07.009. [DOI] [PubMed] [Google Scholar]
- Thor M, Apte A, Deasy JO, Muren LP. Statistical simulations to estimate motion-inclusive dose-volume histograms for prediction of rectal morbidity following radiotherapy. Acta Oncol. 2013a;52:666–75. doi: 10.3109/0284186X.2012.720382. [DOI] [PMC free article] [PubMed] [Google Scholar]
- Thor M, Bentzen L, Hysing LB, Ekanger C, Helle SI, Karlsdóttir A, Muren LP. Prediction of rectum and bladder morbidity following radiotherapy of prostate cancer based on motion-inclusive dose distributions. Radiother Oncol. 2013b;107:147–52. doi: 10.1016/j.radonc.2013.03.029. [DOI] [PubMed] [Google Scholar]
- Thor M, Petersen JB, Bentzen L, Høyer M, Muren LP. Deformable image registration for contour propagation from CT to cone-beam CT scans in radiotherapy of prostate cancer. Acta Oncol. 2011;50:918–25. doi: 10.3109/0284186X.2011.577806. [DOI] [PubMed] [Google Scholar]
- Varadhan R, Karangelis G, Krishnan K, Hui S. A framework for deformable image registration validation in radiotherapy clinical applications. J Appl Clin Med Phys. 2013;14:4066. doi: 10.1120/jacmp.v14i1.4066. [DOI] [PMC free article] [PubMed] [Google Scholar]
- Witte MG, Heemsbergen WD, Bohoslavsky R, Pos FJ, Al-Mamgani A, Lebesque JV, van Herk M. Relating dose outside the prostate with freedom from failure in the Dutch trial 68 Gy vs. 78 Gy. Int J Radiat Oncol Biol Phys. 2010;77:131–8. doi: 10.1016/j.ijrobp.2009.04.040. [DOI] [PubMed] [Google Scholar]
- Wu Q, Chi Y, Chen PY, Krauss DJ, Yan D, Martinez A. Adaptive replanning strategies accounting for shrinkage in head and neck IMRT. Int J Radiat Oncol Biol Phys. 2009;75:924–32. doi: 10.1016/j.ijrobp.2009.04.047. [DOI] [PubMed] [Google Scholar]
- Zhu C, Byrd RH, Lu P, Nocedal J. L-BFGS-B: Fortran subroutines for large-scale bound-constrained optimization. ACM. 1997:550–60. [Google Scholar]


