Abstract
Prosthetic devices are being developed to restore movement for motor-impaired individuals. A robotic arm can be controlled based on models that relate motor-cortical ensemble activity to kinematic parameters. The models are typically built and validated on data from structured trial periods during which a subject actively performs specific movements, but real-world prosthetic devices will need to operate correctly during rest periods as well. To develop a model of motor cortical modulation during rest, we trained monkeys (Macaca mulatta) to perform a reaching task with their own arm while recording motor-cortical single-unit activity. When a monkey spontaneously put its arm down to rest between trials, our traditional movement decoder produced a nonzero velocity prediction, which would cause undesired motion when applied to a prosthetic arm. During these rest periods, a marked shift was found in individual units' tuning functions. The activity pattern of the whole population during rest (Idle state) was highly distinct from that during reaching movements (Active state), allowing us to predict arm resting from instantaneous firing rates with 98% accuracy using a simple classifier. By cascading this state classifier and the movement decoder, we were able to predict zero velocity correctly, which would avoid undesired motion in a prosthetic application. Interestingly, firing rates during hold periods followed the Active pattern even though hold kinematics were similar to those during rest with near-zero velocity. These findings expand our concept of motor-cortical function by showing that population activity reflects behavioral context in addition to the direct parameters of the movement itself.
Keywords: arm relaxation, brain-computer interface, idle state, motor control, motor cortex, resting
Introduction
The role of cortical neurons in arm control has been studied extensively, and the motor cortex in particular has been implicated as a key area involved in volitional movement (Phillips and Porter, 1977; Porter and Lemon, 1993; Georgopoulos, 1996, 2000; Kalaska, 2009). Since the earliest single-unit recordings in awake, behaving monkeys established a link between voluntary arm movement and motor cortical firing (Evarts, 1966, 1968), a variety of specific models have been proposed, including the seminal finding of directional tuning (Georgopoulos et al., 1982, 1988), followed by refined models that include hand speed, velocity, and position (Kettner et al., 1988; Moran and Schwartz, 1999; Wang et al., 2007); movement fragments (Hatsopoulos et al., 2007; Hatsopoulos and Amit, 2012); joint torques (Herter et al., 2009; Fagg et al., 2009); endpoint force (Ashe, 1997; Gupta and Ashe, 2009); or muscle activity (Cherian et al., 2011). With the advent of chronic recording arrays capable of recording many individual units simultaneously, these models have been implemented in real time to control computer cursors, robotic arms, or functional electrical stimulation devices, all with the goal of developing neural prosthetic devices to restore movement ability to paralyzed individuals and amputees (Schwartz, 2004; Schwartz et al., 2006; Hatsopoulos and Donoghue, 2009; Lebedev et al., 2011). Ongoing work is delivering ever higher performance in terms of speed, accuracy, and the number of decoded degrees of freedom. A common theme in prior studies, however, is that cortical activity has only been studied during controlled trial periods during which subjects performed specific trained behaviors on cue. Little is known about how the existing models would behave outside of the controlled trial periods because intertrial (IT) data have previously been dismissed as irrelevant, discarded due to storage constraints, or considered intractable to analyze because the subject's behavior was unconstrained. However, if a person is to use a cortical prosthesis in the real world, the neural decoder must function appropriately at all times, not just during controlled “trial” periods. Here, we investigate whether tuning models and decoders calibrated during reaching movements are valid during IT periods. We show that the models are generally accurate during both within-trial and IT periods, but not when the monkey rests its arm. This has direct implications for neural prostheses, because a prosthetic arm should not only perform intended movements, but should also not perform unintended movements when a user wants to rest the arm (Mirabella, 2012).
Materials and Methods
Subjects and design
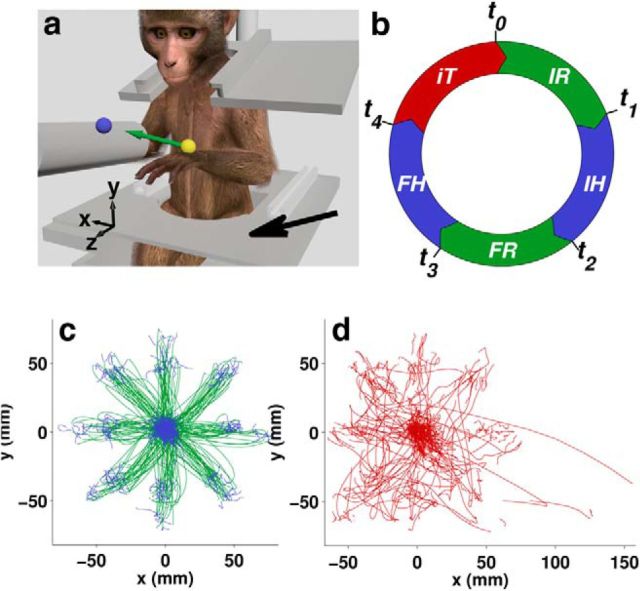
Two male monkeys (Macaca mulatta) each performed a 3D point-to-point reaching task with its arm (Fig. 1; Reina et al., 2001; Taylor et al., 2002) while hand position was tracked optically and single-unit neural activity recorded using multielectrode arrays. Monkey F performed a 26-target center-out and out-center task and Monkey C performed a center-out only task. In addition, electromyographic (EMG) activity was recorded from Monkey C. Decoding analysis was performed offline.
Figure 1.
Center-out/out-center reaching task. a, Monkey moved a cursor (yellow ball), controlled by an optical marker on the hand, to hit a target (blue ball) in a virtual environment. Occasionally, between trials, the monkey would spontaneously rest its hand on the lap plate (black arrow). b, Continuous trial timeline, consisting of IR, IH, FR, FH, and IT, and then starting over from IR again. The color code defined by this diagram is used to indicate the respective task periods throughout all figures, unless otherwise indicated. The two Reach periods are the same color and so are the two Hold periods, because these periods are pooled in the subsequent analyses. c, Hand trajectories from successful trial periods (IH thru FH), and d, IT periods for one entire Monkey F session, color coded by task period. The hand trajectories were in 3D space, but only projections onto the x–y plane are shown.
Behavioral paradigm
Each monkey viewed a 3D virtual environment through a stereoscopic display (Fig. 1a). The position of an optical marker on the left hand was mapped to the position of a spherical cursor (6 mm in one Monkey C session, 8 mm in all other sessions). The animals were operantly conditioned to perform reach-to-target movements. Each trial started with the presentation of an initial spherical target (same size as cursor) at time t0. The monkey would then move the cursor to overlap the target (Initial Reach [IR] period). A hold at this target (Initial Hold [IH] period) started at time t1. At time t2, the initial target was removed and a second, final target displayed. The monkey would then move the cursor to this second target (Final Reach [FR] period). The monkey held the cursor at the final target (Final Hold [FH]) starting at time t3 and ending at t4. Upon successful completion of FH, the monkey received a liquid reward. If FR was not completed within the allowed time (1.0 s in one Monkey C session, 0.8 s in the other Monkey C session, and in all Monkey F sessions) or the cursor was not held at the target long enough during either of the hold periods, then the trial failed. The minimum required hold time for each trial was randomly chosen from an interval (Monkey F: 0.39–0.61 s for IH, 0.40–0.60 s for FH; Monkey C: 0.21–0.60 s for IH, 0.19–0.32 s for FH). Regardless of success, each trial was followed by an IT period before the beginning of the next trial. The sequence of task periods is depicted in Figure 1b as a circular timeline to emphasize the continuity from one trial to the next, because all time periods were included in analysis. For Monkey C, the initial target (for IR and IH) was at the center of the workspace and the final target (for FR and FH) for each trial was chosen from a set of 26 equidistant locations, 78 mm from center (8 in the direction of the corners of an imaginary cube centered in the workspace, 12 in the direction of the middle of each edge, and 6 in the direction of the middle of each face). For Monkey F, the target sequence for each trial was chosen from a set of 52 (initial center target to final at one of the 26 outer locations or initial at one of the outer locations to final at the center) and the distance between center and outer targets was 66 mm.
Neural recordings
Single-unit activity was recorded using chronically implanted silicon microelectrode arrays (Blackrock Microsystems). Each array had 1.5 mm electrode shanks arranged in a 10 × 10 grid. Ninety-six of the 100 electrodes were wired for recording. Each monkey had one array in the right hemisphere of primary motor cortex arm area. Monkey F had an additional array in the ventral premotor cortex, but data from this array were not used in the analysis and will be reported elsewhere. Single-unit spike waveforms were acquired using a 96-channel Plexon MAP system. Spikes were manually sorted at the beginning of each recording day using the SortClient in Plexon's RASPUTIN software. For Monkey F, the spike waveforms were later resorted using Plexon's offline sorter.
Hand tracking
An infrared marker on the back of the left hand was tracked using an Optotrak 3020 optical tracking system (Northern Digital) at a frame rate of 60 Hz synchronized to the graphical display frames. The 3D marker position was used in real time to drive the cursor in the 3D graphical display.
EMG data
EMG was recorded from Monkey C only. Surface EMG measurements were amplified using an Octopus AMT-8 EMG system (10–1000 Hz band pass; Bortec Biomedical) and sampled at 2 kHz with an ADLink DAQ-2208 data acquisition card. Before each daily session, up to seven pediatric electrodes (Vermed) were affixed to the monkey's upper limb. Electrode placement could vary substantially from day to day, so channel characteristics were typically evaluated during short periods of instructed reaching movement before each experimental session. Channels with poor signals or obvious movement artifacts were discarded. Of the EMG data collected in 1 d and used in the analysis, signals from 5 of the 7 EMG channels were deemed acceptable. The electrodes of these five channels were approximately over the medial biceps, lateral biceps, anterior deltoid, medial-anterior deltoid, and posterior deltoid. The gains of the pair of biceps channels were adjusted slightly, early in the session, but parameters were otherwise constant throughout the reaching experiment.
Data preprocessing
Before any data analysis, the data were preprocessed. Raw neural data were transformed from spike event times into two different forms for different analyses. Spike counts in 30 ms bins were calculated for LGF decoding analyses (see Kinematic decoding), and fractional interval firing rates (Georgopoulos et al., 1989; Schwartz, 1992) at 30 ms intervals were computed for all other analyses. The firing rates were low-pass filtered with a bell-shaped filter of length 21 samples with a corner frequency of 2.0 Hz. The filter was applied forwards and then backwards using the filtfilt function of MATLAB (The MathWorks), to avoid introducing any filtering delay.
Hand marker position was resampled at the same 30 ms intervals as the neural data using linear interpolation to synchronize the kinematic data with the spike counts. EMG power within each corresponding 30 ms bin was calculated by taking the root-mean-square (RMS) amplitude for each channel. Overall EMG power was calculated by taking the mean across channels for each time bin.
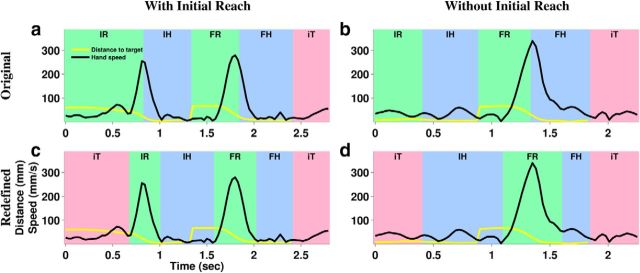
To ensure that the task periods reflected actual behavior, they were redefined using kinematic data from each trial (Fig. 2). FR was defined as the time spanning the closest local minimum before and the closest local minimum after the peak speed between t2 and t4 in Figure 1. If the local minimum was >30% of peak speed, then the next closest minimum was used instead. FH was the time spanning the end of the FR and the end of the trial. IR could not be identified from peak speed alone because the monkey was allowed unrestricted movements between t0 and t1; the monkey could make non-task-related movements such as putting its arm down to rest or raising the arm from the resting position. Therefore, to correctly identify the initial reaching movement, we first identified the peak speed point while the distance from cursor to target was monotonically decreasing up to t1. IR was then defined around the peak speed point as in FR, based on the local minimum before and after the peak speed. IH was the time spanning the end of the IR and the beginning of the FR. IT was defined as the time spanning the end of FR and the beginning of IR. To simplify the analysis, IR and FR were pooled as Reach periods and IH and FH were pooled as Hold periods. All analyses were performed using these redefined task periods.
Figure 2.
Original and redefined task periods. Speed profiles (black) and distance from cursor to target (yellow) are shown for two example trials: one that included an IR (a, c) and one where there was no IR because the hand was already at the initial target at the beginning of the trial (b, d). In the original task periods (a, b), Hold typically started while hand speed was still high because the monkeys had a habit of allowing the hand to enter the target at high speed because the target region was large enough to allow slowing down within the region without overshooting it. The redefined periods (a, b) were aligned to the speed profiles, capturing the high-speed movements within the Reach periods and leaving only low speed for Hold periods.
Principal component analysis
Principal component analysis (PCA) was performed using MATLAB's princomp function. Firing rates of all units over a whole session were square-root transformed (Georgopoulos et al., 1989; Georgopoulos and Ashe, 2000) and used without filtering for specific task periods. Each channel's mean was subtracted before being passed to PCA.
Rest period labeling
There were occasional periods between trials when the monkey spontaneously put its hand down to rest (see Results, “Identification of Rest Periods”). A sample at discrete time k was labeled Rest when the windowed path length dk traveled within a 300 ms window (± 5 samples around current time) was ≤1 mm, as follows:
 |
and pk was hand position at time k. The Rest period could be detected reliably because the motion tracking system was precise and the hand was resting on a solid surface.
Linear discriminant analysis for idle state detection
To detect the Idle state (the neural correlate of Rest), a linear discriminant analysis (LDA) classifier was used. The classifier was trained to distinguish two classes, Idle or Active, with firing rates as input. The firing rates were square-root transformed (Georgopoulos et al., 1989; Georgopoulos and Ashe, 2000) to better fit the normal distribution expected by LDA. The training data were labeled Idle during Rest periods, and Active during Reach and Hold periods. Twofold cross-validation was used for each session. The folds were chosen as the first half versus the second half of all samples within each class (Idle and Active).
State detection evaluation
A confusion matrix was computed for each cross-validation fold. The percentage correct/incorrect entries in the confusion matrix were calculated as Nmn/Nm, where Nmn was the number of 30 ms samples predicted as class n, the actual class of which was m, and Nm was the total number of samples of class m. Mean ± 2 SEs were calculated across all cross-validation folds and sessions. Average confusion matrices across monkeys were computed by averaging each mean or SE value across the two monkeys. Overall classification accuracy across classes was calculated by averaging the main diagonal elements of the confusion matrix.
Kinematic decoding
Hand kinematics were predicted from neural data using a Laplace Gaussian Filter (LGF; Koyama et al., 2010a, 2010b). A series of three decoder configurations (D1–D3) were created in order of increasing sophistication:
Basic decoder (D1).
In the simplest configuration, typical of prosthetic control experiments, a simple velocity tuning function was assumed as follows:
Where lik is the expected firing rate for unit i at discrete time k, b0i and bi are regression coefficients, and vk = (υxk, υyk, υzk)⊤ is the 3D Cartesian hand velocity at time k. di accounted for the delay between motor-cortical signals and arm movement. A constant value of di = 3 samples (90 ms) was used for all units (determined by optimization to minimize the average decoding error across all sessions). Spike counts (yik) were assumed to be Poisson distributed as a function of the expected firing rate as follows:
Where Dt was the sample period (30 ms).
As a requirement of the LGF state-space filter, a state transition model was needed to describe how the kinematic state (vk) was expected to progress from one time step to the next (assuming no knowledge of neural data). We defined this as a random walk model as follows:
Where wvk was a Gaussian noise term with zero mean and covariance (Qvk, a diagonal matrix with variance qvk on the main diagonal). A constant value of qvk = 400 mm2/s2 was used (found by optimization to minimize the average decoding error across all sessions).
The b coefficients of Equation 2 were calibrated by generalized linear model regression based on hand velocity and spike counts from Reach and Hold periods.
Advanced decoder (D2).
To better predict hand kinematics, three improvements were made to the decoding model: We added speed and position terms (Kettner et al., 1988; Moran and Schwartz, 1999; Wang et al., 2007), improved the state transition model with more realistic variance, and optimized the delay for each unit.
To add speed and position to the tuning function, the velocity term vk of Equation 2 was replaced with the augmented kinematic vector zk as follows:
 |
Where sk = |υk| was the hand speed and pk = (pxk, pyk, pzk)⊤ was position. The state transition model was accordingly generalized by replacing the velocity state vector vk of Equation 4 with an augmented state vector xk as follows:
 |
 |
Where I was a 3 × 3 identity matrix and 0 was a zero matrix. The IDt element of the state transition matrix F constrained the model by expressing the expectation that position should be the integral of velocity. Qvk and Qpk were covariance matrices with variance qvk and qpk, respectively, on their main diagonal. Rather than using a simplistic constant variance for the advanced decoder, a more realistic variance was dynamically calculated from instantaneous decoded speed sk, as follows:
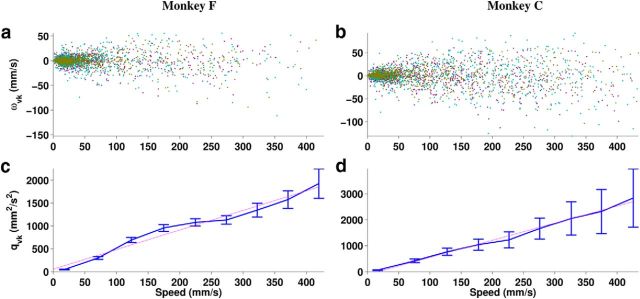
Where q0 = 2.22 × 10⁻¹⁵ mm2/s2 was the variance at zero speed and r = 5 mm/s was the rate of change of variance as a function of speed. The values of q0 and r were determined by fitting to kinematic data (Fig. 3). qpk was assumed equal to qvk.
Figure 3.
a, b, Change in velocity wvk between consecutive time steps as a function of speed sk showing the Cartesian x, y, and z components separately (purple, cyan, and brown, respectively). c, d, The variance qvk of the pooled Cartesian components of wk as a function of speed, showing mean ± 2 SEs of 50 mm/s bins (blue) and a linear fit to the means (magenta).
To optimize the delay between each unit's spike data and the kinematic variables, the spike counts of each unit i during calibration were shifted in time by d samples (d = −10…10) and the optimal delay di was chosen as the value of d that yielded the maximum R2 from regression. The optimized di was then used in decoding (Equation 5).
This decoder predicted both velocity and position, but only velocity was used in decoding evaluation to make it comparable to D1.
Decoding with state detection (D3).
To test the benefit of state detection for kinematic decoding, the LGF-based kinematic decoder and LDA-based Idle-state detector were cascaded. Velocity was decoded using the D2 kinematic decoder, but the final output was overridden with zero when the Idle state was detected.
Decoding evaluation
Decoding error vector (ek) at discrete time k was defined as the difference between actual velocity υk = (υxk, υyk, υzk) and decoded velocity υ̂k = (υ̂xk, υ̂yk, υ̂zk). Error for each evaluation set was summarized using RMS error (RMSE) and bias as follows:
 |
 |
Where K was the total number of time points evaluated.
All decoding analyses were performed using twofold cross-validation. Each session was divided into halves by the number of trials. A decode on the first half was obtained using a decoder trained on the second half and vice versa, resulting in two decode evaluations per session. Mean ± 2 SEs of each metric across all sessions and evaluation sets were calculated for each decoder.
Idle/Active transition plots
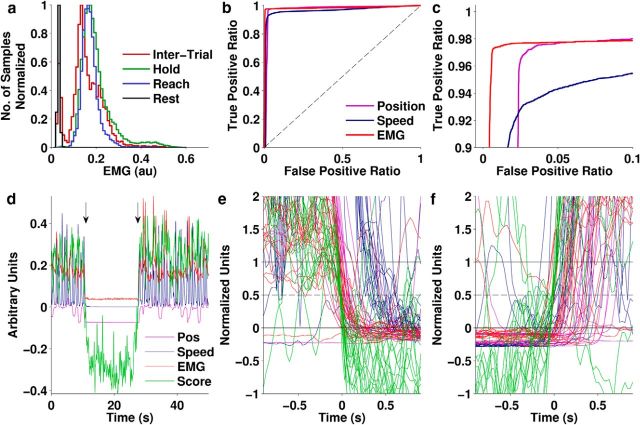
Figure 11, e and f, shows true positive state transitions from one Monkey C session. The values of four quantities (LDA score, speed, vertical position, and average EMG power) were each normalized as follows: First, a high value (qH) for each quantity q was chosen as the 5th percentile of all values during the Active state. Then, a low value (qL) was chosen as the 95th percentile of all values during Idle state. The normalized quantity q′ was then calculated as follows:
 |
This normalized the transitions to a range of 0–1 so they could be plotted together for all four quantities.
Figure 11.
Relationship of the Idle state to speed, position, and EMG from one Monkey C session. a, Histogram of EMG power for each task state. b, c, ROC curves for predicting the Idle state from vertical position, speed, or EMG power (c is a zoomed-in version of b to show the detail in the top left part of the curve). Dashed line indicates expected performance of a random classifier. d–f, LDA score, speed, vertical position, and average EMG power during transitions into and out of the Idle state. d, Example data showing two transitions (arrows), the first into and the second out of the Idle state. The four quantities were arbitrarily scaled to put them approximately in the same range for plotting. e, f, Normalized values of the same four quantities showing multiple transitions into (e) and out of (f) the Idle state aligned on the time when the normalized LDA score crossed a threshold of 0.5. Normalization mapped the 95th percentile of Idle period values to 0 and the 5th percentile of Active period values to 1 (Equation 12).
Results
Data from Monkey F were collected over 11 sessions recorded on 9 separate days and those from Monkey C over 2 sessions on separate days. An average of 66 single units were simultaneously recorded during each session from the primary motor cortex of Monkey F and an average of 19 from Monkey C. When performing manual sorting each day, the sorting criteria did not require much adjustment from the previous day, so it is likely that most, but not all, units were the same from day to day. For Monkey F, this was shown quantitatively (Fraser and Schwartz, 2012). Both monkeys performed a reaching task consisting of five distinct periods per trial: two Reach periods, two Hold periods, and an IT period (Fig. 1b). In previous studies, analysis had been typically based on the Reach and Hold, collectively called trial periods, whereas IT data were excluded. In the present work, the IT periods were the focus of analysis. The monkeys performed consistently in successful trials, as shown by an orderly pattern of movements to discrete target locations (Fig. 1c). In contrast, IT trajectories (Fig. 1d) were more variable because the monkey's behavior was not directed by the task during that time. With the assumption that motor cortical single unit firing rates would fit the same tuning model during both the trial and IT periods, we tested whether a velocity decoder built during trial periods would perform equally well during trial and IT.
Continuous decoding including during IT periods
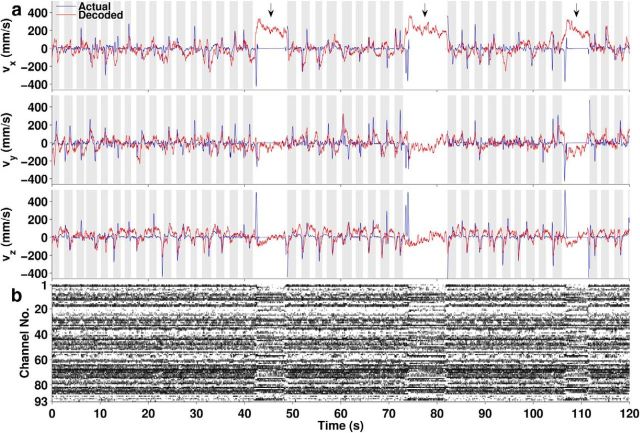
It has been previously shown that hand velocity can be predicted from motor cortical ensemble activity (Georgopoulos et al., 1988; Schwartz, 1994; Lebedev et al., 2005; Li et al., 2009). To determine whether this model was also applicable during IT periods, we trained an LGF decoder (Koyama et al., 2010a,2010b) using the velocity tuning model (decoder configuration D1, see Materials and Methods). The tuning model was calibrated using data from the Reach and Hold periods, but decoding was performed continuously throughout all periods, including during ITs (Fig. 4a).
Figure 4.
Kinematics and neural signals over a continuous 2 min period. a, x, y, and z components of decoded hand velocity with the D1 decoder (red) generally follow actual hand velocity (blue) during the 37 trial periods (gray background) and most of the IT periods (white background), except for large deviations during some long IT periods (arrows). The hand marker was out of view during the second long IT period. b, Firing rates (grayscale where white = zero, black = maximum) of the 93 simultaneously recorded units that were used for decoding, aligned in time with the plots in a.
Two observations are clear from the plot in Figure 4: (1) the decoded velocity approximately matched the actual velocity during both trial and IT periods and (2) there was a consistent large offset between decoded and actual velocities during some long IT periods. A concomitant change in the population activity pattern (Fig. 4b) suggests that the monkey's behavior during those periods may have differed from active trial periods.
Identification of rest periods
2D histograms show that the hand was often at a low position consistent with the lap plate where the monkey spontaneously rested its arm between some trials (Fig. 5a–d). However, due to the variability of resting positions, we found that a more unique identifier of the Rest periods was windowed path length dk (Equation 1). Because the hand was supported by a solid surface during Rest, the amount of movement in a 300 ms window was much lower than during any other periods as indicated by a bimodal distribution (Fig. 5e,f). Periods below this threshold were labeled Rest and color coded black in subsequent plots. As expected, speed and vertical position were at low values during periods that were labeled Rest (Fig. 5g–j). Rest periods occurred only during IT, never during Reach or Hold. IT data in subsequent results excludes the Rest periods.
Figure 5.
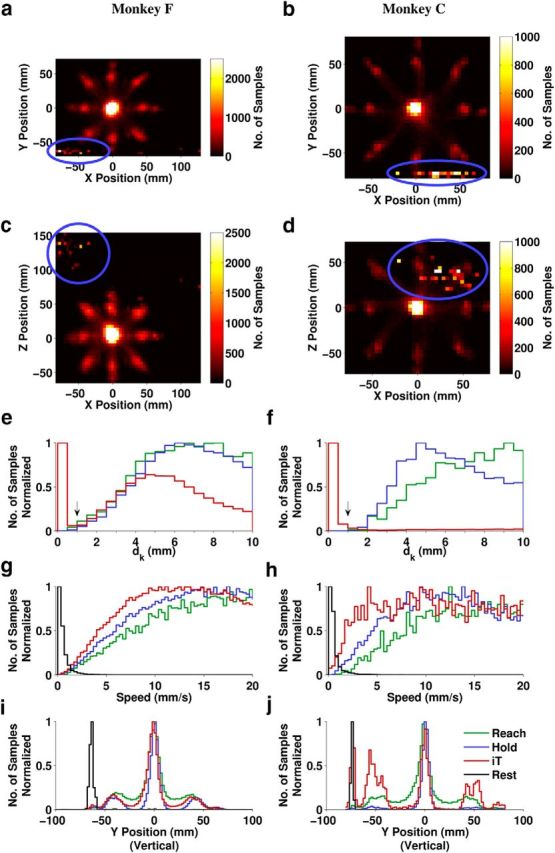
Kinematic identification of the Rest periods. a–d, 2D histograms of hand position over one whole session for each monkey: peaks at the low extreme of the vertical y-dimension (circled) are consistent with locations on the lap plate where the monkey rested its arm. e–j, Aggregated histograms of hand kinematics over all sessions for each monkey. e, f, Windowed path length dk (Equation 1) shown for dk < 10 mm. The arrow indicates the 1 mm Rest identification threshold. g, h, Speed, shown for <20 mm/s. i, j, Vertical component of position. Colors indicate task periods as defined in Figure 1b and black is the newly identified Rest period.
Reflection of rest periods in single-unit activity
Based on prior studies (Georgopoulos et al., 1982; Reina et al., 2001), we expected that the firing rate f of most motor cortical units would be well approximated as a linear function of hand velocity υ = (υx, υy, υz) as follows:
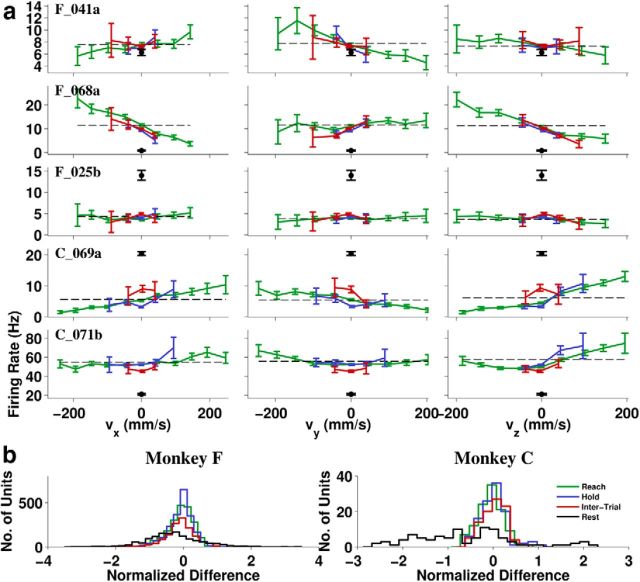
Where b0, bx, by, and bz are regression coefficients, and ϵ is a noise term. When plotted against any one velocity component, firing rates that follow the model should fit a straight line (Fig. 6). Firing rates during Rest should be at the intercept b0 if they fit the model, but for many units this was not the case (Fig. 7a). Some units fired much higher, and some much lower than b0, with the overall distribution during Rest biased toward lower rates (Fig. 7b). In contrast, the firing rates during the kinematically similar Hold periods tended to be close to b0, as shown by the blue distribution in Figure 7b.
Figure 6.
Firing rate of a single unit during Reaching over one whole Monkey F session as a function of x-velocity. Because individual 30 ms data points (a) were noisy, the data were time binned at 300 ms intervals (b) and then velocity binned at 50 mm/s intervals along the abscissa (c) to show how well the actual data (green) followed the linear fit (magenta). Error bars indicate 2 SE. Bins with <10 points were excluded from plotting.
Figure 7.
Single-unit tuning functions. Colors indicate task periods as defined in Figure 1b. a, Binned firing rate plots for each of the four task periods for five representative units: three from Monkey F (top three rows) and two from Monkey C (bottom two rows). Colors indicate task periods defined in Figure 1b and the black dot is the mean firing rate during Rest. Error bars indicate ± 2 SE. Baseline firing rate b0 (dashed line) is shown from a linear fit to Reach period data. b, Histogram of the normalized zero-bin firing rate difference (f0 − b0)/, where f0 is the mean firing rate of a given unit in the zero-velocity bin for a given dimension, b0 is the same as above, and n is the variance of firing rates in 300 ms bins calculated separately and then averaged over the four task periods.
Reflection of rest periods in population activity
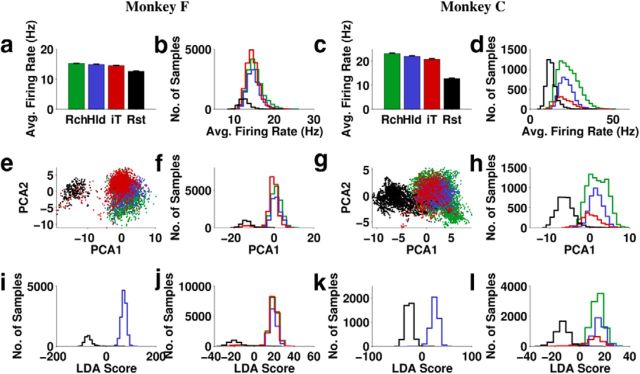
Although some units showed clear Rest-related modulation, the firing rate of individual units would be too noisy to predict Rest periods reliably. Even if it was not noisy, the Rest firing rate for a lot of units was within the range of movement-modulated rates, meaning that the interpretation of a single unit's rate could be ambiguous. We therefore investigated the ensemble activity of all recorded units. First, we found that the firing rate, averaged over all units and time, was significantly lower during Rest than during all other (active) task periods (Fig. 8a–d). This was consistent with the finding from the previous section that most individual units' Rest firing rates were lower than their baseline rates during the active periods (Fig. 7b). The differences were most visible in the time-averaged values over a whole session (Fig. 8a,c), in which that difference was much larger than two SEs (i.e., >95% confidence). However, on an instantaneous basis, the differences were not as clear (Fig. 8b,d), showing substantial overlap between Rest and the active periods. This is not surprising given that some units increased, rather than decreased, their firing rate during Rest (Fig. 7b). Therefore, average firing rate alone cannot be the most accurate predictor of the Rest periods.
Figure 8.
Population activity aggregated over one whole session for each monkey. Colors indicate task periods defined in Figure 1b and black is Rest. a, c, Firing rate averaged over all units and time (± 2 SE). b, d, Histogram of instantaneous average firing rate (averaged over all units for each 30 ms sample). e, g, First two principal components of the instantaneous firing rates (each dot is a 30 ms sample). f, h, Histogram of the first principal component of firing rates. i, k, Histogram of the discriminant score of an LDA classifier trained to distinguish Rest from Hold based on firing rates of all units. j, l, Histogram of the discriminant score of an LDA classifier trained to distinguish Rest from all other task periods based on firing rates of all units.
Next, we applied PCA to mean-subtracted firing rates and found that projecting the firing rates onto the first two principal components gave two easily separable clusters (Fig. 8e,g), with almost all of the power discriminating these clusters in the first principal component (PC1; Fig. 8f,h). PC1 appeared to separate the clusters better than average firing rates, presumably because PCA has the ability to assign negative (as well as positive) weights to the firing rates of individual units, thus taking into account their natural tendency to modulate high or low for Rest.
We will refer to the distinct pattern of cortical activity during Rest periods as the Idle state. Conversely, the activity pattern during other task periods will be termed the Active state. The fact that this state difference was well separated by the first principal component means that the state change was the most prominent driver of neural activity in this dataset.
For purposes of prosthetic control, it would be useful to be able to automatically detect the Idle state from neural activity. Despite the apparent utility of this PCA, its results can be context dependent. If a certain behavior during a different task caused the units to modulate more than the Idle/Active distinction, then PC1 would no longer predict the Idle state. Therefore, a more reliable way of detecting the Idle state is required.
Idle state detection
To avoid the problems associated with PCA-based detection, we used LDA instead. Like PCA, LDA is a linear method that calculates a weighted sum of the firing rates. As a supervised classifier, LDA has the advantage of choosing weights that optimally separate the classes. This is done by minimizing the ratio of within-class to between-class variance. LDA assigns positive weights to units with a low firing rate (and negative weights to those with a high firing rate) during Idle. In addition, LDA calculates an offset such that the decision boundary on the output score would lie at 0, so a positive score would predict Active and a negative score Idle. LDA clearly separated Rest from other periods (Fig. 8j,l), even when trained to distinguish between just Rest and Hold (Fig. 8i,k). This is particularly interesting because these two states are kinematically most similar, both essentially nonmovement states with nearly zero speed. IT received a positive score most of the time, but sometimes slightly negative, suggesting that it may include transition periods between Idle and Active states.
When applied as a binary classifier between Idle and Active, LDA achieved a high accuracy (Table 1) considering that it made predictions on instantaneous 30 ms samples, not averaged trial periods. The correct classification rate, averaged over monkeys and states, was 97.8 ± 2.1% (97.8 ± 2.1% for Monkey F, 97.9 ± 2.1% for Monkey C).
Table 1.
State detection confusion matrix averaged across monkeys
| LDA prediction |
||
|---|---|---|
| Idle | Active | |
| Actual | ||
| Idle | 96.6 ± 3.4% | 3.4 ± 3.4% |
| Active | 1.0 ± 0.9% | 99.0 ± 0.9% |
We also looked at the classification accuracy in relation to individual task periods (Table 2). Not surprisingly, Reach periods were classified as Active 99.0% of the time. Hold periods, although kinematically similar to Idle periods, were classified 99.98% as Active (rounded as 100.0% in Table 2). This suggests that holding the hand at a position in free space is an active process and is consistent with earlier figures, where it was shown that neural activity during hold periods tends to be more similar to that during movement periods than resting periods. IT periods were misclassified as Idle 2.7% of the time, suggesting once again that IT periods may include Idle/Active transitions.
Table 2.
Idle/Active classification by task period averaged across monkeys
| LDA prediction |
||
|---|---|---|
| Idle | Active | |
| Task period | ||
| Reach | 1.0 ± 0.9% | 99.0 ± 0.9% |
| Hold | 0.0 ± 0.1% | 100.0 ± 0.0% |
| Intertrial | 2.7 ± 2.1% | 97.3 ± 2.1% |
| Rest | 96.6 ± 3.4% | 3.4 ± 3.4% |
LDA was chosen because of its simplicity. The fact that Idle and Active can be accurately distinguished with a linear method implies that the underlying state change itself has little reliance on complex interactions between neurons. Each unit simply modulates high or low with the state change independently of the other units.
It is worth noting that, in a practical application, LDA would not necessarily be the best choice of classifier because of its tendency to overfit noisy neural firing rates. This would lead to poor cross-validation even when the classifier performed well on training data. In this study, these problems were not encountered, as evidenced by the high classification accuracy on cross-validation.
Kinematic decoding with and without Idle detection
For neural prosthetic applications, it is important that the Idle pattern be correctly interpreted by a kinematic decoder to avoid undesired movement. We compared the performance of two decoders without (D1 and D2) and one with idle detection (D3) as follows:
D1: V tuning model
D2: VSP tuning model + other refinements
D3: D2 + LDA Idle detection
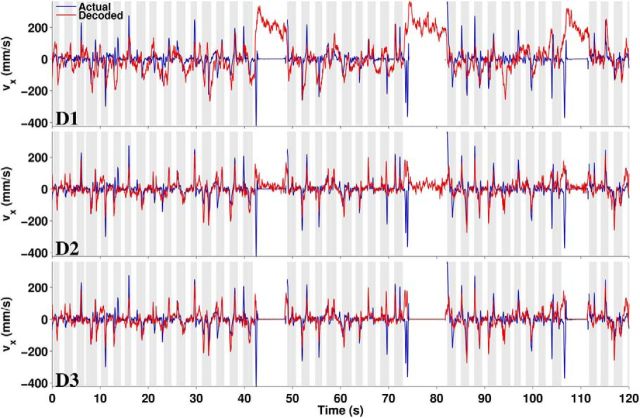
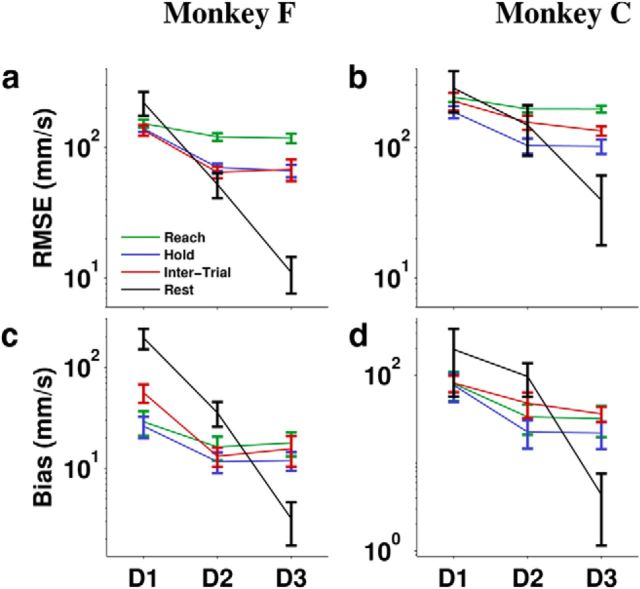
The correct output during rest periods would be zero velocity, but D1 produced a consistent nonzero decode during long IT periods when the monkey rested its arm (Figs. 4a, 9a). D2 predicted velocity far more accurately than D1 and even greatly reduced Rest bias (Fig. 9b), but the bias was not completely removed until explicit Idle detection with D3 (Fig. 9c). The same trends were shown by quantitative performance evaluation using two error measures: RMSE and bias (Fig. 10). RMSE (Equation 10) captures the average amount of difference between decoded and actual velocity, but is unable to distinguish randomly distributed error from consistent directional error. The latter is quantified by bias (Equation 11). To put the magnitude of the errors in perspective, the average speed of reaching movements was about 100 mm/s. Without idle detection, D1, the configuration typical of neural prosthetic experiments, would produce ∼200 mm/s unintended movements during Rest (twice as fast as the average reaching movement). The more advanced D2 configuration reduced bias more for Monkey F (∼35 mm/s) than Monkey C (∼100 mm/s), but would still produce very obvious undesired movements. When idle detection was applied in D3, the bias was reduced to approximately 3–4 mm/s, a mere fraction of reaching speed. The reason for this small residual bias was the 3% misclassification rate for Idle.
Figure 9.
Actual and decoded x-velocity for the three decoder configurations (D1–D3) over the same 2 min period shown in Figure 4.
Figure 10.
Decoding error for the three decoder configurations (D1–D3). RMSE (a, b) and bias (c, d) were averaged over all sessions and cross-validation folds. Error bars are ± 2 SE.
Alternative correlates of the Idle state
The most obvious measurement that should correlate with arm relaxation would be EMG. The distribution of EMG power during Rest was clearly separated from its Hold and Reach distributions (Fig. 11a). Such clear separation was not present for speed or position (Fig. 5g–j). To show that the Idle state was better related to actual arm relaxation than its kinematic correlates, we tried predicting the Idle state by thresholding vertical position, speed, and EMG. Predictions were labeled Idle whenever the value was below threshold. Rather than picking any specific threshold, we used receiver-operating characteristic curves to evaluate the full range of thresholds (Fig. 11b,c). The graphs show that all three quantities were good for predicting the Idle state, but EMG power was the best. Approximately an equally high true positive rate was attained with both position and EMG, predicting Idle correctly approximately 97% of the time. But the false-positive rate was much lower for EMG, at ∼0.5% compared with 3.5% for position. This means that, with EMG, we made seven times fewer errors of predicting Idle when the actual state was Active. In other words, the arm was not necessarily resting just because it was in a low position. The correlation of resting with position was most likely coincidental as a consequence of the fact that there happened to be a convenient surface for the monkey to rest its hand on. Speed was an even worse predictor than position, suggesting that its correlation to the state change was likely also coincidental. Although EMG data were only available from one monkey, this seemed to strongly support the view that the neural Idle state could be related to arm relaxation.
We also wanted to account for the possibility that the Rest period activity could be driven by the sensation of touch when the monkey put the hand down. If this were true, then the LDA score should transition from low to high or high to low after a change in speed, position, or EMG. A plot of the transition periods (Fig. 11d–f) shows that the opposite was true: the LDA score always transitioned first. Because the state change in motor cortical activity occurred before any possible onset of tactile sensation, we can conclude that it was not driven by such feedback.
Discussion
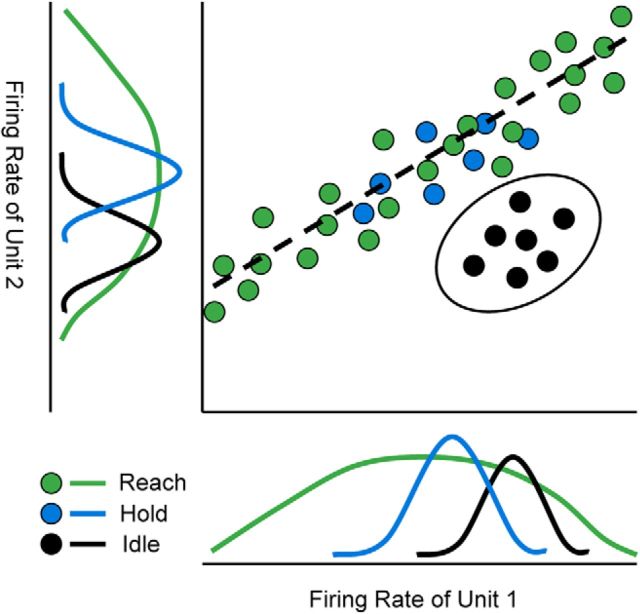
We have shown that there was a very clear, characteristic shift in motor cortical activity when the monkey put its arm down to rest. We call this novel pattern of activity the Idle state. We use the term “state” the same way as Churchland et al. (2012): the firing rate of all units. This means the state change is an emergent effect across the population. It is not necessarily identifiable from a single unit because the Idle firing rate for most units is within the range of firing rates exhibited during movement. However, when taken as a population, the change becomes apparent. Consider an N-dimensional space for N units where each dimension is the firing rate of one unit. The ensemble population activity at any given time would then be represented as a point in this space. In the Active state, the points tend to fall on a manifold described by a movement-related tuning function. For example, if all of the units followed velocity tuning, the manifold would be a 3D hyperplane within the N-dimensional space. Idle state would be a cluster of points away from the manifold. Figure 12 conveys this concept with the example of a 2D space and a 1D manifold. The amount of separation achieved with two units is exaggerated in this sketch. In reality, individual units are so noisy that it can only be recognized from the combined activity of many units.
Figure 12.
Tuning manifold concept. The firing rate distribution for Idle can be overlapping that of Reach and Hold for each unit alone (bottom and left). When plotted together (top right), the firing rates during Reach and Hold tend to fall on a manifold (dashed line) because they are correlated with each other by following a common tuning function, a common driver. However, Idle firing rates follow a different correlation pattern. Unit 1 has a higher-than-average rate and unit 2 a lower-than-average rate during Idle, so the Idle cluster (black oval) separates from the manifold.
Because the activity during rest periods did not follow the expected tuning functions, decoders that used linear tuning functions produced a biased output when cortical activity was in the Idle state, meaning that there was a consistent error in one direction. In the context of prosthetic control with velocity being the decoded variable, the bias would manifest as a “drift”: the arm would keep moving in one direction despite the subject's intention to keep it stationary and relaxed. This phenomenon has been observed in brain–computer interface (BCI) studies (Taylor et al., 2002; Velliste et al., 2008) in which a constant “drift correction” vector was applied in an attempt to cancel output bias.
It is worth clarifying that Idle detection is not required for stopping, because the monkeys had no trouble holding a cursor (Taylor et al., 2002) or a virtual arm (O'Doherty et al., 2011) within a small target region or steadying a robotic manipulator to pick up food (Velliste et al., 2008) when continuous kinematic variables were decoded without any discrete state information. In light of the present study, it is easy to see how this is possible under active control because there is relatively little output bias during Hold periods. In closed-loop control, a subject can intentionally apply corrective commands under visual feedback to counteract the bias. The problem starts when the subject rests because then, as we have shown, motor cortical units change their tuning: individual units change their baseline rates to values that would normally be associated with nonzero velocity, thus leading to biased output.
Qualitatively, unintended movement could be more of a problem for a prosthetic user than a mere increase in decoding error. For example, in circumstances in which the user wanted to rest their arm, such as sitting at a meeting or watching TV at home, any amount of unintended movement would be distracting and frustrating. Although it may be possible to prevent drift by using visual feedback and staying only in the active state, such a strategy may present a constant, high cognitive load that would be absent during true rest.
As a solution to this problem, we showed that the Idle state can be detected with near-perfect accuracy using a classifier trained on the instantaneous firing rates of a population of motor cortical units. By combining the state detection with kinematic decoding, the bias during rest periods was almost completely removed.
An interesting nuance of our findings was that the firing rates during hold periods followed the Active pattern, even though hold was kinematically similar to rest with almost zero velocity. This means that the Idle neural state was not just an epiphenomenon of kinematic modulation, but rather seemed to relate to dynamic parameters, as evidenced by the lack of EMG power when the Idle state was detected. In this sense, hold versus rest can be distinguished as actively maintained versus passive.
The concept of state detection in the context of BCI is not new in itself. Single-unit activity has been used to detect “click” (Kim et al., 2011), attentional states (Wood et al., 2005), change in target direction (Ifft et al., 2012), forward/backward walking direction in a switching decoder (Fitzsimmons et al., 2009), hold/release periods (Lebedev et al., 2008), grasp type (Townsend et al., 2011), or movement onset (Acharya et al., 2008; Aggarwal et al., 2008; Santaniello et al., 2012). Movement onset can also be detected from local field potential (LFP) activity (Pesaran et al., 2002; Rickert et al., 2005; Scherberger et al., 2005; O'Leary and Hatsopoulos, 2006; Hwang and Andersen, 2009; Mollazadeh et al., 2011; Aggarwal et al., 2013) or from cortical surface (Wang et al., 2012) or scalp recordings (EEG; Hallett, 1994; Awwad Shiekh Hasan and Gan, 2010; Muralidharan et al., 2011; Niazi et al., 2011; Lew et al., 2012).
Some of the studies listed included detection of a baseline state (Achtman et al., 2007; Kemere et al., 2008; Aggarwal et al., 2013) that might be considered similar to our Rest periods. However, their baseline states corresponded to our Hold periods, during which a cued position was maintained. One LFP study (Hwang and Andersen, 2009) referred to relax periods, but these were not explicitly detected. An EEG study specifically addressed the distinction of Rest from movement periods (Zhang et al., 2007), but did not distinguish it from the kinematically similar Hold periods. In some of the studies, movement onset was detected, but the end of movement was not.
Our study advanced state detection by: (1) identifying Rest and Hold as distinct behavioral states despite similar kinematics, (2) identifying correspondingly distinct Idle and Active neural states, (3) characterizing these neural states in relation to individual units' tuning functions, (4) showing that the neural states were highly distinct in their population firing rate pattern, (5) detecting the states on an instantaneous basis, allowing the identification of not only the onset of active periods, but also their end, and (6) detecting the states with an unprecedented 98% accuracy.
The results from this study suggest that kinematic predictions can be improved by identifying state changes in tuning functions. This is an important step toward continuous decoding, which will be necessary for the implementation of real-world prosthetic devices. Other findings suggest that, in addition to the Idle/Active state transition identified in this study, other state transitions occur in motor cortical ensemble firing patterns, such as upon removal of a manipulandum from the subject's grasp (Lebedev et al., 2005), switching from unimanual to bimanual control (Ifft et al., 2013), or falling asleep (Jackson et al., 2007; Pigarev et al., 2013; Pigarev, 2013). Decoders will need to account for these and other potential shifts to maintain decoding accuracy across a wide range of contexts. Abstract variables related to motivation may well have a motor-cortical representation, but would be difficult to measure. In this study, we have shown that there is a state change related to arm resting, but we do not know why the monkey rested its arm. Was it due to fatigue, lack of attention, lack of motivation, or boredom? The observed state change may relate to any of these variables or it may simply reflect something as mechanistic as the gating of motor output from the cortex to the spinal cord or a command to relax the muscles.
Further experiments are needed to explore cortical state changes as they relate to motor control. By identifying state transitions in neural activity that account for distinct clusters in the population firing rate space, we can more accurately attribute the variance of neural activity within a state to relevant motor parameters and improve our understanding of the mechanisms driving motor cortical activity.
Footnotes
This work was supported by the National Institutes of Health (Grant 5R01NS050256), the Defense Advanced Research Projects Agency (Grants W911NF-06-1-0053 and N66001-10-C-4056), and the Johns Hopkins University Applied Physics Laboratory (Grant JHU-APL 972352). We thank George W. Fraser for performing the offline sorting of spike data; Steven M. Chase, Shinsuke Koyama, and Robert E. Kass for useful discussions; and Steven B. Suway and Rex N. Tien for critical reading of the manuscript.
The authors declare no competing financial interests.
References
- Acharya S, Tenore F, Aggarwal V, Etienne-Cummings R, Schieber MH, Thakor NV. Decoding individuated finger movements using volume-constrained neuronal ensembles in the m1 hand area. IEEE Trans Neural Syst Rehabil Eng. 2008;16:15–23. doi: 10.1109/TNSRE.2007.916269. [DOI] [PMC free article] [PubMed] [Google Scholar]
- Achtman N, Afshar A, Santhanam G, Yu BM, Ryu SI, Shenoy KV. Free-paced high-performance brain-computer interfaces. J Neural Eng. 2007;4:336–347. doi: 10.1088/1741-2560/4/3/018. [DOI] [PubMed] [Google Scholar]
- Aggarwal V, Acharya S, Tenore F, Shin HC, Etienne-Cummings R, Schieber MH, Thakor NV. Asynchronous decoding of dexterous finger movements using m1 neurons. IEEE Trans Neural Syst Rehabil Eng. 2008;16:3–14. doi: 10.1109/TNSRE.2007.916289. [DOI] [PMC free article] [PubMed] [Google Scholar]
- Aggarwal V, Mollazadeh M, Davidson AG, Schieber MH, Thakor NV. State-based decoding of hand and finger kinematics using neuronal ensemble and lfp activity during dexterous reach-to-grasp movements. J Neurophysiol. 2013;109:3067–3081. doi: 10.1152/jn.01038.2011. [DOI] [PMC free article] [PubMed] [Google Scholar]
- Ashe J. Force and the motor cortex. Behav Brain Res. 1997;87:255–269. doi: 10.1016/S0166-4328(97)00752-3. [DOI] [PubMed] [Google Scholar]
- Awwad Shiekh Hasan B, Gan JQ. Unsupervised movement onset detection from eeg recorded during self-paced real hand movement. Med Biol Eng Comput. 2010;48:245–253. doi: 10.1007/s11517-009-0550-0. [DOI] [PubMed] [Google Scholar]
- Cherian A, Krucoff MO, Miller LE. Motor cortical prediction of emg: evidence that a kinetic brain-machine interface may be robust across altered movement dynamics. J Neurophysiol. 2011;106:564–575. doi: 10.1152/jn.00553.2010. [DOI] [PMC free article] [PubMed] [Google Scholar]
- Churchland MM, Cunningham JP, Kaufman MT, Foster JD, Nuyujukian P, Ryu SI, Shenoy KV. Neural population dynamics during reaching. Nature. 2012;487:51–56. doi: 10.1038/nature11129. [DOI] [PMC free article] [PubMed] [Google Scholar]
- Evarts EV. Pyramidal tract activity associated with a conditioned hand movement in the monkey. J Neurophysiol. 1966;29:1011–1027. doi: 10.1152/jn.1966.29.6.1011. [DOI] [PubMed] [Google Scholar]
- Evarts EV. Relation of pyramidal tract activity to force exerted during voluntary movement. J Neurophysiol. 1968;31:14–27. doi: 10.1152/jn.1968.31.1.14. [DOI] [PubMed] [Google Scholar]
- Fagg AH, Ojakangas GW, Miller LE, Hatsopoulos NG. Kinetic trajectory decoding using motor cortical ensembles. IEEE Trans Neural Syst Rehabil Eng. 2009;17:487–496. doi: 10.1109/TNSRE.2009.2029313. [DOI] [PubMed] [Google Scholar]
- Fitzsimmons NA, Lebedev MA, Peikon ID, Nicolelis MA. Extracting kinematic parameters for monkey bipedal walking from cortical neuronal ensemble activity. Front Integr Neurosci. 2009;3:3. doi: 10.3389/neuro.07.003.2009. [DOI] [PMC free article] [PubMed] [Google Scholar]
- Fraser GW, Schwartz AB. Recording from the same neurons chronically in motor cortex. J Neurophysiol. 2012;107:1970–1978. doi: 10.1152/jn.01012.2010. [DOI] [PMC free article] [PubMed] [Google Scholar]
- Georgopoulos AP. Arm movements in monkeys: behavior and neurophysiology. J Comp Physiol A. 1996;179:603–612. doi: 10.1007/BF00216125. [DOI] [PubMed] [Google Scholar]
- Georgopoulos AP. Neural aspects of cognitive motor control. Curr Opin Neurobiol. 2000;10:238–241. doi: 10.1016/S0959-4388(00)00072-6. [DOI] [PubMed] [Google Scholar]
- Georgopoulos AP, Ashe J. One motor cortex, two different views. Nat Neurosci. 2000;3:963. doi: 10.1038/79882. author reply 964–965. [DOI] [PubMed] [Google Scholar]
- Georgopoulos AP, Kalaska JF, Caminiti R, Massey JT. On the relations between the direction of two-dimensional arm movements and cell discharge in primate motor cortex. J Neurosci. 1982;2:1527–1537. doi: 10.1523/JNEUROSCI.02-11-01527.1982. [DOI] [PMC free article] [PubMed] [Google Scholar]
- Georgopoulos AP, Kettner RE, Schwartz AB. Primate motor cortex and free arm movements to visual targets in three-dimensional space. ii. coding of the direction of movement by a neuronal population. J Neurosci. 1988;8:2928–2937. doi: 10.1523/JNEUROSCI.08-08-02928.1988. [DOI] [PMC free article] [PubMed] [Google Scholar]
- Georgopoulos AP, Lurito JT, Petrides M, Schwartz AB, Massey JT. Mental rotation of the neuronal population vector. Science. 1989;243:234–236. doi: 10.1126/science.2911737. [DOI] [PubMed] [Google Scholar]
- Gupta R, Ashe J. Offline decoding of end-point forces using neural ensembles: application to a brain-machine interface. IEEE Trans Neural Syst Rehabil Eng. 2009;17:254–262. doi: 10.1109/TNSRE.2009.2023290. [DOI] [PubMed] [Google Scholar]
- Hallett M. Movement-related cortical potentials. Electromyogr Clin Neurophysiol. 1994;34:5–13. [PubMed] [Google Scholar]
- Hatsopoulos NG, Amit Y. Synthesizing complex movement fragment representations from motor cortical ensembles. J Physiol Paris. 2012;106:112–119. doi: 10.1016/j.jphysparis.2011.09.003. [DOI] [PMC free article] [PubMed] [Google Scholar]
- Hatsopoulos NG, Donoghue JP. The science of neural interface systems. Annu Rev Neurosci. 2009;32:249–266. doi: 10.1146/annurev.neuro.051508.135241. [DOI] [PMC free article] [PubMed] [Google Scholar]
- Hatsopoulos NG, Xu Q, Amit Y. Encoding of movement fragments in the motor cortex. J Neurosci. 2007;27:5105–5114. doi: 10.1523/JNEUROSCI.3570-06.2007. [DOI] [PMC free article] [PubMed] [Google Scholar]
- Herter TM, Korbel T, Scott SH. Comparison of neural responses in primary motor cortex to transient and continuous loads during posture. J Neurophysiol. 2009;101:150–163. doi: 10.1152/jn.90230.2008. [DOI] [PubMed] [Google Scholar]
- Hwang EJ, Andersen RA. Brain control of movement execution onset using local field potentials in posterior parietal cortex. J Neurosci. 2009;29:14363–14370. doi: 10.1523/JNEUROSCI.2081-09.2009. [DOI] [PMC free article] [PubMed] [Google Scholar]
- Ifft PJ, Lebedev MA, Nicolelis MA. Reprogramming movements: extraction of motor intentions from cortical ensemble activity when movement goals change. Front Neuroeng. 2012;5:16. doi: 10.3389/fneng.2012.00016. [DOI] [PMC free article] [PubMed] [Google Scholar]
- Ifft PJ, Shokur S, Li Z, Lebedev MA, Nicolelis MA. A brain-machine interface enables bimanual arm movements in monkeys. Sci Transl Med. 2013;5:210ra154. doi: 10.1126/scitranslmed.3006159. [DOI] [PMC free article] [PubMed] [Google Scholar]
- Jackson A, Mavoori J, Fetz EE. Correlations between the same motor cortex cells and arm muscles during a trained task, free behavior, and natural sleep in the macaque monkey. J Neurophysiol. 2007;97:360–374. doi: 10.1152/jn.00710.2006. [DOI] [PubMed] [Google Scholar]
- Kalaska JF. From intention to action: motor cortex and the control of reaching movements. Adv Exp Med Biol. 2009;629:139–178. doi: 10.1007/978-0-387-77064-2_8. [DOI] [PubMed] [Google Scholar]
- Kemere C, Santhanam G, Yu BM, Afshar A, Ryu SI, Meng TH, Shenoy KV. Detecting neural-state transitions using hidden markov models for motor cortical prostheses. J Neurophysiol. 2008;100:2441–2452. doi: 10.1152/jn.00924.2007. [DOI] [PMC free article] [PubMed] [Google Scholar]
- Kettner RE, Schwartz AB, Georgopoulos AP. Primate motor cortex and free arm movements to visual targets in three-dimensional space. iii. positional gradients and population coding of movement direction from various movement origins. J Neurosci. 1988;8:2938–2947. doi: 10.1523/JNEUROSCI.08-08-02938.1988. [DOI] [PMC free article] [PubMed] [Google Scholar]
- Kim SP, Simeral JD, Hochberg LR, Donoghue JP, Friehs GM, Black MJ. Point-and-click cursor control with an intracortical neural interface system by humans with tetraplegia. IEEE Trans Neural Syst Rehabil Eng. 2011;19:193–203. doi: 10.1109/TNSRE.2011.2107750. [DOI] [PMC free article] [PubMed] [Google Scholar]
- Koyama S, Chase SM, Whitford AS, Velliste M, Schwartz AB, Kass RE. Comparison of brain-computer interface decoding algorithms in open-loop and closed-loop control. J Comput Neurosci. 2010a;29:73–87. doi: 10.1007/s10827-009-0196-9. [DOI] [PubMed] [Google Scholar]
- Koyama S, Pérez-Bolde LC, Shalizi CR, Kass RE. Approximate methods for state-space models. J Am Stat Assoc. 2010b;105:170–180. doi: 10.1198/jasa.2009.tm08326. [DOI] [PMC free article] [PubMed] [Google Scholar]
- Lebedev MA, Carmena JM, O'Doherty JE, Zacksenhouse M, Henriquez CS, Principe JC, Nicolelis MA. Cortical ensemble adaptation to represent velocity of an artificial actuator controlled by a brain-machine interface. J Neurosci. 2005;25:4681–4693. doi: 10.1523/JNEUROSCI.4088-04.2005. [DOI] [PMC free article] [PubMed] [Google Scholar]
- Lebedev MA, O'Doherty JE, Nicolelis MA. Decoding of temporal intervals from cortical ensemble activity. J Neurophysiol. 2008;99:166–186. doi: 10.1152/jn.00734.2007. [DOI] [PubMed] [Google Scholar]
- Lebedev MA, Tate AJ, Hanson TL, Li Z, O'Doherty JE, Winans JA, Ifft PJ, Zhuang KZ, Fitzsimmons NA, Schwarz DA, Fuller AM, An JH, Nicolelis MAL. Future developments in brain-machine interface research. Clinics (Sao Paulo) 2011;66:25–32. doi: 10.1590/S1807-59322011001300004. [DOI] [PMC free article] [PubMed] [Google Scholar]
- Lew E, Chavarriaga R, Silvoni S, Millán Jdel R. Detection of self-paced reaching movement intention from eeg signals. Front Neuroeng. 2012;5:13. doi: 10.3389/fneng.2012.00013. [DOI] [PMC free article] [PubMed] [Google Scholar]
- Li Z, O'Doherty JE, Hanson TL, Lebedev MA, Henriquez CS, Nicolelis MA. Unscented kalman filter for brain-machine interfaces. PLoS One. 2009;4:e6243. doi: 10.1371/journal.pone.0006243. [DOI] [PMC free article] [PubMed] [Google Scholar]
- Mirabella G. Volitional inhibition and brain-machine interfaces: a mandatory wedding. Front Neuroeng. 2012;5:20. doi: 10.3389/fneng.2012.00020. [DOI] [PMC free article] [PubMed] [Google Scholar]
- Mollazadeh M, Aggarwal V, Davidson AG, Law AJ, Thakor NV, Schieber MH. Spatiotemporal variation of multiple neurophysiological signals in the primary motor cortex during dexterous reach-to-grasp movements. J Neurosci. 2011;31:15531–15543. doi: 10.1523/JNEUROSCI.2999-11.2011. [DOI] [PMC free article] [PubMed] [Google Scholar]
- Moran DW, Schwartz AB. Motor cortical representation of speed and direction during reaching. J Neurophysiol. 1999;82:2676–2692. doi: 10.1152/jn.1999.82.5.2676. [DOI] [PubMed] [Google Scholar]
- Muralidharan A, Chae J, Taylor DM. Early detection of hand movements from electroencephalograms for stroke therapy applications. J Neural Eng. 2011;8 doi: 10.1088/1741-2560/8/4/046003. 046003. [DOI] [PMC free article] [PubMed] [Google Scholar]
- Niazi IK, Jiang N, Tiberghien O, Nielsen JF, Dremstrup K, Farina D. Detection of movement intention from single-trial movement-related cortical potentials. J Neural Eng. 2011;8 doi: 10.1088/1741-2560/8/6/066009. 066009. [DOI] [PubMed] [Google Scholar]
- O'Doherty JE, Lebedev MA, Ifft PJ, Zhuang KZ, Shokur S, Bleuler H, Nicolelis MA. Active tactile exploration using a brain-machine-brain interface. Nature. 2011;479:228–231. doi: 10.1038/nature10489. [DOI] [PMC free article] [PubMed] [Google Scholar]
- O'Leary JG, Hatsopoulos NG. Early visuomotor representations revealed from evoked local field potentials in motor and premotor cortical areas. J Neurophysiol. 2006;96:1492–1506. doi: 10.1152/jn.00106.2006. [DOI] [PubMed] [Google Scholar]
- Pesaran B, Pezaris JS, Sahani M, Mitra PP, Andersen RA. Temporal structure in neuronal activity during working memory in macaque parietal cortex. Nat Neurosci. 2002;5:805–811. doi: 10.1038/nn890. [DOI] [PubMed] [Google Scholar]
- Phillips CG, Porter R. Corticospinal neurones. their role in movement. Monogr Physiol Soc. 1977:v–xii. 1–450. [PubMed] [Google Scholar]
- Pigarev IN. The visceral theory of sleep [Article in Russian] Zh Vyssh Nerv Deiat Im I P Pavlova. 2013;63:86–104. doi: 10.7868/s0044467713010115. [DOI] [PubMed] [Google Scholar]
- Pigarev IN, Bagaev VA, Levichkina EV, Fedorov GO, Busigina II. Cortical visual areas process intestinal information during slow-wave sleep. Neurogastroenterol Motil. 2013;25:268–275. e169. doi: 10.1111/nmo.12052. [DOI] [PubMed] [Google Scholar]
- Porter R, Lemon R. Corticospinal function and voluntary movement. Oxford: Clarendon; 1993. [Google Scholar]
- Reina GA, Moran DW, Schwartz AB. On the relationship between joint angular velocity and motor cortical discharge during reaching. J Neurophysiol. 2001;85:2576–2589. doi: 10.1152/jn.2001.85.6.2576. [DOI] [PubMed] [Google Scholar]
- Rickert J, Oliveira SC, Vaadia E, Aertsen A, Rotter S, Mehring C. Encoding of movement direction in different frequency ranges of motor cortical local field potentials. J Neurosci. 2005;25:8815–8824. doi: 10.1523/JNEUROSCI.0816-05.2005. [DOI] [PMC free article] [PubMed] [Google Scholar]
- Santaniello S, Sherman DL, Thakor NV, Eskandar EN, Sarma SV. Optimal control-based bayesian detection of clinical and behavioral state transitions. IEEE Trans Neural Syst Rehabil Eng. 2012;20:708–719. doi: 10.1109/TNSRE.2012.2210246. [DOI] [PubMed] [Google Scholar]
- Scherberger H, Jarvis MR, Andersen RA. Cortical local field potential encodes movement intentions in the posterior parietal cortex. Neuron. 2005;46:347–354. doi: 10.1016/j.neuron.2005.03.004. [DOI] [PubMed] [Google Scholar]
- Schwartz AB. Motor cortical activity during drawing movements: single-unit activity during sinusoid tracing. J Neurophysiol. 1992;68:528–541. doi: 10.1152/jn.1992.68.2.528. [DOI] [PubMed] [Google Scholar]
- Schwartz AB. Direct cortical representation of drawing. Science. 1994;265:540–542. doi: 10.1126/science.8036499. [DOI] [PubMed] [Google Scholar]
- Schwartz AB. Cortical neural prosthetics. Annu Rev Neurosci. 2004;27:487–507. doi: 10.1146/annurev.neuro.27.070203.144233. [DOI] [PubMed] [Google Scholar]
- Schwartz AB, Cui XT, Weber DJ, Moran DW. Brain-controlled interfaces: movement restoration with neural prosthetics. Neuron. 2006;52:205–220. doi: 10.1016/j.neuron.2006.09.019. [DOI] [PubMed] [Google Scholar]
- Taylor DM, Tillery SI, Schwartz AB. Direct cortical control of 3d neuroprosthetic devices. Science. 2002;296:1829–1832. doi: 10.1126/science.1070291. [DOI] [PubMed] [Google Scholar]
- Townsend BR, Subasi E, Scherberger H. Grasp movement decoding from premotor and parietal cortex. J Neurosci. 2011;31:14386–14398. doi: 10.1523/JNEUROSCI.2451-11.2011. [DOI] [PMC free article] [PubMed] [Google Scholar]
- Velliste M, Perel S, Spalding MC, Whitford AS, Schwartz AB. Cortical control of a prosthetic arm for self-feeding. Nature. 2008;453:1098–1101. doi: 10.1038/nature06996. [DOI] [PubMed] [Google Scholar]
- Wang W, Chan SS, Heldman DA, Moran DW. Motor cortical representation of position and velocity during reaching. J Neurophysiol. 2007;97:4258–4270. doi: 10.1152/jn.01180.2006. [DOI] [PubMed] [Google Scholar]
- Wang Z, Gunduz A, Brunner P, Ritaccio AL, Ji Q, Schalk G. Decoding onset and direction of movements using electrocorticographic (ECoG) signals in humans. Front Neuroeng. 2012;5:15. doi: 10.3389/fneng.2012.00015. [DOI] [PMC free article] [PubMed] [Google Scholar]
- Wood F, Prabhat, Donoghue J, Black M. Inferring attentional state and kinematics from motor cortical firing rates. Conf Proc IEEE Eng Med Biol Soc. 2005;1:149–152. doi: 10.1109/IEMBS.2005.1616364. [DOI] [PubMed] [Google Scholar]
- Zhang D, Wang Y, Gao X, Hong B, Gao S. An algorithm for idle-state detection in motor-imagery-based brain-computer interface. Comput Intell Neurosci. 2007;2007:39714. doi: 10.1155/2007/39714. [DOI] [PMC free article] [PubMed] [Google Scholar]


