

Abstract
The authors extracted from the PubMed and ScienceDirect bibliographic databases all articles published between 1998 and 2009 that were relevant to climate change and food- and waterborne diseases. Any material within each article that provided information about a relevant pathogen and its relationship with climate and climate change was summarized as a key fact, entered into a relational knowledge base, and tagged with the terminology (predefined terms) used in the field. These terms were organized, quantified, and mapped according to predefined hierarchical categories. For noncholera Vibrio sp. and Cryptosporidium sp., data on climatic and environmental influences (52% and 49% of the total number of key facts, respectively) pertained to specific weather phenomena (as opposed to climate change phenomena) and environmental determinants, whereas information on the potential effects of food-related determinants that might be related to climate or climate change were virtually absent. This proportion was lower for the other pathogens studied (Campylobacter sp. 40%, Salmonella sp. 27%, Norovirus 25%, Listeria sp. 8%), but they all displayed a distinct concentration of information on general food-and water-related determinants or effects, albeit with little detail. Almost no information was available concerning the potential effects of changes in climatic variables on the pathogens evaluated, such as changes in air or water temperature, precipitation, humidity, UV radiation, wind, cloud coverage, sunshine hours, or seasonality. Frequency profiles revealed an abundance of data on weather and food-specific determinants, but also exposed extensive data deficiencies, particularly with regard to the potential effects of climate change on the pathogens evaluated. A reprioritization of public health research is warranted to ensure that funding is dedicated to explicitly studying the effects of changes in climate variables on food- and waterborne diseases.
Keywords: Campylobacter sp., climate change, climate variability, Cryptosporidium sp., environment, food, food- and water-borne diseases, knowledge base, Listeria sp., Norovirus, ontology, precipitation, rain, reservoir, Salmonella sp., Vibrio sp.
INTRODUCTION
Climate is changing rapidly due to anthropogenic activity such as extensive fossil fuel combustion and widespread alterations in land use (Intergovernmental Panel on Climate Change, 2007; United Nations Framework Convention on Climate Change, 2007). Global climate change manifests itself through gradual changes, such as increasing air and ocean temperatures and shifting mean annual precipitation or altered seasonality, and through erratic events, such as heavy rainfall and other extreme weather events. These recurrent changes can be ephemeral or persistent, but can bring about a myriad of health threats, many of which can be indirect and elusive, including deaths and hospitalization due to heat waves (Semenza et al., 1999; Semenza et al., 1996), injuries and deaths from flooding (Hajat et al., 2003), the health consequences of hurricanes (Barbeau et al., 2010), and the (re-)emergence of communicable diseases, such as Lyme disease, tick-borne encephalitis, or hantavirus pulmonary syndrome, as well as their shifting distribution (Semenza and Menne, 2009).
Although vector-borne diseases have received considerable attention in discussions about climate change, food- and waterborne diseases are also of interest because their incidence can be directly linked to ambient temperature and precipitation (Semenza and Menne, 2009). Elevated temperatures accelerate the replication cycles of foodborne microorganisms, whereas extended summer seasons may increase the opportunities for deficiencies in food handling. Extreme and erratic rain events can flush parasites that resist chlorination into water treatment and distribution systems, resulting in waterborne outbreaks (Kistemann et al., 2002; Lake et al., 2005; Semenza and Nichols, 2007).
Unfortunately, the multifactorial nature of climate change means that disentangling climatic from socioeconomic, environmental, or behavioral drivers of population health is methodologically intricate. A systematic approach, such as the cataloging and mapping of the existing state of knowledge, can help to identify associations and distinguish significant interactions from confounding ones. We took an ontological approach to comprehensively appraise the links between climate change and food- and waterborne disease. Ontology refers to the study of categories of phenomena that exist. It provides a common vocabulary for a domain (e.g., climate change) and defines, with different levels of formality, the meaning of terms and the relationships between them. In artificial intelligence it is used as a specification of conceptualization (Gruber, 1993; Munn and Smith, 2008). We developed an applied ontology that formally represents a set of concepts and vocabulary in the climate change literature to classify related variables and model interactions between them. As such, it provides a conceptual model for analyzing the relationships between climatic variables and food- and waterborne diseases.
Information was extracted from selected articles and organized and structured according to the predefined specifications of the ontology (meta-analysis). Once entered into the ontological knowledge base, the information was searched to quantify and map some of the complex relationships between food- and waterborne pathogens and meteorological variables.
METHODS
Search Strategy and Selection Criteria
Original research articles were retrieved from the PubMed and ScienceDirect bibliographic databases. The search strategies submitted combined the concepts of climate change plus climate variability with food- and waterborne diseases. The search terms were the following: (foodborne [All Fields] OR “food borne” [All Fields] OR “foodborne” [All Fields] OR waterborne [All Fields] OR “water borne” [All Fields] OR “water-borne” [All Fields]) AND (“climate change” [All Fields] OR “climate variability” [All Fields]). Searches were run for the following pathogens and their infections in humans: Campylobacter sp., Cryptosporidium sp., Listeria sp., Norovirus, Salmonella sp., and noncholera Vibrio sp. These pathogens characterize a cross-section of important food- and waterborne parasites, bacteria, and viruses. Moreover, they represent pathogens from different habitats with a range of susceptibilities to climate variables.
To enlarge and complement the number of records retrieved in the previous searches, further search strategies involved combining the concepts of food poisoning, food microbiology, water, and water microbiology with the climate change and climate variability concepts (e.g., “Salmonella food microbiology” [MeSH] OR “food microbiology” [MeSH] AND “climate” [Major], “climate change” or “climate variability”). Along the same lines, climatic concepts were sometimes included in different search strategies to broaden the number of records retrieved. Key words and MeSH terms (when available) were used in the search strategies for papers in either English or German, published between 1998 and 2009. A particular emphasis was placed on papers from Europe to support a climate change impact assessment of food- and waterborne diseases there (Semenza et al., 2011).
Climate Change Ontology
The results obtained from the literature search were prescreened for their project relevance by reviewing their titles and abstracts (Figure 1). Relevant articles were imported into a separate literature management database (End-Note; Thomson Reuters). All articles relevant to climate change and food-and waterborne diseases were entered into an online, relational knowledge base with the unique ID number as a reference prior to viewing. Each review was tagged automatically with the name of the reviewer and the review date. Using this online multiuser interface, reviewers examined the vocabulary and terms used for five thematic aspects (pathogens, food, water, climate/environment, and reservoirs) and three spatial aspects (continent, region, and country; Figure 1).
FIGURE 1.
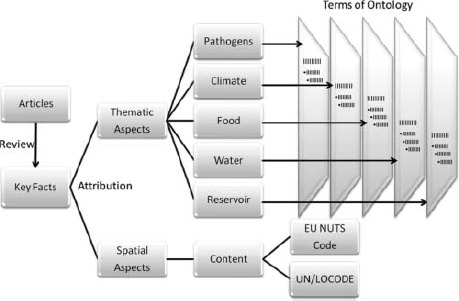
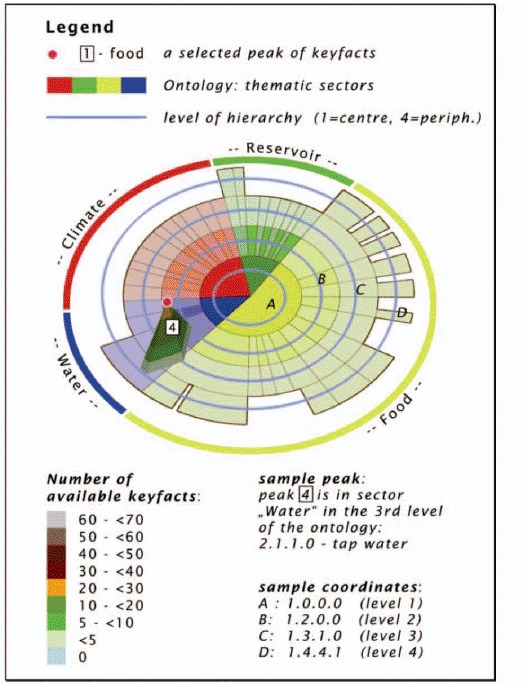
Extraction of data (key facts) and mapping of terms (vocabulary) from the peer-reviewed literature (reference sources or articles), according to predefined categories (thematic and spatial aspects) as specified by the climate change ontology for food- and water-borne diseases; 1998–2009. Articles (reference) and sources were identified through bibliographic information systems (PubMed and ScienceDirect) and reviewed by the research team. Information was extracted from articles and summarized into short and concise key facts. Each key fact was assigned to at least one of five principle groups (thematic aspects): pathogens, food, water, climate/environment, and reservoirs, and further tagged with terms from the climate change ontology. A hierarchical organization of the vocabulary (terms), accounted for increasing detail of information (see Table 1). Spatial aspects were also extracted from the articles according to continent, region, and country.
For the pathogenic aspects, subdivisions included bacteria, viruses, and protozoa according to biotaxonomy, an approved microbiological nomenclature. The six pathogens of interest to this study (Campylobacter sp., Cryptosporidium sp., Listeria sp., Norovirus, Salmonella sp., and noncholera Vibrio sp.) were sorted accordingly. Food-related terms were organized according to the Codex Alimentarius, a food ontology of the Food and Agriculture Organization of the United Nations (FAO) and the World Health Organization (WHO; http://www.codexalimentarius.net). For the remaining thematic aspects (water, climate/environment, and reservoirs) the literature was reviewed for relevant terms. These terms were subjected to rigorous screening by the expert team and integrated into the ontology after expert assessment. The ontology was updated if necessary throughout the process with new ontology terms. Rare cases of discordance between reviewers (<1%) were resolved by consensus. This formal mapping of terms constitutes the ontological approach.
Ontological Knowledge Base
Reviewers read articles retrieved from the online, relational knowledge base and short and concise key facts were extracted from these articles. Key facts were defined as any facts within an article that provided information about a relevant pathogen and its relationship to climate and climate change. They were in the form of short summaries, recorded as brief sentences or citations from the article and captured pertinent information from the study. To facilitate queries within the database, each key fact was assigned to at least one or more of the five principle groups (thematic aspects): pathogens, food, water, climate/environment, and reservoirs (Table 1; Appendix A). The key facts, consisting of short sentences, were tagged with the ontological terms (as described previously) for data mining and data mapping purposes.
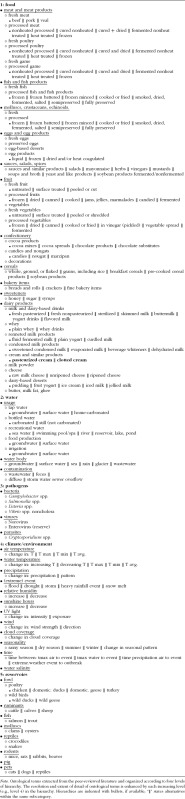
TABLE 1.
Hierarchical organization of vocabulary used in climate change ontology for food-and waterborne diseases; 1998–2009
 |
Articles could contribute key facts to as many predefined thematic aspects as relevant, as key facts represented any information about pathogen behavior in the environment or the disease itself. Thus, any one publication could provide multiple key facts (and ontological terms) with no upper limit per source. An article about Campylobacter sp. and air temperature, for example, would have been assigned the thematic aspects of pathogens and climate/environment.
The article per se was categorized according to the body of evidence, quality, and directness of inference made in the study. The body of evidence was grouped as meta-analyses, systematic reviews, randomized controlled trials, nonrandomized intervention studies, cohort, case-control studies, cross-sectional (surveys), ecological studies, case studies, in vivo experiments, in vitro experiments, molecular evidence, expert opinion, or other. These categories were not used to rank the quality of articles per se but drawn on during the interpretation of key facts.
The quality of each study was rated based on the GRADE approach (Grade Working Group, 2004; Guyatt et al., 2008). Expert reviewers were trained in the GRADE quality criteria prior to grading. Uncertainty about the directness or quality of evidence was resolved during expert meetings and the rare occasions of discordance between reviewers were resolved by consensus. The quality of evidence was influenced by the study limitations (design and size), the methodology applied, the consistency of results, the directness of evidence, precision, and reporting bias.
Articles were graded according to predefined categories: high, moderate, low, and very low quality. The criteria guiding the grading of quality were the following:
High: Further research is very unlikely to change confidence in the estimate of the effect (e.g., experimental data in a controlled laboratory setting indicating pathogen die-off after UV-exposure).
Moderate: Further research is likely to have significant impact on confidence in the effect estimate and may affect point estimates (e.g., single-case studies).
Low: Further research is very likely to have an important impact on confidence in the effect estimate and is likely to change that estimate (e.g., case studies in a complex environmental setting estimating long-term effects).
Very low: Any estimate of effect is very uncertain (e.g., opinions).
Moreover, data extracted from articles were assessed according to the degree of causal inference. An article was rated as direct to signify strong causality (e.g., a controlled experimental setting) and the practical applicability of its content to the objectives of this current analysis. Articles rated moderate indicated strong circumstantial evidence (e.g., epidemiological evidence), but data taken from these articles required cross-referencing with other studies and careful interpretation before use. Articles rated indirect did not permit causal inference and their content was only used as background information. Information in a specific article that was not pertinent to climate change and food- and waterborne diseases was not tagged with key facts or ontology terms. Entire articles not related to the subject matter were marked as not relevant; thus, every article was tagged with at least one comment.
The ontological knowledge base facilitated the search for specific ontological terms tagged to the key facts and connections between meteorological and environmental determinants and pathogens through advanced data-mining techniques, by searching for specific topics to identify information, key facts, ontology terms, quality of data, and articles for a literature review (Semenza et al., 2011).
Data Analysis
The consistency and scalable organization of information facilitated the refined retrieval of relevant information through customized queries. Summary statistics of ontology terms by pathogen or environmental determinant were generated. Relationships and interactions between factors could be analyzed according to these thematic aspects and ontological terms. To visualize the results, semantic network maps and 3D maps were created with Flash and GIS applications, as described subsequently.
Semantic network maps were created using the open source Flare library (Heer et al., 2005; UC Berkeley Visualization Lab, 2010) together with Adobe Flex (Kazoun and Lott, 2008). The source code of the Flare Dependency Graph was modified and joined with the result of an adjusted SQL request to provide data to the visual interface.
To produce the 3D maps of ontological terms in the knowledge base, a SQL request was processed in the database, which calculated the number of ontological terms that combined single thematic aspects for a selected pathogen. This computation provides the pathogen specific number of ontological terms for every thematic aspect. The results were converted into a spreadsheet where the hierarchy position was computed into polar coordinates. The result was imported into a Geographic Information System (ArcGIS, ESRI, Redlands, CA), which enabled the creation of a Triangulated Irregular Network (TIN) from the points calculated. The coordinate system chosen was the North Pole Azimuthal Equidistant, which provided a view parallel to the earth's axis. The results were then imported into 3D GIS software (ArcScene, ESRI; Kennedy, 2009) for visualization, which allowed for the adjustment of vertical exaggeration and the selection of a viewpoint.
In addition to thematic aspects, spatial aspects (e.g., outbreak location) were selected by ascribing ontological terms to one of the predefined regions, where geographical information was available in the articles. Spatial information was based on (EU-)NUTS (Regulation EC No 1059, 2003) and the United Nations Code for Trade and Transport Locations (UN/LOCODE code; Figure 1). By linking ontological terms with spatial aspects the information was mapped using a Web GIS tool on Google Maps.
RESULTS
Climate Change Ontology
We created an ontology of the climate change vocabulary for food- and waterborne diseases. The literature search identified 722 articles, which were examined for the terms and vocabulary used. Based on this review and other existing ontologies, 275 terms were chosen to populate the ontology (Table 1). The terms were selected based on the vocabulary used in the literature and organized according to five thematic aspects (pathogens, food, water, climate/environment, and reservoirs), which were further subdivided according to a hierarchy of four levels with increasing resolution of detail. For example, an article could have provided terms under the thematic aspect food according to four hierarchical categories, which were, from lowest to highest resolution: food, meat and meat products, fresh meat, and beef. This hierarchical organization is shown in Table 1 with a bulleted list of terms used. However, not all articles provided information to the highest level of detail and thus not all articles contributed to the higher resolution categories.
Ontological Knowledge Base
Information was extracted from the selected articles in the form of key facts (short concise data) and transformed into machine-readable data to enable knowledge-driven data mining (Figure 1). In total, 1,642 key facts (comprising approximately 50,000 words) were extracted from these articles; 1,625 had thematic aspects and 1,068 had spatial aspects. Key facts assigned to the terms of the ontology were allocated to the hierarchical order with four levels (bulleted list in Table 1), generating a total of 6,341 data points in the ontological knowledge base. Articles were examined carefully to determine the levels of detail provided for pathogens, food, water, climate/environment, and reservoirs, which were then assigned to the hierarchical level in Table 1. The articles were also graded according to data quality, study design, data source, and causal inference, as previously described.
Share of Climate Data Compared With Total
We summarized the number of ontological terms in the knowledge base for each pathogen by thematic aspect (food, water, climate/environment, and reservoirs) to expose potential discrepancies in frequencies. In the context of our search terms (as described previously), we computed the proportion of ontological terms from the thematic aspect climate/environment relative to all other ontological terms (Figure 2). The majority of ontological terms for noncholera Vibrio sp. (52% of the 124 total ontological terms), and 49% of ontological terms for Cryptosporidium sp. (of 190 total ontological terms) pertained to climate/environment. Thus, most of the information on these two pathogens related to climatic or environmental determinants. This proportion was smaller for the other pathogens examined: Campylobacter sp. 40% (of 453 ontological terms), Salmonella sp. 27% (of 369 ontological terms), Norovirus infection 25% (of 206 ontological terms), and Listeria sp. 8% (of 119 ontological terms). These results call attention to a discrepancy in research findings by subject matter: for Listeria sp. climatic and environmental aspects are a minor area of published research, in contrast to Vibrio sp. and Cryptosporidium sp. Because climate and climate change were required terms of our search, this discrepancy would have been even more distorted without these search requirements.
FIGURE 2.
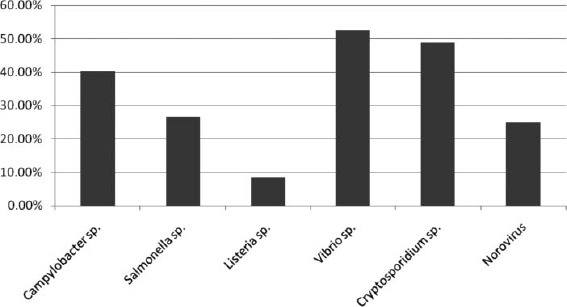
Proportion of climate/environmental terms relative to all terms by pathogen, extracted from the ontological knowledgebase for climate change and food- and waterborne diseases, 1998–2009. Absolute number of climate/environmental terms was divided by all terms available in the ontological knowledgebase for each pathogen. Total number of terms for Campylobacter: 453, Salmonella: 369, Cryptosporidium: 190, Listeria: 119, Norovirus: 206, and noncholera Vibrio: 124.
Span of Research Topics Covered
The breadth and detail of ontological terms in the ontological knowledge base was examined. Frequency distributions of ontological terms by thematic aspects and pathogens are presented in Table 2. The records of topics covered represent the breadth of research data. The table quantifies the information on determinants presently available in the ontological knowledge base; zero indicates a lack of published data (no data) in the papers reviewed. In general, the distribution of ontological terms is wider for the more prevalent pathogens with a higher diversity of different ontological terms. All pathogens have ontological terms for the more general categories (e.g., food, water, seasonality), but the ontological knowledge base can pinpoint which pathogen has ontological terms for which specific exposure pathway: specific food items (e.g., eggs, dairy, fruits) or specific water features (e.g., ground, sea, bottled water, tap water). For example, extreme climatic events (e.g., heavy precipitation, floods, storms, droughts) were associated with selected pathogens only. Hence, Table 2 is an overview of the span of research topics covered by ontological terms. However, this summary overview does not differentiate whether an association is positive (e.g., relative risk >1, increased risk) or negative (e.g., relative risk <1, protective), which is discussed in Semenza et al. (2011). The list merely quantifies the ontological terms presently in the literature.
TABLE 2.
The number of ontological terms by pathogen, for four thematic aspects: climate/environment, water, food, and reservoir; extracted from the ontological knowledge base for climate change and food- and waterborne diseases, 1998–2009
| Key facts | Campylo bacter | Salmonella | Listeria | Vibrio | Crypto sporidium | Norovirus |
|---|---|---|---|---|---|---|
| Climate/environment | ||||||
| Seasonality | 59 | 29 | 3 | 15 | 33 | 46 |
| Changes in seasonal pattern | 1 | 0 | 0 | 0 | 3 | 0 |
| Air or water temperature | 110 | 56 | 0 | 57 | 15 | 4 |
| Average and extreme temperature | 14 | 24 | 0 | 10 | 3 | 0 |
| Changes in temperature | 16 | 32 | 0 | 33 | 6 | 0 |
| Precipitation and pattern | 19 | 4 | 0 | 2 | 21 | 0 |
| Changes in precipitation | 0 | 0 | 0 | 0 | 11 | 0 |
| Heavy rainfall event | 14 | 0 | 0 | 8 | 27 | 2 |
| Flood | 2 | 2 | 0 | 1 | 4 | 2 |
| Storm | 0 | 0 | 0 | 8 | 0 | 0 |
| Drought | 1 | 0 | 0 | 0 | 3 | 0 |
| UV light | 15 | 6 | 3 | 1 | 9 | 0 |
| Changes in UV radiation exposure or intensity | 0 | 0 | 2 | 0 | 2 | 0 |
| Salinity | 0 | 0 | 0 | 22 | 1 | 0 |
| Changes in wind | 0 | 1 | 0 | 0 | 0 | 0 |
| Change in cloud coverage | 0 | 0 | 0 | 0 | 0 | 0 |
| Water | ||||||
| Surface water | 106 | 11 | 3 | 4 | 31 | 15 |
| Ground water | 14 | 2 | 0 | 0 | 4 | 5 |
| Rain | 3 | 0 | 0 | 0 | 0 | 0 |
| Seawater | 15 | 8 | 0 | 44 | 5 | 3 |
| Tap and bottled water | 41 | 3 | 0 | 0 | 21 | 26 |
| Recreational water | 10 | 3 | 0 | 3 | 8 | 1 |
| Water for food production and irrigation | 0 | 8 | 0 | 3 | 1 | 0 |
| Water contamination | 43 | 14 | 5 | 0 | 38 | 33 |
| Wastewater | 9 | 8 | 3 | 0 | 6 | 11 |
| Food | ||||||
| Meat and meat products | 51 | 50 | 23 | 1 | 2 | 1 |
| Fish and shellfisch | 12 | 10 | 13 | 54 | 1 | 12 |
| Eggs and egg products | 1 | 36 | 1 | 1 | 0 | 0 |
| Dairy products | 17 | 16 | 17 | 0 | 3 | 0 |
| Fruits and vegetables | 11 | 41 | 7 | 0 | 4 | 6 |
| Cereals and bakery items | 2 | 12 | 4 | 2 | 0 | 2 |
| Sauces, salads, spices, confectionery, sweeteners | 2 | 11 | 3 | 0 | 2 | 1 |
| Reservoirs | ||||||
| Fowl | 27 | 10 | 0 | 0 | 1 | 0 |
| Ruminants | 11 | 0 | 0 | 0 | 3 | 0 |
| Pigs | 0 | 4 | 0 | 0 | 1 | 0 |
| Pets | 3 | 10 | 0 | 0 | 1 | 0 |
| Fish | 0 | 0 | 0 | 2 | 1 | 0 |
| Mollusk | 0 | 3 | 0 | 14 | 0 | 5 |
| Reptiles | 0 | 0 | 0 | 0 | 1 | 0 |
| Rodents | 0 | 0 | 0 | 0 | 1 | 0 |
| Not specified | 6 | 2 | 0 | 1 | 9 | 0 |
Note. Not mutually exclusive categories.
Data Resolution
In the climate and water categories, Campylobacter sp. contributed the largest number of ontological terms relative to the other pathogens (Table 2). In the food category, however, Salmonella sp. had the most entries. Comparatively, these two pathogens contribute to the largest burden of foodborne disease in Europe (European Centre for Disease Prevention and Control, 2009). In contrast, less ontological terms could be derived for Listeria sp., a relatively rare disease in Europe. The quantity of data differs also across the four hierarchical levels of the ontology. The stacked list of bulleted vocabulary used is shown in Table 1, where level 4 provides the highest level of detail in the hierarchy. We analyzed the degree of detail (and resolution) by computing all ontological terms for each of the four levels of the hierarchy. The number of ontological terms by hierarchical order is summarized in Appendix B, stratified by pathogen and thematic aspects. Food aspects displayed a wider distribution across the hierarchies than did the other thematic aspects. Thus, extensive detailed information was available for food items, but only minimal detail for climate/environment aspects, which were limited to only three levels (Table 1). This lack of differentiation of the terms for climate/environment may be a reflection of limitations in the field.
Lack of Data on Change
The frequency profile of ontological terms is illustrated in 3D maps for each pathogen (Figure 3). Four thematic aspects (reservoir, food, water, climate/environment) were arranged in a circle. Ontological terms with little detail were plotted in the centre whereas ontological terms with more detail were mapped toward the periphery, according to the ontological hierarchy. The numbers of ontological terms were summed to a peak, with the elevation being proportional to the frequency. Ontological terms for Campylobacter sp. peaked with specific water (tap and surface water) and weather data (temperature); the low level resolution of food/water aspects was visible through a crater-like data ring. For Salmonella sp., the crater-like data ring for food/water ontological terms was even more pronounced and differentiated with a number of higher detail data peaks, which were available for food aspects (pork, fresh poultry, fresh eggs, and vegetables) as well.
FIGURE 3.
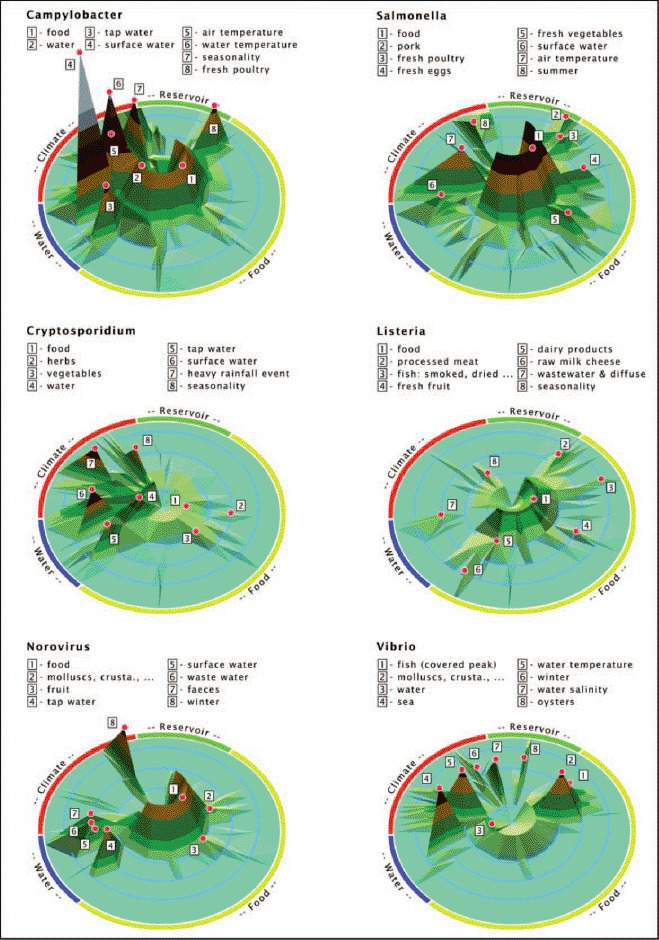
Frequency profile of terms mapped to information from the peer-reviewed literature. Terms are organized by thematic aspect and pathogen, visualized through elevation. Thematic aspects (reservoir, food, water, and climate/environment) are arranged in a circle. Elevation of a peak corresponds to the number of terms. The “crater-like” data ring in the centre represents general food and water terms with little detail. Peripheral data peaks represent terms with more detail. Terms extracted from the ontological knowledgebase for food-and water-borne diseases, 1998–2009 (Color figure available online).
Ontological terms for Cryptosporidium sp. are slanted toward climate/environment and water aspects, with no data peaks for the food or reservoir aspects, in stark contrast with the data availability for Listeria sp. with virtually all the data peaks in the food aspects. Norovirus has a similar data distribution to Listeria sp., although a few data peaks are present outside the food domain. The 3D rendering of the Vibrio sp. ontological terms is similar to the representation of the Cryptosporidium sp. ontological terms, with a skewed distribution toward climate/environment and water aspects.
Figure 3 reveals a wealth of low-resolution data for food and water determinants for most of the pathogens studied, which are visible through a crater-like data ring. No such crater-like data ring is detectable for climate/environment. Prominent weather events or food items stand out occasionally, represented by high elevation data peaks toward the periphery of the 3D map. However, no significant key fact signal, capturing a change of meteorological variables, is noticeable in Figure 3, with the exception of heavy rainfall events for Cryptosporidium sp. This observation is also supported by relatively few ontological terms in Table 2 for changes in temperature, precipitation. Thus, measurements of a changing climate and the implications of this for these pathogens are sparse.
Web of Connections
Ties between thematic aspects themselves were also visualized. Links were plotted on semantic network maps by drawing strings representing relationships (Figure 4). Specific thematic aspects (e.g., temperature) are heavily networked with other thematic aspects from other categories (e.g., food, water, seasonality). For example, the semantic network map for precipitation connects rain to certain food items (e.g., fresh and processed poultry, fish and fish products, mollusks, crustaceans) whereas air temperature is linked to others (e.g., fresh eggs, salads, fruit, vegetables). Conversely, food items can be activated and connected to pathogens and other determinants; for example, seafood was linked to all six pathogens and a number of other important environmental determinants (Appendix C). The pathogens implicated can then be identified and investigated. These semantic maps show the multivariate nature of climate change and the complex interactions with environmental determinants.
FIGURE 4.
Semantic network maps by thematic attributes; derived from the ontological knowledgebase for climate change and food- and waterborne diseases, 1998–2009. Maps to be read clockwise: thematic aspects are arranged concentrically and color-coded (food = yellow; water = blue; pathogens = pink; climate/environment = green). Precipitation and air temperature terms on the left of the circle are colored blue and initiate connections with other terms, represented with red stings linking to red terms. Gray strings in the background represent the network of all connections not activated in this view. The list of 275 terms in the ontology has been reduced for this map to approximately 140 terms due to space restrictions. The fourth level of the hierarchy was deleted for this map but the link was retained by moving it to its ancestor items at the third level (Color figure available online).
Origin of Data
The geographical location of key facts was plotted on European maps to identify where the study was conducted, where the outbreak occurred, or where the laboratory research was carried out (Figure 5). Presently, the ontological knowledge base holds 4,809 spatial attributes from the NUTS and LOCODE lists, which corresponds to 95% of all the available aspects (275 from the ontology and 4,809 from the spatial list).
FIGURE 5.
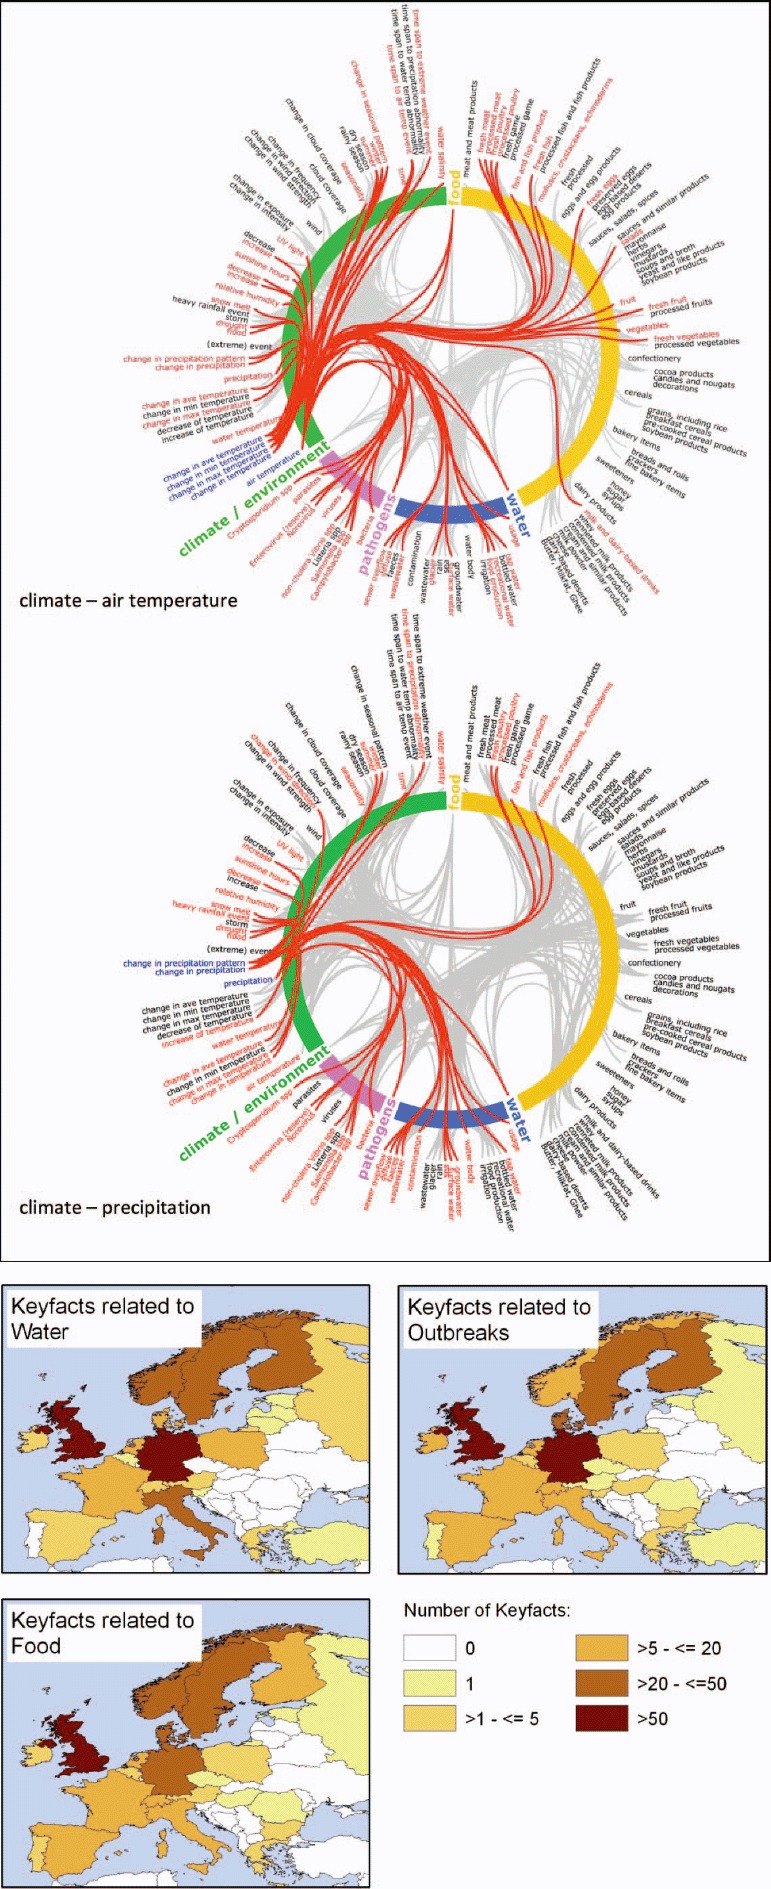
Location of data (key facts) extracted from the peer-reviewed literature, related to thematic aspects of water, food, and outbreaks by country; ontological knowledge base for climate change and food- and waterborne diseases, 1998–2009. The data (key facts) pertain to the location or origin of the extracted information, and specifically, where the study was conducted, where the outbreak occurred, or where the laboratory research was carried out. Country- and region-specific information can be extracted for further analysis (Color figure available online).
A preponderance of key facts was identified in Northern Europe, with less data from Southern and Eastern/Central Europe. The number of articles by country followed a very similar geospatial pattern to the key facts, with the majority of articles covering Salmonella sp., Campylobacter sp., and Norovirus; fewer articles were available for Cryptosporidium sp., Listeria sp., and noncholera Vibrio sp. with the same geographical gradient (data not shown).
DISCUSSION
In this paper we present an attempt to systematically scrutinize, catalog, quantify and map the present state of knowledge of recent research on climate change and food- and waterborne diseases. One limitation of the study is publication bias (Petitti, 1994). The articles retrieved were not evenly distributed throughout Europe, with north-south and west-east gradients (Figure 5). This observation is in part due to the selective retrieval of published reports in English or German from bibliographic databases, but also due to underreporting. The lack of information on climate change and these food- and waterborne diseases could pose a risk to public health, particularly at times of financial recession, which could lead to the underfunding of surveillance and control programs. National vulnerability, impact, and adaptation assessments can counteract these weaknesses by prioritizing adaptation options (European Centre for Disease Prevention and Control, 2010). This ontological knowledge base can be searched by public health practitioners conducting such an assessment to retrieve disease specific information pertaining to their country or region (Figure 5). The information can then be evaluated and subjected to a decision algorithm for adaptation options. Conversely, data mining of the ontological knowledge base may also bring to light data gaps for vulnerability, impact and adaptation assessments (European Centre for Disease Prevention and Control, 2010) that may trigger investigations or research studies into the health impacts of climate change. The subsequent discussion by environmental determinates illustrates the discrepancy between the state of climate change knowledge in other disciplines (e.g., meteorology, ecology, biology) compared with the health field.
The field of public health lags behind other disciplines in terms of climate change research. A Web of Science search of climate change publications across all disciplines (articles, proceedings papers, reviews, editorials, or news items for the period of 1990–2010) retrieved almost 9,000 publications in environmental science and over 6,000 publications in each of the disciplines of meteorology, ecology, or the geosciences. However, only 498 climate change publications were retrieved for public, environmental, or occupational health combined, a large part of which were reviews and not primary research papers. This deficiency in health information is in part a consequence of insufficient allocation of climate change funds to the health field when compared with other disciplines (Ebi et al., 2009). Presently, no rigorous quantitative models exist that project the health impacts of climate change, with the exception of heat waves and air pollution, which are relatively recent compared with the models available in agriculture that have been used for projections for more than a decade (Kristie L. Ebi,), personal communication, September 2009). The subsequent discussion juxtaposes meteorological, ecological, or biological climate change observations to the ontological terms available in the health field. This quantitative comparison of data points is complemented by a separate review of the contents of key facts (comprising approximately 50,000 words in the ontological knowledge base) to evaluate the actual evidence base (Semenza et al., 2011).
Temperature Determinants
Temperature can directly impact multiplication and more indirectly the transmission pathways of food- and waterborne diseases. The global average temperature is now 0.8°C higher than in preindustrial times (1850–1919), whereas in Europe this average is 1.4°C higher (Climate Research Unit, 2006). Conservative projections foresee a continuing upward trend in global mean air temperatures, increasing by 1.8-4.0°C this century, whereas other models suggest an increase range of 1.1–6.4°C (Intergovernmental Panel on Climate Change, 2007). The last decade was the warmest on record, with 1998 and 2005 reaching historic levels, which could potentially impact incidence rates. Campylobacter sp. and Salmonella sp. recorded the highest number of ontological terms for air temperature (32 and 41 ontological terms, respectively) compared with the other pathogens studied (Figure 3).
For water temperature, Campylobacter sp. (64 ontological terms) and noncholera Vibrio sp. (35 ontological terms) had the most key fact entries (Figure 3), presumably fresh and coastal water, respectively. Even though ocean temperatures have not increased as rapidly due to the large effective heat capacity of water, as well as heat loss from evaporation, the temperature of coastal waters has risen. The northern hemisphere has warmed faster than the southern hemisphere due to its greater land mass (World Meteorological Organization, 2008).
Temperature Change
The most dramatic increase in temperature has been recorded in the Arctic region of Europe, where temperatures have risen by 3°C over the last 90 years (Arctic Climate Impact Assessment, 2004). Northern Europe is a geographical area with a high projected temperature increase according to climate change scenarios (Schröter et al., 2005). This projected change is particularly pronounced for winter rather than summer months, with increases in the range of 8–10°C forecast by the year 2080 (Arctic Climate Impact Assessment, 2004). Southern and Central Europe are projected to experience temperature increases during the summer months of up to 6°C (Giannakopoulos et al., 2005; Räisänen et al., 2004).
These well-documented projected increases in temperature stand in contrast to the paucity of data on the potential effects of temperature changes on the pathogens evaluated in the ontological knowledge base. Explicitly ontological terms relevant to the potential effects of temperature changes were the following: changes in air temperature (38 ontological terms) as well as changes in maximum (10), minimum (2), and average temperature (19), the majority of which were for Salmonella sp. Human health impact assessments rely on exposure response relationships but the lack of data linking global warming with increased incidence rates makes projections very difficult.
Seasonality
Another aspect of global environmental change is altered seasonal patterns. Season is an important epidemiologic determinant of most food- and waterborne pathogens, with the possible exception of Listeria sp. (Semenza et al., 2011). In Europe, the spring and summer seasons have warmed the most, whereas autumn has warmed less. Observational studies in several areas of Europe have documented a lengthening of the time period between the last spring frost and the first autumn frost over recent decades (Root et al., 2003; Tait and Zheng, 2003). The arrival of spring and summer phenological events, such as the onset of the pollen season, the first flowering date of plant species, or the onset of animal breeding, advanced on average by 2.5 days per decade between 1971 and 2000 (Menzel et al., 2006). Strong seasonality signals (in ontological terms) were recorded for all pathogens studied with the exception of Listeria sp. Specifically, the seasonality of winter and summer was covered by the most ontological terms (Figure 3). However, changes in seasonal patterns were only captured by a handful of ontological terms. These seasonal shifts, which are well documented in other disciplines, leave the question open as to whether the seasonality of food- and waterborne pathogens has changed as well.
Extreme Events
Gradual changes in climate are often overshadowed by extreme weather events. Although individual events are difficult to link to climate change as a statistical phenomenon, the intensity, duration, and frequency of such extreme events can be. The ontological knowledge base lists 99 ontological terms relevant to the potential effects of extreme events on the pathogens evaluated: 51 address heavy rainfall events, 11 address floods, 4 address droughts, 6 address snowmelts, and 8 address storms (Table 2). Climate models predict that heat waves will become more common, hotter, and longer lasting (Beniston, 2004). Over the last decade, Europe has recorded historically high ambient temperatures during the summer months, notably during the 2003 heat wave, but no key fact identified heat waves explicitly in the ontological knowledge base. Similarly, droughts have increased in frequency and intensity while the number of cold spells has fallen (Giorgi et al., 2004), but they were not covered by many ontological terms. Storms are associated with strong winds capable of causing substantial land surface damage and temporary increases in sea level. Storminess over the last century has varied considerably in Europe, but in more recent years has been relatively calm (Matulla et al., 2007). Climate projections indicate an overall decrease in the number of storms, although the strengths of the strongest storms may augment.
Precipitation Determinants
Precipitation is an important environmental determinant for these pathogens, as it affects transport, survival, and transmission; Campylobacter sp. and Cryptosporidium sp. had the most ontological terms for precipitation in the ontological knowledge base (Table 2). Mean annual precipitation in Europe has changed significantly; during the 20th century, Northern Europe has witnessed a 10–40% increase, whereas Southern Europe has seen a 20% decrease in mean annual precipitation (Giorgi et al., 2004). Trends in precipitation are significantly more difficult to predict than temperature, as is reflected in the wide range of projections for different climate models and scenarios (Schröter et al., 2005). Thus, projecting health impacts is particularly challenging.
In general, precipitation in Northern Europe is projected to increase, particularly during the winter months, but decrease further in the south, mainly during the summer months. Of the pathogens studied, only Cryptosporidium sp. provided information relevant to the potential effects of changing precipitation patterns. Reductions in precipitation in parts of Mediterranean Europe may also be accompanied by longer periods of drought (Palutikof and Holt, 2004), but virtually no ontological terms were recorded for the potential effects of drought on the pathogens evaluated.
Extreme precipitation events are also projected to increase in Western and Northern Europe, but not in the south (Good et al., 2006; Palmer and Räisänen, 2002). The ontological knowledge base captured ontological terms for heavy rain events for Cryptosporidium sp. (27 terms), Campylobacter sp. (14 terms), and noncholera Vibrio sp. (8 terms; Table 2).
CONCLUSION
Analysis of ontological terms in this ontological knowledge base generated a number of pertinent observations. Data on the potential effects of climate change on food- and waterborne diseases are practically nonexistent, and ontological terms capturing the potential effects of changes in meteorological conditions are sparse. The climate/environment information presently available is characterized by data peaks representing the potential effects of individual meteorological variables or weather events on pathogens rather than climate change specifically. Thus, without data on a changing climate for exposure response relationships, projections are difficult. The data generated by the scientific community fails to be relevant and cannot be applied to model and forecast global environmental change (McMichael, 1993).
Information on several potentially important factors impacting transmission is still missing (Table 2). Although it is obvious that not all pathogens are equally climate-related, very little information on the potential impact of climatic factors on disease transmission of Listeria sp. is available to date, and it is a pathogen with increasing disease incidence. Moreover, the semantic networks between pathogens and thematic aspects illustrate a rich web of interconnections, but methods to analyze these interactions are inadequate.
In summary, we aimed to quantify available data on the potential influence of climatic and environmental variables on six food- and waterborne diseases. The ontological approach assured a comprehensive appraisal of the field, which can be extended in a consistent and methodical way in the future. Differences were evident among the pathogens examined with regard to patterns of connectivity, the proportions of climatic and environmental determinants relative to all ontological terms, and the overall extent of information concerning the potential effects of these determinants. Most striking, however, is the shortage of specific climate change data for projecting health impacts. It is particularly difficult to assess the impact of climate change because it acts as a risk multiplier and thus exacerbates existing vulnerabilities (Semenza and Giesecke, 2008). Moreover, it has been proposed that climate change will result in a shifting distribution of communicable diseases in Europe, but the multifactorial nature of this phenomenon makes it difficult to predict (Semenza and Menne, 2009). Nevertheless, information available in this ontological knowledge base can be utilized to initiate adaptation efforts. Vulnerability, impact, and adaptation assessments can help strengthen the public health infrastructure and provide cobenefits for society at large.
ACKNOWLEDGEMENTS
The authors would like to thank Ana-Belen Escriva for her help with the literature review, and Sandra Alves and Andrea Buksarova for their help with the manuscript. They are particularly grateful to Giorgio Semenza, Laszlo Balkanyi, Poul Thorsen, Frode Forland, and Helen Hanimann for their constructive feedback on the manuscript.
APPENDIX A Number of Terms in Ontological Knowledge Base
Number of terms are listed that are attributed to a thematic aspect. Subcategories are not summarized in the leading headlines
| Hierarchy | Ontology name | Number of Terms |
|---|---|---|
| 1.0.0.0 | food | 114 |
| 1.1.0.0 | meat and meat products | 16 |
| 1.1.1.0 | fresh meat | 14 |
| 1.1.1.1 | beef | 7 |
| 1.1.1.2 | pork | 18 |
| 1.1.1.3 | veal | 1 |
| 1.1.2.0 | processed meat | 22 |
| 1.1.2.1 | nonheated processed | 3 |
| 1.1.2.2 | cured nonheated | 0 |
| 1.1.2.3 | cured and dried | 1 |
| 1.1.2.4 | fermented nonheat treated | 2 |
| 1.1.2.5 | heat treated | 7 |
| 1.1.2.6 | frozen | 1 |
| 1.1.3.0 | fresh poultry | 56 |
| 1.1.4.0 | processed poultry | 20 |
| 1.1.4.1 | nonheated processed | 0 |
| 1.1.4.3 | cured nonheated | 0 |
| 1.1.4.4 | cured and dried | 0 |
| 1.1.4.5 | fermented nonheat treated | 0 |
| 1.1.4.6 | heat treated | 3 |
| 1.1.4.7 | frozen | 0 |
| 1.1.5.0 | fresh game | 0 |
| 1.1.6.0 | processed game | 0 |
| 1.1.6.1 | nonheated processed | 0 |
| 1.1.6.2 | cured nonheated | 0 |
| 1.1.6.3 | cured and dried | 0 |
| 1.1.6.4 | fermented nonheat treated | 0 |
| 1.1.6.5 | heat treated | 0 |
| 1.1.6.6 | frozen | 0 |
| 1.2.0.0 | fish and fish products | 34 |
| 1.2.1.0 | fresh fish | 12 |
| 1.2.2.0 | processed fish and fish products | 2 |
| 1.2.2.1 | frozen | 0 |
| 1.2.2.2 | frozen battered | 0 |
| 1.2.2.3 | frozen minced | 1 |
| 1.2.2.4 | cooked or fried | 0 |
| 1.2.2.5 | smoked, dried, fermented, salted | 5 |
| 1.2.2.6 | semipreserved | 0 |
| 1.2.2.7 | fully preserved | 0 |
| 1.3.0.0 | molluscs, crustaceans, echinoderms | 64 |
| 1.3.1.0 | fresh | 14 |
| 1.3.2.0 | processed | 0 |
| 1.3.2.1 | frozen | 0 |
| 1.3.2.2 | frozen battered | 0 |
| 1.3.2.3 | frozen minced | 0 |
| 1.3.2.4 | cooked or fried | 1 |
| 1.3.2.5 | smoked, dried, fermented, salted | 0 |
| 1.3.2.6 | semipreserved | 0 |
| 1.3.2.7 | fully preserved | 0 |
| 1.4.0.0 | eggs and egg products | 21 |
| 1.4.1.0 | fresh eggs | 18 |
| 1.4.2.0 | preserved eggs | 0 |
| 1.4.3.0 | egg-based deserts | 2 |
| 1.4.4.0 | egg products | 1 |
| 1.4.4.1 | liquid | 0 |
| 1.4.4.2 | frozen | 0 |
| 1.4.4.3 | dried and/or heat coagulated | 1 |
| 1.5.0.0 | sauces, salads, spices | 7 |
| 1.5.1.0 | sauces and similar products | 3 |
| 1.5.2.0 | salads | 10 |
| 1.5.3.0 | mayonnaise | 0 |
| 1.5.4.0 | herbs | 4 |
| 1.5.5.0 | vinegars | 0 |
| 1.5.6.0 | mustards | 0 |
| 1.5.7.0 | soups and broth | 0 |
| 1.5.8.0 | yeast and like products | 0 |
| 1.5.9.0 | soybean products | |
| fermented/nonfermented | 0 | |
| 1.6.0.0 | fruit | 21 |
| 1.6.1.0 | fresh fruit | 19 |
| 1.6.1.1 | untreated | 5 |
| 1.6.1.2 | surface treated | 1 |
| 1.6.1.3 | peeled or cut | 0 |
| 1.6.2.0 | processed fruits | 0 |
| 1.6.2.1 | frozen | 0 |
| 1.6.2.2 | dried | 0 |
| 1.6.2.3 | canned | 0 |
| 1.6.2.4 | cooked | 0 |
| 1.6.2.5 | jams, jellies, marmalades | 0 |
| 1.6.2.6 | candied | 0 |
| 1.6.2.7 | fermented | 1 |
| 1.7.0.0 | vegetables | 25 |
| 1.7.1.0 | fresh vegetables | 22 |
| 1.7.1.1 | untreated | 5 |
| 1.7.1.2 | surface treated | 2 |
| 1.7.1.3 | peeled or shredded | 0 |
| 1.7.2.0 | processed vegetables | 0 |
| 1.7.2.1 | frozen | 0 |
| 1.7.2.2 | dried | 1 |
| 1.7.2.3 | canned | 0 |
| 1.7.2.4 | cooked or fried | 1 |
| 1.7.2.5 | in vinegar (pickled) | 0 |
| 1.7.2.6 | vegetable spread | 0 |
| 1.7.2.7 | fermented | 0 |
| 1.8.0.0 | confectionery | 0 |
| 1.8.1.0 | cocoa products | 1 |
| 1.8.1.1 | cocoa mixes | 0 |
| 1.8.1.2 | cocoa spreads | 0 |
| 1.8.1.3 | chocolate products | 4 |
| 1.8.1.4 | chocolate substitutes | 0 |
| 1.8.2.0 | candies and nougats | 0 |
| 407 | ||
| Hierarchy | Ontology name | Number of Terms |
| 1.8.2.1 | candies | 0 |
| 1.8.2.2 | nougat | 0 |
| 1.8.2.3 | marzipan | 0 |
| 1.8.3.0 | decorations | 0 |
| 1.9.0.0 | cereals | 0 |
| 1.9.1.0 | whole, ground, or flaked grains, including rice | 5 |
| 1.9.2.0 | breakfast cereals | 0 |
| 1.9.3.0 | pre-cooked cereal products | 0 |
| 1.9.4.0 | soybean products | 0 |
| 1.10.0.0 | bakery items | 19 |
| 1.10.1.0 | breads and rolls | 1 |
| 1.10.2.0 | crackers | 0 |
| 1.10.3.0 | fine bakery items | 2 |
| 1.11.0.0 | sweeteners | 0 |
| 1.11.1.0 | honey | 0 |
| 1.11.2.0 | sugar | 0 |
| 1.11.3.0 | syrups | 0 |
| 1.12.0.0 | dairy products | 22 |
| 1.12.1.0 | milk and dairy-based drinks | 6 |
| 1.12.1.1 | fresh pasteurized | 1 |
| 1.12.1.2 | fresh nonpasteurized | 11 |
| 1.12.1.3 | sterilized | 0 |
| 1.12.1.4 | skimmed milk | 1 |
| 1.12.1.5 | buttermilk | 0 |
| 1.12.1.6 | yogurt drinks | 0 |
| 1.12.1.7 | flavored milk | 0 |
| 1.12.2.0 | whey | 0 |
| 1.12.2.1 | plain whey | 0 |
| 1.12.2.2 | whey drinks | 0 |
| 1.12.3.0 | renneted milk products | 0 |
| 1.12.3.1 | fluid fermented milk | 0 |
| 1.12.3.2 | plain yogurt | 0 |
| 1.12.3.3 | curdled milk | 0 |
| 1.12.4.0 | condensed milk products | 0 |
| 1.12.4.1 | sweetened condensed milk | 0 |
| 1.12.4.2 | evaporated milk | 0 |
| 1.12.4.3 | beverage whiteners | 0 |
| 1.12.4.4 | dehydrated milk | 0 |
| 1.12.5.0 | cream and similar products | 1 |
| 1.12.5.1 | pasteurized cream | 0 |
| 1.12.5.2 | clotted cream | 0 |
| 1.12.6.0 | milk powder | 2 |
| 1.12.7.0 | cheese | 8 |
| 1.12.7.1 | raw milk cheese | 6 |
| 1.12.7.2 | unripened cheese | 0 |
| 1.12.7.3 | ripened cheese | 4 |
| 1.12.8.0 | dairy-based deserts | 0 |
| 1.12.8.1 | pudding | 0 |
| 1.12.8.2 | fruit yogurt | 0 |
| 1.12.8.3 | ice cream | 0 |
| 1.12.8.4 | iced milk | 0 |
| 1.12.8.5 | jellied milk | 0 |
| 1.12.9.0 | Butter, Milkfat, Ghee | 4 |
| 2.0.0.0 | water | 73 |
| 2.1.0.0 | usage | 18 |
| 2.1.1.0 | tap water | 110 |
| 2.1.1.1 | groundwater | 6 |
| 2.1.1.2 | surface water | 7 |
| 2.1.1.3 | carbonized at home | 0 |
| 2.1.2.0 | bottled water | 4 |
| 2.1.2.1 | carbonated | 0 |
| 2.1.2.2 | still (not carbonated) | 0 |
| 2.1.3.0 | recreational water | 16 |
| 2.1.3.1 | sea water | 8 |
| 2.1.3.2 | swimming pool/spa | 7 |
| 2.1.3.3 | river | 2 |
| 2.1.3.4 | reservoir, lake, pond | 2 |
| 2.1.4.0 | food production | 5 |
| 2.1.4.1 | ground water | 0 |
| 2.1.4.2 | surface water | 0 |
| 2.1.5.0 | irrigation | 9 |
| 2.1.5.1 | groundwater | 0 |
| 2.1.5.2 | surface water | 1 |
| 2.2.0.0 | water body | 16 |
| 2.2.1.0 | groundwater | 46 |
| 2.2.2.0 | surface water | 188 |
| 2.2.3.0 | sea | 87 |
| 2.2.4.0 | rain | 3 |
| 2.2.5.0 | glacier | 2 |
| 2.2.6.0 | wastewater | 19 |
| 2.3.0.0 | contamination | 50 |
| 2.3.1.0 | wastewater | 47 |
| 2.3.2.0 | feces | 51 |
| 2.3.3.0 | diffuse | 21 |
| 2.3.4.0 | stormwater/sewer overflow | 28 |
| 3.0.0.0 | pathogens | 136 |
| 3.1.0.0 | bacteria | 50 |
| 3.1.1.0 | Campylobacter spp. | 453 |
| 3.1.2.0 | Salmonella spp. | 369 |
| 3.1.3.0 | Listeria spp. | 119 |
| 3.1.4.0 | Vibrio spp. noncholera | 124 |
| 3.2.0.0 | viruses | 31 |
| 3.2.1.0 | Norovirus | 206 |
| 3.2.2.0 | Enterovirus (reserve) | 16 |
| 3.3.0.0 | parasites | 10 |
| 3.3.1.0 | Cryptosporidium spp. | 190 |
| 4.0.0.0 | climate/environment | 35 |
| 4.1.0.0 | air temperature | 82 |
| 4.1.1.0 | change in temperature (increase/decrease) | 47 |
| 4.1.2.0 | change in maximum temperature (increase/decrease) | 11 |
| 4.1.3.0 | change in minimum temperature (increase/decrease) | 2 |
| 4.1.4.0 | change in average temperature (increase/decrease) | 22 |
| 409 | ||
| Hierarchy | Ontology name | Number of Terms |
| 4.2.0.0 | water temperature | 126 |
| 4.2.1.0 | change in increase of temperature (increase/decrease) | 11 |
| 4.2.2.0 | change in decrease of temperature (increase/decrease) | 1 |
| 4.2.3.0 | change in maximum temperature (increase/decrease) | 8 |
| 4.2.4.0 | change in minimum temperature (increase/decrease) | 0 |
| 4.2.5.0 | change in average temperature (increase/decrease) | 7 |
| 4.3.0.0 | precipitation | 59 |
| 4.3.1.0 | change in precipitation (increase/decrease) | 13 |
| 4.3.3.0 | change in precipitation pattern | 9 |
| 4.4.0.0 | (extreme) event | 4 |
| 4.4.1.0 | flood | 19 |
| 4.4.2.0 | drought | 5 |
| 4.4.3.0 | storm | 8 |
| 4.4.4.0 | heavy rainfall event | 74 |
| 4.4.5.0 | snow melt | 6 |
| 4.5.0.0 | relative humidity | 25 |
| 4.5.1.0 | increase | 2 |
| 4.5.2.0 | decrease | 2 |
| 4.6.0.0 | sunshine hours | 12 |
| 4.6.1.0 | increase | 4 |
| 4.6.2.0 | decrease | 0 |
| 4.7.0.0 | UV light | 37 |
| 4.7.1.0 | change in intensity | 2 |
| 4.7.2.0 | change in exposure | 4 |
| 4.8.0.0 | wind | 3 |
| 4.8.1.0 | change in wind strength | 0 |
| 4.8.2.0 | change in wind direction | 1 |
| 4.8.3.0 | change in frequency | 0 |
| 4.9.0.0 | cloud coverage | 1 |
| 4.9.1.0 | change in cloud coverage | 0 |
| 4.10.0.0 | seasonality | 104 |
| 4.10.1.0 | rainy season | 5 |
| 4.10.2.0 | dry season | 2 |
| 4.10.3.0 | summer | 55 |
| 4.10.4.0 | winter | 56 |
| 4.10.5.0 | change in seasonal pattern | 10 |
| 4.11.0.0 | time | 4 |
| 4.11.1.0 | time span between air temperature abnormality and event | 6 |
| 4.11.2.0 | time span between water temperature abnormality and event | 0 |
| 4.11.3.0 | time span between precipitation abnormality and event | 1 |
| 4.11.4.0 | time span between extreme weather event and pathogen/disease/outbreak | 2 |
| 4.12.0.0 | water salinity | 28 |
| 5.0.0.0 | reservoirs | 16 |
| 5.1.0.0 | fowl | 2 |
| 5.1.1.0 | poultry | 11 |
| 5.1.1.1 | chicken | 20 |
| 5.1.1.2 | domesticated ducks | 0 |
| 5.1.1.3 | domesticated geese | 0 |
| 5.1.1.4 | turkey | 1 |
| 5.1.2.0 | wild birds | 4 |
| 5.1.2.1 | wild ducks | 0 |
| 5.1.2.2 | wild geese | 0 |
| 5.2.0.0 | ruminants | 1 |
| 5.2.1.0 | cattle | 9 |
| 5.2.2.0 | calve | 1 |
| 5.2.3.0 | sheep | 3 |
| 5.3.0.0 | fish | 4 |
| 5.3.1.0 | salmon | 0 |
| 5.3.2.0 | trout | 0 |
| 5.4.0.0 | mollusks | 9 |
| 5.4.1.0 | clams | 0 |
| 5.4.2.0 | oysters | 10 |
| 5.5.0.0 | reptiles | 1 |
| 5.5.1.0 | crocodiles | 0 |
| 5.5.2.0 | snakes | 0 |
| 5.6.0.0 | rodents | 1 |
| 5.6.1.0 | mice, rats | 0 |
| 5.6.2.0 | rabbits, beaver, … | 0 |
| 5.7.0.0 | pig | 5 |
| 5.8.0.0 | pets | 2 |
| 5.8.1.0 | cats | 3 |
| 5.8.2.0 | dogs | 3 |
| 5.8.3.0 | reptiles | 9 |
APPENDIX B Number of Terms, by Hierarchical Level (x∗.0.0.0)
The number of terms was stratified by pathogen and thematic aspect and extracted from the ontological knowledgebase for climate change and food-and waterborne diseases, 1998–2009
Numbers of terms for each hierarchical level represent the level of detail available for a certain thematic aspect
| Campylobacter | Salmonella | Listeria | Vibrio | Cryptosporidium | Norovirus | |
|---|---|---|---|---|---|---|
| Climate/environment | ||||||
| 4.0.0.0 | 5 | 5 | 3 | 1 | 6 | 1 |
| 4.x.0.0 | 136 | 56 | 5 | 44 | 44 | 14 |
| 4.x.x.0 | 45 | 48 | 2 | 31 | 48 | 37 |
| Food | ||||||
| 1.0.0.0 | 27 | 40 | 11 | 5 | 3 | 27 |
| 1.x.0.0 | 29 | 42 | 15 | 40 | 6 | 13 |
| 1.x.x.0 | 47 | 77 | 28 | 16 | 4 | 7 |
| 1.x.x.x | 14 | 40 | 20 | 1 | 1 | 1 |
| Water | ||||||
| 2.0.0.0 | 27 | 6 | 1 | 6 | 14 | 9 |
| 2.x.0.0. | 29 | 2 | 0 | 0 | 20 | 6 |
| 2.x.x.0 | 171 | 35 | 5 | 45 | 66 | 54 |
| 2.x.x.x | 8 | 0 | 0 | 3 | 9 | 1 |
| Reservoirs | ||||||
| 5.0.0.0 | 10 | 3 | 0 | 0 | 1 | 0 |
| 5.x.0.0 | 1 | 8 | 0 | 7 | 1 | 5 |
| 5.x.x.0 | 25 | 10 | 0 | 10 | 1 | 0 |
| 5.x.x.x | 12 | 9 | 0 | 0 | 0 | 0 |
Note. x∗ = any subcategory >0. Four levels of hierarchy are presented except for climate/environment although only three hierarchical levels were available. The distribution for food terms is rather wide but much narrower for water and reservoir terms, which peak at hierarchy level 3.
REFERENCES
- Arctic Climate Impact Assessment. Impacts of a warming Arctic: Arctic climate impact assessment. Cambridge, England: Cambridge University Press; 2004. [Google Scholar]
- Barbeau D. N., Grimsley L. F., White L. E., El-Dahr J. M., Lichtveld M. Mold exposure and health effects following hurricanes Katrina and Rita. Ann. Rev. Public Health. 2010;31:165–178. doi: 10.1146/annurev.publhealth.012809.103643. [DOI] [PubMed] [Google Scholar]
- Beniston M. The 2003 heat wave in Europe: A shape of things to come? An analysis based on Swiss 48 climatological data and model simulations. Geophys. Res. Lett. 2004;31:L02202. [Google Scholar]
- Climate Research Unit. Information sheets. 2006. Retrieved from http://www.cru.uea.ac.uk/cru/info/warming/
- Ebi K. L., Balbus J., Kinney P. L., Lipp E., Mills D., O'Neill M. S., Wilson M. L. U.S. Funding is insufficient to address the human health impacts of and public health responses to climate variability and change. Environ. Health Perspect. 2009;117:857–862. doi: 10.1289/ehp.0800088. [DOI] [PMC free article] [PubMed] [Google Scholar]
- European Centre for Disease Prevention and Control. Annual epidemiological report on communicable diseases in Europe 2009. Stockholm, Sweden: European Centre for Disease Prevention and Control; 2009. [Google Scholar]
- European Centre for Disease Prevention and Control. Handbook for national vulnerability, impact and adaptation. Assessments on climate change and communicable diseases. 2010. Retrieved from http://ecdc.europa.eu/en/publications/Publications/1003_TED_handbook_climatechange.pdf.
- Giannakopoulos C., Bindi M., Moriondo M., LeSager P., Tin T. Climate change impacts in the Mediterranean resulting from a 2°C global temperature rise. 2005. Retrieved from http://mediterranean.panda.org/publications/?21632/Climate-change-impacts-in-the-Mediterranean-resulting-from-a-2-degrees-C-global-temperature-rise.
- Giorgi F., Bi X., Pal J. Mean inter-annual variability and trends in a regional climate change experiment over Europe. I. Present day climate (1961–2000) Climate Dynamics. 2004;22:733–756. [Google Scholar]
- Good P., Barring L., Giannakopoulos C., Holt T., Palutikof J. Nonlinear regional relationships between climate extremes and annual mean temperatures in model projections for 1961–2009 over Europe. Climate Research. 2006;31(1):19–34. [Google Scholar]
- Grade Working Group. Grading quality of evidence and strength of recommendations. BMJ. 2004;328:1490–1494. doi: 10.1136/bmj.328.7454.1490. Retrieved from http://bmj.bmjjournals.com/cgi/reprint/328/7454/1490.pdf. [DOI] [PMC free article] [PubMed] [Google Scholar]
- Gruber T. R. A translation approach to portable ontologies. Knowledge Acquisition. 1993;5:199–220. [Google Scholar]
- Guyatt G. H., Oxman A. D., Vist G., Kunz R., Falck-Ytter Y., Alonso-Coello P., Schünemann H. J. for the GRADE Working Group. Rating quality of evidence and strength of recommendations. GRADE: an emerging consensus on rating quality of evidence and strength of recommendations. BMJ. 2008;336:924–926. doi: 10.1136/bmj.39489.470347.AD. Retrieved from http://www.gradeworkinggroup.org/publications/GRADE-1BMJ2008.pdf. [DOI] [PMC free article] [PubMed] [Google Scholar]
- Hajat S., Ebi K. L., Kovats S., Menne B., Edwards S., Haines A. The human health consequences of flooding in Europe and the implications for public health: A review of the literature. Applied Environmental and Science Public Health. 2003;1:13–21. [Google Scholar]
- Heer J., Card S. K., Landay J. A. Prefuse: A toolkit for interactive information visualization. Proceedings of the SIGCHI Conference on Human Factors in Computing Systems. 2005. pp. 421–430.
- Intergovernmental Panel on Climate Change. Fourth assessment report. 2007. Retrieved from http://www.ipcc.ch/pdf/assessment-report/ar4/syr/ar4_syr_spm.pdf.
- Kazoun C., Lott J. Programming Flex 3: The comprehensive guide to creating rich media applications with Adobe Flex. Sebastopol, CA: O'Reilly Media; 2008. [Google Scholar]
- Kennedy H. Introduction to 3D data: Modeling with ArcGIS 3D Analyst and Google Earth. Hoboken, NJ: Wiley; 2009. [Google Scholar]
- Kistemann T., Classen T., Koch C., Dangendorf F., Fischeder R., Gebel J., Vacata V., Exner M. Microbial load of drinking water reservoir tributaries during extreme rainfall and runoff. Appl. Environ. Microbiol. 2002;68:2188–2197. doi: 10.1128/AEM.68.5.2188-2197.2002. [DOI] [PMC free article] [PubMed] [Google Scholar]
- Lake I. R., Bentham G., Kovats R. S., Nichols G. L. Effects of weather and river flow on cryptosporidiosis. J. Water Health. 2005;3:469–474. doi: 10.2166/wh.2005.048. [DOI] [PubMed] [Google Scholar]
- Matulla C., Schroder W., Alexandersson H., von Storch H., Wang X. L. European storminess: Late nineteenth century to present. Climate Dynamics. 2007;31:125–130. [Google Scholar]
- McMichael A. J. Global environmental change and human population health: a conceptual and scientific challenge for epidemiology. Int. J. Epidemiol. 1993;22(1):1–8. doi: 10.1093/ije/22.1.1. [DOI] [PubMed] [Google Scholar]
- Menzel A., Sparks T. H., Estrella N., Koch E., Aasa A., Ahas R., et al. European phenological response to climate change matches the warming pattern. Global Change Biology. 2006;12:1–8. [Google Scholar]
- Munn K., Smith B. Applied ontology and introduction. Heusenstamm, Germany: Ontos Verlag; 2008. [Google Scholar]
- Palmer T. N., Räisänen J. Quantifying the risk of extreme seasonal precipitation events in a changing climate. Nature. 2002;415(6871):512–54. doi: 10.1038/415512a. [DOI] [PubMed] [Google Scholar]
- Palutikof J. P., Holt T. Climate change and the occurrence of extremes: some implications for the Mediterranean Basin. In: Marquina A., editor. Environmental challenges in the Mediterranean 2000–2050. Amsterdam, the Netherlands: Kluwer Academic; 2004. pp. 61–73. (Chapter 4. [Google Scholar]
- Petitti D. B. Meta-analysis, decision analysis, and cost effectiveness analysis: methods for quantitative synthesis in medicine. New York, NY: Oxford University Press; 1994. [Google Scholar]
- Räisänen J., Hansson U., Ullerstig A., Döscher R., Graham L. P., Jones C., Meier H. E. M., Samuelsson P., Willén U. European climate in the late twenty-first century: regional simulations with two driving global models and two forcing scenarios. Climate Dynamics. 2004;22(1):13–31. [Google Scholar]
- European Parliament. Regulation (EC) No 1059/2003 of the European Parliament and of the Council of 26 May 2003 on the establishment of a common classification of territorial units for statistics (NUTS) 2003.
- Root T. L., Price J. T., Hall K. R., Schneider S. H., Rosenzweig C., Pounds J. A. Fingerprints of global warming on wild animals and plants. Nature. 2003;421:57–60. doi: 10.1038/nature01333. [DOI] [PubMed] [Google Scholar]
- Schröter D., Cramer W., Leemans R., Prentice I. C., Araújo M. B., Arnell N. W., et al. Ecosystem service supply and vulnerability to global change in Europe. Science. 2005;310(5752):1333–1337. doi: 10.1126/science.1115233. [DOI] [PubMed] [Google Scholar]
- Semenza J. C., Giesecke J. Intervening to reduce inequalities in infections in Europe. Am. J. Public Health. 2008;98:787–792. doi: 10.2105/AJPH.2007.120329. [DOI] [PMC free article] [PubMed] [Google Scholar]
- Semenza J. C., Herbst S., Rechenburg A., Suk J. E., Höser C., Schreiber C., Kistemann T. Climate change impact assessment on food and waterborne diseases. Crit. Rev. Env. Sci. Tech. 2011. (in press). DOI: 10/1080/10643389.2010.534706. [DOI] [PMC free article] [PubMed]
- Semenza J. C., McCullough J., Flanders D. W., McGeehin M. A., Lumpkin J. R. Excess hospital admissions during the 1995 heat wave in Chicago. Am. J. Prev Med. 1999;16:269–277. doi: 10.1016/s0749-3797(99)00025-2. [DOI] [PubMed] [Google Scholar]
- Semenza J. C., Menne B. Climate change and infectious diseases in Europe. Lancet. 2009;9:365–375. doi: 10.1016/S1473-3099(09)70104-5. [DOI] [PubMed] [Google Scholar]
- Semenza J. C., Nichols G. Cryptosporidiosis surveillance and waterborne outbreaks in Europe. Euro. Surveill. 2007;12(5):E13–E14. doi: 10.2807/esm.12.05.00711-en. [DOI] [PubMed] [Google Scholar]
- Semenza J. C., Rubin H. C., Falter K. H., Selanikio J. D., Flanders D. W., Wilhelm J. L. Risk factors for heat-related mortality during the July 1995 heat wave in Chicago. New Eng. J. Med. 1996;335:84–90. doi: 10.1056/NEJM199607113350203. [DOI] [PubMed] [Google Scholar]
- Tait A., Zheng X. Mapping frost occurrence using satellite data. J. Appl. Meteorol. 2003;42:193–203. [Google Scholar]
- UC Berkeley Visualization Lab. Flare: Data visualization for the web: Flare dependency graph. 2010. Retrieved from http://flare.prefuse.org/
- United Nations Framework Convention on Climate Change. Framework Convention on Climate Change, Article 1. 2007. Retrieved from http://unfccc.int/2860.php.
- World Meteorological Organization. Annual statements on the status of the global climate. 2008. WMO-No. 1039. Retrieved from http://www.wmo.int/pages/prog/wcp/wcdmp/documents/WMO1039_EN_web.pdf.