

Abstract
The WASF3 gene promotes invasion and metastasis in breast cancer cells which have undergone epithelial-to-mesenchyme transition (EMT). Overexpression of WASF3 in cells that do not show EMT increases their invasion potential as a result of increased ZEB1/2 levels which specifically suppress the anti-invasion chromosome 1 miR-200a/ 200b/429 cluster. ZEB1/2 upregulation by WASF3 results from downregulation of KISS1, leading to release of inhibition of NFκB by IκBα. We further show that ZEB1 expression is regulated by the NFκB transcription factor. Knockdown of WASF3 in breast cancer cells leads to reduced ZEB1 levels and increased miR-200 and E-cadherin levels, resulting in loss of invasion potential. The central regulation of this interactive pathway by WASF3 accounts for the increased invasion associated with increased WASF3 expression seen in aggressive breast cancer cells. WASF3, therefore, is a potential target to suppress invasion and metastasis in breast cancer cells.
Keywords: Breast cancer, Metastasis, Invasion, KISS1, WASF3, ZEB1
INTRODUCTION
Metastasis is one of the final stages of tumor progression that is responsible for the majority of cancer deaths and numerous examples of genes and molecular pathways that facilitate invasion have been described. Some of the key events that promote the metastasis/invasion process include enhanced ligand receptor signaling (1,2,3), upregulation of matrix metalloproteinases (4), inactivation of metastasis suppressor genes (5,6) and overexpression of mutant oncogenes (7,8). While it is generally accepted that the metastasis process involves disregulation of multiple individual events, often in a cell context specific manner, there are also examples of master regulators of the process which, when activated or inactivated, lead to increased or decreased invasion and metastasis. We recently described the WASF3 gene which, when inactivated, leads to loss of invasion and metastasis independently of other genetic defects in the cell (9,10,11,12).
WASF3 is a member of the Wiskott-Aldrich family of proteins (13) that contain motifs at the C-terminal end and which, upon activation, engages the ARP2/3 complex which facilitates actin polymerization (14,15). This process leads to reorganization of the actin cytoskeleton and increased cell movement through increased lamellipodia formation (9) and invasion through activation of matrix metalloproteinases (MMP) (10). Activation of WASF3 is required for invasion and lamellipodia formation in breast cancer cells, which is achieved to some extent through its phosphorylation by ABL kinase (16). In our previous studies we demonstrated that WASF3 can influence invasion by suppressing the function of the KISS1 metastasis suppressor gene (6). Upregulation of WASF3 led to down regulation of KISS1, which released the inhibitory effect of IκBα on NFκB, leading to its nuclear localization which in turn led to activation of pro-invasion genes such as various MMPs. Thus, WASF3 appears to have a profound influence on the invasion/metastasis process, independently of the genetic background of the tumor cell.
It has recently been shown that various microRNAs (miRNAs or miRs) are associated specifically with the invasion/metastasis phenotype, which have been described as the ‘metastamir’ (17) because regulation of their expression can lead to increased or reduced invasion (17,18,19,20). It is presumed that these miRNAs act on specific target genes which influence the invasion phenotypes. To investigate whether the disregulation of WASF3 expression influenced the metastamir in breast cancer cells, we investigated changes in the cellular miRNA expression profile as a consequence of overexpressing WASF3 in poorly metastatic breast cancer cell lines. We now demonstrate that significant reduction in WASF3 protein levels leads to changes in expression of a wide variety of miRNAs and, in particular, downregulation of specific members of the miR200 family which have been associated with the promotion of invasion. We now demonstrate that this effect is mediated through the direct upregulation of ZEB1/2 by NFκB which has been activated due to release of its suppression by the influence of KISS1 on the IκBα repression of NFκB activation.
RESULTS
Overexpression of WASF3 results in increased invasive potential and loss of cell-cell adhesion in human epithelial breast cancer cells
Loss of invasion is associated with knockdown of WASF3 in cells that express high levels of WASF3 (9,12). Lentiviral mediated overexpression of WASF3 in the MCF7 and T47D breast cancer cell lines, which show low, or no, expression (Figure 1A and 1B) led to increased motility (Figure S1) and increased invasion (Figure 1D), but did not affect cell proliferation (Figure S2) compared with the control cells transfected with the empty vector. WASF3 overexpression did not affect expression levels of the other WASF family members, WASF1 or WASF2 (Figure 1C) in T47D cells that were null for endogenous WASF3 expression. Initiation of invasion/metastasis involves a loss of cell-cell adhesion and an increase in cell motility and invasion. Loss of cell adhesion in MCF7 and T47D cells following WASF3 overexpression was demonstrated using the hanging drop dispersion assay (Figure 1E). Loss of cell-cell adhesion of cancer cells is typically mediated by repression of E-cadherin, and western blot analysis demonstrated that the breast cancer cells overexpressing WASF3 show significantly reduced levels of E-cadherin (Figure S3).
Figure 1.

Western blot analysis demonstrates relative WASF3 levels in five breast cancer cell lines (A). Overexpression of WASF3 (W3) in T47D and MCF7 (B) shows increased protein levels relative to cells carrying the empty vector (EV). This overexpression of WASF3 does not affect endogenous levels of the other two WASF family members (C) compared with parental (WT) or EV carrying cells. Transwell assays (D) demonstrate increased invasion of cells (left) where quantitation shows a significant difference (right, data are represented as mean ± SEM of three independent experiments, * p = <0.05) between cells overexpressing WASF3 and WT and EV controls. In (E) the increased invasion potential of T47D and MCF7 cells overexpressing WASF3 is confirmed, independently, using colony dispersion in the hanging drop aggregation assay compared with controls and quantitation shows more single cells were observed when WASF3 was overexpressed (right). Data are represented as mean ± SEM of three independent experiments, * p = <0.05 and ** p = <0.01.
WASF3 down-regulates Chr1-miR-200s in breast cancer cells
Altered expression of WASF3 has significant effects on the global gene expression profile in breast cancer cells (6) and impacts on different signaling pathways. To investigate the consequences of upregulation of WASF3 on miRNA expression levels, we used Affymetrix miRNA microarrays to determine miRNA expression levels in T47D cells overexpressing WASF3 compared with cells expressing the empty vector. This unbiased analysis showed altered expression levels of many miRNAs (Figure 2A), including two well-known metastasis-promoting ‘metastamirs’ in breast cancer, miR-373 and miR-10b, which were up-regulated (Figure 2A–B). In contrast, upregulation of WASF3 led to suppression of the miR-200a, 200b and 429 members of the miR-200 family.
Figure 2.

(A) Identity of miRNAs showing > 2-fold change following microarray analysis in T47D cells overexpressing WASF3 and those affected that are reported to be involved in metastasis are summarized in (B). QRT-PCR analysis shows that upregulation of WASF3 in T47D and MCF7 cells (C) leads to a significant down regulation of the Chr1-miR-200s (left), but not those on chromosome 12 (right). Knockdown of WASF3 in MDA-MB-231 and SKBR3 cells results in an increase in miR-200a and miR-200b expression (D). Data are represented as mean ± SEM, * p = <0.05 and ** p = <0.01. Comparison of cDNA and miRNA microarray data (GCRMA normalized intensity values) from five different breast cell lines (E) shows a trend of lower expression of the Chr1-miR-200s (boxes) when levels of WASF3 expression were higher. Lower expression levels of WASF3 in MDA-MB-468 cells was accompanied by higher Chr1-miR-200 levels.
miRNA profiling of tumors with high metastatic potential has shown low levels of miR-200s which are associated with EMT and metastasis in tumor cell lines derived from mice that develop metastatic lung adenocarcinoma (21,22). The miR-200a, 200b and 429 family members are located contiguously in a cluster on chromosome 1, and share a common promoter (23). The other two family members, miR-200c and 141, are clustered on chromosome 12 (Figure 2B). QRT-PCR analysis of these 5 miRNAs in MCF7 and T47D overexpressing WASF3 confirms that expression of only the miR-200 cluster on chromosome 1 (Chr1-miR-200s) was affected (Figure 2C). In MDA-MB-231 and SKBR3 cells, knockdown of WASF3 suppresses invasion and leads to increased miR-200a and 200b levels (Figure 2D). Analysis of gene expression and miRNA microarray data showed a trend that, when WASF3 levels were high, Chr1-miR-200s were low (Figure 2E). In the MDA-MB-468 cells, Chr1-miR-200s were higher and WASF3 levels were lower.
miR-200s are required for WASF3-mediated breast cancer cell invasion
To determine whether the relationship between the Chr1-miR-200s and WASF3 affects the invasion phenotype, we used specific locked nucleic acid (LNA)-modified oligonucleotides to inhibit miR-200a and 200b function in T47D cells. These LNAs inhibit function of the miRNA through high affinity binding to their targets (24). In T47D, an increase in invasion potential was seen following introduction of LNAs simultaneously targeting miR-200a and 200b, compared with cells expressing a non-functional scrambled LNA control (Figure 3A). The same phenotype was seen in MCF7 cells following targeting of miR-200a and 200b (Figure 3A). This result demonstrated that loss of miR-200s expression in T47D and MCF7 cells is sufficient to induce increased invasiveness.
Figure 3.
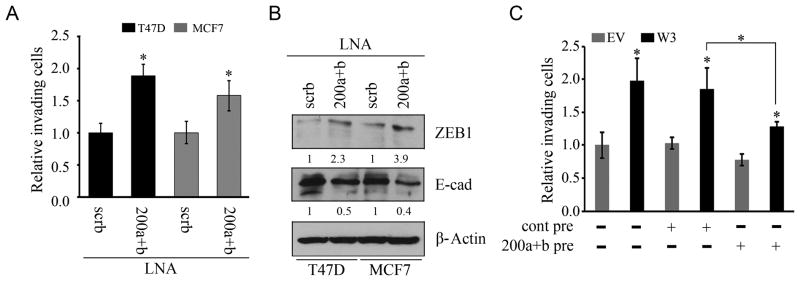
(A) Increased invasion is seen in transwell assays of T47 and MCF7 cells overexpressing WASF3 following knockdown of both miR-200a and 200b using specific LNA-oligonucleotides compared with scrambled LNAs (scrb). Data shown are mean ± SEM of three independent experiments. * p = <0.05. (B) Inhibition of miR-200a and 200b also shows increased levels of ZEB1 and decreased levels of E-cadherin. Expression levels were normalized against actin and reported relative to controls (fold changes shown below each lane). When miR-200a and 200b were reintroduced into the WASF3 overexpressing T47D cells using the specific pre-miRNAs (C), a significant reduction in invasion is seen compared with cells treated with a control pre-miRNA. Data shown are mean ± SEM of three independent experiments, * p = <0.05.
In some cell systems the miR-200 family directly inhibits expression of the ZEB1/ZEB2 transcriptional repressors in epithelial cells. This leads to upregulation of E-cadherin which is associated with EMT that precedes acquisition of the invasion potential (25,26,27). To determine whether inhibiting the Chr1-miR-200s had any effect on their ZEB1 and E-cadherin targets, we investigated protein levels in breast cancer cells using Western blotting. Inhibition of the Chr1-miR-200s led to elevated levels of ZEB1 and a repression of E-cadherin compared with the scrambled control (Figure 3B). Inhibiting miR-200a and 200b, however, only led to a slight increase in WASF3 levels in MCF7 cells (Figure S4). Overexpression of miR-200a and 200b precursors in T47D cells overexpressing WASF3, reduced their invasion potential (Figure 3C), showing that rescuing the expression of miR-200a and 200b in these cells partially reverses the cell invasion phenotype. Together these data demonstrate that the Chr1-miR-200s have an important role in WASF3-mediated cell invasion.
WASF3 up-regulates ZEB1 and mediates ZEB1 inhibition of miR-200s promoter activity
As shown above, WASF3 suppresses the Chr1-miR-200s. Previous reports have suggested a reciprocal relationship between expression of ZEB1 and the miR-200 family (23, 28,29). We, therefore, investigated whether ZEB1 affects expression of these miRNAs when WASF3 is overexpressed. QRT-PCR analysis showed significant upregulation of ZEB1 following overexpression of WASF3 in the T47D and MCF7 cell lines (Figure 4A). Consistent with this observation, raised levels of the ZEB1 protein was seen in these T47D and MCF7 cells (Figure 4B). Analysis of ZEB2 in these WASF3 overexpressing cells, however, only shows a significant increase in MCF7 cells (Figure 4A), and downregulation of WASF3 in MDA-MB-231 cells leads to reduced ZEB1 levels Figure 4B. When a full length WASF3 cDNA, which was resistant to the retrovirus-mediated shRNA, was introduced into these knockdown cells, WASF3 expression was recovered, which led to increased levels of ZEB1 (Figure 4B). Thus, the relationship between WASF3 and ZEB1 is maintained in different experimental systems. Since the relationship between WASF3 and ZEB1 levels was the most significant, we focused on these two proteins in subsequent experiments.
Figure 4.

qRT-PCR demonstrates that overexpression of WASF3 (W3) in T47D and MCF7 cells leads to an increase in ZEB1/2 levels (A). Data are represented as mean ± SEM, ** p = <0.01. This change in expression is reflected in changes in protein levels in T47D and MCF7 cells (B). Knockdown of WASF3 (shW3) in MDA-MB-231 cells shows reduced ZEB1 levels compared with control cells expressing an shRNA against GFP (shGFP). When the shW3 cells were reconstituted with WASF3 (rescue), ZEB1 levels are comparable with the control cells (B). The promoter of the Chr1-miR-200s contains paired ZEB1 binding sites (C, above) both of which (mut1 and mut2) were mutated as shown. When two different luciferase reporter constructs, representing the minimal −321/+120 and extended (−1548/+120) Chr1-miR-200 promoter, were introduced into T47D and MCF7, luciferase activity is reduced when WASF3 is overexpressed compared with cells carrying the empty vector (EV) in both breast cancer cells lines (C). No change in luciferase activity is seen for constructs carrying mutations in the E-box ZEB1 binding site (C). Data are represented as mean ± SEM, ** p = < 0.01. When WASF3 is knocked down in MDA-MB-231 cells (shW3), higher luciferase activity of wildtype Chr1-miR-200 promoter (−321/+120) was determined (D), while no change is seen for constructs carrying mutations in the E-box ZEB1 binding site (D). Data are represented as mean ± SEM, ** p = < 0.01. When expression levels are normalized against actin and relative to controls (fold change levels shown below each lane), T47D and MCF7 cells expressing the empty expression vector plasmid (EV) show relatively low ZEB1 levels and high E-cadherin levels (E). When ZEB1 is knocked down (shZEB1) in both cell lines overexpressing WASF3 (W3) E-cadherin levels show a significant increase compared with the shRNA knockdown control (shGFP). Immunofluorescence analysis of both MCF7 and T47D cells overexpressing WASF3 (W3), shows high levels of membrane associated E-cadherin in parental cells expressing EV (F) but this membrane localization is lost when WASF3 is overexpressed (W3) in both cell lines. When ZEB1 is knocked down (shZEB1) in the WASF3 overexpressing cells, however, E-cadherin levels recover (F) compared with the shRNA control (shGFP), and qRT-PCR demonstrates that expression of the Chr1-miR-200s also increases (G). QRT-PCR analysis of primary breast cancers demonstrates a trend for high WASF3 (W3) levels associated with high ZEB1 and low expression and the pri-miR-200s (H). Data shown are mean ± SEM.
The Chr1-miR-200 promoter contains paired ZEB binding sites (23). Using luciferase reporter constructs carrying either a minimal promoter (−321/+120), or a more extensive region that has greater promoter activity (−1574/+120), we demonstrated that MCF7 and T47D cells overexpressing exogenous WASF3 showed a highly significant reduction in reporter activity from both constructs (Figure 4C), compared with cell lines expressing an empty vector. Overexpressing WASF3 (Figure 4C) using the E-box mutant promoters (in the short promoter construct) showed no difference in luciferase activity. The Chr1-miR-200 promoter activity was also analyzed in the MDA-MB-231 breast cancer cells which have a mesenchyme-like phenotype. Knockdown of WASF3 in these cells leads to a 4-fold increase in activity from the wild-type Chr1-miR-200 promoter (−321/+120), compared to the control knockdown cells (Figure 4D). ZEB1 binding to the E-box elements inhibits Chr1-miR-200 promoter activity in mesenchymal cells (23). The high levels of ZEB1 in MDA-MB-231, therefore, leads to suppression of the Chr1-miR-200s. Using the luciferase reporters for the mutated E-box promoter, there is no suppression of activity in control or WASF3 knockdown cells (Figure 4D) which demonstrates that WASF3 leads to induction of ZEB1 expression, which directly suppresses transcription of the Chr1-miR-200s by binding at highly conserved recognition sites in their promoter.
ZEB1 can also influence E-cadherin activity (24,30) and we observed reduced E-cadherin levels in both the T47D and MCF7 breast cancer cells overexpressing WASF3 (Figure S3). When ZEB1 was knocked down in these cells, E-cadherin levels, as well as its localization to the cell membrane, were recovered (Figure 4E–F). Knockdown of ZEB1 in these cells increased Chr1-miR-200s expression (Figure 4G). To determine whether the same relationship between WASF3, ZEB1 and the Chr1-miR-200s was maintained in primary tumors, we analyzed expression levels in five primary breast cancers obtained from the GHSU tumor bank using qRT-PCR (Figure 4H). Analysis of expression levels of WASF3 and the pri-miR-200 (containing the miR-200b~200a~ 429 cluster) showed that, in three of these samples (#1, #2 and #4) high levels of the pri-miR-200s were associated with relatively low levels of expression of WASF3 and undetectable levels of ZEB1 expression. These tumors were described as infiltrating ductal carcinoma. In two other samples (#3 and #5), which were described as poorly differentiated infiltrating ductal carcinoma, relatively high levels of both WASF3 and ZEB1 were associated with undetectable levels of the pri-miR-200s. Thus, the relationship between ZEB1, WASF3 and the Chr1-miR-200s appears to be maintained in primary human breast cancers where high levels of ZEB1 and WASF3 were seen in higher grate tumors.
WASF3 up-regulates ZEB1 through suppression of KISS1 regulation of NFκB nuclear translocation
KISS1 is a metastasis suppressor gene (5). Previously we showed that KISS1 was up-regulated in the absence of WASF3, leading to a distinct reduction of p65 nuclear translocation in MDA-MB-231 cells (6). Consistent with these observations, Western blot analysis of activation of individual pathways in T47D cells showed that overexpression of WASF3 leads to increased levels of ZEB1 and p65/50 and decreased levels of KISS1 and E-cadherin (Figure 5A). These events are mediated through the activation of IKKα/β which leads to loss of IκBα (Figure 5A). The decreased IκBα levels lead to increased p65/p50 protein levels in the nucleus (Figure 5B). Purity of the subcellular fraction was confirmed using markers specific to the cytoplasm (TUBA) and nucleus (PCNA), as shown in Supplementary Figure S5.
Figure 5.

In T47D cells overexpressing WASF3, ZEB1 levels are increased and KISS1 and E-cadherin are decreased (A) compared to parental cells (WT) and cells expressing the empty vector (EV). Increases in p50/65 are associated with increased activation of IKKα/β which leads to destabilization of IκBα (A). Cell fractionation (B) demonstrates that overexpression of WASF3 in T47D cells increased p50/65 levels in the nucleus and decreases p50/65 and IκBα in the cytosol. Increased NFκB activation is seen in MCF7 and T47D cells overexpressing WASF3 using a NFκB luciferase reporter assay (C). Data are represented as mean ± SEM, ** p = <0.01. In MDA-MB-231 and SKBR3 cells, that express WASF3 endogenously, knockdown of WASF3 (shW3) leads to increased KISS1 levels (D). Nuclear p65 levels are reduced in the WASF3 knockdown cells. (E) When KISS1 is knocked down in WASF3 silenced MDA-MB-231 cells (shW3), ZEB1 levels increase compared with control knockdown cells (shGFP). This knockdown leads to increased p65 levels in the nucleus. Expression levels were normalized against actin and reported relative to controls (fold changes shown below each lane).
WASF3 expression leads to increased signaling through the NFκB pathway in MDA-MB-231 cells (6). To determine whether this is also the case in MCF7 and T47D cells overexpressing WASF3, we used the pNF-κB-TA-Luc signal transduction reporter system which contains multiple NFκB binding sites such that increased activation of NFκB leads to increased lucifierase activity. Using this system, increased NFκB activation was seen in cells overexpressing WASF3 (Figure 5C). These data further support the concept that increased expression of WASF3 leads to the functional activation of NFκB in our system.
To investigate this possibility further, we knocked down WASF3 in both MDA-MB-231 and SKBR3 which express low levels of KISS1, and high levels of WASF3. Knockdown of WASF3 in MDA-MB-231 cells leads to increased KISS1 levels and reduced p65 nuclear translocation (Figure 5D). This effect was accompanied by a reduction in ZEB1 protein levels. In SKBR3 cells, silencing WASF3 expression also results in a notable increase in KISS1 levels, even though ZEB1 is down-regulated and nuclear p65 levels are reduced (Figure 5D). We further determined the ZEB1 protein levels in the KISS1 knockdown MDA-MB-231 cells with or without WASF3 expression. Suppression of KISS1 function promotes p65 translocation into the nucleus and enhances ZEB1 expression in WASF3 knockdown control cells (Figure 5E). In WASF3 knockdown cells, as expected, ZEB1 levels are restored when KISS1 is silenced (Figure 5E). WASF3 up-regulates ZEB1 through suppression of KISS1 function through negative regulation of p65 nuclear translocation.
ZEB1 expression is regulated directly by the NFκB transcription factor
The data presented above suggest that the action of p65 lies downstream of WASF3. To further investigate potential links between p65 and ZEB1 expression, we silenced p65 in WASF3 overexpressing T47D cells and compared them to control cells that do not overexpress WASF3. Knockdown of p65 in T47D cells led to reduced ZEB1 levels in the cells overexpressing WASF3, but it was difficult to discern a significant difference in ZEB1 level following knockdown of p65 because of the endogenously low ZEB1 levels (Figure 6A). In MCF7 cells, when p65 was knocked down, ZEB1 was reduced to almost undetectable levels and in the WASF3 overexpressing cells which show upregulation of ZEB1, knockdown of p65 showed a dramatic decrease in ZEB1 levels (Figure 6A). qRT-PCR analysis is consistent with the Western blot results and further suggests that p65 regulates ZEB1 at the transcriptional level (Figure 6B). When we compared invasion using the matrigel invasion assays in these cells, increased invasion was seen in cells overexpressing WASF3 but was reduced in cells in which either p65 or ZEB1 had been knocked down (Figure 6C).
Figure 6.

Knockdown of p65 (shp65) in WASF3 overexpressing T47D and MCF7 breast cancer cells leads to downregulation of ZEB1 compared with knockdown controls (shGFP) (A). QRT-PCR analysis of ZEB1 in T47D and MCF7 cells (B) shows increased levels when WASF3 is overexpressed (W3). When p65 is knocked down in these cells, a clear reduction in ZEB1 levels is seen compared with the shGFP control cells (B). Data are represented as mean ± SEM, * p = <0.05 and ** p = <0.01. Using the matrigel invasion assay (C) knockdown of either p65 or ZEB1 in WASF3 overexpressing cells (W3) led to reduced invasion. Data are represented as mean ± SEM of three independent experiments, * p = <0.05. Using a ZEB1 luciferase reporter system (D), the data described in A and B were confirmed, and further demonstrate that p65 directly regulates ZEB1 at the transcriptional level. Data are represented as mean ± SEM, * p = <0.05 and ** p = <0.01. ZEB1 is expressed as two different isoforms (45) encoding a full-length protein as well as an N-terminal truncated form. The ZEB1 promoter region upstream of the start codon for the full length protein contains a putative NFκB binding site as shown in the cartoon in (E, above). ChIP-qPCR analysis in T47D cells shows direct binding of p65 to the ZEB1 promoter (E; left) which is increased in T47D cells overexpressing WASF3 (E, center). In MDA-MB-231 cells (E; right) knockdown of WASF3 leads to reduced p65 binding to the ZEB promoter but in the double knockdown p65 binding is recovered. Data are represented as mean ± SEM of three independent experiments, ** p = <0.01.
Since ZEB1 expression levels were markedly down-regulated following inhibition of p65 expression, and our promoter sequence analysis identified a putative consensus NFκB binding site (5′-GGGAACTCCC-3′) within the ZEB1 promoter (Figure 6E), it was possible that p65 might be a direct modulator of ZEB1 expression. This possibility was first proved using a ZEB1 luciferase reporter system, where overexpression of WASF3 leads to increased ZEB1 activity in both of T47D and MCF7 cells. When p65 was knocked down in these cells, a reduction in ZEB1 promoter activity was observed compared with the knockdown control cells (Figure 6D). To investigate whether NFκB binds to the ZEB1 promoter, we performed ChIP assays which demonstrated a specific, direct interaction of the p65 protein with the putative NFκB response element in the ZEB1 promoter in T47D cells (Figure 6E). The NF-kB p65 subunit was recruited to the NF-kB-binding sites in the ZEB1 promoter, but not to a 3′UTR region of the NGAL gene, showing the specificity of the ChIP assay (Supplementary Figure S6). Increased levels of p65 at the ZEB1 promoter binding site was seen in T47D cells overexpressing WASF3 (Figure 6E). In MDA-MB-231 cells, knockdown of WASF3, which leads to increased KISS1 levels, leads to reduced binding of p65 at the ZEB1 promoter (Figure 6E) but in the double knockdown where KISS1 is also lost, the suppressive effects of KISS1 are lifted and p65 binding to the ZEB1 promoter increases.
DISCUSSION
It has been shown in different systems that the miR-200s have a profound influence on invasion (25,26,28,31) and that they can target ZEB1/2 leading to their downregulation. More recently it was shown that ZEB1/2 can also downregulate the miR-200 family (23), thereby establishing a double feedback loop, where it appears that the invasion phenotype is influenced by their relative intracellular levels. We now show that upregulation of WASF3 in poorly invasive breast cancer cells can tip this balance in favor of promoting the invasion phenotype and that this is achieved through upregulation of ZEB1, with a concomitant downregulation of the miR-200 cluster on chromosome 1, leading to increased invasion (Figure 7). This suggestion is consistent with the observation that overexpression of ZEB1 promotes metastasis in a mouse xenograft model (32). ZEB1 can apparently regulate both the chromosome 1 and chromosome 12 clusters of the miR-200 family, through the common regulatory elements in their promoters (29). In our system, where WASF3 is reexpressed in T47D and MCF7 cells, however, there is clearly upregulation of ZEB1, and to a lesser extent ZEB2, but it appears that the expression of the chromosome 12 miRNAs, 200c and 141, are not affected. These observations suggest that the effects of downregulating miR-141 and 200c by ZEB1/2 may be cell context dependent.
Figure 7.
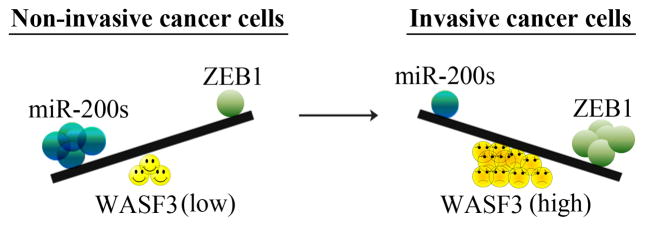
Schematic representation of the relationship between WASF3 expression and expression of ZEB1/Chr1miR-200s. In cells expressing low levels of WASF3, miR-200s are high and ZEB1 levels are low shifting the balance in favor of low-level migration. In cells expressing high levels of WASF3, ZEB1 levels are also high shifting the balance in favor of increased migration through repression of miR-200s.
Although it has been established that ZEB1 plays a central role in regulating invasion, we now demonstrate the mechanism behind this observation. Our ChIP studies show that NFκB binds directly to the ZEB1 promoter, leading to its upregulation. Further, we demonstrate that this effect is mediated by the control WASF3 exerts over KISS1 expression. Since KISS1 mediates NFκB signaling (6), in the presence of high levels of WASF3, the resulting downregulation of KISS1 leads to increased activation of NFκB and upregulation of ZEB1. This mechanism also accounts for the isolated observation that overexpressing a constitutively active NFκB in MCF10A suppresses the expression of epithelial specific E-cadherin and upregulates ZEB1/2 (33). Recently, in a glioma cell system, NFκB was also demonstrated to bind to the ZEB1 promoter (34) and regulate its activity. The increased invasion seen as a result of increased WASF3 expression, therefore, appears to be due to the promotion of a signaling cascade from WASF3 activation that leads to ZEB1 activation. The reverse is also true, since loss of WASF3 in highly metastatic cells such as MDA-MB-231, leads to reduced invasion and reduced ZEB1 activity.
An increasing number of miRNAs have been implicated in the positive and negative control of invasion and metastasis in different cell systems (19,35,36). For example, miR-10b, 373 and 520c were defined as metastasis promoting (17), and these miRNAs were also upregulated following WASF3 overexpression in T47D cells, leading to increased invasion potential. In contrast, miR-21, which has been described as a metastasis promoting miRNA, was the most significantly downregulated miRNAs in our system. These data were derived from T47D cells which have not previously been evaluated for the effect of this miRNA. Other members of the metastamir, such miR-143 and 182 were apparently unaffected by WASF3 overexpression, possibly reflecting the fact that miRNA regulation is cell context dependent. This suggestion is further supported by the fact that several other metastamirs that apparently suppress metastasis, such as miR-335, 206 and 146a/b did not show expression changes in response to WASF3 upregulation.
WASF3 influences the miR-200/ZEB1 control of cell invasion and metastasis, which supports the idea that it is a master regulator of signaling cues that affects invasion potential. We have recently shown, for example, that WASF3 associates with HSP90 and HSP70 (37). Inactivation of either of these genes in a number of different cell systems leads to reduced invasion, which is thought to be facilitated through regulation of the stability of some of their client proteins. In fact, WASF3 is a client HSP70 protein (37), but this interaction stabilizes WASF3 rather than the more typical effect of targeting it for degradation. As a result, the WASF3 effect on promoting invasion is enhanced. ABL kinase is an HSP90 client protein but WASF3 is not. Phosphoactivation of WASF3 by ABL kinase is required to promote invasion (16). Destabilization of ABL kinase in the absence of HSP90 leads to reduced activation of WASF3 and decreased invasion (37). We have also recently demonstrated that hypoxia can upregulate WASF3 in response to HIF1A activation (38), which also leads to increased invasion, while hypoxia has no effect on invasion in cells in which WASF3 has been knocked down. Thus, activation of WASF3 seems to be key in coordinating a number of previously described events that, in isolation, have been reported to influence invasion and metastasis. As such, it is perhaps not surprising, therefore, that knockdown of WASF3, as a single event, has such a profound influence on the invasion/metastasis phenotype in different cell types. Consistent with this suggestion, other downstream effectors of metastasis are also affected by manipulation of WASF3 expression levels. Loss of E-cadherin at the cell membrane, for example, is frequently associated with progression to invasion (39,40). It is also well-established that ZEB1 is a transcriptional repressor of E-cadherin (41). Previous reports show that forced expression of WASF3 in non-invasive T47D cells leads to disruption of E-cadherin-based cell-cell adhesion (42). In this study, we also demonstrate that the WASF3 influence on ZEB1 activation leads to loss of cell surface E-cadherin, which is consistent with its ability to profoundly influence invasion.
We previously reported (11) that WASF3 appeared to be highly expressed specifically in high grade ER/PR negative breast tumors, which are mostly represented in the recently classified ‘claudin-low’ subgroup of breast cancers which includes triple negative tumors. This subgroup of tumors also frequently expresses high levels of ZEB1 and WASF3, while showing low expression of E-cadherin (44). Two such samples were identified in our small series of primary breast cancers reported here. Overall, therefore, the suggestion from the cell culture systems presented here, that high levels of WASF3 are associated with increased ZEB1 and low E-cadherin, are supported by gene expression studies in primary breast cancer. WASF3, therefore, possible represents a target to treat these triple negative breast cancers for which there are currently limited therapeutic opportunities.
MATERIALS AND METHODS
Cell culture and standard assays
All cell lines were purchased from American Type Culture Collection (Rockville, MD, USA). Standard cell culture, transient transfections, MTT and luciferase reporter assays, wound healing assays, immunoblotting, immunoprecipitation, immunofluorescence and RT-PCR were carried out as described previously (6,12,37). The specific primers used in semi-RT-PCR or qRT-PCR assays are listed in supplemental Table S1. CGH analysis of MCF7 and T47D (data not shown) demonstrated identical profiles for these cell lines compared with the reference karyotypes described by Neve et al (43).
DNA constructs, antibodies and other reagents
The pGL-miR-200b~200a~429 promoter constructs (−1574/+120, −321/+120 and E-box mut) were kindly provided by Dr. Goodall (Institute of Medical and Veterinary Science, SA, Australia.). The ZEB1 promoter constructs were kindly provided by Dr. Nakshatri (IU Simon Cancer Center, IN, USA). The p-NF-κB-TA-Luc reporter vector was purchased from Clontech (Research Triangle Park, NC). To construct the WASF3 lentiviral expression vector, the full-length human WASF3 was subcloned into pCDH-CMV-MCS-EF1-copGFP (System Biosciences, Mountain View, CA) as descripted previously (37). The puromycin-resistant pSM2 retroviral vector containing a short-hairpin RNA against the 3′UTR of WASF3 (V2LHS 261688) and pLKO lentiviral vector containing a short hairpin RNA against WASF3 (RHS3979-98060783) were purchased from Open Biosystems (Huntsville, AL). Unless specified, the WASF3 knockdown cells expressing lentiviral shRNA were used in our study. The MISSION® shRNAs against ZEB1 (TRCN0000017565) and p65 (TRCN0000014686) were purchased from Sigma (St. Louis, MO). Stealth KISS1 siRNA (siKISS1, HSS142730) and the stealth RNAi negative control duplexes were purchased from Invitrogen. Generation of viral supernatants and viral transduction were performed as described previously (12,37) and GFP-positive cells were sorted by FACS. The primary antibodies used for Western blot analysis are listed in supplemental Table S2. For the Chromatin immunoprecipitation (ChIP) assay, the anti-NFκB p65 antibody (ChIP Grade) was purchased from Abcam (Cambridge, MA). For miRNA assays, 5′-fluorescein labeled locked nucleic acid (LNA)-modified oligonucleotides (LNA-anti-miR-200a, LNA-anti-miR-200b and negative control) were obtained from Exiqon (Denmark). Pre-miR™ miRNA Precursors (hsa-miR-200a, 200b and negative control) were obtained from Applied Biosystems (Carlsbad, CA). Chloromethyfluorescein diacetate succinimidyl ester (CFSE) was purchased from Invitrogen. For nuclear and cytoplasmic extracts, cells were lysed in Nuclear and Cytoplasmic Extraction Reagent (NE-PER) extraction reagent (Pierce, IL). Human breast cancer samples used in our studies were obtained from the GHSU Tumor Bank.
miRNA and gene expression microarray
Total RNA, including small RNAs, was isolated from 4×10⁷ cells using miRNeasy Mini kits (Qiagen, CA). For gene expression profiling, labeled RNA was hybridized on Human Genome U133A arrays (Affymetrix, CA) and the microarray data were analyzed as described previously (6). For microRNA array profiling, labeled RNA was hybridized on GeneChip miRNA Array (Affymetrix, CA). The stained arrays were scanned at 532 nm using an Affymetrix GeneChip Scanner 3000 and miRNA alterations were determined using PARTEK Genomics Suite (Partek GS). The miRNA microarray data have been deposited on Gene Expression Omnibus (GEO) with the accession number GSE31367.
qRT-PCR analysis
For gene expression analysis, qRT-PCR was carried out as described previously (6,12). For miRNA expression analysis, miRNA was extracted from cells using mirVana™ miRNA Isolation Kit (Ambion, Austin, TX) and then reverse transcribed into cDNAs using the NCode™ VILO™ miRNA cDNA Synthesis Kit (Invitrogen). The samples were amplified with specific primers for human miR-200a, 200b, 200c, 141 and 429 (supplemental Table S1) by EXPRESS SYBR GreenER™ miRNA qRT-PCR Kits (Invitrogen). Expression of miRNAs was normalized to U6 snRNA by 2-ΔΔCT methods.
Chromatin immunoprecipitation q-PCR (ChIP-qPCR)
ChIP assays were performed using a ChIP assay kit (Millipore) as described previously (38). In brief, chromatin from cells was cross-linked with 1% formaldehyde for 10 min at room temperature), sheared to an average size of ~500 bp and then immunoprecipitated with an anti-p65 antibody (Abcam). The ChIP-qPCR primers (supplementary Table S1) were designed to amplify a proximal promoter region containing putative p65 binding sites (5′-GGGAACTCCCCG-3′) in the ZEB1 promoter. Each immunoprecipitated DNA sample was quantified using qPCR and all ChIP-qPCR signals were normalized to the input. The resulting product of 166 bp for ZEB1 was also separated by 1% agarose gel electrophoresis.
Hanging drop and cell invasion assay
In the hanging drop aggregation assay, cells (1.5 × 10⁶ cells/ml) were resuspended in complete medium and seeded in 30 μl drops on the inner surface of a 24-well plate lid for 24 h at 37°C. The extent of aggregated and isolated cells was determined within 20 min using a Zeiss Axiovert microscope (Zeiss, Thornwood, NY). To assay for tightness of cell-cell interactions, cell clusters were subjected to shear force by passing them 10 times through standard Eppendorf tips and washed with PBS supplemented with 10% FBS. Single cells released from the clusters were then counted. To measure the cell invasion potential, serum-starved cells were detached with Accutase (Innovative Cell Technologies, San Diego, CA) and used for matrigel invasion assays as described previously (12) using Transwells (BD biosciences, San Diego, CA) with 8-μm pore size filters. In brief, cells were allowed to invade through the Matrigel membrane for 48 h. After 48 h, noninvasive cells were removed from the upper membrane with a cotton swab and the invasive cells on the underneath stained and counted. Each experiment was performed in triplicate on at least three occasions.
Transfection of miRNA precursors and inhibitors
To study the effect of anti-miR-200s in vitro, cells were seeded at 2 × 10⁵ cells per well in 6-well plate and transfected with miR-200s inhibitors at a final concentration of 200 nM (100 nM of each of LNA-anti-miR-200a plus LNA-anti-miR-200b, Exiqon) or 200 nM of a negative control inhibitor (LNA-scramble, Exiqon). 72 h after the initial transfection, cells were transfected with additional miRNA inhibitors, and total RNA and protein was collected at 72 h after second transfection. For miR-200s overexpression, cells were transfected with a mixture of both precursors of pre-miR-200a and 200b (20 nM each; Ambion). In this assay, cells transfected with scrambled RNA oligonucleotide were used as controls.
Supplementary Material
Acknowledgments
This study was supported, in part, by the National Institutes of Health Grant CA120510.
We would like to thank Dr. Leslie Ann Lesoon for technical assistance and helpful comments during the writing of this manuscript. We also thank the staff of Cancer Center Shared Resources at GHSU for assistance during microarray data collection. Dr. Cowell is supported by the Georgia Cancer Coalition as a Distinguished Cancer Scholar.
Footnotes
Supplementary information accompanies the paper on the Oncogene Web site (http://www.nature.com/onc).
The authors declare no conflicts of interest related to this study.
Conflict of Interest.
Dr Cowell is funded by the NIH.
References
- 1.Jechlinger M, Sommer A, Moriggl R, Seither P, Kraut N, Capodiecci P, et al. Autocrine PDGFR signaling promotes mammary cancer metastasis. J Clin Invest. 2006;116:1561–1570. doi: 10.1172/JCI24652. [DOI] [PMC free article] [PubMed] [Google Scholar]
- 2.Johnson E, Seachrist DD, DeLeon-Rodriguez CM, Lozada KL, Miedler J, Abdul-Karim FW, et al. HER2/ErbB2-induced breast cancer cell migration and invasion require p120 catenin activation of Rac1 and Cdc42. J Biol Chem. 2010;285:29491–29501. doi: 10.1074/jbc.M110.136770. [DOI] [PMC free article] [PubMed] [Google Scholar]
- 3.Chuang TC, Hsu SC, Cheng YT, Shao WS, Wu K, Fang GS, et al. Magnolol down-regulates HER2 gene expression, leading to inhibition of HER2-mediated metastatic potential in ovarian cancer cells. Cancer Lett. 2011;311:11–19. doi: 10.1016/j.canlet.2011.06.007. [DOI] [PubMed] [Google Scholar]
- 4.Kessenbrock K, Plaks V, Werb Z. Matrix metalloproteinases: regulators of the tumor microenvironment. Cell. 2010;141:52–67. doi: 10.1016/j.cell.2010.03.015. [DOI] [PMC free article] [PubMed] [Google Scholar]
- 5.Steeg PS, Ouatas T, Halverson D, Palmieri D, Salerno M. Metastasis suppressor genes: basic biology and potential clinical use. Clin Breast Cancer. 2003;4:51–62. doi: 10.3816/cbc.2003.n.012. [DOI] [PubMed] [Google Scholar]
- 6.Teng Y, Liu M, Cowell JK. Functional interrelationship between the WASF3 and KISS1 metastasis-associated genes in breast cancer cells. Int J Cancer. 2011;129:2825–2835. doi: 10.1002/ijc.25964. [DOI] [PMC free article] [PubMed] [Google Scholar]
- 7.Pollock CB, Shirasawa S, Sasazuki T, Kolch W, Dhillon AS. Oncogenic K-RAS is required to maintain changes in cytoskeletal organization, adhesion, and motility in colon cancer cells. Cancer Res. 2005;65:1244–1250. doi: 10.1158/0008-5472.CAN-04-1911. [DOI] [PubMed] [Google Scholar]
- 8.Adorno M, Cordenonsi M, Montagner M, Dupont S, Wong C, Hann B, et al. A Mutant-p53/Smad complex opposes p63 to empower TGFbeta-induced metastasis. Cell. 2009;137:87–98. doi: 10.1016/j.cell.2009.01.039. [DOI] [PubMed] [Google Scholar]
- 9.Sossey-Alaoui K, Li X, Ranalli TA, Cowell JK. WAVE3-mediated cell migration and lamellipodia formation are regulated downstream of phosphatidylinositol 3-kinase. J Biol Chem. 2005;280:21748–55. doi: 10.1074/jbc.M500503200. [DOI] [PubMed] [Google Scholar]
- 10.Sossey-Alaoui K, Ranalli TA, Li X, Bakin AV, Cowell JK. WAVE3 promotes cell motility and invasion through the regulation of MMP-1, MMP-3, and MMP-9 expression. Exp Cell Res. 2005;308:135–145. doi: 10.1016/j.yexcr.2005.04.011. [DOI] [PubMed] [Google Scholar]
- 11.Sossey-Alaoui K, Safina A, Li X, Vaughan MM, Hicks DG, Bakin AV, et al. Down-regulation of WAVE3, a metastasis promoter gene, inhibits invasion and metastasis of breast cancer cells. Am J Pathol. 2007a;170:2112–2121. doi: 10.2353/ajpath.2007.060975. [DOI] [PMC free article] [PubMed] [Google Scholar]
- 12.Teng Y, Ren MQ, Cheney R, Sharma S, Cowell JK. Inactivation of the WASF3 gene in prostate cancer cells leads to suppression of tumorigenicity and metastases. Br J Cancer. 2010;103:1066–1075. doi: 10.1038/sj.bjc.6605850. [DOI] [PMC free article] [PubMed] [Google Scholar]
- 13.Sossey-Alaoui K, Su G, Malaj E, Roe B, Cowell JK. WAVE3, an actin-polymerization gene, is truncated and inactivated as a result of a constitutional t (1;13)(q21;q12) chromosome translocation in a patient with ganglioneuroblastoma. Oncogene. 2002;21:5967–5974. doi: 10.1038/sj.onc.1205734. [DOI] [PubMed] [Google Scholar]
- 14.Takenawa T, Miki H. WASP and WAVE family proteins: key molecules for rapid rearrangement of cortical actin filaments and cell movement. J Cell Sci. 2001;114:1801–1809. doi: 10.1242/jcs.114.10.1801. [DOI] [PubMed] [Google Scholar]
- 15.Takenawa T, Suetsugu S. The WASP-WAVE protein network: Connecting the membrane to the cytoskeleton. Nat Rev Mol Cell Biol. 2007;8:37–48. doi: 10.1038/nrm2069. [DOI] [PubMed] [Google Scholar]
- 16.Sossey-Alaoui K, Li X, Cowell JK. c-Abl-mediated phosphorylation of WAVE3 is required for lamellipodia formation and cell migration. J Biol Chem. 2007b;282:26257–26265. doi: 10.1074/jbc.M701484200. [DOI] [PubMed] [Google Scholar]
- 17.Hurst DR, Edmonds MD, Welch DR. Metastamir: the field of metastasis-regulatory microRNA is spreading. Cancer Res. 2009;69:7495–7498. doi: 10.1158/0008-5472.CAN-09-2111. [DOI] [PMC free article] [PubMed] [Google Scholar]
- 18.Ma L, Weinberg RA. MicroRNAs in malignant progression. Cell Cycle. 2008;7:570–2. doi: 10.4161/cc.7.5.5547. [DOI] [PubMed] [Google Scholar]
- 19.Tavazoie SF, Alarcón C, Oskarsson T, Padua D, Wang Q, Bos PD, et al. Endogenous human microRNAs that suppress breast cancer metastasis. Nature. 2008;451:147–152. doi: 10.1038/nature06487. [DOI] [PMC free article] [PubMed] [Google Scholar]
- 20.Levy C, Khaled M, Iliopoulos D, Janas MM, Schubert S, Pinner S, et al. Intronic miR-211 assumes the tumor suppressive function of its host gene in melanoma. Mol Cell. 2010;40:841–849. doi: 10.1016/j.molcel.2010.11.020. [DOI] [PMC free article] [PubMed] [Google Scholar]
- 21.Gibbons DL, Lin W, Creighton CJ, Rizvi ZH, Gregory PA, Goodall GJ, et al. Contextual extracellular cues promote tumor cell EMT and metastasis by regulating miR-200 family expression. Genes Dev. 2009;23:2140–2151. doi: 10.1101/gad.1820209. [DOI] [PMC free article] [PubMed] [Google Scholar]
- 22.Schliekelman MJ, Gibbons DL, Faca VM, Creighton CJ, Rizvi ZH, Zhang Q, et al. Targets of the tumor suppressor miR-200 in regulation of the epithelial-mesenchymal transition in cancer. Cancer Res. 2011;71:7670–7682. doi: 10.1158/0008-5472.CAN-11-0964. [DOI] [PMC free article] [PubMed] [Google Scholar]
- 23.Bracken CP, Gregory PA, Kolesnikoff N, Bert AG, Wang J, Shannon MF, et al. A double-negative feedback loop between ZEB1-SIP1 and the microRNA-200 family regulates epithelial-mesenchymal transition. Cancer Res. 2008;68:7846–7854. doi: 10.1158/0008-5472.CAN-08-1942. [DOI] [PubMed] [Google Scholar]
- 24.Elmén J, Lindow M, Schütz S, Lawrence M, Petri A, Obad S, et al. LNA-mediated microRNA silencing in non-human primates. Nature. 2008;452:896–899. doi: 10.1038/nature06783. [DOI] [PubMed] [Google Scholar]
- 25.Gregory PA, Bert AG, Paterson EL, Barry SC, Tsykin A, Farshid G, et al. The miR-200 family and miR-205 regulate epithelial to mesenchymal transition by targeting ZEB1 and SIP1. Nat Cell Biol. 2008;10:593–601. doi: 10.1038/ncb1722. [DOI] [PubMed] [Google Scholar]
- 26.Korpal M, Lee ES, Hu G, Kang Y. The miR-200 family inhibits epithelial-mesenchymal transition and cancer cell migration by direct targeting of E-cadherin transcriptional repressors ZEB1 and ZEB2. J Biol Chem. 2008;283:14910–14914. doi: 10.1074/jbc.C800074200. [DOI] [PMC free article] [PubMed] [Google Scholar]
- 27.Ahmad A, Aboukameel A, Kong D, Wang Z, Sethi S, Chen W, et al. Phosphoglucose isomerase/autocrine motility factor mediates epithelial-mesenchymal transition regulated by miR-200 in breast cancer cells. Cancer Res. 2011;71:3400–3409. doi: 10.1158/0008-5472.CAN-10-0965. [DOI] [PMC free article] [PubMed] [Google Scholar]
- 28.Burk U, Schubert J, Wellner U, Schmalhofer O, Vincan E, Spaderna S, et al. A reciprocal repression between ZEB1 and members of the miR-200 family promotes EMT and invasion in cancer cells. EMBO Rep. 2008;9:582–589. doi: 10.1038/embor.2008.74. [DOI] [PMC free article] [PubMed] [Google Scholar]
- 29.Brabletz S, Bajdak K, Meidhof S, Burk U, Niedermann G, Firat E, et al. The ZEB1/miR-200 feedback loop controls Notch signalling in cancer cells. EMBO J. 2011;30:770–782. doi: 10.1038/emboj.2010.349. [DOI] [PMC free article] [PubMed] [Google Scholar]
- 30.Mazda M, Nishi K, Naito Y, Ui-Tei K. E-cadherin is transcriptionally activated via suppression of ZEB1 transcriptional repressor by small RNA-mediated gene silencing. PLoS ONE. 2011;6:e28688. doi: 10.1371/journal.pone.0028688. [DOI] [PMC free article] [PubMed] [Google Scholar]
- 31.Hurteau GJ, Carlson JA, Spivack SD, Brock GJ. Overexpression of the microRNA hsa-miR-200c leads to reduced expression of transcription factor 8 and increased expression of E-cadherin. Cancer Res. 2007;67:7972–7976. doi: 10.1158/0008-5472.CAN-07-1058. [DOI] [PubMed] [Google Scholar]
- 32.Spaderna S, Schmalhofer O, Wahlbuhl M, Dimmler A, Bauer K, Sultan A, et al. The transcriptional repressor ZEB1 promotes metastasis and loss of cell polarity in cancer. Cancer Res. 2008;68:537–44. doi: 10.1158/0008-5472.CAN-07-5682. [DOI] [PubMed] [Google Scholar]
- 33.Chua HL, Bhat-Nakshatri P, Clare SE, Morimiya A, Badve S, Nakshatri H. NF-kappaB represses E-cadherin expression and enhances epithelial to mesenchymal transition of mammary epithelial cells: potential involvement of ZEB-1 and ZEB-2. Oncogene. 2007;26:711–724. doi: 10.1038/sj.onc.1209808. [DOI] [PubMed] [Google Scholar]
- 34.Edwards LA, Woolard K, Son MJ, Li A, Lee J, Ene C, et al. Effect of brain- and tumor-derived connective tissue growth factor on glioma invasion. J Natl Cancer Inst. 2011;103:1162–1178. doi: 10.1093/jnci/djr224. [DOI] [PMC free article] [PubMed] [Google Scholar]
- 35.Almeida MI, Reis RM, Calin GA. MYC-microRNA-9-metastasis connection in breast cancer. Cell Res. 2010;20:603–604. doi: 10.1038/cr.2010.70. [DOI] [PubMed] [Google Scholar]
- 36.Png KJ, Halberg N, Yoshida M, Tavazoie SF. A microRNA regulon that mediates endothelial recruitment and metastasis by cancer cells. Nature. 2011;481:190–194. doi: 10.1038/nature10661. [DOI] [PubMed] [Google Scholar]
- 37.Teng Y, Ngoka L, Mei Y, Lesoon L, Cowell JK. HSP90 and HSP70 proteins are essential for stabilization and activation of WASF3 metastasis-promoting protein. J Biol Chem. 2012;287:10051–10059. doi: 10.1074/jbc.M111.335000. [DOI] [PMC free article] [PubMed] [Google Scholar]
- 38.Ghoshal P, Teng Y, Lesoon L, Cowell JK. Hypoxia - induced upregulation of the WASF3 metastasis associated gene leads to enhanced invasion in breast cancer cells. Int J Cancer. 2012;131:E905–915. doi: 10.1002/ijc.27631. [DOI] [PMC free article] [PubMed] [Google Scholar]
- 39.Peinado H, Olmeda D, Cano A. Snail, Zeb and bHLH factors in tumour progression: an alliance against the epithelial phenotype? Nat Rev Cancer. 2007;7:415–428. doi: 10.1038/nrc2131. [DOI] [PubMed] [Google Scholar]
- 40.Thiery JP, Acloque H, Huang RY, Nieto MA. Epithelial–mesenchymal transitions in development and disease. Cell. 2009;139:871–890. doi: 10.1016/j.cell.2009.11.007. [DOI] [PubMed] [Google Scholar]
- 41.Arumugam T, Ramachandran V, Fournier KF, Wang H, Marquis L, Abbruzzese JL, et al. Epithelial to mesenchymal transition contributes to drug resistance in pancreatic cancer. Cancer Res. 2009;69:5820–5828. doi: 10.1158/0008-5472.CAN-08-2819. [DOI] [PMC free article] [PubMed] [Google Scholar]
- 42.Kurisu S, Takenawa T. WASP and WAVE family proteins: friends or foes in cancer invasion? Cancer Sci. 2010;101:2093–2104. doi: 10.1111/j.1349-7006.2010.01654.x. [DOI] [PMC free article] [PubMed] [Google Scholar]
- 43.Neve RM, Chin K, Fridlyand J, Yeh J, Baehner FL, Fevr T, et al. A collection of breast cancer cell lines for the study of functionally distinct cancer subtypes. Cancer Cell. 2006;10:515–527. doi: 10.1016/j.ccr.2006.10.008. [DOI] [PMC free article] [PubMed] [Google Scholar]
- 44.Prat A, Parker JS, Karginova O, Fan C, Livasy C, Herschkowitz, et al. Phenotypic and molecular characterization of the claudin-low intrinsic subtype of breast cancer. Breast Cancer Res. 2010;12:R68. doi: 10.1186/bcr2635. [DOI] [PMC free article] [PubMed] [Google Scholar]
- 45.Cabanillas AM, Darling DS. Alternative splicing gives rise to two isoforms of Zfhep, a zinc finger/homeodomain protein that binds T3-response elements. DNA Cell Biol. 1996;15:643–651. doi: 10.1089/dna.1996.15.643. [DOI] [PubMed] [Google Scholar]
Associated Data
This section collects any data citations, data availability statements, or supplementary materials included in this article.