

Abstract
DNA replication ensures the accurate duplication of the genome at each cell cycle. It begins at specific sites called replication origins. Genome-wide studies in vertebrates have recently identified a consensus G-rich motif potentially able to form G-quadruplexes (G4) in most replication origins. However, there is no experimental evidence to demonstrate that G4 are actually required for replication initiation. We show here, with two model origins, that G4 motifs are required for replication initiation. Two G4 motifs cooperate in one of our model origins. The other contains only one critical G4, and its orientation determines the precise position of the replication start site. Point mutations affecting the stability of this G4 in vitro also impair origin function. Finally, this G4 is not sufficient for origin activity and must cooperate with a 200-bp cis-regulatory element. In conclusion, our study strongly supports the predicted essential role of G4 in replication initiation.
Keywords: cis-regulatory element, DNA replication, G-quadruplex, replication origin
Introduction
Replication is the fundamental cellular process by which DNA is duplicated before mitosis. It begins at specific locations called origins of replication. Replication is initiated at consensus sequences in Escherichia coli (ORI C) (Fuller et al, 1984) and Saccharomyces cerevisiae (ACS, autonomously replicating consensus sequence) (Rao et al, 1994). The ACS is essential for replication initiation, but other elements (B1, B2, and B3) are also required (Marahrens & Stillman, 1992). Several studies have pinpointed essential modules of vertebrate replicators that can initiate replication at ectopic positions (Liu et al, 2003; Altman & Fanning, 2004; Paixão et al, 2004; Wang et al, 2004). However, these studies failed to identify a common motif essential for replication initiation. Recent genome-wide studies have defined general characteristics of metazoan origins of replication. A first large-scale analysis on 1% of the human genome (Cadoret et al, 2008) showed that most efficient origins of replication were strongly associated with CpG islands (CGI) and transcriptional regulatory elements. The association with CGI has been confirmed in mouse cells (Sequeira-Mendes et al, 2009; Cayrou et al, 2011). A conserved G-rich motif named OGRE (origin G-rich repeated elements) has recently been shown to be abundant in mouse and Drosophila origins of replication, and most of these motifs can form a G-quadruplex (G4) (Cayrou et al, 2011, 2012a). A genome-wide association between origins of replication and potential G4 formation has also been found in human cells (Besnard et al, 2012). The hypothesis that G4 structures can regulate origin activity has recently been reinforced by the observation that the human origin recognition complex, the landing platform of the pre-replication complex, binds preferentially to G4 motifs on G-rich RNA or single-stranded DNA (Hoshina et al, 2013). In the last 10 years, data for specific G4 ligands (De Cian et al, 2008), antibodies recognizing G4 (Lipps & Rhodes, 2009; Lam et al, 2013), and helicases unwinding G4 (FANCJ, WRN, BLM, and Pif1) (Bochman et al, 2010; Hiom, 2010; Wu & Brosh, 2010) have strongly suggested that G4 can form in vivo. The elimination of DOG1, the FANCJ helicase ortholog in Caenorhabditis elegans, results in the deletion of genomic regions containing G4 (Cheung et al, 2002; Kruisselbrink et al, 2008). The Pif1 helicase is required to resolve G4 on the leading strand during DNA replication (Lopes et al, 2011; Paeschke et al, 2011) and, when G4 are stabilized with a drug, sites of DNA damage corresponding to H2AX foci colocalize with telomeres (Gomez et al, 2006) or with Pif1 (Rodriguez et al, 2012). We investigated the role of potential G4 in replication initiation in vertebrates, using a powerful genetic tool—the chicken DT40 lymphoid cell line (Buerstedde & Takeda, 1991)—a well-characterized chicken origin, the βA promoter (Dazy et al, 2006) and a new chicken model origin located 5′ to a gene encoding med14. DT40 cells display particularly high rates of homologous recombination, and we used two different strategies to study the potential role of G4. We inserted the βA origin and the designed mutant sequences at the same location, thus ensuring that chromosomal context had no effect on origin activity. We determined origin activity by two methods: a classical method based on the assessment of short nascent strand (SNS) enrichment and a new test, recently developed in our laboratory, based on the capacity of an efficient origin to induce a replication timing shift. For the other model origin (med14), we performed in situ modification of one allele and compared origin activity with the wild-type (WT) allele. Both studied origins contain several G-rich motifs with the potential to form G4. Hereafter, we use the term “G4 motif” to refer to a sequence with the potential to form a G4 structure on the basis of its sequence, and “G4” to designate the structure. Genome-wide studies showed that SNS peaks are located ∽280 bp 3′ to G4 motifs in mouse cells (Cayrou et al, 2012a). We used this information to pinpoint G4 motifs that might contribute to origin function. We demonstrated that one G4 and two G4 were required for replication initiation in the βA promoter origin and the med14 origin, respectively. We found that the two G4 motifs cooperated to induce replication initiation at the med14 promoter. However, G4 was not sufficient for βA origin replication initiation, as cooperation with a flanking 200-bp cis element was also found to be necessary. G4 orientation determined the precise start site of replication. Finally, we investigated several point mutations within the G4 motif of the βA promoter origin and found that the potential to form G4 was correlated with the efficiency of replication initiation. We confirmed that point mutations reducing origin activity to background levels also greatly impaired G4 stability in vitro.
Results
G4 motifs are essential for replication initiation
The genome-wide association of G4 motifs with replication origins strongly suggests that G4 might be important in controlling origin function. We investigated origin function further, in two model origins, both located in promoter regions and containing several G4 motifs. One of these origins was located within the βA promoter, and the profile of SNS enrichment at the endogenous locus has been characterized by our laboratory (Fig 1A). It has also been shown that a 1.1-kb fragment containing the region just upstream from the transcriptional start site can form an active origin when inserted ectopically (Hassan-Zadeh et al, 2012, and Supplementary Fig S1). This 1.1-kb fragment contains two G4 motifs in opposite orientations, and no other G4 motif is detectable either in the flanking sequences of the chosen site of insertion or within the IL2R reporter gene used previously and in this study (Fig 1A and Supplementary Fig S2, G4#1 and 2). Genome-wide studies have shown that SNS peaks are located ∽280 bp 3′ to the G4 in mouse cells (Cayrou et al, 2012a). We used this information to pinpoint G4#1 as the main potential regulator of this origin. It is more than 280 bp away from the center of the SNS peak, but G4 #2 would normally induce a peak on the opposite side because it is located on the other strand (Fig 1A). The second model origin is replicated early and located within the med14 promoter. It contains six G4 motifs in the same orientation. Five are 5′ to a highly enriched SNS peak (Fig 1B and Supplementary Fig S2). G4#4 and 5 are located at the correct distance from the center of the SNS-enriched peak. We therefore selected these G4 motifs as potential G4 involved in the regulation of origin function. We verified that the selected G4 motifs (G4#1, G4#4 and G4#5) folded, in vitro, into G4 structures (Supplementary Figs S3 and S4).
Figure 1. SNS profiles at the βA and med14 loci.
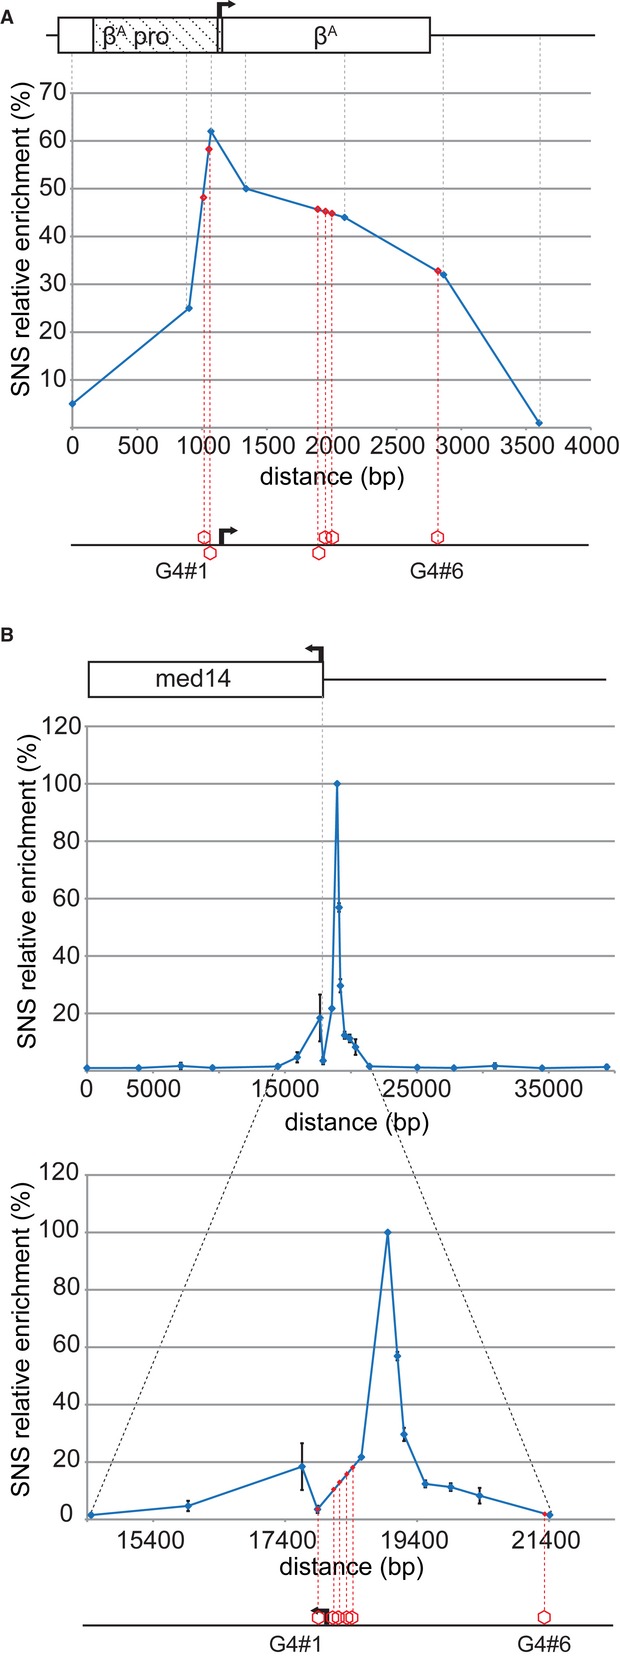
- Relative enrichment in SNS along the endogenous βA globin promoter and gene (adapted from Dazy et al, 2006). Each dot corresponds to a primer pair used for qPCR. The dashed rectangle represents the βA origin inserted at an ectopic position (1.1-kb fragment) and the black arrow, the transcription start site. The red hexagons represent the positions of the G4 motifs along the locus. G4 motifs in the 5′ to 3′ orientation are above the line, and G4 motifs on the opposite strand are shown below the line.
- Relative enrichment in SNS along the med14 promoter and gene. Each dot corresponds to a primer pair used for qPCR. The black arrow represents the transcription start site, and the red hexagons, the positions of the G4 motifs along the locus. All the G4 motifs are on the same strand.
We used two complementary approaches to validate the role of G4 motifs in origin selection. For the med14 origin, we inserted a short sequence tag on one allele, at the position of the SNS-enriched peak, and we deleted G4#4 and G4#5, or both (Fig 2A and B). For each construct, we isolated and quantified SNS from two independent clones. SNS enrichment was arbitrarily normalized with respect to the endogenous WT allele (Fig 2A). We checked the enrichment 12 kb away from the insertion site (background) for each preparation. The deletion of either G4#4 or #5 affected origin activity, but the effect of G4#5 deletion was stronger (Fig 2B). The deletion of both G4 motifs had a dramatic effect, decreasing origin activity to background levels (Fig 2B). These results strongly suggest that, consistent with our prediction, G4#4 and #5 are important cis-regulatory elements involved in origin activity within the med14 promoter. Moreover, this result also demonstrates that they cooperate to drive initiation very efficiently.
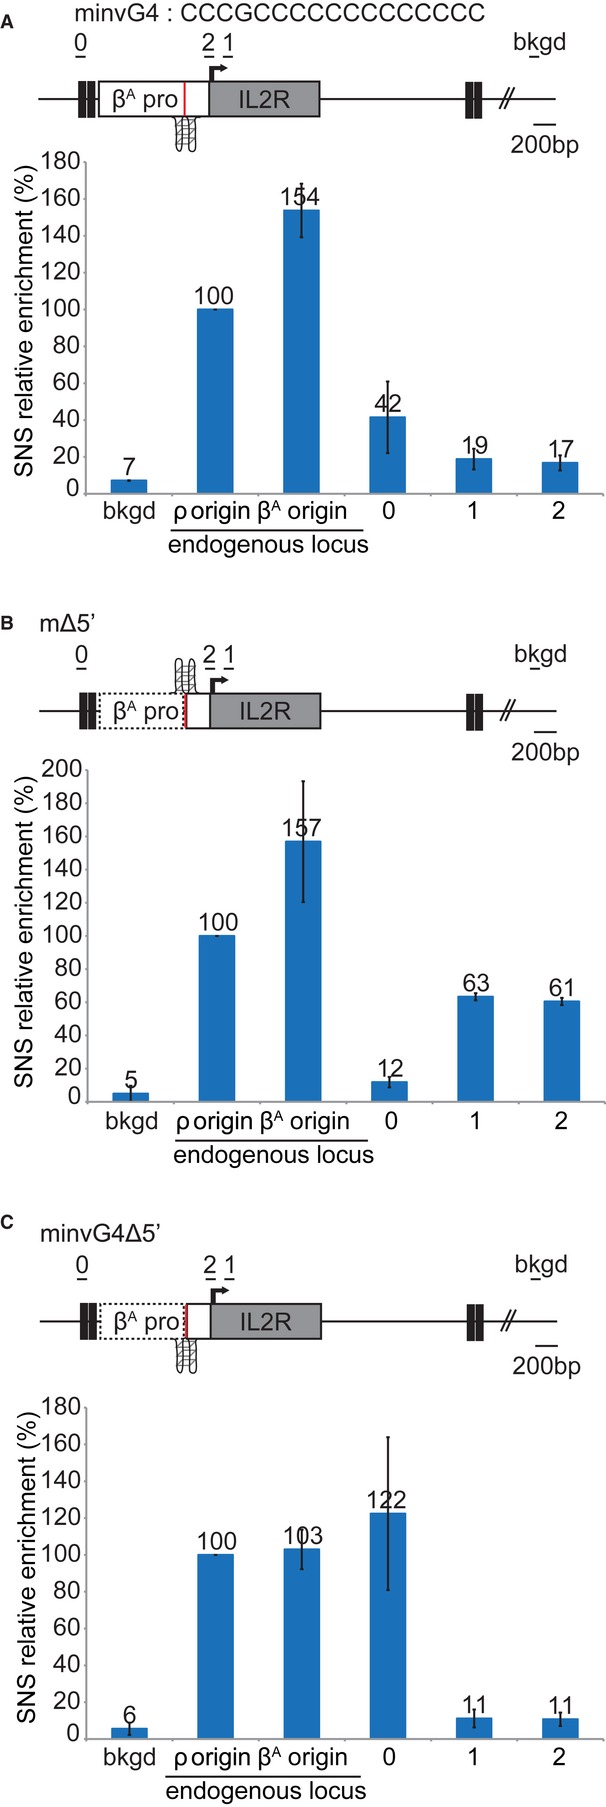
Figure 2. The G4 motifs are necessary for origin function of med14 and βA origins and have additive effects on med14.

A Diagram of the WT and modified allele of the med14 origin with its G4 motifs #4 and #5. The green lines indicate the primer pairs used for qPCR analyses of SNS. Primer pair WT is specific for the WT allele; primer pair “modified” is specific for the modified allele; the bkgd primer pair binds 12 kb away from the site of insertion and is designed to detect background.
B Relative SNS enrichment of the WT allele and the modified alleles. Error bars show the standard deviation of SNS enrichment for qPCR duplicates in two independent clones.
C The endogenous βA globin locus. Black lines represent the amplicons used for qPCR analyses of SNS at the endogenous locus. For each preparation, SNS enrichment within the endogenous βA (positive control) was checked; SNS enrichment was arbitrarily normalized with respect to the endogenous ρ origin of the β-globin locus, the value for which was set at 100%.
D Transgenes inserted at the ectopic position on chromosome 1. The transgenes contain the βA origin promoter (white rectangle), the IL2R sequence (gray rectangle), and the SV40 polyA signal, flanked by two copies of the USF-binding site (2XFIV) (black rectangles). The red line and the red cross represent the G4 motif and G4 motif deletion, respectively. The black lines indicate the amplicons used for qPCR analyses of SNS; Primer pairs 1 and 2 are specific for the transgenes; the bkgd amplicon is located 5 kb away from the site of insertion and is designed to detect background.
E, F Relative enrichment in SNS of the WT transgene (E) or the transgene lacking the G4 motif (F). The SP1-binding site is underlined in (E). Error bars show the standard deviation of SNS enrichment for qPCR duplicates in two independent clones.
For studies of the βA origin, we used various constructs to target the center of a 100-kb region on chromosome 1 with no origin of replication that is replicated in the second half of S-phase, to identify critical cis-regulatory elements within the βA promoter replicator (Hassan-Zadeh et al, 2012). For each construct, we isolated and quantified short nascent strands (SNS) from two independent clones. SNS enrichment was arbitrarily normalized with respect to the endogenous ρ origin of the β-globin locus, the value for which was set at 100% (Fig 2C) (Prioleau et al, 2003). Enrichment 5 kb from the insertion site (background) and within the endogenous βA (positive control) was checked for each preparation (Fig 2C and D). The abundance of SNS at the ectopic βA origin was determined with two primer pairs, one specific for the IL2R reporter gene (primer pair 1) and the other binding to the junction between the βA origin and IL2R (primer pair 2) (Fig 2D). The βA origin inserted at this ectopic position was active (1, 106%, 2, 96%), as previously reported (Hassan-Zadeh et al, 2012) (Fig 2E). SNS relative enrichment was weaker than that at the endogenous βA origin (139%) (Fig 2E). This may reflect the impact of adjacent chromatin or a lack of flanking regulatory sequences in the ectopic origin (see below). We investigated the role of G4#1, by deleting this 17-bp element from the βA origin (Fig 2D). The ectopic βA origin lacking the G4 motif had much lower levels of origin activity than the WT origin (1, 11%, 2, 11%; Fig 2F). This motif thus plays a crucial role in replication initiation. In conclusion, these results show, for two origins, that G4 motifs located 5′ to the SNS enrichment peak are crucial regulatory elements for origin function. Moreover, the effects of deleting G4 motifs within the med14 origin strongly suggest that cooperation between neighboring G4 can increase origin efficiency.
βA origin function requires other modules
Genome-scale studies have shown that not all G4 motifs are origins of replication (Cayrou et al, 2012a), suggesting that additional sequences are required for origin selection. We searched for other regulatory modules, by dissecting the 5′ part of the βA promoter (Fig 3A–D). Deletion of the first module of the βA promoter (mΔ5′1) slightly decreased SNS relative enrichment (1, 56%, 2, 57%), indicating a minor role of this first module in replication initiation (compare Fig 3A with Fig 2E). However, deletion of the first two modules (mΔ5′1 + 2) increased SNS relative enrichment (1, 123% 2, 117%), suggesting that the second module inhibits replication initiation (Fig 3B). Deletion of the first three modules (mΔ5′) slightly decreased SNS relative enrichment (1, 63% 2, 61%), suggesting that the third module stimulates origin activity but is not crucial (Fig 3C). This last result was confirmed by deleting the third module alone (mΔ5′3) (1, 42% 2, 61%) (Fig 3D). The results obtained for these four constructs highlight the existence of two modules stimulating replication initiation (1 and 3) and one module (2) inhibiting replication initiation. However, the effects observed were much less pronounced than those of G4 motif deletion, suggesting that these modules are involved in replication initiation but do not form the core of the replicator.
Figure 3. Cis modules cooperate with G4 for origin activity.

A–E Relative enrichment in SNS of transgene clones from which cis modules were deleted. The βA promoter was cut into four modules: modules 1–3 are located 5′ to the G4 and module 4 is located 3′ to the G4. For each construct, deleted modules are indicated by lattice patterned rectangles. Results are shown for transgene lacking module 1 (A), transgene lacking modules 1 and 2 (B), transgene lacking modules 1, 2, and 3 (C), transgene lacking module 3 (D), and transgene lacking module 4 (E). Error bars indicate the standard deviation for SNS enrichment in two independent clones and qPCR duplicates. The black lines indicate the amplicons used for qPCR analyses of SNS.
Finally, we deleted a fourth module located 3′ to the βA promoter, just downstream from the G4 motif (mΔ3′) (Fig 3E). This deletion greatly decreased origin activity (1, 13%), demonstrating that this module was as important as the G4 motif for replication initiation (Fig 3E). Footprinting studies of this region have identified potential binding sites for transcription factors (Emerson et al, 1985). Moreover, a large-scale study (Cadoret et al, 2008) suggested that transcription factors might play a role in replication initiation. Our findings also suggest that transcription factors may be involved in replication initiation.
G4 motif orientation determines replication start site position
We investigated the role of the G4 motif in replication initiation further, by inverting the G4 sequence on the other DNA strand (minvG4) within the βA promoter. At the site at which SNS enrichment was greatest in the WT βA promoter, we detected no enrichment (1, 19%, 2, 17%), suggesting that the origin was inactive (compare Fig 4A with Fig 2E). We then investigated the effect of inverting the identified G4 motif on the position of the replication start site. We quantified SNS relative enrichment 1 kb upstream from the G4 motif, at a site displaying no enrichment in the WT βA locus (Fig 1A position 0 and 4A primer pair 0). Surprisingly, SNS enrichment was detected with a primer pair specific for the construct, binding to FIV and 5′ to the transgene (0, 42%) (Fig 4A). As the level of SNS relative enrichment was lower than that for the WT βA origin, we hypothesized that replication was initiated within the βA promoter. The residual enrichment detected would then be due to the distance between the replication start site and the primers (primer pair 0) used for SNS quantification. It was difficult to assess SNS enrichment within the βA promoter transgene, because SNS enrichment in the endogenous βA promoter would generate 2/3 of the signal, thus resulting in an underestimation of SNS enrichment for the transgene. For confirmation of the location of the replication start site in the construct with the inverted G4 motif, we used the functional mutant in which the three 5′ modules of the promoter had been deleted, and we inverted the G4 motif (minvG4Δ5′) (Fig 3C and 4B and C). No SNS enrichment was detected in the 3′ part of the construct (1, 11%, 2, 11%), consistent with previous findings (Fig 4C). However, 100 bp upstream from the inverted G4, a high level of enrichment was detected (0, 122%), whereas no SNS enrichment was detected in the mΔ5′ construct (0, 12%) (Fig 4B and C). We therefore conclude that G4 motif orientation determines the position of the replication start site. This result also demonstrates that the selected 17-bp G4#1 is an autonomous module that cooperates with its flanking region independently of its orientation with respect to this element.
Figure 4. G4 orientation determines the replication start site.
A–C Relative enrichment in SNS of the transgene with the inverted G4 (A), the transgene lacking the 5′ sequences (B) and the transgene with the inverted G4 lacking the 5′ sequences (C). Error bars indicate the standard deviation of SNS enrichment for qPCR duplicates in two independent clones. The black lines indicate the amplicons used for qPCR analyses of SNS.
We investigated the reasons for the abrupt drop in SNS enrichment 100 bp upstream from the G4 motif in the mΔ5′ mutant, as the purified SNS were between 1.5 and 2.5 kb in size (Fig 4B). Within the endogenous βA locus, relative SNS enrichment was highest 200 bp 3′ to G4, subsequently decreasing slowly (Fig 1A and Dazy et al, 2006). In the opposite direction, SNS levels rapidly decreased to background levels within 1 kb of G4 (Fig 1A). We hypothesized that this asymmetric pattern might be due to G4 formation slowing the progression of the replication fork. This would lead to a rapid decrease in SNS enrichment (Supplementary Fig S5). Consistent with this hypothesis, G4 inversion in the minvG4Δ5′ mutant yielded a pattern of SNS enrichment almost symmetric to that in mΔ5′ (Fig 4B and C).
G4 is involved in replication initiation
We selected six point mutations within the G4#1 motif (G13CG3) to destabilize G4 formation to different extents within the βA origin. For each point mutation, we calculated the potential G4 (PG4) probability as the number of PG4 that could be formed divided by the number of PG4 that could be formed from the WT sequence (PG4 = 10) (Fig 5). The G-rich motif contains an SP1-binding site (GGCGGG) (Letovsky & Dynan, 1989). We first investigated whether G4 formation and/or SP1 binding affected replication initiation, by mutating the 12th G residue of the G4 motif to an A (m12). This mutation both affected the SP1-binding site and strongly decreased the calculated probability of G4 formation (Fig 5). It decreased SNS enrichment to a level similar to that achieved by G4 motif deletion (1, 14%, 2, 9%), demonstrating the essential nature of this single base for replication initiation (Fig 6A). We designed a second single point mutation (m16) affecting the SP1-binding site and giving a null PG4 probability (Fig 5). Again, relative SNS enrichment was much lower than for the WT sequence (1, 26%, 2, 25%) (Fig 6B). These results identify critical bases for replication initiation, but do not discriminate between the need for efficient SP1 binding or G4 formation for replication initiation.
Figure 5. Potential G4 probability of the βA G4#1 motif and of its mutants.
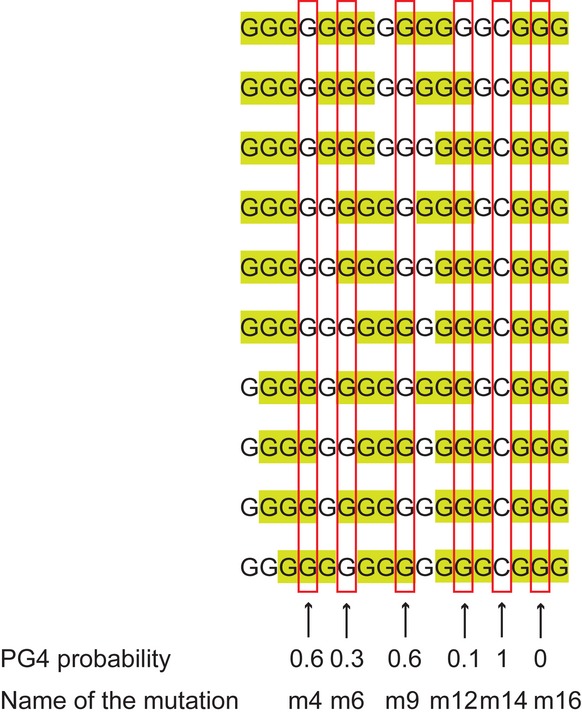
The 17-mer βA G-rich motif can, in principle, fold into 10 intramolecular G4, formed by the stacking of three G-quartets. All 10 possibilities are shown. The runs of guanine residues involved in the G4 are highlighted in green. For each mutant, we defined the potential G4 (PG4) probability as the number of possible G4 divided by the number of possible G4 for the WT sequence (i.e., 10). According to the position of the single point mutation, the PG4 probability is 0 (for m3, m7, m11, m15, m16, and m17), 0.1 (for m2 and m12), 0.3 (for m6 and m8), 0.4 (for m1 and m13), 0.6 (for m4, m5, m9, and m10), and 1 (for m14). The studied point mutations are indicated by a red square and cover most of the different PG4 probabilities.
Figure 6. Single-base point mutations within the βA G4 motif affect origin activity to different extents.

A–F Relative enrichment in SNS of G4 motif mutants m12 (A), m16 (B), m6 (C), m14 (D), m4 (E), and m9 (F). The mutated base is indicated in red. The SP1-binding site is underlined. Error bars indicate the standard deviation of SNS enrichment for qPCR duplicates in two independent clones.
We investigated whether SP1 binding or G4 formation was the key factor required for replication initiation, by investigating two single point mutations: one decreasing the PG4 probability but not affecting the SP1-binding site (m6) and another affecting the SP1-binding site but not PG4 probability (m14) (Fig 5). The m6 mutation significantly decreased SNS relative enrichment (1, 16%, 2, 20%) (Fig 6C). This suggests that G4 formation is required for replication initiation. Conversely, the m14 mutation, which is known to disrupt SP1 binding (Letovsky & Dynan, 1989), did not affect origin activity in the two independent clones (1, 106%, 2, 85%; Fig 6D). These results argue strongly against a role of the SP1 binding site in replication initiation and support the hypothesis that G4 formation is important for replication initiation.
We then investigated two mutations (m4 and m9) that decrease PG4 probabilities to an intermediate level but do not affect SP1 binding (Fig 5). The mutated origins were active (m4: 1, 63%, 2, 50%; m9: 1, 30% 2, 39%), but weaker than the inserted WT βA (Fig 6E and F). In conclusion, these point mutations decreasing PG4 probability to an intermediate level also have an intermediate effect on origin activity, again suggesting that G4 formation is required for full origin activity.
We plotted PG4 probability against origin activity for the various mutants and found a linear correlation between these two features (Fig 7A). To verify whether the calculated PG4 probability actually reflected G4 stability, at least for the studied 17-mer sequences, we carried out in vitro experiments to evaluate the G4 folding potential of the various 17-mer sequences (WT and mutants). Spectroscopic analyses demonstrated that all the sequences folded into G4 structures, characterized by different thermal stabilities (Supplementary Fig S3 and S6). We compared the relative thermodynamic stability of these structures, by carrying out electrophoretic mobility shift assays (EMSA) with human replication protein A (hRPA). The affinity of hRPA for G4 folded sequences is inversely correlated with G4 stability (Salas et al, 2006; Ray et al, 2013). EMSA experiments showed that the affinity of hRPA for the various sequences was also inversely correlated with origin activity (Fig 7B and Supplementary Fig S7). In particular, the sequences with the highest and lowest levels of origin activity were those for which RPA had the lowest affinity (WT, m14, and m4) and the highest affinity (m12, m16, and m6), respectively. Overall, these results show a correlation between origin activity and G4 stability (as determined by hRPA binding), thus providing a strong evidence for a critical role of G4 formation in replication initiation.
Figure 7. βA origin activity is correlated with the stability of its G4.

- Plot of the percentage of oligonucleotides bound to hRPA, at concentrations of 2 nM oligonucleotide and 50 nM hRPA, as determined by electrophoretic mobility shift assays (Supplementary Fig S7) against origin activity (relative enrichment in SNS as defined in Fig 6). The binding reactions were carried out in the presence of 100 mM KCl, at 20°C. As a reference value, the percentage of oligonucleotides bound to hRPA was about 90%, for a WT 17-mer bearing several 7-deaza-guanines impairing G4 folding (Supplementary Fig S7). A linear fitting results in a correlation coefficient R = 0.672.
A new replication origin assay confirms the results of the SNS assay
Recent studies have shown that in S. cerevisiae deletion of Pif1, a helicase known to unwind G4 structures, induces replication fork pausing at G4 mostly on the leading strand resulting in chromosomal breakages and rearrangements (Lopes et al, 2011; Paeschke et al, 2011). It remains plausible that in a WT context, a temporary pausing at G4 structures located nearby a fraction of origins would generate an abnormal enrichment of SNS leading to an overestimation of the role of G4 in origin function. For confirmation of our results by a method independent of SNS enrichment, we designed a new origin activity test based on our recent identification of cis-regulatory elements involved in replication timing control (Hassan-Zadeh et al, 2012). We showed that a construct containing an active origin flanked by two copies of FIV (USF-binding site) shifted the timing of replication for the same genomic region from mid-late to mid-early. This shift is dependent on the presence of an active origin and can therefore be used in an origin assay (Hassan-Zadeh et al, 2012). Moreover, this assay cannot detect a sequence that would impede replication fork progression since a pausing would shift the replication timing toward later replication. We analyzed the timing of the replication of this region by pulse labeling newly synthesized DNA with BrdU, sorting cells into four S-phase fractions, and quantifying nascent strand enrichment in each of the fractions by qPCR. The late and early replication timing shifts (ΔL and ΔE, respectively) were then calculated (Supplementary Fig S8). The early replication timing shift was considered to be significant when ΔL ≤ −10 and ΔE ≥ 5 (Hassan-Zadeh et al, 2012). We used this new assay to assess the capacity of the βA origin and mutated versions of this origin to induce a significant early timing shift. S-phase lasts 6–7 h in DT40, and in our study, we separated this phase into four fractions. The four fractions were of equivalent duration and almost half of a given fraction was shifted toward earlier replication, so the shift induced by this construct constitutes an advance of about 45 min (Hassan-Zadeh et al, 2012). Consistent with the results of our SNS tests, significant shifts were observed in two independent clones for the WT origin, the m14 mutant and the minvG4 (Supplementary Fig S9A–D). For m14, the differences in SNS relative enrichment for the two independent clones were consistent with the differences in early shifts observed in the timing analysis. The clone with the lowest level of SNS enrichment had a smaller early replication timing shift, suggesting clonal effects.
We also confirmed the absence of origin activity with our new test on mutants ΔG, m12, m16, and m6. No early replication shift was detected with these constructs (Supplementary Fig S10A–D). We then grouped the replication timing shift results obtained with six independent clones displaying both a high enrichment of SNS (∽100%) and a significant shift (Supplementary Fig S9) and eight independent clones with both low SNS enrichment (between 10 and 20%) and no replication timing shift (Supplementary Fig S10). We took into account the full shift for each individual clone, by calculating the number − (ΔL) + (ΔE). We observed a highly significant difference of behavior between these two classes of clones (P = 0.0007) (Fig 8). Overall, the results of our new origin assay on mutants of the βA origin were fully consistent with our SNS assay and were incompatible with the hypothesis that our SNS assay identifies replication fork pausing sites.
Figure 8. Comparison of the extent of the replication timing shift of the two different groups of constructs.

- Representation of the transgenes inserted at the ectopic position on chromosome 1. The transgenes contain the βA origin promoter (white rectangle), the IL2R sequence (gray rectangle), and the SV40 polyA signal, flanked by two copies of the USF-binding site (2XFIV) (black rectangles). The green lines correspond to primers used for timing analyses; (With) is specific for the transgene; (Without) is specific to the unmodified allele; (Both) binds 5 kb away from the insertion.
- Typical examples of timing analysis for transgenes displaying strong (WT #1) and low (ΔG clone #1) SNS enrichment. Blue, red, green, and purple bars represent sorted S-phase fractions from early to late stages of replication, S1, S2, S3, and S4, respectively. The early control consists of primer pairs binding within the endogenous βA globin locus.
- The distribution of the −ΔL + ΔE values from 14 replication timing assays is shown. For clones with a high degree of SNS enrichment, n = 6, corresponding to two independent clones of three constructs (WT, m14, and minvG4), and for clones with a low degree of SNS enrichment, n = 8, corresponding to two independent clones of four constructs (ΔG, m12, m16, and m6). Rectangles represent the quartiles (25% of the –ΔL + ΔE values below and above the median value, in red), and the deviations show the smallest and greatest –ΔL + ΔE values. A P = 0.0007 was obtained in Wilcoxon's nonparametric two-tailed test, with α = 5%.
To reinforce the demonstration that our SNS assay catches accurate initiation events, we investigated the impact of inserting an origin strongly shifted toward earlier replication on SNS enrichments at flanking regions. We have already constructed a cell line containing on both alleles the βA origin flanked by two copies of FIV and linked to a strong promoter (β-actin) that drives expression of a gene of selection (blasticidin on one allele and puromycin on the other one) (Supplementary Fig S11A). This larger construct gives a strong shift from mid-late to mid-early S-phase (Hassan-Zadeh et al, 2012). We previously asked the question whether the early replication timing shift we observed at the site of integration extended into flanking chromosomal regions. We showed in this cell line that the global direction of replication forks went from the transgene toward flanking regions since the timing of replication became progressively later upstream and downstream of the site of insertion (Supplementary Fig S11B). This contrasted with a WT strain in which the replication timing was almost similar along a 300-kb region centered on the site of insertion (Supplementary Fig S12B). This result suggested that the βA origin inside the transgene is active in most cells and that timing control elements surrounding this origin imposed locally the timing on this origin. The closest sites of SNS enrichment, detected by deep sequencing and validated by qPCR, are located 58 kb upstream and 80 kb downstream of the site of insertion [Ori L and Ori R, Supplementary Fig S12A and S13B (WT) and (Hassan-Zadeh et al, 2012)]. We have tested the impact of the double insertion of this strongly shifted transgene on SNS enrichments of flanking sites. We found that SNS enrichments dropped from 250 and 197% in the WT cell line to 71 and 68% in the modified cell line at Ori L and Ori R, respectively (Supplementary Fig S13B). These two sites also contained G4 motifs on both strands (Supplementary Fig S13A). The hypothesis that our SNS assay detected replication fork pausing sites was not consistent with this new observation. In contrast, our results fitted perfectly well with the reduction in origin firing at Ori L and Ori R by a mechanism of origin interference. Ori L and Ori R that normally fired later than the new inserted origin were repressed passively by replication forks emerging from this new replicator (Supplementary Fig S13A).
Discussion
Until recently, it remained unclear what defined replication origins in metazoans. The large-scale mapping of replication origins has provided new information, making it possible to predict new regulatory pathways involved in origin selection. Previous studies have highlighted the association of G4 motifs with replication origins genome-wide, in both mouse and human cells, suggesting that G4 may be a consensus cis-regulatory element in vertebrate origins.
G4 are necessary for origin function in two model origins
This work, based on genetic approaches, demonstrates the requirement of G4 for replication initiation, based on studies in two model vertebrate origins. Two previous studies also showed that GC-rich regions were involved in the function of two other model replicators. Dissection of the lamin B2 replicator showed that a CpG island increased origin efficiency, but was not sufficient on its own (Paixão et al, 2004). One replicator within the human β-globin origin is dependent on the presence of two cis modules including a G-rich sequence that contains a G4 motif (Wang et al, 2004). Our study on the med14 promoter/origin not only demonstrated the crucial role of the two G4 motifs, but also provided the new information that G4 motifs can cooperate to increase origin efficiency. The study on the βA promoter/origin showed that there was a strong correlation between mutations affecting G4 stability in vitro and origin efficiency. Moreover, we found that the orientation of G4 determined the precise replication start site (Fig 4). The occurrence of replication initiation 3′ to the structured G4 suggests that a trans-factor able both to recognize the orientation of the G4 and to affect the position of the replication start site is involved. RPA interacts with and modulates the activity of helicases known to unwind G4 directionally, such as FANCJ, Pif1 (5′ to 3′), and BLM, WRN (3′ to 5′), potentially accounting for the observed directionality (Oakley & Patrick, 2010; Wu & Brosh, 2010). The orientation of initiation profiles with respect to G4 has previously been reported in genome-wide studies in mouse cells: A strong initiation peak is located ∽280 bp downstream from the G-rich motif (Cayrou et al, 2012a). We demonstrate that critical G4 motifs are indeed located around these positions in the two model origins studied here. It remains unclear when and how G4 might contribute to origin activity. One hypothesis concerning the timing of G4 involvement is that the binding of the pre-replication complex (Pre-RC) to the replication origin enhances DNA distortion and thus favors G4 formation, which is required for the activation and positioning of the replication start site. A simple hypothesis is that G4 formation facilitates DNA unwinding and beginning of replication. Alternatively, single-stranded DNA formation, induced, for example, by the binding of factors to the cooperating cis element, may allow G4 formation, leading to the recruitment of Pre-RC components. One possibility is that the cooperating cis element may be important to drive transcription of a small noncoding RNA through the G4 motif, thus facilitating the formation of a structured G4. A similar mechanism has been described for the programmed recombination event induced by the formation of a G4 in the bacteria Neisseria gonorrhoeae (Cahoon & Seifert, 2013). This last hypothesis has been recently supported by the observation that the human origin recognition complex binds preferentially to G-quadruplex formed on G-rich RNA or single-stranded DNA (Hoshina et al, 2013). Whatever is the rate-limiting step involved in origin firing that is regulated by the formation of a structured G4, our results on both Ori βA and Ori med14 suggest that the increased probability to form a G4 is directly related to origin activity.
G4 elements must cooperate with another cis module
We show that, within a defined origin, G4 must cooperate with another cis element that acts as potential binding site for transcription factors. This new observation also explains why not all the G4 motifs in the genome can form active origins. The orientation of G4 with respect to this cis element is not important for origin activity, but does determine the position of the start site (Fig 9A and B). Based on this observation, we speculate that a single cis element can cooperate with two flanking G4, in opposite orientations, generating a bimodal origin of replication (Fig 9C). Alternatively, each G4 may require its own cis element (Fig 9D). Genome-wide studies have reported cases of bimodal SNS profiles within CpG island origins containing G4 in both orientations (Cayrou et al, 2012a). Our study provides an explanation of the way in which these bimodal initiation sites are formed (Fig 9C and D). Thus, the regulation described in this study is common to many, if not all, origins in vertebrates.
Figure 9. Models describing how G4 might cooperate with a cis module to regulate the replication start site.
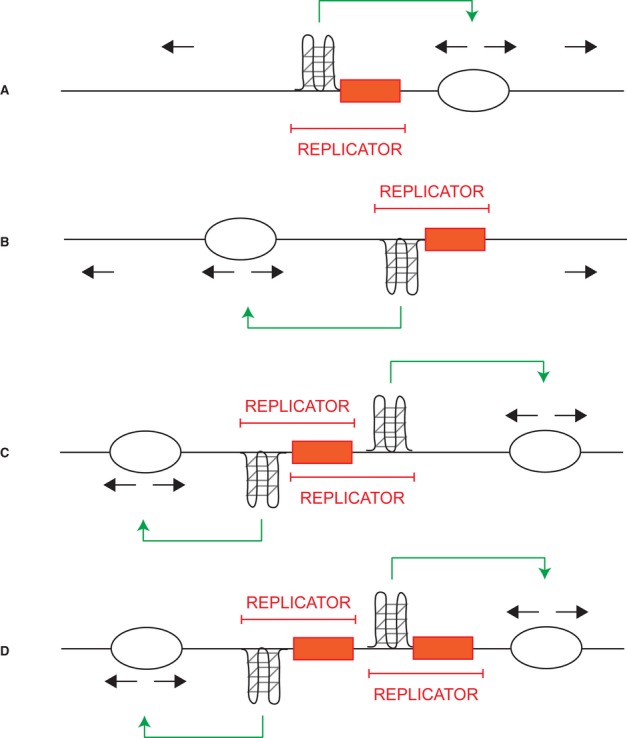
The orange box represents the cis element; the black arrows represent normal replication fork progression.
A, B The orientation of the G4 motif determines the positioning of the replication start site (green arrow) and that the position of the G4 motif with respect to its cooperating cis element is flexible.
C, D Two proposed models explaining how bimodal origins might be generated. One cis element surrounded by two G4 motifs in opposite orientations can induce two start sites (C). Two cis elements that cooperate with two G4 motifs in opposite orientations are required (D).
G4 are important regulators of S-phase progression
Recent studies have explored the potential role of G4 in the normal progression of replication forks in mutants deleted for one helicase (Lopes et al, 2011; Paeschke et al, 2011). Studies carried out in the absence of the Pif1 helicase in S. cerevisiae showed that G4 motifs induce replication fork pauses and increase the probability of inducing chromosome breakage (Paeschke et al, 2011). Our study suggests a new role for G4 as an important molecular switch involved in origin firing in a WT context. This new observation is based on the identification of sites 1.5–2.5 kb in size, enriched in SNS. Using a new origin assay based on the capacity of a strong origin flanked by USF-binding sites to shift the timing of replication to an early point in the cycle, we confirm the reliability of our SNS assay and definitely exclude the hypothesis that our SNS method catches zones enriched in Okazaki fragments or simply in SNS resulting from a replication fork pausing site. There is currently no experimental proof that replication fork pausing sites actually induce an accumulation of Okazaki fragments. The architecture of the replication fork stalled at the 3′ end of yeast ribosomal genes has been fully characterized (Gruber et al, 2000). In this study, the authors found that, in most molecules, the stalled lagging strand was completely processed with the 5′ RNA primer of the last Okazaki fragment removed. Moreover, a recent study in the yeast S. cerevisiae used a new approach to follow replication fork dynamics throughout the genome by the deep sequencing of Okazaki fragments (McGuffee et al, 2013). The strategy used involved enriching the preparation in Okazaki fragments by transiently inactivating ligase I, which is required for the ligation of Okazaki fragments, in an asynchronous culture. This methodology made it possible to obtain a “snapshot” of the Okazaki fragments produced during S-phase. The authors compared the density of Okazaki fragments on the Watson and Crick strands and confirmed previously mapped origins, but were also able to detect regions of termination. They observed that replication fork pauses were infrequent or of onto short a duration to have a major effect on the population as a whole. The only paused site detected was the already characterized replication fork barrier within the rDNA repeat. Finally, using a strain in which late origins can be induced to fire early, they showed that replication termination was a largely passive phenomenon not involving cis-acting sequences or replication fork pausing, but instead resulting from the synchronous firing of adjacent origins, the merging zones corresponding to the midpoint between two origins. This paper therefore minimizes the impact of potential zones of replication fork slowing in a WT strain and, by contrast, highlights the major role of replication origin dynamics in determining the directionality of replication forks throughout the genome. Up to now, G4s have not been shown to cause any impediment to replication fork progression in a WT context. Our study suggests that in vertebrate cells, G4 would contribute to the directionality of replication forks through their role in replication origin activation.
Materials and Methods
Plasmid construction
Homologous recombination was performed in DT40 cells, with plasmids constructed with the Gateway multisite kit (Invitrogen). For βA origin, the entry clones for the 5′ and 3′ target arms on chromosome 1 and the blasticidin resistance gene are similar to those described in a previous study (Hassan-Zadeh et al, 2012). For med14 origin, the design of the construct is the same as the βA origin and the primers are described in Supplementary Fig S15. For the insertion of point mutations within the G4 motifs, we carried out site-directed mutagenesis PCR on an entry vector (pDONR 221 P5-P4) (fragment 2) containing the βA globin promoter, the IL2R gene, and the SV40 polyA sequence flanked by 2XFIV or the med14 origin. The Herculase II fusion DNA polymerase (Agilent) was used to amplify the entire entry vector (5,484 bp for βA origin or 3,083 bp for med14 origin), with primers containing the desired mutations (Supplementary Fig S14 and S15). For the sequence deletion constructs, the primers used flank the deleted region (Supplementary Fig S14 and S15). Primers were designed with at least 15 bp of complementary sequence. The amplicons were digested with DpnI (New England Biolabs) for 90 min, and the enzyme was then inactivated by heating for 20 min at 80°C. Linear amplicons were circularized by incubating the In-Fusion HD enzyme (Clontech) with 100 ng of amplicon for 15 min at 50°C. They were then used to transform Mach1-competent bacteria (Invitrogen). Each entry vector was verified by sequencing. The final vector (pDEST14) was generated by using, for each construct, the same three entry vectors: 5′arm (fragment 1), the blasticidin resistance gene (fragment 3), and 3′arm (fragment 4). Fragment 2 was different in each of the reactions and contained the mutated βA origin or the mutated med14 origin. The Gateway MultiSite pro LR 4 fragment recombination reaction was performed, and the final vectors were verified by restriction enzyme digestion. For the electroporation of DT40 cells, the final vectors were linearized by digestion with ScaI (New England Biolabs) for the βA origin constructs and PvuI (New England Biolabs) for the med14 origin constructs. All the constructs are summarized in Supplementary Fig S15 and S16.
PCR screening for targeted insertion
We checked that the insertion occurred at the correct location in the DT40 cell line, by using primers binding upstream from the 5′ arm and within the construct (Supplementary Fig S14 and S15). We screened cell lines after excision of the blasticidin resistance cassette, by carrying out PCR with primers binding to the 3′ arm and the construct. PCR was performed with the Herculase II Fusion DNA Polymerase PCR system (Agilent). For each selected clone, single-copy insertion was checked by qPCR, as previously described (Hassan-Zadeh et al, 2012).
Cell culture and transfection
DT40 cells were grown in RPMI supplemented with Glutamax and containing 10% FBS, 1% chicken serum, 0.1 mM β-mercaptoethanol, 2 U ml−1 penicillin, and 2 μg ml−1 streptomycin at 37°C, under at atmosphere containing 5% CO2. Transfections were carried out as previously described (Hassan-Zadeh et al, 2012). We used PCR to check insertion by homologous recombination. For this purpose, DNA was rapidly extracted in lysis buffer (10 mM Tris pH 8, 25 mM NaCl, 1 mM EDTA, 200 μg ml−1 proteinase K) from 200 μl of clones grown for 2 days in 2 ml of culture medium. The blasticidin resistance gene was excised by incubating 3 × 10⁵ cells with 5 μM hydroxyl-tamoxifen for 24 h.
Isolation of short nascent strands (SNS)
Short nascent strands were purified as previously described (Prioleau et al, 2003). Minor changes were made to the protocol, and we pooled fractions 21, 22, and 23. These fractions contained single-stranded DNA molecules of between 1.5 and 2.5 kb in size. We used 500 U of a custom-made λ-exonuclease (Fermentas (50 U μl−1)) for each preparation. It has been shown that the use of λ-exonuclease is absolutely essential (Bielinsky & Gerbi, 1998; Cadoret et al, 2008; Cayrou et al, 2012b).
Replication timing analysis
Timing analyses were carried out as previously described (Hassan-Zadeh et al, 2012). The protocol is described in Supplementary Fig S8.
DNA quantification
Quantitative real-time PCR was performed with the Roche LightCycler 2.0 detection system and the Absolute QPCR-SYBR Green mix (Thermo Fisher Scientific). For each reaction, amplifications of the purified short nascent strands (SNS) and BrdUTP-labeled nascent strands (NS) were performed in duplicate. Fourfold dilutions of total genomic DNA specific for the analyzed construct were used for standard curves. After amplification, a melting curve analysis was performed to analyze the products and to check the specificity of the reaction. The second-derivative maximum method was used to quantify sequences, as described in the instructions for LightCycler Software. For SNS in the βA origin, we used primer pairs binding 5 kb away from the insertion site to quantify the background, within the endogenous ρ globin origin for normalization, and within the endogenous βA globin origin to check the quality of the SNS preparation and primer pairs specific for the transgene (Supplementary Fig S14). For SNS in the med14 origin, we used primer pairs binding 12 kb away from the insertion site to quantify the background, within the WT unmodified allele for normalization, and in the tag for the mutated med14 origin (Supplementary Fig S15). Each data point corresponds to data collected from two independent clones. A table summarizing all the constructs and SNS enrichment is shown in Supplementary Fig S15 and S16. For NS, we used primer pairs binding to mitochondrial DNA for normalization of the enrichment in each S-phase fraction, the construct (With), 5 kb away from the insertion (Both) and the WT allele (Without) (Supplementary Fig S8 and S14). An early control was performed in each experiment. Each graph represents the analysis of a single clone. Due to the small differences between two cell sorting experiments, it is not possible to average the results obtained in two independent experiments.
Oligonucleotides for spectroscopic studies, PAGE, and EMSA
Reverse-Phase Cartridge•Gold™ (RPC)-purified oligonucleotides and HPLC-purified double-dye-labeled oligonucleotides (used for spectroscopic studies, PAGE, and EMSA with hRPA) were purchased from Eurogentec (Seraing, Belgium), dissolved in double-distilled water at a concentration of about 300 μM, and used without further purification.
Spectroscopic studies
UV absorbance measurements were acquired on an Uvikon XL spectrometer (Secoman). For melting experiments, the absorbance of the G4#1 oligonucleotide (WT) and its mutants (m4, m6, m9, m12, m14, and m16), as well as of the G4#4 and G4#5 oligonucleotides, was recorded at 245, 260, 273, 295, and 335 nm, as a function of temperature: Samples were heated at 96°C for a few minutes, cooled to 6°C, kept at 6°C for 30 min, heated to 96°C, and then cooled again to 6°C; the samples were heated and cooled at a rate of 0.3°C min−1. For thermal difference spectra (TDS), absorption spectra were collected at 96°C and at 6°C, after cooling at 0.3°C min−1. Circular dichroism spectra were recorded on a Jasco-810 spectropolarimeter, at the end of melting experiments, first at 20°C and then at 95°C. UV absorbance and CD spectra were collected at oligonucleotide concentrations of 2 μM and 20 μM, with an optical path length of 1 cm and 0.2 cm, respectively, in 10 mM cacodylic acid buffer pH 7.2 (pH adjusted with LiOH) supplemented with 10 mM KCl.
Fluorescence melting experiments were carried out by double-dye labeling, using oligonucleotides with 6-carboxyfluorescein conjugated to their 5′ end and tetramethylrhodamine conjugated to their 3′ end. We recorded 6-carboxyfluorescein emission as a function of temperature (excitation filter: 492 nm, emission filter: 516 nm) on a MX3000P system (Stratagene), in 96-well microplates. The temperature was varied from 95 to 25°C and from 25 to 95°C at a rate of 1°C/min. Melting profiles were normalized between 0 and 1; the temperature of half-association (T1/2) was defined as the temperature at which the emission value (upon cooling) was 0.5. Fluorescence melting experiments were carried out at oligonucleotide concentrations of 0.2 μM and 2 μM, in 10 mM cacodylic acid buffer pH 7.2 (pH adjusted with LiOH), in the presence of various concentrations of NaCl or KCl (2 mM, 10 mM, and 100 mM). Oligonucleotide stock solutions used for fluorescence melting experiments were treated with 0.1 M LiOH, kept at 60°C for a few minutes, and then neutralized with 0.1 N HCl.
Polyacrylamide gel electrophoresis
For nondenaturing polyacrylamide gel electrophoresis, oligonucleotides (double-dye-labeled oligonucleotides at concentrations of 0.2 μM, 2 μM, and 20 μM or [γ32P]ATP-labeled oligonucleotides at a concentration of 2 nM) were slowly cooled from 95°C to room temperature, in 10 mM cacodylic acid buffer pH 7.2 (adjusted with LiOH) supplemented and KCl (10 mM for double-dye-labeled oligonucleotides and 100 mM for [γ32P]ATP-labeled oligonucleotides).
Samples (supplemented with sucrose) were loaded onto a 12% polyacrylamide gel (19:1 acrylamide/bisacrylamide; 16.5 cm × 14.5 cm × 0.1 cm) prepared in TBE supplemented with 10 mM KCl. After migration for about 2 h at 3 W per gel in TBE supplemented with 10 mM KCl, gels with double-dye-labeled oligonucleotides were subjected to fluorescence detection with a G:Box (Syngene), and gels with [γ32P]ATP-labeled oligonucleotides were subjected to detection with a Typhoon 9410 (GE Healthcare).
hRPA:DNA binding
Recombinant hRPA was expressed in the Escherichia coli BL21 (DE3) strain and purified with Affi-Gel Blue, HAP, and Q-Sepharose chromatographic columns, as previously described (Gomes et al, 1996). Oligonucleotides were labeled with [γ-32P]ATP, with T4 polynucleotide kinase. 32P-labeled oligonucleotides were purified on Micro Bio-spin− Chromatography Columns (BIORAD). For all EMSA experiments, hRPA was diluted and subjected to pre-incubation (20 min at 4°C) in a buffer containing 50 mM Tris–HCl pH 7.5, 100 mM KCl, 1 mM DTT, 10% glycerol, 0.2 mg ml−1 BSA, and 0.1 mM EDTA. Radioactively labeled oligonucleotides (2 nM) were mixed with various amounts of protein in 10 μl of reaction buffer [50 mM HEPES pH 7.9, 0.1 mg ml−1 BSA, 100 mM KCl, and 2% glycerol]. DNA-hRPA binding reactions were conducted at 20°C for 20 min. Individual reaction mixtures were loaded onto a native 1% agarose gel and run in 1 × TBE for 90 min at 5V cm−1 and 20°C. The gels were analyzed with a Phosphorimager TYPHOON instrument (Molecular Dynamics). The percentage of DNA–hRPA complexes corresponds to the bound DNA/total DNA (free DNA and bound DNA) ratio.
Acknowledgments
We thank Ramis Velibekov, who identified G4 motifs in our first human replication origin dataset in 2008, leading to our studies on G4 and replication initiation. We thank Layal Safa and Emmanuelle Delagoutte for producing hRPA. We would like to acknowledge members of the MNP group for helpful discussions. ALV was supported by a grant from the ARC (n°DOC20130606837). The team of MNP is supported by grants from the ARC and the Ligue Contre le Cancer and belongs to the network of Excellence Who am I? (ANR-11-LABX-0071)/Investments for the Future Program ANR-11-IDEX-0005-01). MNP is supported by the Inserm.
Author contributions
VHZ, IL, and MNP initiated the project. ALV designed, constructed, and analyzed all the mutants inside Ori βA and Ori med14. NB made the cell sorting for replication timing analyses. PA, CS, and JFR designed, performed, and analyzed in vitro experiments on G-quadruplex stability. ALV, PA, CS, JFR, and MNP wrote the manuscript.
Conflict of interest
The authors declare that they have no conflict of interest.
Supplementary information for this article is available online: http://emboj.embopress.org
References
- Altman AL, Fanning E. Defined sequence modules and an architectural element cooperate to promote initiation at an ectopic mammalian chromosomal replication origin. Mol Cell Biol. 2004;24:4138–4150. doi: 10.1128/MCB.24.10.4138-4150.2004. [DOI] [PMC free article] [PubMed] [Google Scholar]
- Besnard E, Babled A, Lapasset L, Milhavet O, Parrinello H, Dantec C, Marin J-M, Lemaitre J-M. Unraveling cell type-specific and reprogrammable human replication origin signatures associated with G-quadruplex consensus motifs. Nat Struct Mol Biol. 2012;19:837–844. doi: 10.1038/nsmb.2339. [DOI] [PubMed] [Google Scholar]
- Bielinsky AK, Gerbi SA. Discrete start sites for DNA synthesis in the yeast ARS1 origin. Science. 1998;279:95–98. doi: 10.1126/science.279.5347.95. [DOI] [PubMed] [Google Scholar]
- Bochman ML, Sabouri N, Zakian VA. Unwinding the functions of the Pif1 family helicases. DNA Repair (Amst) 2010;9:237–249. doi: 10.1016/j.dnarep.2010.01.008. [DOI] [PMC free article] [PubMed] [Google Scholar]
- Buerstedde J-M, Takeda S. Increased ratio of targeted to random integration after transfection of chicken B cell lines. Cell. 1991;67:179–188. doi: 10.1016/0092-8674(91)90581-i. [DOI] [PubMed] [Google Scholar]
- Cadoret J-C, Meisch F, Hassan-Zadeh V, Luyten I, Guillet C, Duret L, Quesneville H, Prioleau M-N. Genome-wide studies highlight indirect links between human replication origins and gene regulation. Proc Natl Acad Sci USA. 2008;105:15837–15842. doi: 10.1073/pnas.0805208105. [DOI] [PMC free article] [PubMed] [Google Scholar]
- Cahoon LA, Seifert HS. Transcription of a cis-acting, noncoding, small RNA is required for pilin antigenic variation in Neisseria gonorrhoeae. PLoS Pathog. 2013;9:e1003074. doi: 10.1371/journal.ppat.1003074. [DOI] [PMC free article] [PubMed] [Google Scholar]
- Cayrou C, Coulombe P, Puy A, Rialle S, Kaplan N, Segal E, Méchali M. New insights into replication origin characteristics in metazoans. Cell Cycle. 2012a;11:658–667. doi: 10.4161/cc.11.4.19097. [DOI] [PMC free article] [PubMed] [Google Scholar]
- Cayrou C, Coulombe P, Vigneron A, Stanojcic S, Ganier O, Peiffer I, Rivals E, Puy A, Laurent-Chabalier S, Desprat R, Méchali M. Genome-scale analysis of metazoan replication origins reveals their organization in specific but flexible sites defined by conserved features. Genome Res. 2011;21:1438–1449. doi: 10.1101/gr.121830.111. [DOI] [PMC free article] [PubMed] [Google Scholar]
- Cayrou C, Grégoire D, Coulombe P, Danis E, Méchali M. Genome-scale identification of active DNA replication origins. Methods. 2012b;57:158–164. doi: 10.1016/j.ymeth.2012.06.015. [DOI] [PubMed] [Google Scholar]
- Cheung I, Schertzer M, Rose A, Lansdorp PM. Disruption of dog-1 in Caenorhabditis elegans triggers deletions upstream of guanine-rich DNA. Nat Genet. 2002;31:405–409. doi: 10.1038/ng928. [DOI] [PubMed] [Google Scholar]
- Dazy S, Gandrillon O, Hyrien O, Prioleau M-N. Broadening of DNA replication origin usage during metazoan cell differentiation. EMBO Rep. 2006;7:806–811. doi: 10.1038/sj.embor.7400736. [DOI] [PMC free article] [PubMed] [Google Scholar]
- De Cian A, Lacroix L, Douarre C, Temime-Smaali N, Trentesaux C, Riou J-F, Mergny J-L. Targeting telomeres and telomerase. Biochimie. 2008;90:131–155. doi: 10.1016/j.biochi.2007.07.011. [DOI] [PubMed] [Google Scholar]
- Emerson BM, Lewis CD, Felsenfeld G. Interaction of specific nuclear factors with the nuclease-hypersensitive region of the chicken adult beta-globin gene: nature of the binding domain. Cell. 1985;41:21–30. doi: 10.1016/0092-8674(85)90057-1. [DOI] [PubMed] [Google Scholar]
- Fuller RS, Funnell BE, Kornberg A. The dnaA protein complex with the E. coli chromosomal replication origin (oriC) and other DNA sites. Cell. 1984;38:889–900. doi: 10.1016/0092-8674(84)90284-8. [DOI] [PubMed] [Google Scholar]
- Gomes XV, Henricksen LA, Wold MS. Proteolytic mapping of human replication protein A: evidence for multiple structural domains and a conformational change upon interaction with single-stranded DNA. Biochemistry. 1996;35:5586–5595. doi: 10.1021/bi9526995. [DOI] [PubMed] [Google Scholar]
- Gomez D, Wenner T, Brassart B, Douarre C, O'Donohue M-F, El Khoury V, Shin-Ya K, Morjani H, Trentesaux C, Riou J-F. Telomestatin-induced telomere uncapping is modulated by POT1 through G-overhang extension in HT1080 human tumor cells. J Biol Chem. 2006;281:38721–38729. doi: 10.1074/jbc.M605828200. [DOI] [PubMed] [Google Scholar]
- Gruber M, Wellinger RE, Sogo JM. Architecture of the replication fork stalled at the 3′ end of yeast ribosomal genes. Mol Cell Biol. 2000;20:5777–5787. doi: 10.1128/mcb.20.15.5777-5787.2000. [DOI] [PMC free article] [PubMed] [Google Scholar]
- Hassan-Zadeh V, Chilaka S, Cadoret J-C, Ma MK-W, Boggetto N, West AG, Prioleau M-N. USF binding sequences from the HS4 insulator element impose early replication timing on a vertebrate replicator. PLoS Biol. 2012;10:e1001277. doi: 10.1371/journal.pbio.1001277. [DOI] [PMC free article] [PubMed] [Google Scholar]
- Hiom K. FANCJ: solving problems in DNA replication. DNA Repair (Amst) 2010;9:250–256. doi: 10.1016/j.dnarep.2010.01.005. [DOI] [PubMed] [Google Scholar]
- Hoshina S, Yura K, Teranishi H, Kiyasu N, Tominaga A, Kadoma H, Nakatsuka A, Kunichika T, Obuse C, Waga S. Human Origin Recognition Complex Binds Preferentially to G-quadruplex-preferable RNA and Single-stranded DNA. J Biol Chem. 2013;288:30161–30171. doi: 10.1074/jbc.M113.492504. [DOI] [PMC free article] [PubMed] [Google Scholar]
- Kruisselbrink E, Guryev V, Brouwer K, Pontier DB, Cuppen E, Tijsterman M. Mutagenic capacity of endogenous G4 DNA underlies genome instability in FANCJ-defective C. elegans. Curr Biol. 2008;18:900–905. doi: 10.1016/j.cub.2008.05.013. [DOI] [PubMed] [Google Scholar]
- Lam EYN, Beraldi D, Tannahill D, Balasubramanian S. G-quadruplex structures are stable and detectable in human genomic DNA. Nat Commun. 2013;4:1796. doi: 10.1038/ncomms2792. [DOI] [PMC free article] [PubMed] [Google Scholar]
- Letovsky J, Dynan WS. Measurement of the binding of transcription factor Sp1 to a single GC box recognition sequence. Nucleic Acids Res. 1989;17:2639–2653. doi: 10.1093/nar/17.7.2639. [DOI] [PMC free article] [PubMed] [Google Scholar]
- Lipps HJ, Rhodes D. G-quadruplex structures: in vivo evidence and function. Trends Cell Biol. 2009;19:414–422. doi: 10.1016/j.tcb.2009.05.002. [DOI] [PubMed] [Google Scholar]
- Liu G, Malott M, Leffak M. Multiple functional elements comprise a Mammalian chromosomal replicator. Mol Cell Biol. 2003;23:1832–1842. doi: 10.1128/MCB.23.5.1832-1842.2003. [DOI] [PMC free article] [PubMed] [Google Scholar]
- Lopes J, Piazza A, Bermejo R, Kriegsman B, Colosio A, Teulade-Fichou M-P, Foiani M, Nicolas A. G-quadruplex-induced instability during leading-strand replication. EMBO J. 2011;30:4033–4046. doi: 10.1038/emboj.2011.316. [DOI] [PMC free article] [PubMed] [Google Scholar]
- Marahrens Y, Stillman B. A yeast chromosomal origin of DNA replication defined by multiple functional elements. Science. 1992;255:817–823. doi: 10.1126/science.1536007. [DOI] [PubMed] [Google Scholar]
- McGuffee SR, Smith DJ, Whitehouse I. Quantitative, genome-wide analysis of eukaryotic replication initiation and termination. Mol Cell. 2013;50:123–135. doi: 10.1016/j.molcel.2013.03.004. [DOI] [PMC free article] [PubMed] [Google Scholar]
- Oakley GG, Patrick SM. Replication protein A: directing traffic at the intersection of replication and repair. Front Biosci. 2010;15:883–900. doi: 10.2741/3652. [DOI] [PMC free article] [PubMed] [Google Scholar]
- Paeschke K, Capra JA, Zakian VA. DNA replication through G-quadruplex motifs is promoted by the Saccharomyces cerevisiae Pif1 DNA helicase. Cell. 2011;145:678–691. doi: 10.1016/j.cell.2011.04.015. [DOI] [PMC free article] [PubMed] [Google Scholar]
- Paixão S, Colaluca IN, Cubells M, Peverali FA, Destro A, Giadrossi S, Giacca M, Falaschi A, Riva S, Biamonti G. Modular structure of the human lamin B2 replicator. Mol Cell Biol. 2004;24:2958–2967. doi: 10.1128/MCB.24.7.2958-2967.2004. [DOI] [PMC free article] [PubMed] [Google Scholar]
- Prioleau M-N, Gendron M-C, Hyrien O. Replication of the chicken beta-globin locus: early-firing origins at the 5′ HS4 insulator and the rho- and betaA-globin genes show opposite epigenetic modifications. Mol Cell Biol. 2003;23:3536–3549. doi: 10.1128/MCB.23.10.3536-3549.2003. [DOI] [PMC free article] [PubMed] [Google Scholar]
- Rao H, Marahrens Y, Stillman B. Functional conservation of multiple elements in yeast chromosomal replicators. Mol Cell Biol. 1994;14:7643–7651. doi: 10.1128/mcb.14.11.7643. [DOI] [PMC free article] [PubMed] [Google Scholar]
- Ray S, Qureshi MH, Malcolm DW, Budhathoki JB, Celik U, Balci H. RPA-mediated unfolding of systematically varying G-quadruplex structures. Biophys J. 2013;104:2235–2245. doi: 10.1016/j.bpj.2013.04.004. [DOI] [PMC free article] [PubMed] [Google Scholar]
- Rodriguez R, Miller KM, Forment JV, Bradshaw CR, Nikan M, Britton S, Oelschlaegel T, Xhemalce B, Balasubramanian S, Jackson SP. Small-molecule-induced DNA damage identifies alternative DNA structures in human genes. Nat Chem Biol. 2012;8:301–310. doi: 10.1038/nchembio.780. [DOI] [PMC free article] [PubMed] [Google Scholar]
- Salas TR, Petruseva I, Lavrik O, Bourdoncle A, Mergny J-L, Favre A, Saintomé C. Human replication protein A unfolds telomeric G-quadruplexes. Nucleic Acids Res. 2006;34:4857–4865. doi: 10.1093/nar/gkl564. [DOI] [PMC free article] [PubMed] [Google Scholar]
- Sequeira-Mendes J, Díaz-Uriarte R, Apedaile A, Huntley D, Brockdorff N, Gómez M. Transcription initiation activity sets replication origin efficiency in mammalian cells. PLoS Genet. 2009;5:e1000446. doi: 10.1371/journal.pgen.1000446. [DOI] [PMC free article] [PubMed] [Google Scholar]
- Wang L, Lin C-M, Brooks S, Cimbora D, Groudine M, Aladjem MI. The human beta-globin replication initiation region consists of two modular independent replicators. Mol Cell Biol. 2004;24:3373–3386. doi: 10.1128/MCB.24.8.3373-3386.2004. [DOI] [PMC free article] [PubMed] [Google Scholar]
- Wu Y, Brosh RM., Jr G-quadruplex nucleic acids and human disease. FEBS J. 2010;277:3470–3488. doi: 10.1111/j.1742-4658.2010.07760.x. [DOI] [PMC free article] [PubMed] [Google Scholar]
Associated Data
This section collects any data citations, data availability statements, or supplementary materials included in this article.