Abstract
Microchip electrophoresis (ME) with electrochemical detection was used to monitor nitric oxide (NO) production from diethylammonium (Z)-1-(N,N-diethylamino)diazen-1-ium-1,2-diolate (DEA/NO) and 1-(hydroxyl-NNO-azoxy)-L-proline disodium salt (PROLI/NO). NO was generated through acid hydrolysis of these NONOate salts. The products of acid hydrolysis were introduced into a 5-cm separation channel using gated injection. The separation was accomplished using reverse polarity and a background electrolyte consisting of 10 mM boric acid and 2 mM tetradecyltrimethylammonium bromide, pH 11. Electrochemical detection was performed using an isolated potentiostat in an in-channel configuration. Potentials applied to the working electrode, typically higher than +1.0 V vs. Ag/AgCl, allowed the direct detection of nitrite, NO, DEA/NO, and PROLI/NO. Baseline resolution was achieved for the separation of PROLI/NO and NO while resolution between DEA/NO and NO was poor (1.0±0.2). Nitrite was present in all samples tested.
Keywords: Nitric oxide, Microchip electrophoresis, Reactive nitrogen species, Amperometric detection, NONOates
Introduction
NO is an important intercellular signaling molecule that is involved in neurotransmission, vasodilatation, and the immune response [1]. It is hydrophobic and has a very large diffusion coefficient, which allows it to permeate cellular membranes [1]. NO is a precursor to more reactive species, including dinitrogen trioxide (N2O3) and peroxynitrite. These reactive nitrogen species (RNS) can directly or indirectly react with amino acids, proteins, metal ions, molecular oxygen, radical species, and DNA, which makes the half-life of NO relatively short in biological media. The short half-life of NO in vivo makes its detection and quantification an analytical challenge. Many approaches for the detection of NO in vivo have been reported in the literature. These include the reaction of NO with fluorescent probes [2–8], direct amperometric detection [9–11], chemiluminescence [12], electron paramagnetic resonance [8, 11], voltammetry [13], and indirect detection of its degradation products nitrite and nitrate [14–17].
NO has been detected directly using amperometric biosensors [10, 11]. For example, Schoenfisch’s group developed NO-specific biosensors using xerogel membranes and platinum black and platinum electrodeposited tungsten substrates [9, 10]. These biosensors have detection limits in the picomolar range, and the xerogel membrane shows high selectivity and permeability for NO [9]. However, interference due to other electroactive compounds is a challenge for some amperometric biosensors [11]. Therefore, indirect measurements of NO degradation products such as nitrate and nitrite or the reaction of NO with fluorescent probes have also been employed for NO detection. Although these methods are effective, there can be problems with specificity, cross-reactivity of the probes, and efficiency or kinetics of reactions. An alternative approach to improve selectivity of these techniques is to separate NO or NO-reacted fluorescence probes from interferences prior to the detection [18, 19].
Among the existing separation techniques, capillary electrophoresis (CE) presents many advantages, including low consumption of sample and reagents, high efficiency and resolution, reduced analysis time, easy method development, and several modes of separation. When CE is accomplished in microchannels (Lab-on-a-chip, μ-TAS, or ME), it has the additional advantage of faster analyses, even lower reagent and sample volume consumption, and the possibility of parallel processing and integration of analytical steps [20]. Another feature of ME is the ability to perform sequential injections, making it possible to monitor the progress of a reaction. Among the detectors available for ME, laser-induced fluorescence (LIF), and electrochemical (EC) detection, schemes are preferred, mainly due to their high sensitivity and ease of application. With EC detection, it is possible to integrate the electrodes into the chip during the fabrication process, leading to fully integrated microfluidic systems [21–24]. Electrode materials such as carbon (carbon fiber, ink, and screen printed) and metal (Au, Pt, and Pd) have been widely used in ME–EC devices [25–28]. Nanomaterials have also been employed to enhance electrochemical performance [29].
ME coupled to LIF has already been used for the detection of NO in human blood and leukemia-type cells [18, 30]. To the best of our knowledge, ME coupled to electrochemical detection (ME–EC) for the measurement of NO has not been achieved; however, ME–EC of peroxynitrite and the metabolites (nitrite and nitrate) of NO and peroxynitrite has been reported previously [25, 27, 31, 32]. One of the advantages of ME–EC is the possibility of detecting several compounds simultaneously in a single sample. Many biologically important compounds involved in oxidative stress including ascorbic acid, glutathione, hydrogen peroxide, and nitrite are electroactive and can be measured along with NO by ME–EC.
Due to the important role of NO in vasodilatation and immune signaling, there have been many drugs developed to deliver NO or enhance its production in vivo [33]. In particular, several diazeniumdiolates have been developed as NO donors [34], and several compounds of this class are now commercially available. These same compounds have also been employed as NO standards for in vivo and in vitro studies. For example, we have employed the diethylamine adduct of NO for calibration purposes in LIF detection of NO [18]. The Spence and Martin groups have also used these compounds for quantitation of NO release from platelets, endothelial cells, and erythrocytes in microfluidic studies [35–40]. NONOates offer an efficient way to generate known quantities of NO. NO generation occurs via acid hydrolysis, and NONOates with half-lives varying from few seconds to several minutes are available.
In this report, microchip electrophoresis with electrochemical detection was used to monitor the generation of NO from NONOate salts with a temporal resolution of 60 s. Since both the salt and NO are electroactive, it is possible to simultaneously monitor the disappearance of the NONOate and the appearance of the NO. Nitrite was also well resolved from the two compounds. The method described here will be employed in the future to investigate the reaction products of NO with biomolecules in a microfluidic-based system.
Experimental
Reagents and solutions
All reagents were of analytical grade and used as received. Sodium nitrite (NaNO2), boric acid, tetradecyltrimethylammonium bromide (TTAB), and sodium phosphate monobasic and dibasic were purchased from Sigma (St. Louis, MO, USA). Sodium hydroxide and hydrochloric acid were obtained from Fisher Scientific (Fair Lawn, NJ, USA). Diethylammonium (Z)-1-(N,N-diethylamino)diazen-1-ium-1,2-diolate (diethylamine NONOate, DEA/NO) and 1-(hydroxyl-NNO-azoxy)-l-proline disodium salt (PROLI/NO) were purchased from Cayman Chemical (Ann Arbor, MI, USA). All solutions were prepared using deionized (DI) water with resistivity greater than 18.3 MΩ cm (Millipore, Kansas City, MO, USA). Phosphate-buffered saline (PBS) was purchased from Sigma as a dry powder in foil pouches and dissolved in 1 L of deionized water to prepare 10 mM PBS pH 7.4 solution (salt concentrations were 140 mM NaCl and 3 mM KCl). The 10 mM phosphate buffer at pH 7 was prepared by mixing appropriate amounts of sodium monobasic and dibasic in DI water. Nitrite and hydrogen peroxide stock standard solutions were prepared in DI water at a concentration of 10 mM and diluted in the run buffer to the desired concentration. Diluted standards were prepared daily. Stable stock solutions were kept for a week at 4 °C, while unstable solutions such as DEA/NO and PROLI/NO were prepared immediately before use. The background electrolyte (BGE) employed for the electrophoresis experiments consisted of 10.0 mM boric acid and 2.0 mM TTAB. The pH was adjusted to 11 with sodium hydroxide.
Microchip fabrication and instrumentation
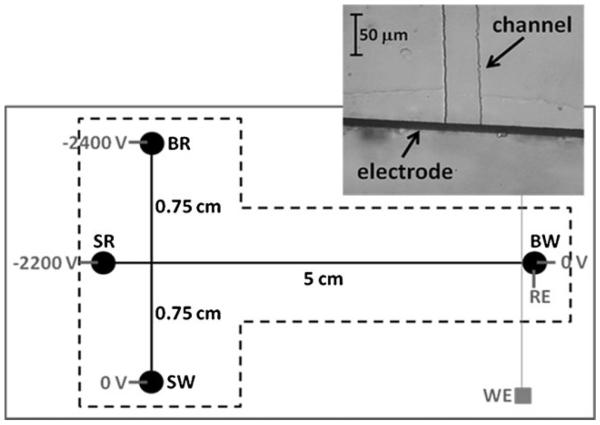
Fabrication of the PDMS-based microchips for ME–EC has been fully described elsewhere [27, 31]. Briefly, the masters for replication were fabricated from a 4-in. wafer coated with SU-8 10 photoresist (Silicon, Inc., Boise, ID, USA) using soft lithography. The width and depth of the micro-channels were 50 and 14 μm, respectively. PDMS microstructures were made by casting a 10:1 mixture of PDMS elastomer/curing agent against the silicon master using Sylgard 184 Silicone Elastomer Kit (Ellsworth Adhesives, Germantown, WI, USA). Following fabrication of the PDMS layer containing the electrophoresis channels, 4-mm holes for the sample and waste reservoirs were produced using a biopsy punch (Harris Uni-core, Ted Pella, Redding, CA, USA). The PDMS substrate containing the electrophoresis channel was then reversibly sealed against a flat borosilicate glass (Precision Glass and Optics, Santa Ana, CA, USA) that contained a 15-μm Pt band working electrode. Fabrication of the Pt band electrode has been reported previously [27]. The separation channel and Pt electrode were carefully aligned to place the electrode exactly at the edge of the channel outlet (in-channel detection) [27]. The microchip design for all experiments was a simple “T” design with a 5-cm separation channel and 0.75-cm side arms (Fig. 1).
Fig. 1.
Microchip setup. BR, SR, BW, and SW indicate BGE, sample, BGE waste, and sample waste reservoirs, respectively. WE and RE are working (Pt band) and reference (Ag/AgCl) electrodes, respectively. The dotted line represents the limits of the PDMS microchip. The inset shows a microscopic image from the electrode/channel alignment
A dual channel high voltage power supply (HV Rack, Ultravolt Inc., Ronkonkoma, NY, USA) controlled by software written in Labview (National Instruments, Austin, TX, USA) was employed in these experiments. Gated injection [41] and electrophoretic separation were accomplished through the application of −2,400 and −2,200 V to the BGE and sample reservoirs, respectively. The injection time was 1 s, and the separation lasted 60 s. Sequential injections could be easily conducted using gated injection, which allows continuous monitoring of the reactions.
Electrochemical detection was achieved using a wireless isolated potentiostat (Pinnacle Technology, Lawrence, KS, USA) in a two-electrode configuration [27]. The working and reference electrodes consisted of a 15-μm Pt band and Ag/AgCl (RE-5B, Bioanalytical Systems, Inc., West Lafayette, IN, USA), respectively. To facilitate the electrode-channel alignment, the microchip was set up on an inverted microscope (Nikon Ti-U, Melville, NY, USA).
Procedures
DEA/NO and PROLI/NO sample preparation
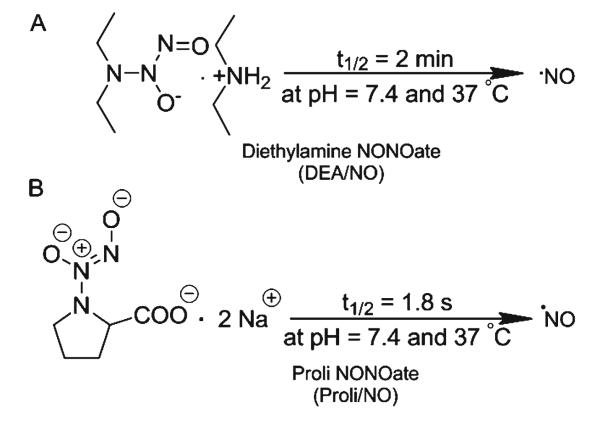
The general procedure for preparation of the NONOate salts is as follows: The NONOate salt was dissolved in 1 mL 0.01 M NaOH to obtain a stable 10-mg/mL NONOate standard solution. This solution was then diluted four to five times in phosphate or PBS in order to initiate the hydrolysis reaction and production of NO. The sample was again diluted tenfold in run buffer or water prior to introduction into the chip. The pH of the phosphate or PBS was selected such that the final pH was around pH 7 after addition of NONOate dissolved in NaOH solution. The reaction for the generation of NO using the two types of NONOate salts is depicted in Fig. 2.
Fig. 2.
Generation of NO using a DEA/NO and b PROLI/NO (www.caymanchem.com)
First, DEA/NO was investigated with two different sets of acidic buffers to initiate the acid hydrolysis—10 mM phosphate buffer with pH 2–3 and 10 mM PBS with pH 2–3 (the pH of the phosphate and PBS buffer was adjusted to 2–3 by acidifying stock buffer solutions using concentrated HCl). DEA/NO was diluted five times in this acidified solution (phosphate or PBS). When phosphate buffer was employed for hydrolysis, the sample was diluted ten times in run buffer (10 mM boric acid with 2 mM TTAB at pH 11) prior to analysis. When PBS was used, the sample was diluted ten times in deionized water.
PROLI/NO sample preparation was straightforward after optimizing the acid hydrolysis conditions with DEA/NO. To prepare a PROLI/NO standard, 10 mg of PROLI/NO was dissolved in 10 mM NaOH (800 μL). Then 250 μL of PROLI/NO NaOH solution was diluted into 750 μL of 10 mM PBS with 2 mM TTAB at pH 2. This solution was further diluted 10 times in degassed water and analyzed.
Microchip operation
Freshly prepared PDMS microchips were conditioned with 0.1 M NaOH solution followed by run buffer. For ME-based analysis, the potentials were applied to the reservoirs, as indicated in Fig. 1. At this point, the currents registered would be approximately 11–12 and 8–9 μA for the buffer reservoir (BR) and sample reservoir (SR), respectively. The high voltage was turned off for sample introduction. Next, the BGE was replaced by the sample at SR, the potentiostat was turned on for data acquisition, and the gated injection program was run. The acquired data were processed using Microcal Origin 8.0.
Results and discussion
Our research group has been working on separation strategies for RNS, which includes NO. The main advantage of using a separation method is the possibility of detection and quantification of several related species in complex matrices, which improves the selectivity of the method. We previously reported ME-based methods for the detection of nitrate, nitrite, peroxynitrite, and RNS-related species [27, 31, 32]. The present study was focused on detection of NO using ME–EC, and this goal was accomplished by employing NO-donor NONOate salts. The dynamic behavior of NONOates during acid hydrolysis can be used to investigate the electrophoretic behavior of NO. That is, one can observe nitrite generation, NONOate decomposition, and NO generation and/or decomposition with ME–EC during the acid hydrolysis of NONOates. The migration times for the NONOate anions can be determined by diluting NONOate stock solution in high pH run buffer and ME–EC analysis. This makes it possible to identify the NO peak (that is produced upon hydrolysis) based on migration order and its appearance using low pH reaction buffer. Also, ME–EC is an alternative way to investigate NO generation from NONOate as a function of pH. Since NONOates are commonly employed for biological investigations as a NO delivery system, ME–EC will yield a better understanding of the mechanism of NO delivery under different pH and solvent conditions.
NO and NO donors are electroactive and can be directly oxidized at Pt electrodes. For these studies, in-channel amperometric detection was employed. With this configuration, the exact potential needed for the oxidation is dependent on the position of the working electrode in the separation field [27, 42]. When the electrode was placed fully inside the channel (10 μm from the channel end) for amperometric detection with reverse polarity conditions (negative polarity at sample reservoir), there was an approximately 450 mV negative shift in half-wave potential for nitrite and H2O2 standards in comparison to the half-wave potentials observed for end channel detection (electrode placed 10 μm outside of the channel) [27]. Hence, a lower potential must be applied to the working electrode for oxidation of analytes since the voltage bias is additive under reverse polarity separation conditions. Therefore, a hydrodynamic voltammetric experiment must be performed with each new microchip to determine the voltage bias. We reported previously that the voltage bias produced by the separation field can be minimized by placing the working electrode at the very end of the separation channel but still in the channel (0–5 μm). This approach also preserves the high separation efficiencies characteristic of in-channel detection, making it possible to resolve closely migrating species [27].
Optimization of the detection potential was necessary to assure good sensitivity with this electrochemical detection scheme. In these experiments, the potential was set at +1.0 to +1.1 V vs. Ag/AgCl reference, which is sufficiently positive for the oxidation of NO, nitrite, and the NO donors. Another useful approach consists of injecting a 100-μM nitrite solution and checking the peak height, which should be higher than 2.5 nA.
Both 10 mM phosphate and 10 mM PBS at pH 2–3 were evaluated for the hydrolysis studies. Following ME–EC analysis, three peaks corresponding to DEA/NO, NO, and nitrite were obtained. It was found that PBS appeared to be the better reaction medium. It was also determined that the desired final pH of the NONOate buffer solution was approximately 7. Since the hydrolysis reaction is highly dependent on the pH of the solution, one must be aware that below pH 5, the reaction is so fast that only the nitrite peak is observed. At final pH values above 8, NO cannot be detected.
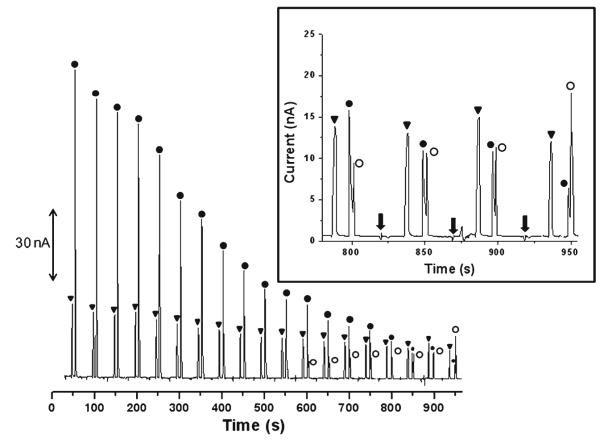
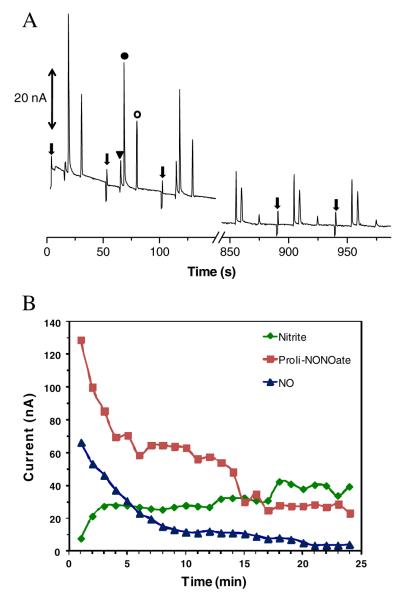
Figure 3 shows typical results obtained for the acid hydrolysis of DEA/NO in PBS. The electropherogram shows sequential injections of the DEA/NO sample. The migration times for nitrite, DEA/NO, and NO were 22.0± 0.3, 33.5±0.4, and 37.6±0.2 s, respectively. This migration order can be expected because nitrite is smaller than DEA/NO, although both species have one negative charge. Since NO is neutral, it moves with the electroosmotic flow (EOF). The efficiencies given in plates per meter were 2.5±0.4×10⁴, 1.0±0.5×10⁵, and 1.1±0.4×10⁵ for nitrite, DEA/NO, and NO, respectively. Although the nitrite peak presented a slow decrease in height (about 44% after 10 injections) over time, the decrease in response for the DEA/NO peak was more dramatic. The observed decay for nitrite could be due to electrokinetic injection irreproducibility and stacking effects due to saline used with phosphate.
Fig. 3.
Monitoring the acid hydrolysis of DEA/NO at pH 7. Conditions: BGE 10 mM boric acid, 2 mM TTAB, pH 11. Triangle nitrite; solid circle DEA/NO; open circle NO. Gated injection −2,200 V at SR, −2,400 V at BR, 1 s injection, 60 s run. The inset shows the magnification of the electropherogram from 750 to 950 s. The arrows indicate the sample injection
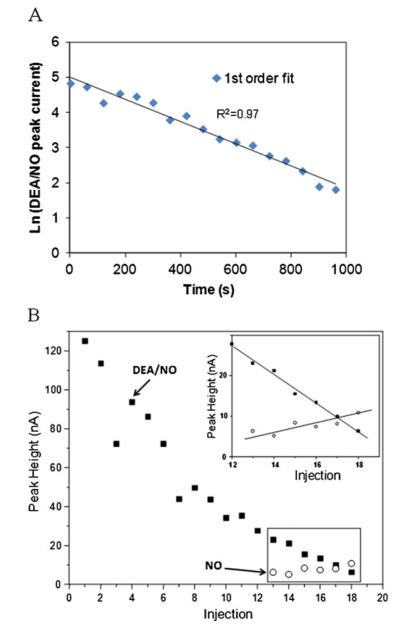
The DEA/NO peak could be identified by measuring the kinetics of the DEA/NO hydrolysis reaction. The peak corresponding to DEA/NO exhibited peak currents that were fitted into zero-, first-, and second-order rate law. The best correlation (R2=0.97) was obtained for a first-order reaction (versus 0.90 and 0.76 for zero and second order, respectively) (Fig. 4a). This agrees with the vendor product information for the reaction of DEA/NO (www.caymanchem.com). After the tenth injection (10 min), there was an appearance of a shoulder at the DEA/NO peak that became a clear third peak upon subsequent injections. This new peak indicates NO production. This NO peak is not visible in the first injections because of the high intensity of the DEA/NO peak. When the DEA/NO peak becomes smaller, the resolution is adequate for identification of NO.
Fig. 4.
a DEA/NO peak decay fit into first-order rate law. b Peak heights obtained during DEA/NO acid hydrolysis as a function of sequential injections
Figure 4b shows the peak heights for DEA/NO and NO as a function of time. In the case of NO, only the last six injections were taken into account. From this figure, it is also possible to see the exponential decay of the DEA/NO peak. The inset in Fig. 4b shows that the rate of increase in height of the NO peak corresponds with the decrease in response for DEA/NO. It was also observed after several injections that the NO peak height was reduced (after 18th injection in the electropherogram in Fig. 3), probably due to volatilization from the sample reservoir or reactions with oxygen. These experiments were not performed under an inert atmosphere, except that the solutions were degassed by bubbling nitrogen at the start of the experiment.
Under the experimental conditions described above, the resolution between DEA/NO and NO peaks was low (R=1.0±0.2), and NO migrated with DEA/NO when the concentration of the NONOate salt was higher. Therefore, a different NONOate salt was selected in an attempt to improve resolution based on the structure of the NONOate. As shown in Fig. 2b, the net negative charge of the PROLI/NO molecule is 2. DEA/NO has only one negative charge (Fig. 2a). Therefore, the electrophoretic mobility of PROLI/NO should be higher than that of DEA/NO, leading to improved resolution of PROLI/NO and NO. Figure 5a shows electropherograms obtained for sequential injections of PROLI/NO. As expected, PROLI/NO and NO were fully separated. Although PROLI/NO migrates closer to nitrite, good resolution between nitrite and PROLI/NO was also observed (R=2.4±0.2). The migration times obtained for nitrite, PROLI/NO, and NO were 16.4±0.2, 20.1±0.4, and 34.5±0.7 s. The efficiencies given in plates per meter were 6.3±1.1×10⁴, 7.7±1.3×10⁴, and 3.1±0.3×10⁵ for nitrite, PROLI/NO, and NO, respectively. As shown in Fig. 5b, the PROLI/NO, NO, and nitrite peak heights changed over time due to PROLI/NO hydrolysis. Injection of 100 μM nitrite standard confirmed the peak assignment for nitrite (Electronic Supplementary Material Figure S1).
Fig. 5.
a Monitoring the acid hydrolysis of PROLI/NO at pH 7.2–7.4. Triangle nitrite; solid circle PROLI/NO; open circle NO. The arrows indicate sample injections. Other conditions as in Fig. 3. b Peak heights as function of sequential injections
Similar to that for DEA/NO, the pH of PROLI/NO in the final buffer should be around pH 7 to facilitate the hydrolysis reaction. Also in PROLI/NO experiments, it was still found that whenever the pH of the final hydrolysis solution was above 8, only two peaks were observed, those of parent PROLI/NO and nitrite. At pH=9, we observed two stable peaks in the electropherograms for nitrite (13.5±0.7) and PROLI/NO (43.0±9.6 nA), respectively, over a period of approximately 5 min as shown in Fig. 6. This means that the conditions for the reaction can be adjusted on-chip for advanced applications, for example, a confluence of NO donor delivery and reaction.
Fig. 6.
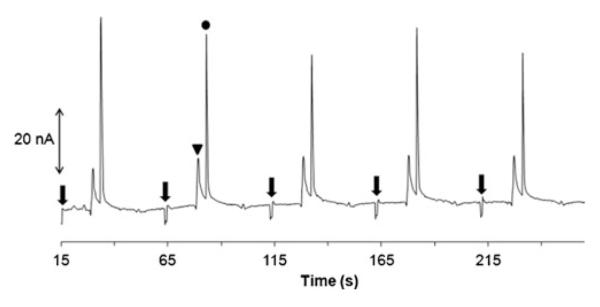
Monitoring the acid hydrolysis of PROLI/NO at pH 9.0. Triangle nitrite; solid circle PROLI/NO. The arrows indicate sample injections. Other conditions as in Fig. 3
Conclusions
In this paper, a method for monitoring NO generation by NONOate salts using microchip electrophoresis with electrochemical detection is presented. The hydrolysis reaction was initiated by mixing the NONOate in NaOH solution with an acidic buffer to obtain the desired reaction pH. For DEA/NO and PROLI/NO, we observed that pH around 7 was suitable to promote the hydrolysis, while no detectable degradation occurred above pH 8. The progress of the reaction could be monitored through sequential injections from the sample reservoir followed by electrophoretic separation. Nitrite was present in all the NONOate standards investigated; however, it did not interfere with the separation, as it has a higher negative electrophoretic mobility than the NO donors. NO migrated with the velocity of the EOF. The total separation was performed in less than 40 s with satisfactory resolution and good efficiency.
Supplementary Material
Acknowledgments
The authors are grateful for financial support, research fellowships, and scholarships from CNPq and FAPESP (grants 2010/01046-6, 2008/57805-2, and 2008/53868-0). Instituto Nacional de Ciência e Tecnologia em Bioanalítica (INCTBio) is also thanked. This research was also funded by NIH (USA) grants R01 NS042929 and R21 NS061202. M.K.H. was a recipient of an American Heart Association (USA) postdoctoral fellowship. The authors acknowledge the Stanford Nanofabrication Facility for providing Pt-deposited glass plates. The authors would also like to thank Dr. Christian Schöneich for helpful discussions, Ryan J. Grigsby for assistance with microfabrication, and Nancy Harmony for editorial support.
Biography

Jose Alberto Fracassi da Silva graduated in Chemistry from the Sao Paulo State University in 1996, where he also received his Ph.D. in Analytical Chemistry in 2001. This was followed by a postdoctoral position at the Laboratory of Integrated Systems, in Polytechnic School in the University of Sao Paulo. In 2004, he obtained a position at State University of Campinas, in Campinas, São Paulo, Brazil. In 2010, he was a visiting scholar at The Ralph Adams Institute for Bioanalytical Chemistry, University of Kansas (USA). His main research interests are focused on bioanalytical methods and instrumentation for capillary and microchip electrophoresis.
Footnotes
Electronic supplementary material The online version of this article (doi:10.1007/s00216-012-5810-4) contains supplementary material, which is available to authorized users.
Contributor Information
Dulan B. Gunasekara, Department of Chemistry, University of Kansas, Lawrence, KS 66045, USA; Ralph N. Adams Institute for Bioanalytical Chemistry, University of Kansas, Lawrence, KS 66045, USA
Matthew K. Hulvey, Ralph N. Adams Institute for Bioanalytical Chemistry, University of Kansas, Lawrence, KS 66045, USA; Akermin Inc., St. Louis, MO 63134, USA
Susan M. Lunte, Department of Chemistry, University of Kansas, Lawrence, KS 66045, USA; Ralph N. Adams Institute for Bioanalytical Chemistry, University of Kansas, Lawrence, KS 66045, USA; Department of Pharmaceutical Chemistry, University of Kansas, Lawrence, KS 66045, USA
José Alberto Fracassi da Silva, Ralph N. Adams Institute for Bioanalytical Chemistry, University of Kansas, Lawrence, KS 66045, USA; Instituto de Química, Universidade Estadual de Campinas, Campinas, São Paulo 13083-000, Brazil.
References
- 1.Pacher P, Beckman JS, Liaudet L. Physiol Rev. 2007;87:315–424. doi: 10.1152/physrev.00029.2006. [DOI] [PMC free article] [PubMed] [Google Scholar]
- 2.Wu C-M, Chen Y-H, Dayananda K, Shiue T-W, Hung C-H, Liaw W-F, Chen P-Y, Wang Y-M. Anal Chim Acta. 2011;708:141–148. doi: 10.1016/j.aca.2011.10.005. [DOI] [PubMed] [Google Scholar]
- 3.Olasehinde EF, Takeda K, Sakugawa H. Anal Chem. 2009;81:6843–6850. doi: 10.1021/ac901128y. [DOI] [PubMed] [Google Scholar]
- 4.Kim WS, Ye XY, Rubakhin SS, Sweedler JV. Anal Chem. 2006;78:1859–1865. doi: 10.1021/ac051877p. [DOI] [PubMed] [Google Scholar]
- 5.Gabe Y, Urano Y, Kikuchi K, Kojima H, Nagano T. J Am Chem Soc. 2004;126:3357–3367. doi: 10.1021/ja037944j. [DOI] [PubMed] [Google Scholar]
- 6.Kojima H, Hirotani M, Nakatsubo N, Kikuchi K, Urano Y, Higuchi T, Hirata Y, Nagano T. Anal Chem. 2001;73:1967–1973. doi: 10.1021/ac001136i. [DOI] [PubMed] [Google Scholar]
- 7.Kojima H, Nakatsubo N, Kikuchi K, Kawahara S, Kirino Y, Nagoshi H, Hirata Y, Nagano T. Anal Chem. 1998;70:2446–2453. doi: 10.1021/ac9801723. [DOI] [PubMed] [Google Scholar]
- 8.Nagano T, Yoshimura T. Chem Rev. 2002;102:1235–1269. doi: 10.1021/cr010152s. [DOI] [PubMed] [Google Scholar]
- 9.Shin JH, Privett BJ, Kita JM, Wightman RM, Schoenfisch MH. Anal Chem. 2008;80:6850–6859. doi: 10.1021/ac800185x. [DOI] [PMC free article] [PubMed] [Google Scholar]
- 10.Privett BJ, Shin JH, Schoenfisch MH. Chem Soc Rev. 2010;39:1925–1935. doi: 10.1039/b701906h. [DOI] [PMC free article] [PubMed] [Google Scholar]
- 11.Hetrick EM, Schoenfisch MH. Annu Rev Anal Chem. 2009;2:409–433. doi: 10.1146/annurev-anchem-060908-155146. [DOI] [PMC free article] [PubMed] [Google Scholar]
- 12.Huang JM, Sommers EM, Kim-Shapiro DB, King SB. J Am Chem Soc. 2002;124:3473–3480. doi: 10.1021/ja012271v. [DOI] [PubMed] [Google Scholar]
- 13.Vitecek J, Petrlova J, Petrek J, Adam V, Potesil D, Havel L, Mikelova R, Trnkova L, Kizek R. Electrochim Acta. 2006;51:5087–5094. [Google Scholar]
- 14.Kikura-Hanajiri R, Martin RS, Lunte SM. Anal Chem. 2002;74:6370–6377. doi: 10.1021/ac0204000. [DOI] [PubMed] [Google Scholar]
- 15.Kang S-M, Kim K-N, Lee S-H, Ahn G, Cha S-H, Kim A-D, Yang X-D, Kang M-C, Jeon Y-J. Carbohydr Polym. 2011;85:80–85. [Google Scholar]
- 16.Grau M, Hendgencotta U, Brouzos P, Drexhage C, Rassaf T, Lauer T, Dejam A, Kelm M, Kleinbongard P. J Chromatogr B. 2007;851:106–123. doi: 10.1016/j.jchromb.2007.02.002. [DOI] [PubMed] [Google Scholar]
- 17.Andrade R, Viana CO, Guadagnin SG, Reyes FGR, Rath S. Food Chem. 2003;80:597–602. [Google Scholar]
- 18.Mainz ER, Gunasekara DB, Caruso G, Jensen DT, Hulvey MK, da Silva JAF, Metto EC, Culbertson AH, Culbertson CT, Lunte SM. Anal Methods. 2012;4:414–420. [Google Scholar]
- 19.Lunte SM, Gunakesera DB, Metto EC, Hulvey MK, Mainz ER, Caruso G, da Silva JAF, Jensen DT, Culbertson AH, Grigsby RJ, Culbertson CT. MicroTAS. 2011:1728–1730. [Google Scholar]
- 20.Arora A, Simone G, Salieb-Beugelaar GB, Kim JT, Manz A. Anal Chem. 2010;82:4830–4847. doi: 10.1021/ac100969k. [DOI] [PubMed] [Google Scholar]
- 21.Martin RS. Methods Mol Biol. 2006;339:85–112. doi: 10.1385/1-59745-076-6:85. [DOI] [PubMed] [Google Scholar]
- 22.Kuban P, Hauser PC. Electrophoresis. 2009;30:3305–3314. doi: 10.1002/elps.200900217. [DOI] [PubMed] [Google Scholar]
- 23.Pumera M, Merkoci A, Alegret S. TrAC Trends Anal Chem. 2006;25:219–235. [Google Scholar]
- 24.Garcia CD, Henry CS. Coupling electrochemical detection with microchip capillary electrophoresis. CRC; Boca Raton: 2007. pp. 265–297. [Google Scholar]
- 25.Fischer DJ, Hulvey MK, Regel AR, Lunte SM. Electrophoresis. 2009;30:3324–3333. doi: 10.1002/elps.200900317. [DOI] [PMC free article] [PubMed] [Google Scholar]
- 26.Wang J, Pumera M, Chatrathi MP, Rodriguez A, Spillman S, Martin RS, Lunte SM. Electroanalysis. 2002;14:1251–1255. [Google Scholar]
- 27.Gunasekara DB, Hulvey MK, Lunte SM. Electrophoresis. 2011;32:832–837. doi: 10.1002/elps.201000681. [DOI] [PMC free article] [PubMed] [Google Scholar]
- 28.Holcomb RE, Kraly JR, Henry CS. Analyst. 2009;134:486–492. doi: 10.1039/b816289a. [DOI] [PubMed] [Google Scholar]
- 29.Pumera M, Escarpa A. Electrophoresis. 2009;30:3315–3323. doi: 10.1002/elps.200900008. [DOI] [PubMed] [Google Scholar]
- 30.Wang Y, Yin M. Microchim Acta. 2009;166:243–249. [Google Scholar]
- 31.Hulvey MK, Frankenfeld CN, Lunte SM. Anal Chem. 2010;82:1608–1611. doi: 10.1021/ac902821v. [DOI] [PMC free article] [PubMed] [Google Scholar]
- 32.Vázquez M, Frankenfeld C, Coltro WKT, Carrilho E, Diamond D, Lunte SM. Analyst. 2010;135:96–103. doi: 10.1039/b908985c. [DOI] [PubMed] [Google Scholar]
- 33.Wang PG, Xian M, Tang XP, Wu XJ, Wen Z, Cai TW, Janczuk AJ. Chem Rev. 2002;102:1091–1134. doi: 10.1021/cr000040l. [DOI] [PubMed] [Google Scholar]
- 34.Hrabie JA, Keefer LK. Chem Rev. 2002;102:1135–1154. doi: 10.1021/cr000028t. [DOI] [PubMed] [Google Scholar]
- 35.Carroll JS, Ku C-J, Karunarathne W, Spence DM. Anal Chem. 2007;79:5133–5138. doi: 10.1021/ac0706271. [DOI] [PubMed] [Google Scholar]
- 36.Halpin ST, Spence DM. Anal Chem. 2010;82:7492–7497. doi: 10.1021/ac101130s. [DOI] [PubMed] [Google Scholar]
- 37.Letourneau S, Hernandez L, Faris AN, Spence DM. Anal Bioanal Chem. 2010;397:3369–3375. doi: 10.1007/s00216-010-3687-7. [DOI] [PubMed] [Google Scholar]
- 38.Genes LI, Tolan NV, Hulvey MK, Martin RS, Spence DM. Lab Chip. 2007;7:1256–1259. doi: 10.1039/b712619k. [DOI] [PubMed] [Google Scholar]
- 39.Hulvey MK, Martin RS. Anal Bioanal Chem. 2009;393:599–605. doi: 10.1007/s00216-008-2468-z. [DOI] [PMC free article] [PubMed] [Google Scholar]
- 40.Spence DM, Torrence NJ, Kovarik ML, Martin RS. Analyst. 2004;129:995–1000. doi: 10.1039/b410547h. [DOI] [PubMed] [Google Scholar]
- 41.Zhang G, Du W, Liu B-F, Hisamoto H, Terabe S. Anal Chim Acta. 2007;584:129–135. doi: 10.1016/j.aca.2006.10.046. [DOI] [PubMed] [Google Scholar]
- 42.Martin RS, Ratzlaff KL, Huynh BH, Lunte SM. Anal Chem. 2002;74:1136–1143. doi: 10.1021/ac011087p. [DOI] [PubMed] [Google Scholar]
Associated Data
This section collects any data citations, data availability statements, or supplementary materials included in this article.


