Abstract
This contribution reports solution-phase structural studies of oligomers of a family of peptides derived from the β-amyloid peptide (Aβ). We had previously reported the X-ray crystallographic structures of the oligomers and oligomer assemblies formed in the solid state by a macrocyclic β-sheet peptide containing the Aβ15–23 nonapeptide. In the current study, we set out to determine its assembly in aqueous solution. In the solid state, macrocyclic β-sheet peptide 1 assembles to form hydrogen-bonded dimers that further assemble in a sandwich-like fashion to form tetramers through hydrophobic interactions between the faces bearing V18 and F20. In aqueous solution, macrocyclic β-sheet peptide 1 and homologue 2a form hydrogen-bonded dimers that assemble to form tetramers through hydrophobic interactions between the faces bearing L17, F19, and A21. In the solid state, the hydrogen-bonded dimers are antiparallel, and the β-strands are fully aligned, with residues 17–23 of one of the macrocycles aligned with residues 23–17 of the other. In solution, residues 17–23 of the hydrogen-bonded dimers are shifted out of alignment by two residues toward the C-termini. The two hydrogen-bonded dimers are nearly orthogonal in the solid state, while in solution the dimers are only slightly rotated. The differing morphology of the solution-state and solid-state tetramers is significant, because it may provide a glimpse into some of the structural bases for polymorphism among Aβ oligomers in Alzheimer’s disease.
Introduction
Soluble amyloid oligomers are now thought to be the main toxic species that cause neurodegeneration in Alzheimer’s and other amyloid diseases.1−10 Small assemblies made up of dimers, trimers, and tetramers of the β-amyloid peptide (Aβ), as well as larger assemblies such as dodecamers, have been shown to disrupt synaptic activity and cause neuronal cell death.11−17 Atomic-level details of the structures of amyloid oligomers are desperately needed in order to understand how the oligomers form and the molecular basis by which they cause neurodegeneration.
The oligomers are polymorphic and dynamic, forming as different species and equilibrating slowly with the monomer and with β-amyloid fibrils, which are generally more stable.8,9,18−20 While the structures of amyloid oligomers are still largely unknown, a number of approaches have been taken to gain insights into their structures. β-Sheet structure and interactions—a common feature of amyloid fibril formation—are generally thought to be important in the structures and interactions of amyloid oligomers.20−25 Incorporation of amyloidogenic peptides into larger proteins can control amyloid supramolecular assembly and allow observation of oligomeric assemblies at atomic resolution.26 Peptide fragments can also serve as chemical models of oligomers; X-ray crystallographic studies of these peptide fragments have provided insights into the structures of amyloid oligomers.27,28 Chemical cross-links within amyloidogenic monomers that stabilize folded β-sheet conformations can promote oligomer formation and help prevent fibril formation.29−31 These cross-linked systems are more amenable to study and can provide simpler and more stable chemical models of the unstable oligomers formed by amyloidogenic peptides and proteins. Computational models of oligomers have been constructed from atomic-level structures of amyloid fibrils, which are understood far better at atomic resolution than the oligomers.32−34
Our laboratory is gaining insights into the structures and interactions of amyloid oligomers by combining fragments of amyloidogenic peptides and proteins with molecular templates to create macrocycles that promote β-sheet structure and interactions while blocking amyloid fibril formation.35,36 We recently reported the X-ray crystallographic structures of oligomers of a peptide from β-amyloid.37 We incorporated the nonapeptide sequence QKLVFFAED (Aβ15–23) into macrocyclic β-sheet peptide 1, with δ-linked ornithine turn units and a template strand that features an unnatural amino acid, Hao.38,39 In the solid state, the macrocycle folds to form a β-sheet. The β-sheet forms a hydrogen-bonded dimer, which assembles face-to-face to make a cruciform tetramer, which is a key subunit of the lattice. The cruciform tetramers assemble into triangular dodecamers, and the triangular dodecamers further assemble into the lattice.
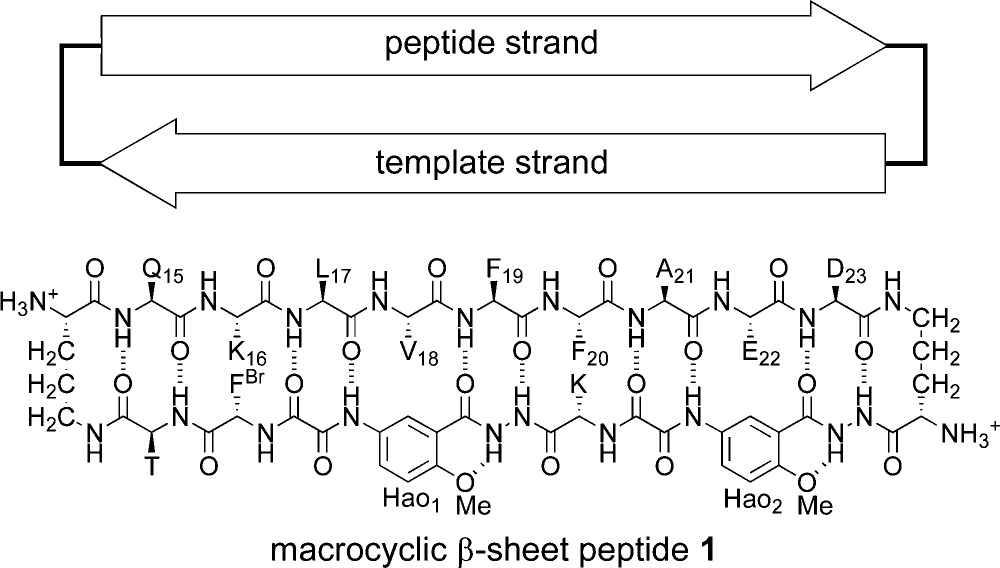 |
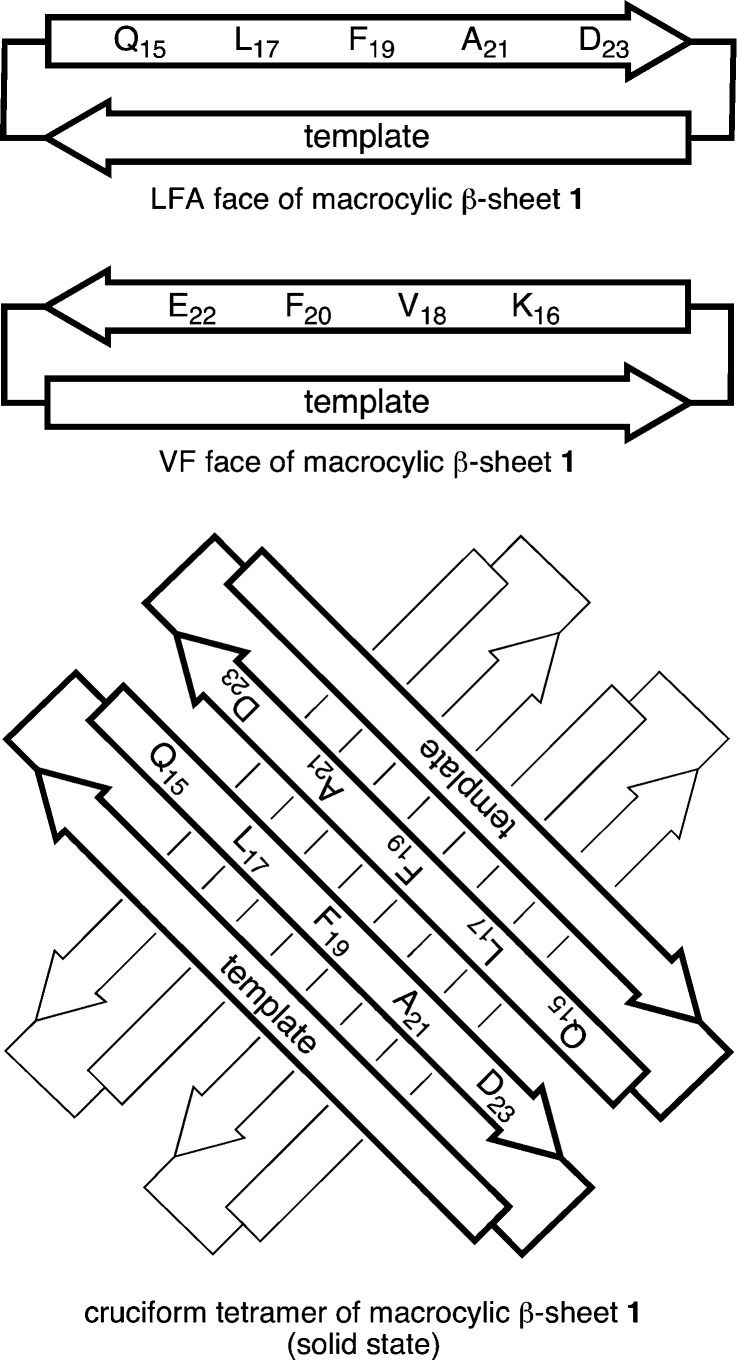
The hydrogen-bonded dimers are antiparallel, and the β-strands are fully aligned, with residues 17–23 of one of the macrocycles aligned with residues 23–17 of the other. The resulting four-stranded β-sheet forms a plane, with the side chains projecting from the upper and lower faces of the plane. Residues K16, V18, F20, and E22 of each macrocycle project from one face of the plane (the VF face), and residues Q15, L17, F19, A21, D23 of each macrocycle project from the other face of the plane (the LFA face). The VF face has the hydrophobic residues V18 and F20 flanked by the polar residues K16 and E22. The LFA face has the hydrophobic residues L17, F19, and A21 flanked by the polar residues Q15 and D23. The hydrogen-bonded dimers assemble in a crisscross fashion through hydrophobic interactions between the VF faces to give the cruciform tetramers. Figure 1 illustrates the faces of the macrocycle and the structure of the cruciform tetramer.
Figure 1.
Cartoon illustrating the LFA and VF faces of macrocyclic β-sheet 1 and the cruciform tetramer formed in the solid state. The VF faces form the inner hydrophobic core of the cruciform tetramer, and the LFA faces form the outer surface.
In the current study, we set out to determine how macrocyclic β-sheet peptides containing the Aβ15–23 nonapeptide assemble in solution. We began by using 1H NMR spectroscopy to study how macrocyclic β-sheet peptide 2a folds and oligomerizes in aqueous solution. We had envisioned macrocyclic β-sheet 1 as a homologue of macrocyclic β-sheet 2a. The two molecules differ only in that 1 contains a p-bromophenylalanine (FBr) in the template strand, for single anomalous dispersion (SAD) phasing in X-ray crystallographic structure determination, while 2a contains a tyrosine.37 As our studies of macrocyclic β-sheet 2a unfolded, we prepared additional homologues (2b, 2c, 3, and 4) to interrogate the assembly process. The following describes these studies and elucidates how the tetramer that forms in solution differs from that which forms in the solid state.
 |
Results
1. Tetramerization of Macrocyclic β-Sheet Peptides 1 and 2a
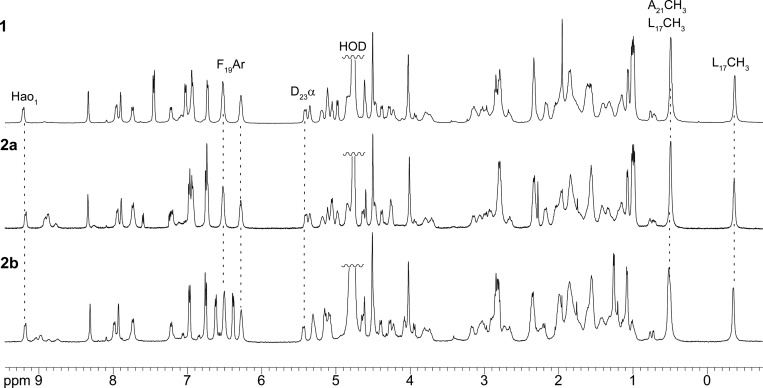
We investigated the folding and assembly of the macrocyclic β-sheets in D2O and in H2O–D2O solution by NMR spectroscopy. At millimolar concentrations, the 1H NMR spectrum of macrocyclic β-sheet 2a is disperse, with methyl resonances from L17 and A21 unusually upfield (−0.35 and 0.49 ppm), aromatic resonances from F19 unusually upfield (6.28 and 6.52 ppm), and many of the amino acid α-protons unusually downfield (≥5.0 ppm). One of the resonances from one of the Hao amino acids (the H4 resonance of Hao1) appears unusually downfield at 9.17 ppm. The upfield shifting of the aromatic and aliphatic resonances is characteristic of the formation of an oligomer with a well-packed hydrophobic core comprising aromatic residues (Hao, Phe, etc.) and aliphatic residues (Leu, Ala, etc.). Minor additional resonances, associated with a monomer lacking a hydrophobic core are also present, most notably at 0.69–0.79 ppm (L17 and V18). Figure 2 illustrates the 1H NMR spectrum of macrocyclic β-sheet 2a at 2.0 mM in D2O solution.
Figure 2.
1H NMR spectra of macrocyclic β-sheet peptides 1, 2a, and 2b at 2.0 mM in D2O at 500 MHz and 298 K. Noteworthy resonances that reflect important shared features of the folding and assembly of these peptides are labeled and highlighted with dashed lines.
The 1H NMR spectrum of macrocyclic β-sheet 1 is virtually identical to that of macrocyclic β-sheet 2a, indicating that both peptides fold and oligomerize in a similar fashion in solution. The 1H NMR spectrum of macrocyclic β-sheet 1 also exhibits additional minor resonances from L17 and V18 associated with a monomer lacking a hydrophobic core. These resonances are similar in intensity to those of macrocyclic β-sheet 2a, indicating that the oligomers formed by both macrocycles are similar in association constant (Kassoc) as well as in structure.
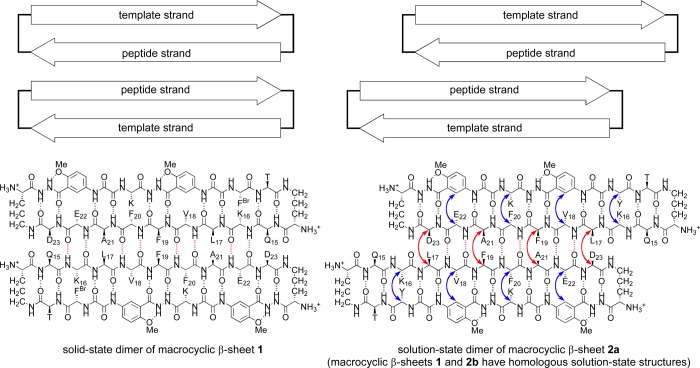
1H NMR NOESY studies establish the formation of hydrogen-bonded dimers that are antiparallel, with the β-strands of residues 17–23 shifted out of alignment by two residues toward the C-termini (Figure 3). Notably, the NOESY spectrum in D2O exhibits strong NOEs between the α-protons of L17 and D23 and between the α-protons of F19 and A21 (Figure 4). These NOEs reflect dimer formation. Additional strong NOEs associated with β-sheet folding of the macrocycles occur between the α-protons of K16 and Y and between the α-protons of F20 and K (Figure 4). Other NOEs characteristic of folding are described in detail in the SI, as are additional NOEs associated with folding and dimerization that are seen in the NOESY spectrum in H2O–D2O (90:10) (Figure S1a and b in the SI). Macrocyclic β-sheet 1 exhibits similar patterns of NOEs, indicating that it folds and dimerizes in a fashion similar to that of macrocycle 2a (Figure S2 in the SI). The shifted structure of the dimers formed by the macrocycles in solution stands in sharp contrast to the aligned structure of macrocycle 1 in the solid state (Figure 3).
Figure 3.
Cartoons and chemical structures illustrating the hydrogen-bonded dimers formed by macrocyclic β-sheet peptide 1 in the solid state (left) and by both macrocyclic β-sheet peptides 2a and 1 in solution (right). Both hydrogen-bonded dimers are antiparallel: In the solid-state dimer, residues 17–23 of one of the macrocycles align with residues 23–17 of the other; in the solution-state dimers, these β-strands are shifted out of alignment by two residues toward the C-termini. Key NOEs associated with solution-state dimerization and folding of 2a are shown with red and blue arrows.
Figure 4.
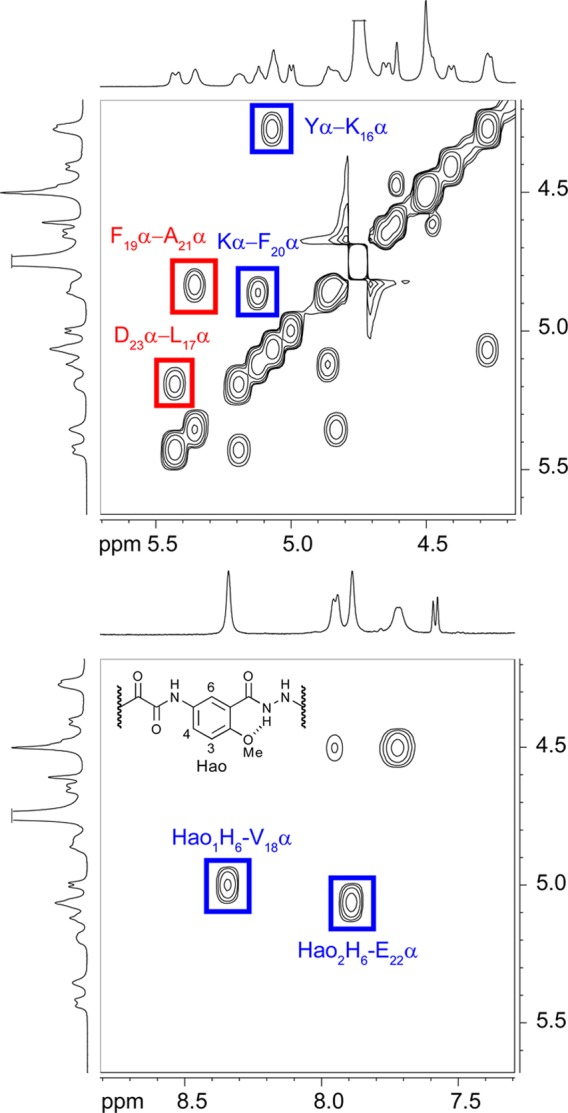
Selected expansions of the NOESY spectrum of macrocyclic β-sheet peptide 2a at 8.0 mM in D2O at 500 MHz and 300.5 K. Key intermolecular interstrand NOEs associated with dimerization are highlighted in red; key intramolecular interstrand NOEs associated with folding are highlighted in blue.
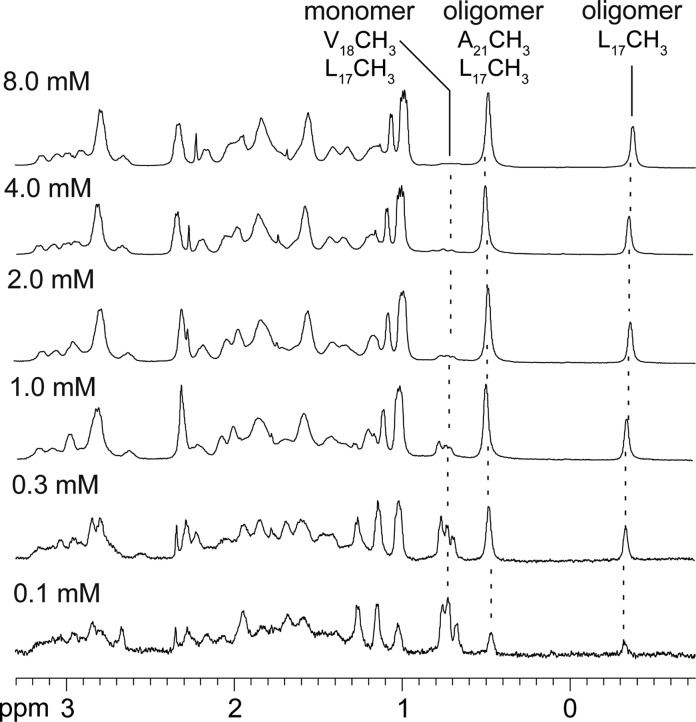
At low concentrations (e.g., ≤ 0.1 mM), the monomer predominates in the 1H NMR spectrum of macrocyclic β-sheet 2a. The methyl resonances from L17 and V18 of the monomer are prominent at 0.69–0.79 ppm, and the methyl resonances from L17 and A21 of the oligomer at −0.35 and 0.49 ppm are small. As the concentration of 2a is increased, the relative intensities of the resonances from the oligomer increase and the relative intensities of the resonances from the monomer decrease (Figure 5 and Figure S3 in the SI).40 At 0.2 mM, the resonances of the monomer and oligomer are roughly equal in intensity.41 At high concentrations (e.g., 8.0 mM), the resonances of the monomer are barely visible. The strong concentration dependence of the monomer–oligomer equilibrium is not consistent with a simple monomer–dimer equilibrium, but rather reflects cooperative association in which the dimers are a subunit of a higher-order oligomer—in this case a tetramer consisting of a dimer of dimers.
Figure 5.
Expansions of the 1H NMR spectra of macrocyclic β-sheet peptide 2a at various concentrations in D2O at 500 MHz and 298 K. Noteworthy characteristic resonances of the monomer and the oligomer are labeled and highlighted with dashed lines.
The NOESY spectrum of macrocyclic β-sheet 2a shows additional crosspeaks that are consistent with a tetramer in which two hydrogen-bonded dimers form a sandwich-like assembly. Notably, the NOESY spectrum in D2O exhibits NOEs between Hao2 and threonine and between Hao2 and Hao1 that only make sense as interlayer NOEs between the hydrogen-bonded dimers. Specifically, the methoxy group of Hao2 gives NOEs with the methyl group of threonine, and the H3 and H4 protons of Hao2 give NOEs with the H3 and H4 protons of Hao1. Figure 6 illustrates these interlayer NOE crosspeaks in the NOESY spectrum; Figure 7 illustrates the sandwich-like assembly consistent with these NOEs.42 Figure S4 and Table S1 (SI) provide additional data.
Figure 6.
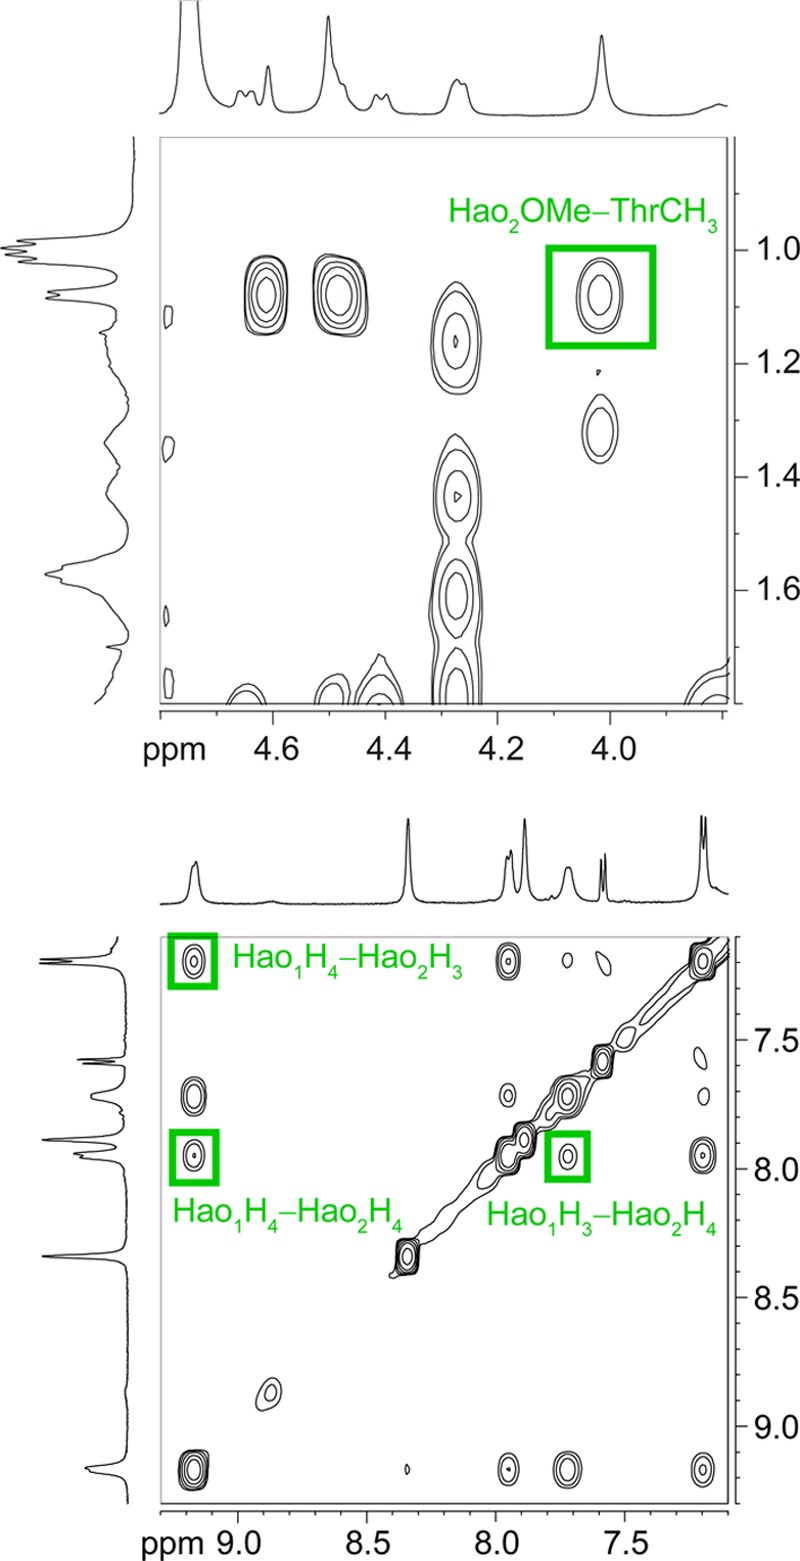
Selected expansions of the NOESY spectrum of macrocyclic β-sheet peptide 2a at 8.0 mM in D2O at 500 MHz and 300.5 K. Key interlayer NOEs associated with tetramerization are highlighted in green.
Figure 7.
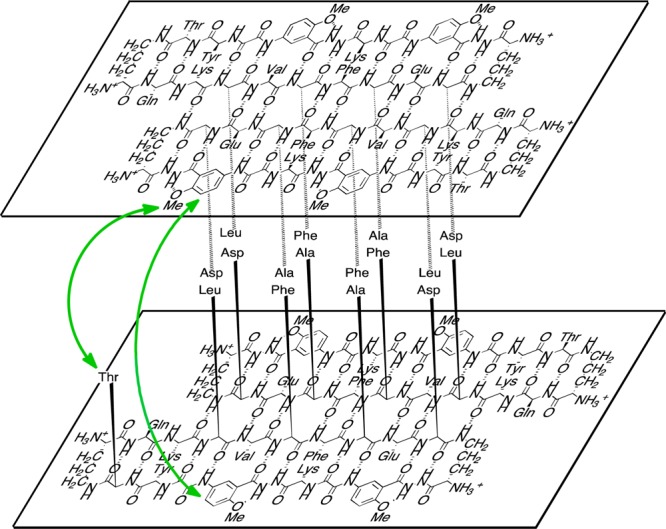
Illustration of the tetramer formed as a sandwich-like assembly of two hydrogen-bonded dimers of macrocyclic β-sheet peptide 2a in aqueous solution. The green arrow shows key NOEs between the layered β-sheets. Four sets of these interactions can occur in the tetramer. (For clarity, only one set is shown.) Macrocyclic β-sheet peptide 1 forms a similar sandwich-like tetramer in solution.
The four threonines of the tetramer point toward the interior of the sandwich-like assembly, as do all of the residues on the LFA faces of the β-sheets (Q15, L17, F19, A21, and D23). The magnetic anisotropy from the packed aromatic groups of the resulting hydrophobic core shift the methyl resonances of L17 and A21 upfield. The magnetic anisotropy also shifts the aromatic ring protons of F19 upfield. Thus, the structure of this solution-state tetramer, in which the LFA faces make up the hydrophobic core, differs markedly from the structure of the solid-state tetramer, in which the VF faces make up the hydrophobic core. In the solid-state structure, the LFA faces are on the exterior of the tetramer and the VF faces are on the interior; in the solution-state structure, the VF faces are on the exterior and the LFA faces are on the interior.
2. Disruption of Tetramer Formation
To probe the assembly of the tetramer, we studied macrocyclic β-sheet peptide 3. Macrocyclic β-sheet 3 is a homologue of 2a with a lysine in place of the threonine in the template strand. At 1.0 mM essentially no tetramer is observed in the 1H NMR spectrum of 3 (Figure 8). As the concentration is increased to 2.0 and 4.0 mM, resonances for the tetramer appear; at 8.0 mM the tetramer predominates. The tetramerization is far weaker than that of macrocyclic β-sheet 2a, in which the tetramer is observed at 0.1 mM and predominates at 0.3 mM.
Figure 8.
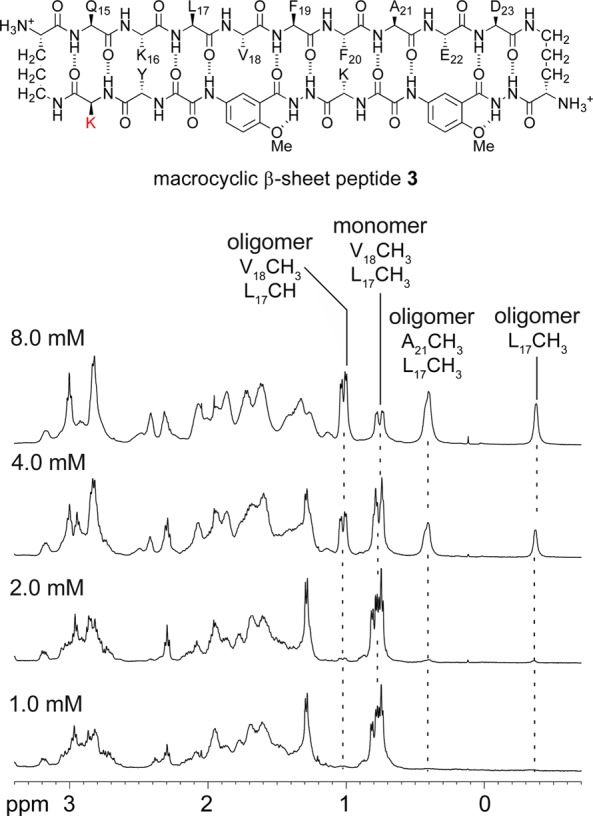
Expansions of the 1H NMR spectra of macrocyclic β-sheet peptide 3 at various concentrations in D2O at 500 MHz and 298 K. Noteworthy characteristic resonances of the monomer and the oligomer are labeled and highlighted with dashed lines.
Addition of salt (NaCl) augments tetramer formation, suggesting that intermolecular ionic repulsion is partially responsible for the diminished tetramerization of macrocyclic β-sheet 3. Without NaCl, macrocylic β-sheet 3 is 46% tetramerized at 4.0 mM; with 25 mM NaCl, it is 70% tetramerized; with 150 mM NaCl, it is 80% tetramerized (Figure S6 and Table S3 in the SI).43 The loss of hydrophobic interactions between the methyl group of threonine and the methoxy group of Hao2 may also contribute to the diminished stability of the tetramer of macrocyclic β-sheet 3.
Diffusion-ordered spectroscopy (DOSY) NMR studies support the formation of a tetrameric species.44,45 Measurement of the DOSY spectrum of macrocyclic β-sheet peptide 2a in D2O at 2.0 mM and 8.0 mM and 298 K gave a diffusion coefficient of 10.0 × 10⁻⁷ cm2/s and 10.1 × 10⁻⁷ cm2/s, respectively, for the oligomer.46,47 The diffusion coefficient does not vary from 2.0 mM to 8.0 mM, suggesting the presence of a single oligomerization state. The low concentration of monomer precluded measurement of its diffusion coefficient for comparison. Measurement of the DOSY spectrum of macrocyclic β-sheet peptide 3 in D2O at 2.0 mM and 298 K gave a diffusion coefficient of 16.4 × 10⁻⁷ cm2/s for the corresponding monomer. Consistent with tetramer formation, the diffusion coefficient of the oligomer of macrocyclic β-sheet peptide 2a is 0.61 times that of the monomer of macrocyclic β-sheet peptide 3.45,47−49
3. Facial Control of Tetramerization in Macrocyclic β-Sheet Peptides 2b and 2c
To further study the assembly of the tetramer, we mutated residues on the LFA and VF faces to examine how the hydrophobic residues on each face control tetramer formation. We created two double mutants of 2a, in which either the hydrophobic residues V18 and F20 or the hydrophobic residues F19 and A21 were rendered more hydrophilic by hydroxylation. In double mutant 2b, V18 was replaced with threonine and F20 was replaced with tyrosine (V18T,F20Y). In double mutant 2c, F19 was replaced with tyrosine and A21 was replaced with serine (F19Y,A21S).
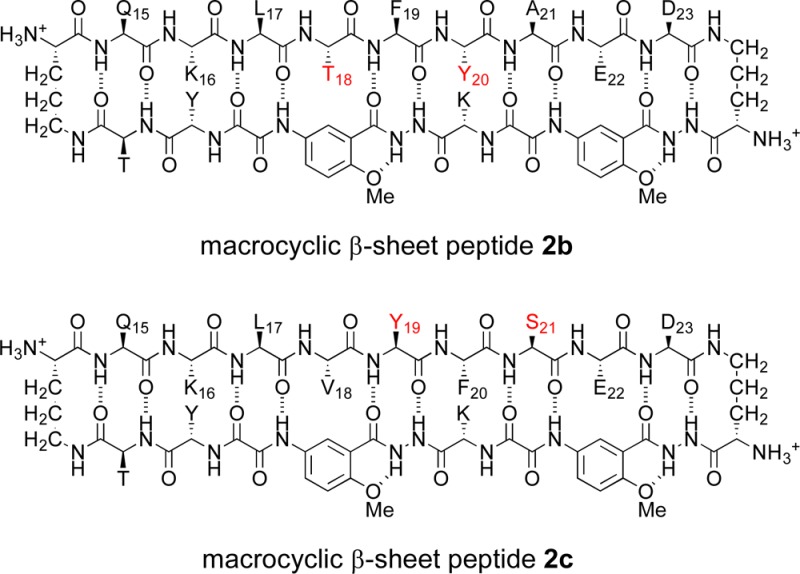
The 1H NMR spectrum of the V18T,F20Y double mutant 2b is strikingly similar to that of macrocyclic β-sheet 2a (Figure 2), indicating that 2a and 2b fold and oligomerize in a similar fashion in aqueous solution. The methyl resonances from L17 and A21 appear unusually upfield, the aromatic resonances from F19 also appear unusually upfield, and many of the amino acid α-protons appear unusually downfield. The 1H NMR spectra of both compounds reflect similar monomer–oligomer equilibria. At 0.1 mM, the monomer predominates and only small resonances from the tetramer are present; at 1.0 mM, the resonances from the tetramer predominate and only small resonances from the monomer are present. Thus, V18T,F20Y double mutation does not substantially alter the equilibrium constant for tetramer formation.
The 1H NMR spectrum of the F19Y,A21S double mutant 2c differs markedly from those of 2a and 2b (Figure S7 in the SI). The methyl resonances from L17 do not appear unusually upfield and the amino acid α-protons do not appear unusually downfield. These observations indicate that F19Y,A21S double mutation disrupts the formation of the tetramer. The 1H NMR spectrum of macrocyclic β-sheet 2c shows some minor broadened resonances at 2.0 mM, which diminish at lower concentrations, suggesting that some weaker nonspecific self-association may persist when tetramer formation is disrupted.
The dramatic differences between macrocyclic β-sheets 2b and 2c further demonstrate the importance of hydrophobic interactions of the LFA face of the macrocycle in tetramer formation. When the LFA face is hydroxylated, tetramer formation is disrupted, but when the VF face is hydroxylated, tetramer formation is not affected.
4. Hydrogen-Bonding Edge Control of Tetramerization in Macrocyclic β-Sheet Peptide 4
To probe the role of hydrogen bonding in tetramer formation, we blocked the hydrogen-bonding edge of the macrocycle by N-methylation. Macrocyclic β-sheet 4 is a homologue of macrocyclic β-sheet 2a with N-methylphenylalanine in place of phenylalanine at position 20. The F20FN-Me mutation is designed to block formation of the hydrogen-bonded dimer and thus the assembly of a tetramer comprising a dimer of hydrogen-bonded dimers. The 1H NMR spectrum of macrocyclic β-sheet 4 also differs markedly from those of 2a and 2b (Figure S7 in the SI). The methyl resonances from L17 and A21 do not appear unusually upfield and the amino acid α-protons do not appear unusually downfield. The disruption of tetramer formation by N-methylation demonstrates that hydrogen bonding is also essential for tetramer formation.

5. Diffusion Studies of Macrocyclic β-Sheet Peptides 1–4
DOSY NMR studies of macrocyclic β-sheets 1–4 suggest that 1, 2a, and 2b are tetrameric at millimolar concentrations, while 2c, 3, and 4 are monomeric.44,45,47 As mentioned above, the oligomeric 2a exhibits a diffusion coefficient of 10.0 × 10⁻⁷ cm2/s in D2O at 298 K, while monomeric 3 exhibits a diffusion coefficient of 16.4 × 10⁻⁷ cm2/s. The ratio of these diffusion coefficients — about 0.6 — is consistent with tetramer formation.45,47−49 Macrocyclic β-sheets 1 and 2b exhibit diffusion coefficients similar to that of 2a, while macrocyclic β-sheets 2c and 4 exhibit diffusion coefficients similar to that of 3 (Table 1).
Table 1. Diffusion Coefficients (D) of Peptides 1–4 in D2O at 298 K.
| peptide | MWmonomera (Da) | MWtetramera (Da) | D (10–7 cm2/s) | oligomer state |
|---|---|---|---|---|
| 1 | 2232 | 8929 | 10.1b | tetramer |
| 2a | 2169 | 8677 | 10.0b | tetramer |
| 10.1c | ||||
| 2b | 2187 | 8749 | 10.3b | tetramer |
| 10.1c | ||||
| 2c | 2201 | NA | 16.5b | monomer |
| 3 | 2196 | 8785 | 16.4b | monomer |
| 4 | 2183 | NA | 17.6b | monomer |
Molecular weight calculated for the neutral (uncharged) macrocycle.
Diffusion coefficient measured at 2.0 mM.
Diffusion coefficient measured at 8.0 mM.
6. Analytical Ultracentrifugation Studies of Macrocyclic β-Sheet Peptide 2b
To corroborate the DOSY studies, we performed analytical ultracentrifugation (AUC) sedimentation velocity studies on macrocyclic β-sheet 2b.50−53 The AUC studies are best performed in nonzero ionic strength to avoid nonideality resulting from charge interactions between the large cationic molecules. Thus, we performed AUC sedimentation velocity studies in the presence of salt, using 0.10, 0.30, and 0.66 mM solutions of macrocycle 2b in H2O containing 25 mM NaCl at 293 K. The sedimentation velocity data fit well to a reversible monomer–tetramer equilibrium with slow exchange on the time scale of the experiment (hours). The tetramer predominated at all three concentrations, with the greatest fraction of monomer present at 0.10 mM. Analysis of the data from the 0.10 mM experiment gave a good fit to a monomer–tetramer equilibrium with a 2.14 kDa monomer and a 8.55 kDa tetramer and a Kassoc of 1.93 × 10¹⁴ M–3.54,55 (For details see the SI.)
7. Folding of Macrocyclic β-Sheet Peptides 1–4
The magnetic anisotropy of the diastereotopic δ-protons of the δ-linked ornithine turn units in the 1H NMR spectra reflect that the tetramers of 1a, 2a, and 2b form well-folded β-sheets, while the monomers of 2c, 3, and 4 are only partially folded. In a well-folded macrocyclic β-sheet, the difference in the chemical shifts (Δδ) of the diastereotopic pro-S and pro-R δ-protons of the δ-linked ornithine turn units (δOrn) is about 0.6 ppm in aqueous solution.38,47,56 Values substantially lower than 0.6 ppm reflect the formation of partially folded macrocyclic β-sheet structures. At 2.0 mM and 298 K in D2O, the tetramers of 1, 2a, and 2b exhibit large magnetic anisotropies, while the monomers of 2c, 3, and 4 exhibit smaller magnetic anisotropies (Table 2). Thus, oligomerization promotes folding.
Table 2. Magnetic Anisotropies of the δ-Protons of the δ-Linked Ornithine Turn Units of Peptides 1–4 in D2O at 298 K.
| peptide | δOrn1 Δδ (ppm) | δOrn2 Δδ (ppm) | folding |
|---|---|---|---|
| 1a | 0.64 | 0.70 | folded tetramer |
| 2aa | 0.64 | 0.72 | folded tetramer |
| 2ba | 0.64 | 0.70 | folded tetramer |
| 2ca | 0.23d | 0.45d | partially folded monomer |
| 3b | 0.54d | 0.24d | partially folded monomer |
| 3c | 0.58d | 0.66d | folded tetramer |
| 4a | 0.30d | 0.32d | partially folded monomer |
Oligomer at 2.0 mM.
Monomer at 2.0 mM.
Oligomer at 8.0 mM.
Assignment of δOrn1 and δOrn2 is arbitrary.
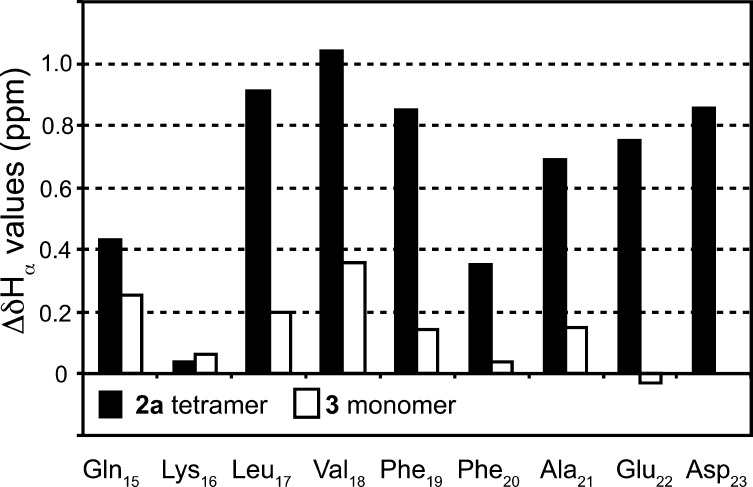
To further investigate the folding and oligomerization of macrocylic β-sheet 2a, we compared the 1H NMR chemical shifts of the α-protons of the 2a tetramer to those of acyclic control peptide 5.57 Peptide 5 contains the Aβ15–23 nonapeptide and two δ-linked ornithine turn units but lacks the lower template strand. The α-proton resonances of Aβ15–23 in the 2a tetramer appear 0.04–1.04 ppm downfield of those of acyclic control, with an average downfield shifting of 0.66 ppm (Figures 9 and S8 in the SI). The large downfield shifting of the α-protons suggests the formation of a well-folded β-sheet structure.
Figure 9.
Downfield shifting of the 1H NMR α-proton resonances of the 2a tetramer and the 3 monomer, relative to acyclic control 5. The 1H NMR spectrum of 2a was recorded at 8.0 mM in D2O at 500 MHz and 300.5 K. The 1H NMR spectra of 3 and 5 were recorded at 2.0 and 1.2 mM, respectively, in D2O at 500 MHz and 298 K.
 |
In contrast, the α-proton resonances of the monomer of 2a are not nearly as far downfield shifted. Although it is not feasible to identify all of the α-proton resonances of the monomer of 2a because the tetramer predominates even at submillimolar concentrations, it is possible to do so in the close homologue 3, which is largely monomeric at low millimolar concentrations. The α-proton resonances of Aβ15–23 in the 3 monomer show far less downfield shifting, with an average of only 0.13 ppm (Figures 9 and S8 in the SI). The smaller downfield shifting of the α-protons of the monomers of 2a and 3 reflects the formation of β-sheet structures that are only partially folded.
Discussion
The tetramers formed by macrocyclic β-sheets containing the Aβ15–23 nonapeptide are remarkable. Although the individual peptide monomer units are only partially folded, the tetramers that form exhibit secondary, tertiary, and quaternary structure reminiscent of proteins. The unusually well-defined structures of the tetramers are reflected in the strong NOEs observed and in the large magnetic anisotropies of the L17, F19, and A21 side chains and many of the α-protons in the 1H NMR spectra.
To gain further insight into the structure of the tetramers formed by the macrocyclic β-sheets in aqueous solution, we used the X-ray crystallographic structure of the tetramer of macrocyclic β-sheet 1 to create a model of the solution-state tetramer of macrocyclic β-sheet 2a. We generated the initial coordinates for the model in PyMOL by (1) changing the p-bromophenylalanine of 1 to tyrosine, (2) shifting the crystallographic dimers out of alignment by two residues toward the C-termini, (3) moving the dimers to pack through the LFA faces instead of the VF faces, (4) selecting appropriate rotamers of F20, and (5) orienting the dimers to approximately match the observed interlayer NOEs between the methoxy group of Hao2 and the methyl group of threonine. We then generated a minimum-energy structure (local minimum) of the tetramer in MacroModel with the Maestro user interface using the MMFFs force field with GB/SA water solvation, minimizing first with distance constraints to match the observed NOEs between α-protons (Figure 3) and between the layers of the β-sheets (Figures 6 and 7) and then without constraints.
Figure 10 illustrates the resulting model of the tetramer. The tetramer consists of a dimer of hydrogen-bonded dimers and is essentially symmetrical, consisting of four roughly symmetrical monomers arranged in roughly D2 symmetry. Residues L17, F19, and A21 of the dimers pack tightly to form a hydrophobic core within the tetramer (Figure 10B and C). The methyl group of A21 sits over the phenyl group of F19 in the opposing layer of the sandwich-like structure, consistent with the observed upfield shifting of the methyl resonance of A21 in the 1H NMR spectrum. The pro-S methyl group of L17 sits over the aromatic ring of Hao2 in the opposing layer, consistent with the pronounced upfield shifting of one of the methyl resonances of L17 in the 1H NMR spectrum. The methyl group of the threonine is close to the methoxy group of Hao2, and Hao1 is close to Hao2, consistent with the observed NOEs between these groups (Figure 10D and Figure 6).
Figure 10.
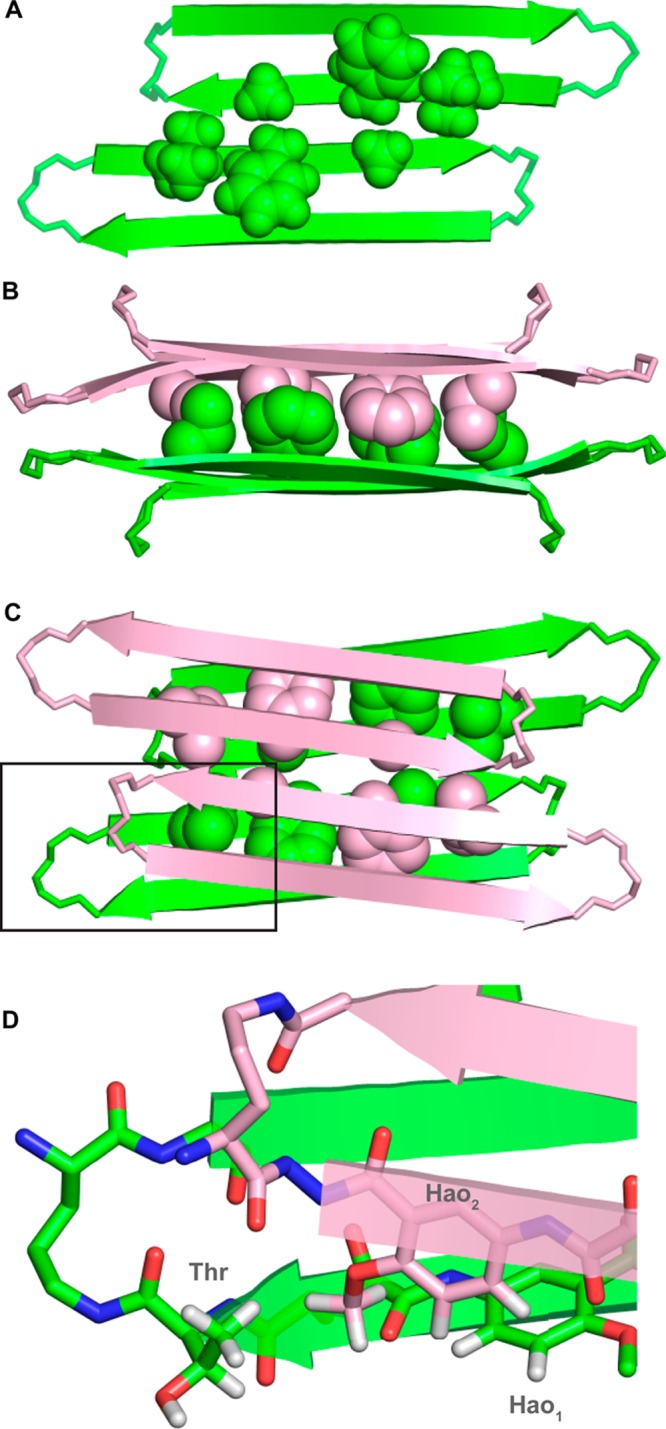
Model of macrocyclic β-sheet peptide 2a as a tetramer, based on the NOE cross peaks of 2a and the X-ray crystallographic structure of 1. (A) Hydrogen-bonded dimers within the tetramer. The hydrogen-bonded dimers are antiparallel and shifted out of alignment by two residues toward the C-termini. Residues L17, F19, and A21 of the hydrophobic core are shown (the LFA face). (B) Side view of 2a as a tetramer. (C) Top view of 2a as a tetramer. The LFA faces that form the hydrophobic core of the tetramer are shown. (D) Detail of the contacts between threonine, Hao1, and Hao2, which give rise to the interlayer NOE crosspeaks that are shown in Figure 6.
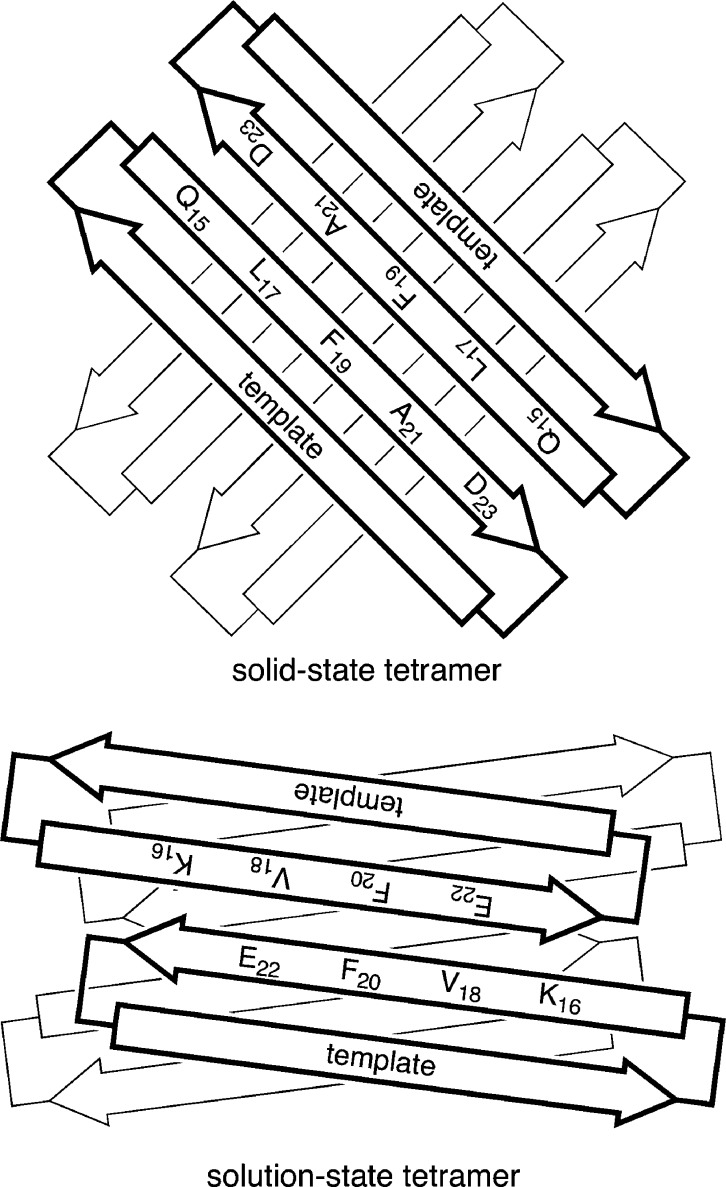
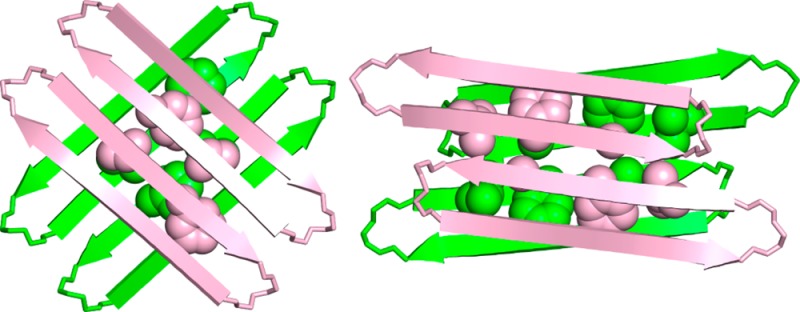
The solution-state tetramers formed by macrocyclic β-sheets 1, 2a, and 2b differ from the solid-state tetramer observed for macrocyclic β-sheet 1 in three notable ways: Although both tetramers comprise antiparallel β-sheet dimers, the solution-state dimers are out of register, shifted out of alignment by two residues toward the C-termini, while the solid-state dimers are in register, with all residues aligned (Figure 11). The solution-state dimers are sandwiched through the LFA faces, while the solid-state dimers are sandwiched through the VF faces (Figure 12). The two solution-state dimers that form the tetramer are nearly parallel to each other, while the two solid-state dimers are nearly orthogonal; the former are oriented at roughly 15°, while the latter are oriented at roughly 83° (Figure 12).
Figure 11.
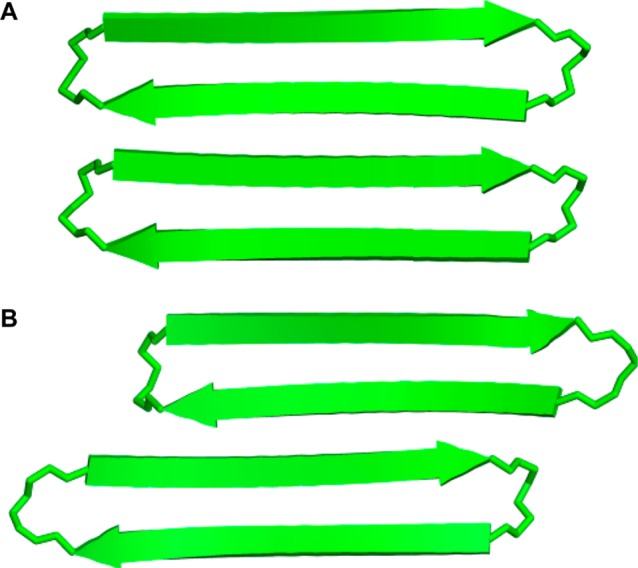
Model of macrocyclic β-sheet peptide 2a and the X-ray crystallographic structure of 1 as dimers. (A) X-ray crystallographic structure of hydrogen-bonded dimers of 1 that are antiparallel and fully aligned. (B) Solution-state structure of hydrogen-bonded dimers of 2a that are antiparallel and shifted out of alignment by two residues toward the C-termini.
Figure 12.
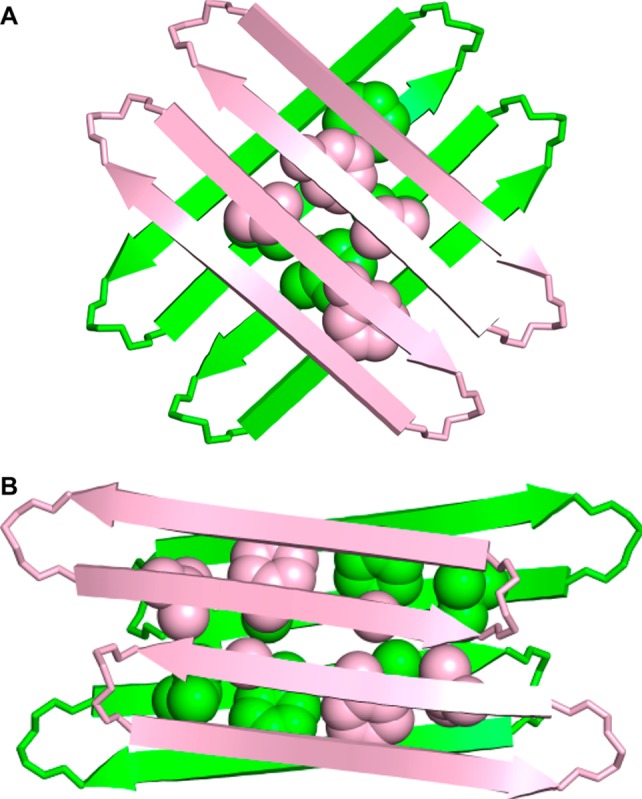
Model of macrocyclic β-sheet peptide 2a and the X-ray crystallographic structure of 1 as tetramers. (A) Top view of the X-ray crystallographic structure of 1 as a tetramer. Residues V18 and F20 of the hydrophobic core are shown (the VF face). One rotamer of residue F20 for each monomer is shown. (B) Top view of solution-state structure of 2a as a tetramer. Residues L17, F19, and A21 of the hydrophobic core are shown (the LFA face).
The differences between the solution-state tetramer and the solid-state tetramer may reflect the need to maximize hydrophobic contacts in aqueous solution. In aqueous solution, hydrophobic contacts within the tetramer are important. The LFA face of the dimer presents six hydrophobic residues from Aβ15–23, while the VF face presents only four (Figure 12).58 Hydrophobic contact is maximized in the aqueous tetramer through contact between these six residues. The bulky hydrophobic side chains of L17 and F19 pack well with the small hydrophobic side chain of A21 in the opposing dimer of the tetramer. In the solid state, the tetramer is part of a lattice in which there are additional intermolecular contacts. The tetramers are in contact with other tetramers, as well as with water and organic cocrystallants, and these contacts likely help stabilize the tetramer. Differences in pH and protonation state may also be important in the differences between the solution-state and solid-state tetramers.
The differing morphology of the solution-state and solid-state tetramers is significant, because it may provide a glimpse into some of the structural bases for polymorphism among Aβ oligomers in Alzheimer’s disease. Polymorphism has previously been observed at atomic resolution in Aβ fibrils, but not in oligomers.59−62 Because little is known about the structures of amyloid oligomers, little is known about the structural bases of oligomer polymorphism. Much of what is currently known about amyloid oligomer polymorphism focuses on differences in reactivity toward oligomer-specific antibodies or differences in size and shape that can be observed by electron microscopy, atomic-force microscopy, gel electrophoresis, or mass spectrometry. These techniques do not provide detail at atomic resolution. The contrasting structures of the solution-state and solid-state tetramers described here demonstrate subtle differences among oligomers that can be observed at atomic resolution. Differing facial pairings of the β-sheets give rise to unique stable structures. Differing alignment of the β-strands within the β-sheets also gives rise to unique structures. While not seen in the two types of tetramers here, both parallel and antiparallel β-sheet structures may also be possible.
Conclusion
Macrocyclic β-sheet peptides containing the Aβ15–23 nonapeptide exhibit rich supramolecular chemistry, forming tetramers with well-defined structures in aqueous solution and in the solid state.63 The solution-state and solid-state tetramers exhibit noteworthy polymorphism, differing in the alignment of the monomers within the hydrogen-bonded dimers, the faces of the hydrogen-bonded dimers involved in tetramer formation, and the rotational orientation of the hydrogen-bonded dimers within the tetramers (Figure 13). Both hydrogen bonding and hydrophobic interactions are important in tetramer formation. Residues L17, F19, and A21 are critical in the formation of the hydrophobic core of the tetramers in solution, and the size complementarity of the small A21 residue and large L17 and F19 residues may play a special role in their stability.
Figure 13.
Cartoon illustrating the structure of the solid-state tetramer of macrocyclic β-sheet 1 (top), and the solution-state tetramer of macrocyclic β-sheets 1 and 2a (bottom). The VF faces form the inner hydrophobic core of the solid-state tetramer of 1, and the LFA faces form the outer surface. The LFA faces form the inner hydrophobic core of the solution-state tetramer of 1 and 2a, and the VF faces form the outer surface.
The supramolecular assembly of amyloidogenic peptides to form soluble oligomers is almost impossible to study at atomic resolution with natural full-length amyloidogenic peptides, because the oligomers that form are heterogeneous in size and morphology and because the oligomers are dynamic and can ultimately form insoluble amyloid. Chemical model systems that limit uncontrolled supramolecular assembly and contain important segments of the amyloidogenic peptides can help identify modes in which the peptides interact. We anticipate that chemical model systems based on macrocyclic peptides will prove widely useful in elucidating the supramolecular assembly and oligomer formation of other amyloidogenic peptides. We look forward to reporting these findings in due course.
Acknowledgments
We thank Dr. Phil Dennison and Prof. Melanie Cocco for assistance in running 800 MHz NMR experiments and Mr. Virgil Schirf for assistance in running AUC experiments. J.S.N and J.D.P. thank the National Institutes of Health for grant support (5R01GM097562). J.D.P. thanks UCI for fellowship support. B.D. thanks the National Science Foundation (Grants ACI-1339649, OCI-1032742, and MCB-070039) for supporting the UltraScan software development.
Supporting Information Available
Experimental procedures, NMR spectra, mass spectra, and HPLC traces for peptides 2–5 and hitherto unreported data for peptide 1. This material is available free of charge via the Internet at http://pubs.acs.org.
The authors declare no competing financial interest.
Funding Statement
National Institutes of Health, United States
Supplementary Material
References
- Kayed R.; Head E.; Thompson J. L.; McIntire T. M.; Milton S. C.; Cotman C. W.; Glabe C. G. Science 2003, 300, 486–489. [DOI] [PubMed] [Google Scholar]
- Lacor P. N.; Buniel M. C.; Chang L.; Fernandez S. J.; Gong Y.; Viola K. L.; Lambert M. P.; Velasco P. T.; Bigio E. H.; Finch C. E.; Krafft G. A.; Klein W. L. J. Neurosci. 2004, 24, 10191–11200. [DOI] [PMC free article] [PubMed] [Google Scholar]
- Haass C.; Selkoe D. J. Nat. Rev. Mol. Cell Biol. 2007, 8, 101–112. [DOI] [PubMed] [Google Scholar]
- Walsh D. M.; Selkoe D. J. J. Neurochem. 2007, 101, 1172–1184. [DOI] [PubMed] [Google Scholar]
- Glabe C. G. J. Biol. Chem. 2008, 283, 29639–29643. [DOI] [PMC free article] [PubMed] [Google Scholar]
- Kayed R.; Canto I.; Breydo L.; Rasool S.; Lukacsovich T.; Wu J.; Albay R. III; Pensalfini P.; Yeung S.; Head E.; Marsh J. L.; Glabe C. Mol. Neurodegener. 2010, 5, 1–10. [DOI] [PMC free article] [PubMed] [Google Scholar]
- Umeda T.; Tomiyama T.; Sakama N.; Tanaka S.; Lambert M. P.; Klein W. L.; Mori H. J. Neurosci. Res. 2011, 89, 1031–1042. [DOI] [PubMed] [Google Scholar]
- Fändrich M. J. Mol. Biol. 2012, 421, 427–440. [DOI] [PubMed] [Google Scholar]
- Benilova I.; Karran E.; De Stooper B. Nat. Neurosci. 2012, 15, 349–357. [DOI] [PubMed] [Google Scholar]
- Nussbaum J. M.; Schilling S.; Cynis H.; Silva A.; Swanson E.; Wangsanut T.; Tayler K.; Wiltgen B.; Hatami A.; Rönicke R.; Reymann K.; Hutter-Paier B.; Alexandru A.; Jagla W.; Graubner S.; Glabe C. G.; Demuth H.-U.; Bloom G. S. Nature 2012, 485, 651–655. [DOI] [PMC free article] [PubMed] [Google Scholar]
- Chromy B. A.; Nowak R. J.; Lambert M. P.; Viola K. L.; Chang L.; Velasco P. T.; Jones B. W.; Fernandez S. J.; Lacor P. N.; Horowitz P.; Finch C. E.; Krafft G. A.; Klein W. L. Biochemistry 2003, 42, 12749–12760. [DOI] [PubMed] [Google Scholar]
- Cleary J. P.; Walsh D. M.; Hofmeister J. J.; Shankar G. M.; Kuskowski M. A.; Selkoe D. J.; Ashe K. H. Nat. Neurosci. 2005, 8, 79–84. [DOI] [PubMed] [Google Scholar]
- Lesné S.; Koh M. T.; Kotilinek L.; Kayed R.; Glabe C. G.; Yang A.; Gallagher M.; Ashe K. H. Nature 2006, 440, 352–357. [DOI] [PubMed] [Google Scholar]
- Shankar G. M.; Li S.; Mehta T. H.; Garcia-Munoz A.; Shepardson N. E.; Smith I.; Brett F. M.; Farrell M. A.; Rowan M. J.; Lemer C. A.; Regan C. M.; Walsh D. M.; Sabatini B. L.; Selkoe D. J. Nat. Med 2008, 14, 837–842. [DOI] [PMC free article] [PubMed] [Google Scholar]
- Ono K.; Condron M. M.; Teplow D. B. Proc. Natl. Acad. Sci. U.S.A. 2009, 106, 14745–14750. [DOI] [PMC free article] [PubMed] [Google Scholar]
- Selkoe D. J. Behav. Brain Res. 2008, 192, 106–113. [DOI] [PMC free article] [PubMed] [Google Scholar]
- Larson M. E.; Lesné S. E. J. Neurochem. 2012, 192Suppl. 1125–139. [DOI] [PMC free article] [PubMed] [Google Scholar]
- Vivekanandan S.; Brender J. R.; Lee S. Y.; Ramamoorthy A. Biochem. Biophys. Res. Commun. 2011, 411, 312–316. [DOI] [PMC free article] [PubMed] [Google Scholar]
- Bernstein S. L.; Dupuis N. F.; Lazo N. D.; Wyttenbach T.; Condron M. M.; Bitan G.; Teplow D. B.; Shea J.-E.; Ruotolo B. T.; Robinson C. V.; Bowers M. T. Nat. Chem. 2009, 1, 326–331. [DOI] [PMC free article] [PubMed] [Google Scholar]
- Miller Y.; Ma B.; Nussinov R. Chem. Rev. 2010, 110, 4820–4838. [DOI] [PMC free article] [PubMed] [Google Scholar]
- Lührs T.; Ritter C.; Adrian M.; Riek-Loher D.; Bohrmann B.; Döbeli H.; Schubert D.; Riek R. Proc. Natl. Acad. Sci. U.S.A. 2005, 102, 17342–17347. [DOI] [PMC free article] [PubMed] [Google Scholar]
- Petkova A. T.; Yau W.-M.; Tycko R. Biochemistry 2006, 45, 498–512. [DOI] [PMC free article] [PubMed] [Google Scholar]
- Cerf E.; Sarroukh R.; Tamamizu-Kato S.; Breydo L.; Derclaye S.; Dufrênes Y. V.; Narayanaswami V.; Goormaghtigh E.; Ruysschaert J.-M.; Raussens V. Biochem. J. 2009, 421, 415–423. [DOI] [PubMed] [Google Scholar]
- Chimon S.; Shaibat M. A.; Jones C. R.; Calero D. C.; Aizezi B.; Ishii Y. Nat. Struct. Mol. Biol. 2010, 14, 1157–1164. [DOI] [PubMed] [Google Scholar]
- Strodel B.; Lee J. W.; Whittleston C. S.; Wales D. J. J. Am. Chem. Soc. 2010, 132, 13300–13312. [DOI] [PubMed] [Google Scholar]
- Streltsov V. A.; Varghese J. N.; Masters C. L.; Nuttall S. D. J. Neurosci. 2011, 31, 1419–1426. [DOI] [PMC free article] [PubMed] [Google Scholar]
- Laganowsky A.; Liu C.; Sawaya M. R.; Whitelegge J. P.; Park J.; Zhao M.; Pensalfini A.; Soriaga A. B.; Landau M.; Keng P. K.; Cascio D.; Glabe C. G.; Eisenberg D. Science 2012, 335, 1228–1231. [DOI] [PMC free article] [PubMed] [Google Scholar]
- Apostol M. I.; Perry K.; Surewicz W. K. J. Am. Chem. Soc. 2013, 135, 10202–10205. [DOI] [PMC free article] [PubMed] [Google Scholar]
- Hoyer W.; Grönwall C.; Jonsson A.; Ståhl S.; Härd T. Proc. Natl. Acad. Sci. U.S.A. 2008, 105, 5099–5104. [DOI] [PMC free article] [PubMed] [Google Scholar]
- Sandberg A.; Luheshi L. M.; Söllvander S.; de Barros T. P.; Macao B.; Knowles T. P. J.; Biverstål H.; Lendel C.; Ekholm-Petterson F.; Dubnovitsky A.; Lannfelt L.; Dobson C. M.; Härd T. Proc. Natl. Acad. Sci. U.S.A. 2010, 107, 15595–15600. [DOI] [PMC free article] [PubMed] [Google Scholar]
- Yu L.; Edalji R.; Harlan J. E.; Holzman T. F.; Lopez A. P.; Labkovsky B.; Hillen H.; Barghorn S.; Ebert U.; Richardson P. L.; Miesbauer L.; Solomon L.; Bartley D.; Walter K.; Johnson R. W.; Hajduk P. J.; Olejniczak E. T. Biochemistry 2009, 48, 1870–1877. [DOI] [PubMed] [Google Scholar]
- Horn A. H. C.; Sticht H. J. Phys. Chem. B 2010, 114, 2219–2226. [DOI] [PubMed] [Google Scholar]
- Xu J.; Zhang J. Z. H.; Xiang Y. J. Phys. Chem. A 2013, 117, 6373–6379. [DOI] [PubMed] [Google Scholar]
- Miller Y.; Ma B.; Tsai C.-J.; Nussinov R. Proc. Natl. Acad. Sci. U.S.A. 2010, 107, 14128–14133. [DOI] [PMC free article] [PubMed] [Google Scholar]
- We began these studies through a fruitful collaboration with the laboratory of Professor David Eisenberg:; a Zheng J.; Liu C.; Sawaya M. R.; Vadla B.; Khan S.; Woods R. J.; Eisenberg D.; Goux W. J.; Nowick J. S. J. Am. Chem. Soc. 2011, 133, 3144–3157. [DOI] [PMC free article] [PubMed] [Google Scholar]; b Liu C.; Sawaya M. R.; Cheng P.-N.; Zheng J.; Nowick J. S.; Eisenberg D. J. Am. Chem. Soc. 2011, 133, 6736–6744. [DOI] [PMC free article] [PubMed] [Google Scholar]; c Cheng P.-N.; Liu C.; Zhao M.; Eisenberg D.; Nowick J. S. Nat. Chem 2012, 4, 927–933. [DOI] [PMC free article] [PubMed] [Google Scholar]; d Liu C.; Zhao M.; Jiang L.; Cheng P.-N.; Park J.; Sawaya M. R.; Pensalfini A.; Gou D.; Berk A. J.; Glabe C. G.; Nowick J. S.; Eisenberg D. Proc. Natl. Acad. Sci. U.S.A. 2012, 109, 20913–20918. [DOI] [PMC free article] [PubMed] [Google Scholar]
- a Zheng J.; Baghkhanian A. M.; Nowick J. S. J. Am. Chem. Soc. 2013, 135, 6846–6852. [DOI] [PubMed] [Google Scholar]; b Buchanan L. E.; Dunkelberger E. B.; Tran H. Q.; Cheng P.-N.; Chiu C.-C.; Cao P.; Raleigh D. P.; de Pablo J. J.; Nowick J. S.; Zanni M. T. Proc. Natl. Acad. Sci. U.S.A. 2013, 110, 19285–19290. [DOI] [PMC free article] [PubMed] [Google Scholar]
- Pham J. D.; Chim N.; Goulding C. W.; Nowick J. S. J. Am. Chem. Soc. 2013, 135, 12460–12467. [DOI] [PMC free article] [PubMed] [Google Scholar]
- Nowick J. S.; Brower J. O. J. Am. Chem. Soc. 2003, 125, 876–877. [DOI] [PubMed] [Google Scholar]
- Nowick J. S.; Chung D. M.; Maitra K.; Maitra S.; Stigers K. D.; Sun Y. J. J. Am. Chem. Soc. 2000, 122, 7654–7661. [Google Scholar]
- An EXSY experiment (2.0 mM in D2O at 350 K with a mixing time of 200 ms) shows that the oligomer is in equilibrium with the monomer. Notably, crosspeaks from chemical exchange between the L17CH3, V18CH3, and A21CH3 resonances of the monomer and the oligomer are seen in the EXSY spectrum. Additional EXSY crosspeaks involving the aromatic resonances from F19 and various α-proton resonances are also seen. (SI.)
- At 0.2 mM, the molar concentration of the tetramer is roughly one-fourth the molar concentration of the monomer (i.e., [2a4] ≈ 0.025 mM and [2a] ≈ 0.1 mM). These concentrations correspond to an equilibrium constant Kassoc for monomer-to-tetramer association of roughly 2.5 × 10¹¹ M–3.
- Additional interlayer NOEs consistent with the sandwich-like assembly shown in Figure 7 are summarized in Table S1 in the SI.
- Addition of salt also augments tetramer formation of macrocyclic β-sheet 2a: Without NaCl, macrocylic β-sheet 2a is 56% tetramerized at 0.3 mM; with 25 mM NaCl, it is 82% tetramerized (Figure S5 and Table S2 in the SI).
- a Berger S.; Braun S.. 200 and More NMR Experiments: A Practical Course; Wiley-VCH: Weinheim, 2004; pp 515–517. [Google Scholar]; b Findeisen M.; Berger S.. 50 and More Essential NMR Experiments; Wiley-VCH: Weinheim, 2012; pp 163–166. [Google Scholar]
- a Altieri A. S.; Hinton D. P.; Byrd R. A. J. Am. Chem. Soc. 1995, 117, 7566–7567. [Google Scholar]; b Johnson C. S. Progr. NMR Spectrosc. 1999, 34, 203–256. [Google Scholar]; c Yao S.; Howlett G. J.; Norton R. S. J. Biomol. NMR 2000, 16, 109–119. [DOI] [PubMed] [Google Scholar]; d Cohen Y.; Avram L.; Frish L. Angew. Chem., Int. Ed. 2005, 44, 520–554. [DOI] [PubMed] [Google Scholar]; e Cohen Y.; Avram L.; Evan-Salem T.; Slovak S.; Shemesh N.; Frish L. In Analytical Methods in Supramolecular Chemistry, 2nd ed.; Schalley C. A., Ed; Wiley-VCH: Weinheim, 2012; pp 197–285. [Google Scholar]
- As is expected, the diffusion coefficient of the tetramer of 2a is slightly lower than that of a lighter tetramer of a smaller peptide that we had studied previously (12.0 × 10⁻⁷ cm2/s for a 6.4 kDa tetramer vs 10.0 × 10⁻⁷ cm2/s for the 8.9 kDa tetramer of 2a).
- Khakshoor O.; Demeler B.; Nowick J. S. J. Am. Chem. Soc. 2007, 129, 5558–5569. [DOI] [PMC free article] [PubMed] [Google Scholar]
- Teller D. C.; Swanson E.; DeHaen C. Methods Enzymol. 1979, 61, 103–124. [DOI] [PubMed] [Google Scholar]
- Polson A. J. Phys. Colloid Chem. 1950, 54, 649–652. [Google Scholar]
- Analytical ultracentrifugation sedimentation velocity experiments characterize the solution-state behavior of macromolecules and can identify dynamic processes such as mass-action driven reversible associations by observing the sedimentation and diffusion behavior of all species in a mixture and report their partial concentrations, molecular weights, and anisotropies. Analysis of multiple loading concentrations can reveal shifts in the sedimentation profile, corresponding to increasing amounts of higher oligomeric forms in response to mass action. Reversible reactions can be fitted directly to solutions of the Lamm equation to obtain the equilibrium coefficients of the reactions, and to obtain mass and anisotropy of the reacting species.
- Demeler B.Current Protocols in Protein Science; Wiley: Hoboken, NJ, 2010; unit 7.13, Chapter 7. [DOI] [PMC free article] [PubMed] [Google Scholar]
- Demeler B.; Brookes E.; Wang R.; Schirf V.; Kim C. A. Macromol. Biosci. 2010, 7, 775–782. [DOI] [PubMed] [Google Scholar]
- Cao W.; Demeler B. Biophys. J. 2008, 95, 54–65. [DOI] [PMC free article] [PubMed] [Google Scholar]
- A Kassoc of 1.93 × 10¹⁴ M–3 corresponds to a 1:1 molar ratio of monomer and tetramer at 0.086 mM total concentration of 2b and a 4:1 molar ratio of monomer and tetramer at 0.022 mM total concentration of 2b. The stronger self-association of 2b under these conditions, as compared to the NMR studies shown in Figure 5, may be explained by the NaCl and lower temperature used for the AUC studies.
- Macrocyclic β-sheet 2a was found to form high-molecular weight aggregates when subjected to AUC studies under similar conditions. The formation of high-molecular weight aggregates may reflect enhanced self-association and aggregation promoted by salt (NaCl).
- Woods J. R.; Brower J. O.; Castellanos E.; Hashemzadeh M.; Khakshoor O.; Russu W. A.; Nowick J. S. J. Am. Chem. Soc. 2007, 129, 2548–2558. [DOI] [PMC free article] [PubMed] [Google Scholar]
- Wishart D. S.; Sykes B. D. Methods Enzymol. 1994, 239, 363–392. [DOI] [PubMed] [Google Scholar]
- The buried surface area of the solution-state tetramer is 3401 Å2, while that of the solid-state tetramer is 2785 Å2. (The buried surface area was calculated as the difference between the solvent-accessible surface areas of the individual monomer components and that of the tetramer using the areaimol program in the CCP4 suite.)
- Petkova A. T.; Leapman R. D.; Guo Z.; Yau W.-M.; Mattson M. P.; Tycko R. Science 2005, 307, 262–265. [DOI] [PubMed] [Google Scholar]
- Paravastu A. K.; Leapman R. D.; Yau W.-M.; Tycko R. Proc. Natl. Acad. Sci. U.S.A. 2008, 105, 18349–18354. [DOI] [PMC free article] [PubMed] [Google Scholar]
- Qiang W.; Yau W.-M.; Luo Y.; Mattson M. P.; Tycko R. Proc. Natl. Acad. Sci. U.S.A. 2012, 109, 4443–4448. [DOI] [PMC free article] [PubMed] [Google Scholar]
- Molecular dynamics simulations are an important complement to experimental techniques and can provide valuable insights into the structures of amyloid oligomers at atomic resolution. Polymorphism has been observed in computational studies of Aβ oligomers and mixed oligomers derived from Aβ and tau peptides. For examples, see:; a Miller Y.; Ma B.; Nussinov R. Biophys. J. 2009, 97, 1168–1177. [DOI] [PMC free article] [PubMed] [Google Scholar]; b Raz Y.; Miller Y. PLoS One 2013, 8, e73303. [DOI] [PMC free article] [PubMed] [Google Scholar]
- Cheng P.-N.; Pham J. D.; Nowick J. S. J. Am. Chem. Soc. 2013, 135, 5477–5492. [DOI] [PMC free article] [PubMed] [Google Scholar]
Associated Data
This section collects any data citations, data availability statements, or supplementary materials included in this article.


