

Abstract
Equilibrium H/D fractionation factors have been extensively employed to qualitatively assess hydrogen bond strengths in protein structure, enzyme active sites, and DNA. It remains unclear how fractionation factors correlate with hydrogen bond free energies, however. Here we develop an empirical relationship between fractionation factors and free energy, allowing for the simple and quantitative measurement of hydrogen bond free energies. Applying our empirical relationship to prior fractionation factor studies in proteins, we find: [1] Within the folded state, backbone hydrogen bonds are only marginally stronger on average in α-helices compared to β-sheets by ∼0.2 kcal/mol. [2] Charge-stabilized hydrogen bonds are stronger than neutral hydrogen bonds by ∼2 kcal/mol on average, and can be as strong as –7 kcal/mol. [3] Changes in a few hydrogen bonds during an enzyme catalytic cycle can stabilize an intermediate state by –4.2 kcal/mol. [4] Backbone hydrogen bonds can make a large overall contribution to the energetics of conformational changes, possibly playing an important role in directing conformational changes. [5] Backbone hydrogen bonding becomes more uniform overall upon ligand binding, which may facilitate participation of the entire protein structure in events at the active site. Our energetic scale provides a simple method for further exploration of hydrogen bond free energies.
Keywords: dynamics, backbone hydrogen bond, enzyme, hydrogen bond strength, isotope effect
Introduction
Hydrogen bond strengths in proteins have been extensively investigated by engineering experiments. Side chain hydrogen bonding interactions are readily probed by directed mutagenesis experiment1–18 and backbone hydrogen bonds have been examined by amide-to-ester chemical mutagenesis methods.19–22 Because of the technical difficulty in performing chemical mutagenesis experiments, however, backbone hydrogen bonds have been much less extensively investigated. It is clear, however, that backbone hydrogen bonds strengths can vary considerably depending on their environment.21
Equilibrium H/D fractionation factors correlate with hydrogen bond strength and potentially offer a facile way to measure large numbers of backbone hydrogen bond free energies. For a hydrogen bond between a weak acid, AH, and a weak base, B, the fractionation factor, φ, is defined as the equilibrium constant for the following reaction:23–38
For weak hydrogen bonds typically observed in proteins, the φ-value increases as the strength of the hydrogen bond decreases.26–38 In other words, weaker hydrogen bonds accumulate more deuterium than stronger hydrogen bonds.26–38
Loh and Markley were the first to employ NMR to evaluate the contribution of large numbers of φ-values within a protein structure, in their investigation of staphylococcal nuclease H124L.29 Since then, similar approaches were used to measure φ-values in enzyme:substrate complexes,33–36 in DNA base pairs,27 and in protein structures.29–32 In DNA base pairs, the φ-values fall within a narrow range from 0.83 to 1.10.27 In proteins, the φ-values are more diverse, ranging from 0.28 to 1.4229–37 (ignoring an extreme outlier with a φ-value of 2.036.
Several trends have emerged from studies on proteins: [1] α-helical hydrogen bonds are slightly stronger on average than β-sheet hydrogen bonds.29–32 [2] Side-chain hydrogen bonds tend to be stronger than backbone hydrogen bonds.29,30,32 [3] Charge-stabilized hydrogen bonds are stronger than neutral hydrogen bonds.29,30,32,38 In particular, the φ-values for neutral hydrogen bonds measured in experiments fall between 0.52 and 1.42,29–37 whereas a charged-stabilized hydrogen bond has been seen with a φ-value as low as 0.28.29 [4] Cooperative networks can strengthen hydrogen bonds.29,30,32,38 [5] Equilibrium H/D fractionation factors in proteins have no correlation with H/D exchange rates.29 [6] Low-barrier (single-potential-well) hydrogen bonds to substrates in enzyme active sites can have φ-values as low as 0.32.33–36
A major missing component of these earlier φ-value studies on protein hydrogen bonds was an energetic scale. In particular, how much stronger is a hydrogen bond with a φ-value of 0.52 relative to one with a φ-value of 1.42? If we knew the relationship between φ-value and hydrogen bond strength, φ-values would provide a simple way to measure hydrogen bond free energy. Shi et al. not only recognized the utility of learning this relationship, but addressed it with a creative model compound study.28 They measured two distinct equilibrium H/D fractionation factors and the corresponding free energies, ΔGHB. From these two points and the assumption that ΔGHB is linear with RTlnφ, they obtained the scale factor, SF = ∂(ΔGHB)/∂(RTlnφ), which relates any measured φ to ΔGHB. The scale factor they obtained had a magnitude of 74 ± 27.28
Inspired by the insight of Shi et al.,28 we attempted to measure hydrogen bond free energies, but became puzzled. From the known φ-values for neutral hydrogen bonds, this scale factor implies that they range over 60 kcal/mol in free energy. This is nearly an order of magnitude larger than the maximum expected enthalpy of a neutral hydrogen bond in a vacuum.3,39,40 We could find no apparent flaw in their pioneering analysis, but thought it might be useful to examine the scale factor issue in an orthogonal way.
Here we measured free energies of hydrogen bonding and fractionation factors for a series of 18 weak acid and weak base pairs, and obtained a more extensive experimental delineation of the relationship between φ and ΔGHB values. We confirm the expected linear relationship28 between ΔGHB and RTlnφ, but obtain a more modest scale factor of 7.0 ± 0.7. We believe the revised scale factor is more consistent with what we know about hydrogen bonds. With a new scale factor we can now place prior work on what we believe is a realistic free energy scale.
Results and Discussion
Approach to measuring the scale factor
To determine the relationship between ΔGHB and φ-values, we employed a series of weak acid base pairs listed in Figure 1(A) and measured their φ-values and the corresponding ΔGHB-values. To obtain φ-values relative to water, we employed the three equilibria shown in Figure 1(B).
Figure 1.
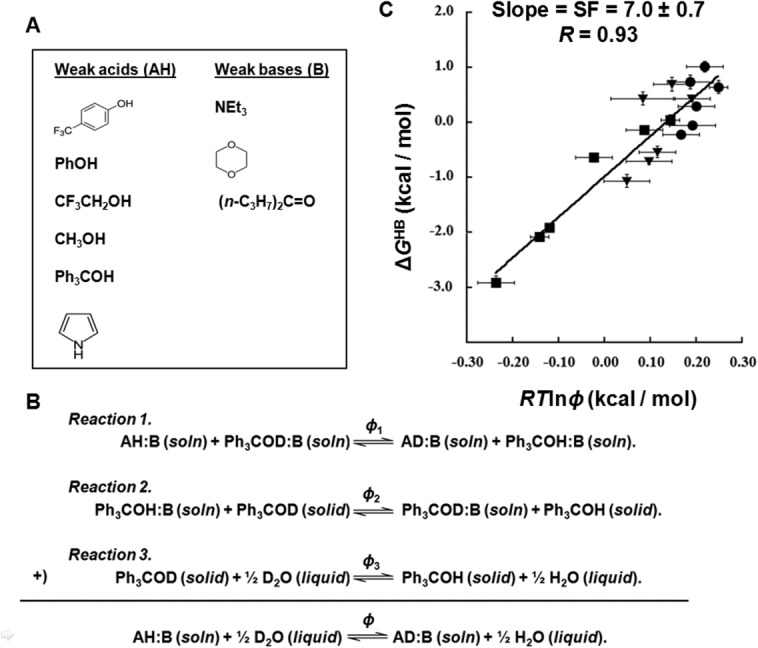
Determination of the scale factor. (A) The six weak acids and three weak bases used to form model hydrogen-bonded complexes. (B) The three equilibria used to determine the φ-value relative to water. (C) Plot of ΔGHB against RTlnφ values at room temperature from 18 model hydrogen-bond complexes to determine the scale factor. The hydrogen-bond complexes formed by triethylamine in toluene, p-dioxane in toluene, and di(n-propyl) ketone in o-dichlorobenzene were labeled using square, round, and triangle symbols, respectively.
We first measured the fractionation factors (φ1) relative to the hydrogen-bond complex formed by triphenylmethanol (Ph3COH) (Reaction 1). Ph313COH and the weak acid of interest were dissolved at a low concentration in the cognate base. Since the base acts as the solvent, the dissolved weak acids will be completely hydrogen bonded to the solvent base. The ratio of deuterium to protium in the solution was controlled by adding deuterated and protonated methanol in various ratios. The φ1-values of hydrogen-bonded weak acids were measured relative to the hydrogen-bonded Ph313COH by 13C-NMR as illustrated in Supporting Information Figure S1(B,C).
Once the φ1-values were obtained, they were converted to φ-values relative to water. This was done by measuring the fractionation factors (φ2) of the hydrogen bonded Ph3COH dissolved in the corresponding base relative to solid Ph3COH(Reaction 2), followed by applying the fractionation factor (φ3= 1.10) for solid Ph3COH relative to water obtained from Kreevoy and Liang24 (Reaction 3). As shown in Figure 1(B), the sum of the three reactions provides the desired φ-value relative to water and is simply the product of three measured equilibrium constants.The φ1-values are listed in Supporting Information Table SI. The φ2-values for triethylamine, p-dioxane and di(n-propyl) ketone, were measured to be 1.01 ± 0.02, 1.24 ± 0.07 and 1.14 ± 0.06, respectively.The final φ-values of the hydrogen-bonded complexes with reference to water are also listed in Supporting Information Table SI.
The free energy of hydrogen bonding was determined by measuring the dissociation constants of the various weak acid:base pairs in an aprotic solvent as illustrated in Supporting Information Figure S1(D). We used solvents that closely matched the dielectric constant of the base that was employed to measure the φ1-values so that the hydrogen bond strengths would be matched in both solutions (Reaction 1). Dissociation curves were obtained by varying the concentrations of bases and monitoring chemical shifts of the proton involved in hydrogen bonding by 1H-NMR as an indication of the relative fractions associated and dissociated. The equilibrium dissociation constants, K, for the hydrogen-bond complexes and their ΔGHB values are listed in Supporting Information Table SI.
The scale factor relating the ΔGHB and φ-values
A plot of ΔGHB against RTlnφ from 18 hydrogen-bond complexes formed by our model weak acids and weak bases is shown in Figure 1(C). As expected,28 the points fall on a line with a linear fitting correlation coefficient of 0.93. The slope yields the scale factor of 7.0 ± 0.7. The data used in the scale factor determination includes six different acids and three different bases, suggesting that the empirical relationship between ΔGHB and RTlnφ values we report here is robust and largely independent of the type of hydrogen donors and acceptors. The φ-values of the hydrogen-bond complexes in this plot ranges from 0.65 to 1.54, which covers most of the φ-values observed for protein hydrogen bonds previously.29–37 Some protein hydrogen bonds have a φ-value lower than 0.65,29–37 but given the linear relationship between ΔGHB and RTlnφ values those protein hydrogen bonds are within a short linear extrapolation of the plot in Figure 1(C).
Defining relative hydrogen bond strengths
The scale factor reported here can be used to compare the strengths of any two intra-molecular hydrogen bonds, ΔΔGHB, as long as their φ-values with reference to water are available. ΔΔGHB does not reflect the relative contributions to folding, however, which involves changes in solvation.1–4,6–10,12–15,17–22,41 Rather, it compares the free energy within the folded states, with no change in solvation.
We also empirically define an absolute free energy of a hydrogen bond relative toone with a zero interaction free energy. We do not know the φ-value of a zero free energy hydrogen bond, but we make the assumption that the highest experimentally observed φ-value, that is, the weakest observed hydrogen bond, has a zero interaction free energy. The highest φ-value measured in proteins is 1.42 for the backbone NH group of G55 in the unligated from of staphylococcal nuclease H124L. Although the amide of G55 appears to be hydrogen-bonded to the backbone carbonyl groups of E52, it must be an exceedingly weak interaction. We therefore set a φ-value of 1.42 as the reference, that is, a free energy of 0. Using a reference φ-value of 1.42 and our scale factor, we can obtain a measure of the absolute free energies, ΔΔGHB, of hydrogen bonds within the folded state. Again, this is not the contribution of the hydrogen bond to folding, but rather the free energy of the hydrogen bond compared to an imaginary state in which nothing changes except the hydrogen bond interaction is turned off.
φ-values and side chain hydrogen bonds
The energetic contribution of hydrogen bonded side chains has been extensively probed by mutagenesis experiments1,2,4,7–15,17 and has been extensively reviewed.3,6,16,18 Here we restrict ourselves to probes of hydrogen bonds using fractionation factors.
The φ-value data for side chain hydrogen bonds is relatively sparse and biased toward residues involved in enzyme catalysis. To our knowledge the φ-values of 20 side chains are known (excluding one extreme outlier which has an abnormally high φ-value of 2.0).30,32–37 They include Ser, Tyr, Cys, and His residues involved inside-chain:backbone, side-chain:side-chain or side-chain:ligand hydrogen bonds. As shown in Figure 2, we find that the ΔΔGHB for the side-chain hydrogen bonds have an average value of –3.9 ± 1.6 kcal/mol and span a range of 5.7 kcal/mol. Among the 20 side-chain hydrogen bonds, 18 are charged stabilized, which is likely to be an important factor in their strength (see below), and 16 are located at active sites of enzymes.
Figure 2.
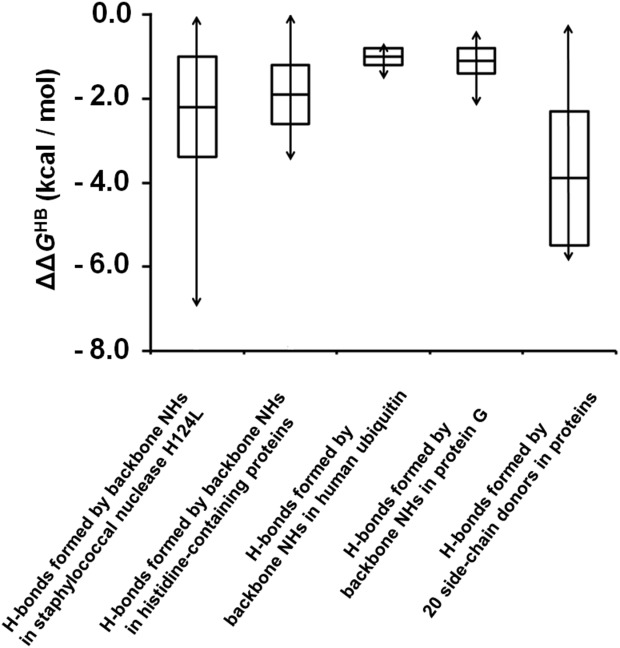
Distribution of protein hydrogen bond strengths. The average ΔΔGHB values, for backbone NH groups and side-chain donorsare shown as a bar in the middle of each box. The standard deviations, determined by considering both the uncertainty in the scale factor and the standard deviations of the φ-values, are indicated as the distance between the middle bar and the upper or lower edge of each box. The ranges of ΔΔGHB are indicated by the double-headed arrows across each box.
Of the 16 active site hydrogen bonds with known φ-values, 13 forms in intermediate states during catalytic cycles and are thought to stabilize those intermediates.33–36 We can now quantify the degree of stabilization. For example, His64 Hδ1 in subtilisin Carlsberg, which hydrogen bonds to the side chain of Asp32,33 has a φ-value of 1.2 in the ground state, while in the intermediate state its φ-value decreases at least to 0.85. From our scale factor, this change corresponds to an improvement in hydrogen-bond free energy of over 1.5 kcal/mol. The His57 Hδ1 and Hε2 protons in bovine chymotrypsinogen A are involved in hydrogen bonds to the side changes of Asp102 and Ser195, respectively,36 and have φ-values of 1.4 and 0.54 in the ground state, while in the intermediate state of the catalytic cycle their φ-values change to 0.4 and 0.69, respectively. This corresponds to an overall improvement in hydrogen bond free energy of 4.2 kcal/mol, stabilizing the intermediate.
φ-values and charge stabilization
Charge-stabilized hydrogen bonds are expected to be stronger than neutral hydrogen bonds1–8,12,13,15,18 and this is also revealed in the measured φ-values.29,30,32–38 The average φ-value for neutral hydrogen bonds at room temperatureis 0.96 ± 0.20, and for hydrogen bonds with nominally charged acceptors, it is 0.60 ± 0.29.29–37 Based on our scale factor, the energetic difference between these two kinds of hydrogen bonds is 1.9 kcal/mol on average.
φ-values and backbone hydrogen bonds
For hydrogen bonds formed by backbone amide groups, the average values of the absolute ΔΔGHB (relative to the weakest hydrogen bond) are –2.2 ± 1.2 kcal/mol in staphylococcal nuclease H124L,29 –1.9 ± 0.7 kcal/mol in histidine-containing proteins,30 –1.0 ± 0.2 kcal/mol in human ubiquitin31 and –1.1 ± 0.3 kcal/mol in the two immunoglobulin G binding domains of protein G.32 The backbone hydrogen bond strengths span 7.0, 3.5, 0.7, and 1.8 kcal/mol in the four proteins, respectively (Fig. 2). While a 7 kcal/mol range in staphylococcal nuclease H124L appears extreme, it is due to a backbone hydrogen bond to a charged side chain (see below). If we exclude backbone hydrogen bonds made to charged residues the overall range for neutral backbone hydrogen bonds decreases to 4.2 kcal/mol with reference to the weakest neutral backbone hydrogen bond (for L108 in the unbound staphylococcal nuclease H124L with the lowest neutral φ-value of 0.52).29
As noted previously, α-helical backbone NH groups have a slightly lower average φ-value than β-sheet backbone NH groups in the same proteins.29–32 Converting to free energies using our scale factor, the difference is only 0.1–0.3 kcal/mol, however (Fig. 3). Moreover, as shown in Figure 3 the standard deviation of this energetic difference can reach ∼1 kcal/mol. This suggests that there is little energetic distinction between the two classes of hydrogen bonds.
Figure 3.
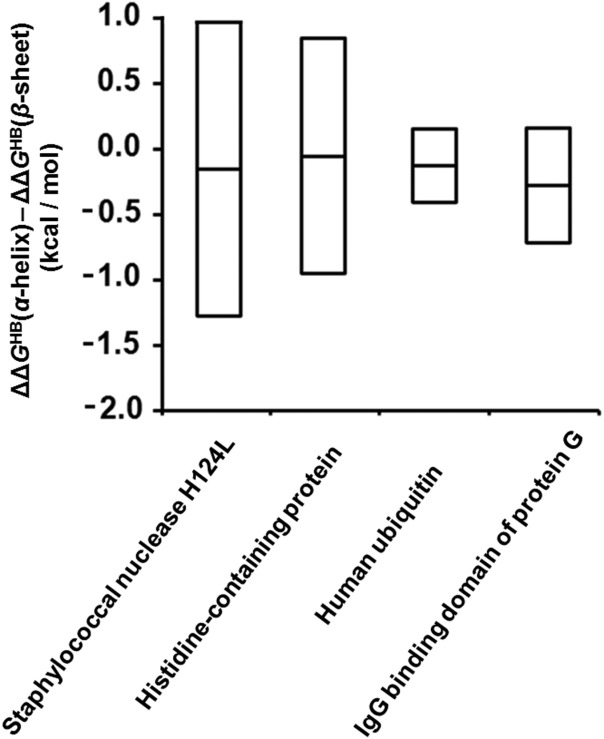
Comparison between backbone hydrogen bond strengths in α-helices and β-sheets. The differences between ΔΔGHB-values for α-helices and for β-sheets, ΔΔGHB(α-helix)–ΔΔGHB(β-sheet), in various proteins. The average values are shown as a bar in the middle of each box. The standard deviations, determined by considering both the uncertainty in the scale factor and the standard deviations of the φ-values, are indicated as the distance between the middle bar and the upper or lower edge of each box.
Backbone hydrogen bonds and conformational changes
Given the wide variation in backbone hydrogen bond strengths in proteins, we wondered whether changes in backbone hydrogen bonds could play an important role in protein conformational changes—an issue that is not readily accessible to mutagenesis experiments. To address this question, we again turned to the work of Loh and Markley who measured φ-values for the unbound and inhibitor bound forms of staphylococcal nuclease H124L.29 In this protein, φ-values of 63 backbone NH groups could be measured in both conformations. Using our scale factor we can obtain a measurement of how the hydrogen bond free energy changes in the two forms. For the 63 hydrogen bonds measured in the two states, the sum of the free energy differences is 9 kcal/mol. Although only 42% of the backbone hydrogen bonds are sampled, the large number suggests that backbone hydrogen bond free energy can indeed play a significant energetic role in protein conformation changes. We were unable to observe any correlation between changes in backbone hydrogen bonding and the location of the ligand binding site, indicating that the binding of the ligand has long-range effects on backbone hydrogen bond strengths.
Hydrogen bond changes tend toward uniformity in the bound form
Taking a closer look at the changes in hydrogen bonding upon ligand binding, we found a surprising correlation between the strength of hydrogen bonding in staphylococcal nuclease H124L and the direction of the energetic change upon ligand binding. Figure 4 shows a plot of the energetic change of the backbone hydrogen bonds, ΔΔGHB(Bound) – ΔΔGHB(Unbound), against the strength of the same hydrogen bonds in the unbound form, ΔΔGHB(Unbound). The two parameters are correlated such that strong hydrogen bonds tend to become weaker in the bound form and weak hydrogen bonds tend to become stronger. Correspondingly, the standard deviation of the strengths of these 63 backbone hydrogen bonds decreases from 0.97 to 0.85 kcal/mol when ligand is bound. Thus, the backbone hydrogen bond strengths become more uniform when the ligand is bound. More uniform hydrogen bonding would facilitate the distribution of conformational changes throughout the protein rather than simply localizing changes to weak points between stable domains. It is therefore possible that these hydrogen bond changes enhance the participation of the entire protein structure in dynamics at the active site.
Figure 4.
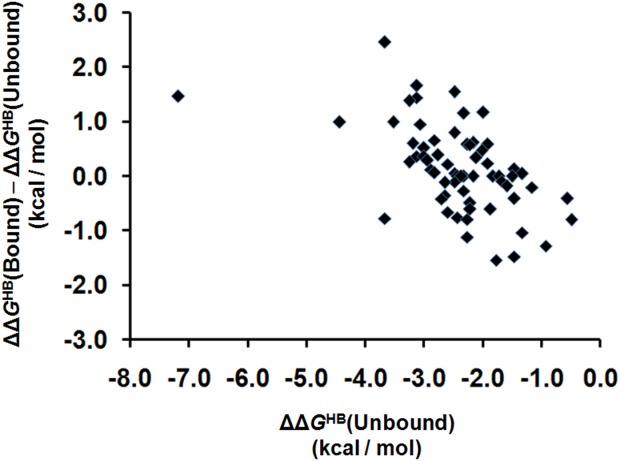
The direction of hydrogen bond free energy change upon ligand binding is correlated with hydrogen bond strength. The horizontal axis is the free energy of the hydrogen bond in the unbound state of staphylococcal nuclease H124L (ΔΔGHB). The vertical axis is the change in hydrogen bond strength upon ligand binding, ΔΔGHB(Bound)–ΔΔGHB(Unbound). Strong hydrogen bonds tend to become weaker and vice versa.
Conclusion
By measuring the relationship between φ-values and hydrogen bond free energy, we provide a simple way to measure the strength of any hydrogen bond. The method is essentially non-perturbing, in contrast to methods that rely on mutations.
From the proteins with measured φ-values, the strongest backbone hydrogen bond is 4.2 kcal/mol (φ = 0.5229 stronger than the weakest hydrogen bond (φ = 1.42), excluding those that are involved in charge-stabilized hydrogen bonds with side chains.29,30,32 This value is well within the theoretical maximal enthalpy of a neutral hydrogen bond, 6.6 kcal/mol.39 Thus, the scale factor we obtain appears physically reasonable.
Perhaps the greatest utility of fractionation factors is in measuring backbone hydrogen bond strengths because they cannot be probed by standard mutagenesis methods and chemical mutagenesis is difficult to perform. Our scale factor allowed us to provide a quantitative energetic view of backbone hydrogen bonds. The results indicate that backbone hydrogen bonds have the potential to play an important role in defining protein movements. We find that the binding of a ligand to staphylococcal nuclease can result in large and long-range changes in backbone hydrogen bond strengths varying from –3 to 2 kcal/mol. We also find that the changes tend toward more uniform hydrogen bonding in the bound state, perhaps facilitating long range communication of conformational changes throughout the protein. It seems likely that proteins can define modes of motion by modulating backbone hydrogen bond strengths. Thus the wide range of backbone hydrogen bond strengths may be an evolved feature of proteins that deserves further scrutiny. Our scale factor now provides way to quantitatively measure these contributions.
Materials and Methods
Preparation of materials
p-(Trifluomethyl)phenol (p-CF3C6H4OH), phenol (C6H5OH), 2,2,2-trifluoroethanol (CF3CH2OH), Ph3COH, 13C(OH)-labeled triphenylmethanol (Ph313COH), pyrrole (C4H4NH), p-dioxane (C4H8O2), and di(n-propyl) ketone ((n-C3H7)2C═O) were purchased from Sigma-Aldrich. Methanol-O-d (CH3OD), cyclohexane-d12 (C6D12), toluene-d8 (C7D8), o-dichlorobenzene-d4 (C4D4Cl2), and chloroform-d (CDCl3) were purchased from Cambridge Isotope Laboratories. Among these materials, the chemicals in solid state, p-CF3C6H4OH and C6H5OH, were dried in a vacuum oven at room temperature over night before use and Ph3COH and Ph313COH were used directly because they were already dry enough. All chemicals in liquid state except cyclohexane-d12, because it was already dry enough, were dried by mixing with 4 Å molecular sieves purchased from Sigma-Aldrich for 6–18 hr before use. Triethylamine (Et3N) and methanol (CH3OH), which were stored under dry argon and were pre-dried by using a home-made aluminum column, were a gift from Neil Garg Lab at UCLA.
Triphenylmethanol-O-d (Ph3COD) was made by mixing ∼2 g Ph3COH, 1 mL acetonitrile (CH3CN) and 2 mL deuterium oxide (D2O) for 2 days, followed by drying the mixture in a vacuum oven at room temperature for 1 day. The deuteration level in Ph3COD was verified by dissolving the dry powder of Ph3COD in dry chloroform-d at a concentration of more than 0.5 M and recording the1H-NMR spectrum in a BRUKER AV300 spectrometer. Almost no signal for the hydroxyl proton was detected compared to the peak for aromatic protons, suggesting nearly full deuteration at the hydroxyl group. Acetonitrile and deuterium oxide were purchased from Fisher Scientific and Cambridge Isotope Laboratories, respectively.
Measurement of φ-values for hydrogen-bond complexes formed between weak acids and weak bases
In aqueous solution, weak acids and weak bases cannot form hydrogen bonds with each other, but instead are hydrogen-bonding to water and are partially neutralized by one another. Therefore, we did not measure the φ-values of hydrogen-bond complexes formed between each weak acid and weak base [see Fig. 1(A)] directly in water, but we measured them at room temperature in an indirect way by converting the φ-value to a water reference in three steps [see Fig. 1(B)], where φ1, φ2, and φ3 are the equilibrium constants for the three steps, respectively.
The φ1-values were measured using a method similar to Jarret and Saunders.23 In our experiment, 0.10M p-CF3C6H4OH, 0.10M C6H5OH, 0.10M CF3CH2OH, 0.60M methanol-OH/OD (CH3OH/OD), 0.005M 13C-labeled Ph313COH, and 0.10M C4H4NH were added together to solvent which was composed of the pure base, triethylamine (Et3N), p-dioxane (C4H8O2) or di(n-propyl) ketone ((n-C3H7)2C═O), and a small amount of cyclohexane-d12(C6D12) at volume ratios of 9/1, 9/1, and 5/1, respectively. Except for the 13C-labeled Ph313COH, the natural abundance of 13C was utilized for the weak acids. In each of the three solutions, all the weak acids formed hydrogen bonds with the same base. The small amount of cyclohexane-d12 (ε = 2.0)42 was used to lock the magnetic field and keep the dielectric constants of the mixtures43 with each base, triethylamine (ε = 2.3)42, p-dioxane (ε = 2.3)42, and di(n-propyl) ketone (ε = 12.5),42 almost the same as the dielectric constants of toluene (ε = 2.3),42 toluene (ε = 2.3)42, and o-dichlorobenzene (ε = 9.9),42 respectively, because we measured the strengths of the hydrogen bonds in these solvents. The dielectric constants of the solvents we used here match well the range of dielectric constants in protein folded core regions experimentally measured.44 The ratio of the XH/XD group (X ═ O or N) for each acid was varied in a series samples by changing the ratio of OH/OD in the added methanol-OH/OD.
By monitoring the signal for the carbon atoms directly linked to the XH/XD group (X ═ O or N), that is, the α-C, from the 13C-NMR spectra, we measured the φ1-values of hydrogen bond complexes formed between weak acids and each of the three bases with reference to the φ-value of the hydrogen bond complex formed between the 13C-labeled Ph313COH and the same base at exchange equilibrium (∼3 hr after mixing).
As illustrated in Supporting Information Figure S1(A), two types of 13C-NMR spectra for α-C atoms were observed depending on the rate of H/D exchange. In the case of slow exchange, two separate peaks for α-C were seen, each having the same chemical shift as the pure C-XH or C-XD (X ═ O or N) state. Thus, for slow exchange we obtained the XH/XD ratio from the corresponding peak areas, A. The hydrogen bond complexes for 13C-labeled Ph313COH with all the three bases followed the slow-exchange regime. For the hydrogen bond complexes formed by other acids and the same base which also follow this slow-exchange regime, we plotted the ratios of A(AD:B)/A(AH:B) against the ratios of A(Ph313COD:B)/A(Ph313COH:B) for the solutions with different total amounts of protons and deuterons. Since
| (1) |
Their φ1-values were simply read from the slope of the least-square linear-line fitting of this plot, forcing the line to pass the origin [see Supporting Information Fig. S1(B)]. In the case of fast exchange, a merged peak for the α-C was seen, whose chemical shift, δ, is dependent on fraction of deuteron or proton within the hydrogen bond complex according to
| (2) |
where L represents the mixed state of labile protons and deuteron. The chemical shift of the pure protonated state, δ(AH:B), can be measured by adding the protonated Ch3OH only, but the chemical shift of deuterated state, δ(AD:B), cannot be determined directly. Consequently, their φ1-values were obtained in a different way. We first convert Eq. (2) into the following form,
| (3) |
If we define Δ = δ(AH:B)–δ(AD:B) in Eq. (3) and then plug Eq. (3) into Eq. (1), we obtain
| (4) |
Eq. (4) can be further re-written as
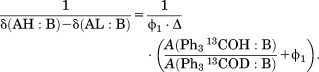 |
Thus, for the hydrogen bond complexes in the fast-exchange regime, their  values were plotted against the ratios of A(Ph313COH:B)/A(Ph313COD:B). The φ1-value is the absolute value of the x-intercept from the linear least-square fitting of this plot [see Supporting Information Fig. 1(C)]. The uncertainty of the φ1-value for each hydrogen bond complex is the sum of the standard deviation from three experiments and the average error from the data fitting for each experiment, that is, STD + (dexp1 + dexp2 + dexp3)/3, where STD stands for the standard deviations from the three experiments and dexp1, dexp2, and dexp3 are the errors in the φ1-value from fitting for the three experiments, respectively.
We measured φ2-values for the hydrogen bond complex formed between Ph3COH and each base as follows. 0.30 g Ph3COH and 0.30 g Ph3COD were added to 1.6 mL of the solvents triethylamine/cyclohexane-d12 (V/V = 9/1), p-dioxane/cyclohexane-d12 (V/V = 9/1), and di(n-propyl) ketone/cyclohexane-d12 (V/V = 5/1), respectively, and the mixtures were stirred in dark at room temperature for 2–4 days to allow for equilibrium to be established. The ratio of [Ph3COD:B]/[Ph3COH:B] in each solution, that is, the supernatant of each solid/liquid mixture containing ∼0.3M Ph3COH/D, were determined by measuring the ratio between the peak areas of 13C-OD and 13C-OH from the 13C-NMR spectrum by utilizing its natural 13C abundance. To determine the Ph3COH/D in the solid state, each solid–liquid mixture was filtered under vacuum and the solid was dried for 1 hr under vacuum at room temperature. The dried samples were then dissolved in deuterated chloroform to a concentration of ∼0.5 to 0.7 M. For Ph3COH/D re-dissolved in deuterated chloroform after drying from the triethylamine and the di(n-propyl) ketone samples, no peaks other than those for Ph3COH and chloroform were detectable from the 1H-NMR or 13C-NMR spectra. For Ph3COH/D re-dissolved in deuterated chloroform after drying from the p-dioxane samples, only 1–4% of p-dioxane with reference to Ph3COH was observed from the 1H-NMR spectrum. No peaks other than those for Ph3COH, chloroform and the residual p-dioxane were detected from the 1H-NMR or 13C-NMR spectra. This indicates that the deuterated chloroform solutions with re-dissolved Ph3COH/D solids were pure enough for determining the ratio of [Ph3COD]/[Ph3COH] in the solids. The ratio of [Ph3COD]/[Ph3COH] for all the samples was determined from the 13C-NMR spectrum and the uncertainty in φ2-value for each solid–liquid mixture is the standard deviation from three experiments.
The φ3-value was previously determined to be 1.10 ± 0.06 by Kreevoy and Liang.24 By multiplying φ1-, φ2-, and φ3-values together, we obtain the φ-value of each hydrogen bond complex with reference to water [see Fig. 1(B)]. The standard deviation of the final φ-value for each hydrogen bond complex, δφ, was derived from the uncertainties of φ1- and φ2-values according to the following equation,
where δφ1 and δφ2 are the uncertainties in φ1- and φ2-values, respectively. As the uncertainty of φ3-values will be applied to each hydrogen bond complex in the same way, it will have no effect on the relative uncertainties between any two hydrogen bonds, so it was not considered for determining the uncertainty in φ-value. The uncertainty in RTlnφ values was determined as RT(δφ/φ).
All the 13C-NMR measurements were performed on a BRUKER AV500 spectrometer equipped with a cyroprobe optimized for 13C sensitivity.
Measurement of strengths of hydrogen-bond complexes
The strength of the hydrogen bond, ΔGHB, formed by pairs of weak acids (AH) and weak bases (B) was measured as theassociation free energy of the hydrogen-bond complex (AH:B) in apolar, aprotic organic solvents. The weak acids we used were p-CF3C6H4OH, C6H5OH, CF3CH2OH, methanol-OH, Ph3COH, and C4H4NH. The weak bases we used were triethylamine, p-dioxane, and di(n-propyl) ketone. For hydrogen bonds formed between each of the weak acids and triethylamine or p-dioxane, a small amount of the weak acid was dissolved in toluene-d8to make the concentration of the acid of co = 0.0300 M and then the solution was divided into seven 600 uL aliquots. Next, various amounts of triethylamine or p-dioxane were added to the seven samples to make the final concentrations of the bases ranging from 0 to 0.5 M and 0 to 1.0 M, respectively. For hydrogen bonds formed between each of the weak acids and di(n-propyl) ketone, a small amount of the weak acid was dissolved in o-dichlorobenzene-d4to make the concentration of the acid of co = 0.0300 M and then the solution was divided into seven 600 uL aliquots. Next, di(n-propyl) ketone at different volumes were added to the seven samples to make the final concentrations of the base ranging from 0 to 1.0 M.
1H-NMR spectra were acquired for each sample at room temperature soon after they were prepared using BRUKER spectrometers AV300, DRX500, AV500, or AV600. Since the exchange between labile protons from the hydrogen-bonded complex and from the free acid is very fast, a merged peak representing the mixed state was always observed for the labile proton. The chemical shift of the labile proton was plotted against the volume of added base to obtain a binding isotherm. The equilibrium association constant, K, of the reaction was determined by least-square fitting as described by Fielding45 [see Supporting Information Fig. S1(D)]. A standard state of 1 M was used for K. The uncertainty of the K for each hydrogen bond complex was determined by comparing the discrepancy between two experiments. ΔGHB value for each hydrogen bond complex was determined as -RTln(NK), where R is the gas constant, N is the number of potential hydrogen acceptors per molecule of base, which is 2, 4, and 1 for di(n-propyl) ketone, p-dioxane and triethylamine, respectively. The reason the number N is included in the conversion of K into ΔGHB is that the concentration of hydrogen acceptors from the bases is actually N times higher than the concentration of each base. The uncertainty in ΔGHB was determined as RT(δK/K), where δK is the uncertainty in K.
Determination of the scale factor
The strength of each hydrogen bond formed between the model weak acids and weak bases expressed in the free energy change of forming the hydrogen bond, ΔGHB, was plotted against the value of RTlnφ of each at room temperature, where R is the ideal gas constant. A least-square fitting was made from the plot to determine the scale factor, which is simply the slope [see Fig. 1(C)].
Applying the new scale factor to study the difference in strength of protein hydrogen bonds
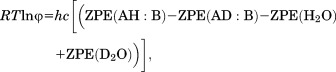
The φ-values for hydrogen bonds in several proteins have been measured,29–37 but those experiments were performed at different temperatures ranging from room temperature to 45°C. Thus, we need to convert their results into φ-values at room temperature before we apply the scale factorbecause our scale factor is determined at room temperature. As pointed out by Kreevoy and Liang,24 the φ-value of a hydrogen bond complex with reference to water is dependent on the zero-point energies, that is, the lowest (or ground-state) eigenvalues of energy for the vibrational potential functions, of hydrogen bonds formed between the weak acid and weak base and formed between water molecules in the protonated and deuterated forms. Their relationship can be written follows,24
 |
(5) |
where h is the Plank constant, c is the speed of light in vacuum, and ZPE stands for zero-point energy in the unit of cm−1. Since ZPE is not dependent on temperature especially when the change in temperature is very small, the right-hand side of Eq. (5), and therefore the RTlnφ value, can be considered as a constant for each hydrogen bond complex. Thus, the previously measured φ-values for hydrogen bonds at the experimental temperature, To, in the unit of Kelvin can be converted into the φ-values at room temperature as exp{[To/(298 K)] · lnφTo}. Thus, by applying the scale factor we report here to the φ-values of exchangeable hydrogen atoms in proteins at room temperature, we can calculate the difference between the free energies of any two protein hydrogen bonds.
Acknowledgments
This work was supported by NIH grant RO1 GM063919 and NSF equipment grant CHE-1048804.
Glossary
- C4H8O2
p-dioxane
- C6H5OH
phenol
- p-CF3C6H4OH
p-(Trifluomethyl)phenol
- C4H4NH
pyrrole
- CF3CH2OH
2,2,2-trifluoroethanol
- Ph3COH
Triphenylmethanol
- Ph3COD
Triphenylmethanol-O-d.
Additional Supporting Information may be found in the online version of this article.
References
- Fersht AR, Shi J-P, Knill-Jones J, Lowe DM, Wilkinson AJ, Blow DM, Brick P, Carter P, Waye MMY, Winter G. Hydrogen bonding and biological specificity analysed by protein engineering. Nature. 1985;314:235–238. doi: 10.1038/314235a0. [DOI] [PubMed] [Google Scholar]
- Fersht AR, Matouschek A, Serrano L. The folding of an enzyme: I. Theory of protein engineering analysis of stability and pathway of protein folding. J Mol Biol. 1992;224:771–782. doi: 10.1016/0022-2836(92)90561-w. [DOI] [PubMed] [Google Scholar]
- Rose GD, Wolfenden R. Hydrogen bonding, hydrophobicity, packing, and protein folding. Ann Rev Biophys Biomol Struct. 1993;22:381–415. doi: 10.1146/annurev.bb.22.060193.002121. [DOI] [PubMed] [Google Scholar]
- Marqusee S, Sauer RT. Contributions of a hydrogen bond/salt bridge network to the stability of secondary and tertiary structure in λ repressor. Protein Sci. 1994;3:2217–2225. doi: 10.1002/pro.5560031207. [DOI] [PMC free article] [PubMed] [Google Scholar]
- Shirley BA, Stanssens P, Hahn U, Pace CN. Contribution of hydrogen bonding to the conformational stability of ribonuclease T1. Biochemistry. 1992;31:725–732. doi: 10.1021/bi00118a013. [DOI] [PubMed] [Google Scholar]
- Myers JK, Pace CN. Hydrogen bonding stabilizes globular proteins. Biophys J. 1996;71:2033–2039. doi: 10.1016/S0006-3495(96)79401-8. [DOI] [PMC free article] [PubMed] [Google Scholar]
- Myers JK, Oas TG. Contribution of a buried hydrogen bond to lambda repressor folding kinetics. Biochemistry. 1999;38:6761–6768. doi: 10.1021/bi990088x. [DOI] [PubMed] [Google Scholar]
- Takano K, Yamagata Y, Funahashi J, Hioki Y, Kuramitsu S, Yutani K. Contribution of intra- and intermolecular hydrogen bonds to the conformational stability of human lysozyme. Biochemistry. 1999;38:12698–12708. doi: 10.1021/bi9910169. [DOI] [PubMed] [Google Scholar]
- Fernández-Recio J, Romero A, Sancho J. Energetics of a hydrogen bond (charged and neutral) and of a cation-π interaction in apoflavodoxin. J Mol Biol. 1999;290:319–330. doi: 10.1006/jmbi.1999.2863. [DOI] [PubMed] [Google Scholar]
- Albeck S, Unger R, Schreiber G. Evaluation of direct and cooperative contributions towards the strength of buried hydrogen bonds and salt bridges. J Mol Biol. 2000;298:503–520. doi: 10.1006/jmbi.2000.3656. [DOI] [PubMed] [Google Scholar]
- Pace CN, Horn G, Hebert EJ, Bechert J, Shaw K, Urbanikova L, Scholtz JM, Sevcik J. Tyrosine hydrogen bonds make a large contribution to protein stability. J Mol Biol. 2001;312:393–404. doi: 10.1006/jmbi.2001.4956. [DOI] [PubMed] [Google Scholar]
- Takano K, Scholtz JM, Sacchettini JC, Pace CN. The contribution of polar group burial to protein stability is strongly context-dependent. J Biol Chem. 2003;278:31790–31795. doi: 10.1074/jbc.M304177200. [DOI] [PubMed] [Google Scholar]
- Jang DS, Cha HJ, Cha S-S, Hong BH, Ha N-C, Lee JY, Oh B-H, Lee H-S, Choi KY. Structural double-mutant cycle analysis of a hydrogen bond network in ketosteroid isomerase from Pseudomonas putida biotype B. Biochem J. 2004;382:967. doi: 10.1042/BJ20031871. [DOI] [PMC free article] [PubMed] [Google Scholar]
- Campos LA, Cuesta-López S, López-Llano J, Falo F, Sancho J. A double-deletion method to quantifying incremental binding energies in proteins from experiment: example of a destabilizing hydrogen bonding pair. Biophys J. 2005;88:1311–1321. doi: 10.1529/biophysj.104.050203. [DOI] [PMC free article] [PubMed] [Google Scholar]
- Joh NH, Min A, Faham S, Whitelegge JP, Yang D, Woods VL, Bowie JU. Modest stabilization by most hydrogen-bonded side-chain interactions in membrane proteins. Nature. 2008;453:1266–1270. doi: 10.1038/nature06977. [DOI] [PMC free article] [PubMed] [Google Scholar]
- Pace CN. Energetics of protein hydrogen bonds. Nat Struct Mol Biol. 2009;16:681–682. doi: 10.1038/nsmb0709-681. [DOI] [PubMed] [Google Scholar]
- Hong H, Blois TM, Cao Z, Bowie JU. Method to measure strong protein-protein interactions in lipid bilayers using a steric trap. Proc Natl Acad Sci USA. 2010;107:19802–19807. doi: 10.1073/pnas.1010348107. [DOI] [PMC free article] [PubMed] [Google Scholar]
- Bowie JU. Membrane protein folding: how important are hydrogen bonds? Curr Opin Struct Biol. 2011;21:42–49. doi: 10.1016/j.sbi.2010.10.003. [DOI] [PMC free article] [PubMed] [Google Scholar]
- Fu Y, Gao J, Bieschke J, Dendle MA, Kelly JW. Amide-to-E-olefin versus amide-to-ester backbone H-bond perturbations: evaluating the O-O repulsion for extracting H-bond energies. J Am Chem Soc. 2006;128:15948–15949. doi: 10.1021/ja065303t. [DOI] [PMC free article] [PubMed] [Google Scholar]
- Gao J, Kelly JW. Toward quantification of protein backbone-backbone hydrogen bonding energies: an energetic analysis of an amide-to-ester mutation in an alpha-helix within a protein. Protein Sci. 2008;17:1096–1101. doi: 10.1110/ps.083439708. [DOI] [PMC free article] [PubMed] [Google Scholar]
- Gao J, Bosco DA, Powers ET, Kelly JW. Localized thermodynamic coupling between hydrogen bonding and microenvironment polarity substantially stabilizes proteins. Nat Struct Mol Biol. 2009;16:684–690. doi: 10.1038/nsmb.1610. [DOI] [PMC free article] [PubMed] [Google Scholar]
- Wang M, Wales TE, Fitzgerald MC. Conserved thermodynamic contributions of backbone hydrogen bonds in a protein fold. Proc Natl Acad Sci USA. 2006;103:2600–2604. doi: 10.1073/pnas.0508121103. [DOI] [PMC free article] [PubMed] [Google Scholar]
- Jarret RM, Saunders M. A new method for obtaining isotopic fractionation data at multiple sites in rapidly exchanging systems. J Am Chem Soc. 1985;107:2648–2654. [Google Scholar]
- Kreevoy MM, Liang TM. Structures and isotopic fractionation factors of complexes, A1HA2- J Am Chem Soc. 2012;102:3315–3322. [Google Scholar]
- Kreevoy MM, Liang T-M, Chang K-C. Structures and isotopic fractionation factors of complexes AHA-1. J Am Chem Soc. 2012;99:5207–5209. [Google Scholar]
- Hibbert F, Emsley J. Hydrogen bonding and chemical reactivity. In: Bethell D, editor. Advances in Physical Organic Chemistry. Vol. 26. London, New York: Academic Press; 1991. pp. 255–379. [Google Scholar]
- Vakonakis I, Salazar M, Kang M, Dunbar KR, LiWang AC. Deuterium isotope effects and fractionation factors of hydrogen-bonded A:T base pairs of DNA. J Biomol NMR. 2003;25:105–112. doi: 10.1023/a:1022211927051. [DOI] [PubMed] [Google Scholar]
- Shi Z, Krantz BA, Kallenbach N, Sosnick TR. Contribution of hydrogen bonding to protein stability estimated from isotope effects. Biochemistry. 2002;41:2120–2129. doi: 10.1021/bi011307t. [DOI] [PubMed] [Google Scholar]
- Loh SN, Markley JL. Hydrogen bonding in proteins as studied by amide hydrogen D/H fractionation factors: application to Staphylococcal nuclease. Biochemistry. 1994;33:1029–1036. doi: 10.1021/bi00170a023. [DOI] [PubMed] [Google Scholar]
- Bowers PM, Klevit RE. Hydrogen bonding and equilibrium isotope enrichment in histidine-containing proteins. Nat Struct Mol Biol. 1996;3:522–531. doi: 10.1038/nsb0696-522. [DOI] [PubMed] [Google Scholar]
- LiWang AC, Bax A. Equilibrium protium/deuterium fractionation of backbone amides in U−13C/15N labeled human ubiquitin by triple resonance NMR. J Am Chem Soc. 1996;118:12864–12865. [Google Scholar]
- Khare D, Alexander P, Orban J. Hydrogen bonding and equilibrium protium-deuterium fractionation factors in the immunoglobulin G binding domain of protein G. Biochemistry. 1999;38:3918–3925. doi: 10.1021/bi9827114. [DOI] [PubMed] [Google Scholar]
- Halkides CJ, Wu YQ, Murray CJ. A low-barrier hydrogen bond in subtilisin: 1H and 15N NMR studies with peptidyl trifluoromethyl ketones. Biochemistry. 1996;35:15941–15948. doi: 10.1021/bi961805f. [DOI] [PubMed] [Google Scholar]
- Harris TK, Abeygunawardana C, Mildvan AS. NMR studies of the role of hydrogen bonding in the mechanism of triosephosphate isomerase. Biochemistry. 1997;36:14661–14675. doi: 10.1021/bi972039v. [DOI] [PubMed] [Google Scholar]
- Lin J, Westler WM, Cleland WW, Markley JL, Frey PA. Fractionation factors and activation energies for exchange of the low barrier hydrogen bonding proton in peptidyl trifluoromethyl ketone complexes of chymotrypsin. Proc Natl Acad Sci USA. 1998;95:14664–14668. doi: 10.1073/pnas.95.25.14664. [DOI] [PMC free article] [PubMed] [Google Scholar]
- Markley JL, Westler WM. Protonation-state dependence of hydrogen bond strengths and exchange rates in a serine protease catalytic triad: Bovine chymotrypsinogen A†. Biochemistry. 1996;35:11092–11097. doi: 10.1021/bi961366k. [DOI] [PubMed] [Google Scholar]
- Takeda M, Jee J, Terauchi T, Kainosho M. Detection of the sulfhydryl groups in proteins with slow hydrogen exchange rates and determination of their proton/deuteron fractionation factors using the deuterium-induced effects on the 13Cβ NMR signals. J Am Chem Soc. 2010;132:6254–6260. doi: 10.1021/ja101205j. [DOI] [PubMed] [Google Scholar]
- Edison AS, Weinhold F, Markley JL. Theoretical studies of protium/deuterium fractionation factors and cooperative hydrogen bonding in peptides. J Am Chem Soc. 2012;117:9619–9624. [Google Scholar]
- Mitchell JBO, Price SL. The nature of the N-H···O=C hydrogen bond: an intermolecular perturbation theory study of the formamide/formaldehyde complex. J Comput Chem. 1990;11:1217–1233. [Google Scholar]
- Ben-Tal N, Sitkoff D, Topol IA, Yang A-S, Burt SK, Honig B. Free energy of amide hydrogen bond formation in vacuum, in water, and in liquid alkane solution. J Phys Chem B. 1997;101:450–457. [Google Scholar]
- Avbelj F, Luo P, Baldwin RL. Energetics of the interaction between water and the helical peptide group and its role in determining helix propensities. Proc Natl Acad Sci USA. 2000;97:10786–10791. doi: 10.1073/pnas.200343197. [DOI] [PMC free article] [PubMed] [Google Scholar]
- Maryott AA, Smith ER. Table of Dielectric Constants of Pure Liquids. National Bureau of Standards Circular 514; 1951. Available from: http://oai.dtic.mil/oai/oai?verb=getRecord&metadataPrefix=html&identifier=ADA278956. [Google Scholar]
- Jouyban A, Soltanpour S, Chan H-K. A simple relationship between dielectric constant of mixed solvents with solvent composition and temperature. Int J Pharm. 2004;269:353–360. doi: 10.1016/j.ijpharm.2003.09.010. [DOI] [PubMed] [Google Scholar]
- Hass MAS, Ringkjøbing Jensen M, Led JJ. Probing electric fields in proteins in solution by NMR spectroscopy. Proteins. 2008;72:333–343. doi: 10.1002/prot.21929. [DOI] [PubMed] [Google Scholar]
- Fielding L. Determination of association constants (Ka) from solution NMR data. Tetrahedron. 2000;56:6151–6170. [Google Scholar]
Associated Data
This section collects any data citations, data availability statements, or supplementary materials included in this article.