

Background: Molecular properties of class VIII myosin are not characterized.
Results: Arabidopsis class VIII myosin, ATM1, has low enzymatic activity and high affinity for actin and is primarily localized at the cell cortex.
Conclusion: Our data suggest that ATM1 functions as a tension sensor/generator.
Significance: This is the first report of enzymatic and motile properties of class VIII myosin.
Keywords: Actin, Arabidopsis, ATPases, Kinetics, Molecular Motors, Myosin
Abstract
Land plants possess myosin classes VIII and XI. Although some information is available on the molecular properties of class XI myosins, class VIII myosins are not characterized. Here, we report the first analysis of the enzymatic properties of class VIII myosin. The motor domain of Arabidopsis class VIII myosin, ATM1 (ATM1-MD), and the motor domain plus one IQ motif (ATM1-1IQ) were expressed in a baculovirus system and characterized. ATM1-MD and ATM1-1IQ had low actin-activated Mg2+-ATPase activity (Vmax = 4 s−1), although their affinities for actin were high (Kactin = 4 μm). The actin-sliding velocities of ATM1-MD and ATM1-1IQ were 0.02 and 0.089 μm/s, respectively, from which the value for full-length ATM1 is calculated to be ∼0.2 μm/s. The results of actin co-sedimentation assay showed that the duty ratio of ATM1 was ∼90%. ADP dissociation from the actin·ATM1 complex (acto-ATM1) was extremely slow, which accounts for the low actin-sliding velocity, low actin-activated ATPase activity, and high duty ratio. The rate of ADP dissociation from acto-ATM1 was markedly biphasic with fast and slow phase rates (5.1 and 0.41 s−1, respectively). Physiological concentrations of free Mg2+ modulated actin-sliding velocity and actin-activated ATPase activity by changing the rate of ADP dissociation from acto-ATM1. GFP-fused full-length ATM1 expressed in Arabidopsis was localized to plasmodesmata, plastids, newly formed cell walls, and actin filaments at the cell cortex. Our results suggest that ATM1 functions as a tension sensor/generator at the cell cortex and other structures in Arabidopsis.
Introduction
Myosin is a motor protein that converts the chemical energy liberated by ATP hydrolysis into a directed movement on actin filaments. Phylogenetic analyses of myosin sequences reveal that there are at least 35 myosin classes (1), and their motor functions such as motility and ATP hydrolysis vary significantly. Only class VIII and XI myosins exist in higher plants. Arabidopsis thaliana possesses 4 and 13 genes encoding class VIII and XI myosins, respectively (2).
Studies on the intracellular functions of class XI myosins using immunolocalization, transfer DNA mutants, RNA interference, overexpression of dominant-negative myosins, and velocity-modified chimeric myosin XI indicated that they are responsible for organelle transport, organization of actin cable, and cell and plant growth (3–13). Molecular properties of several class XI myosins have also been characterized. The actin-sliding velocities and the actin-activated ATPase activities of class XI myosins are higher than those of other myosin classes (14–19). The dissociation rates of ADP from acto-class XI myosins are extremely fast and account for their high actin-sliding velocities (15, 19, 20).
In contrast to class XI myosins, considerably less is known about molecular properties and intracellular functions of class VIII myosins, although class VIII myosin, ATM1, was the first plant myosin to be identified and sequenced (21). The Arabidopsis genome encodes the following four class VIII myosins: ATM1, ATM2, VIIIA, and VIIIB (2). Immunolocalization experiments showed that ATM1 is localized to the plasmodesmata and new cell plates in the root of Arabidopsis (22). Analysis of the expression of GFP-fused tail domain of ATM1 suggests that endogenous ATM1 is localized to the plasmodesmata, endoplasmic reticulum, and plasma membranes (23). Although there is some evidence indicating the subcellular localization of class VIII myosins, definitive information regarding tissue-specific expression and subcellular localization using full-length myosin VIII expressed under the control of its native promoter have not been reported. In addition, molecular properties such as ATPase activity and actin-sliding velocity of class VIII myosin have not been characterized.
In this study, we expressed Arabidopsis class VIII myosin, ATM1, in a baculovirus system and uncovered its molecular properties. Furthermore, its subcellular localization was determined by expressing GFP-fused full-length ATM1 in Arabidopsis under the control of its native promoter.
EXPERIMENTAL PROCEDURES
Constructs, Expression, and Preparation
Full-length cDNAs of Arabidopsis class VIII myosin, ATM1 (AT3G19960), and Arabidopsis calmodulin, CaM3 (AT3G56800), were provided by the RIKEN Bio Resource Center (24, 25). Baculovirus transfer vectors for ATM1-MD (pFastBac ATM1-MD) and ATM1-1IQ (pFastBac ATM1-1IQ) were generated using site-directed mutagenesis polymerase chain reactions (PCR) as follows. ATM1 cDNA was mutated to create an NcoI site at the 5′ end of nucleotide 1 of ATM1 and an AgeI site at the 3′ end of nucleotide 2526 of ATM1-MD or at nucleotide 2595 of ATM1-1IQ. PCR products were digested using NcoI and AgeI and ligated to the NcoI–AgeI fragment of pFastBac MD (19). These constructs (pFastBac ATM1-MD and pFastBac ATM1-1IQ) encode amino acid residues 1–842 of ATM1 or 1–865 of ATM1 for ATM1-MD and ATM1-1IQ, respectively, and also include a flexible linker (GGG), a Myc epitope sequence (EQKLISEEDL), and a His8 tag. ATM1-MD and ATM1-1IQ were expressed in High FiveTM cells (Invitrogen) and purified as described previously (19, 20). ATM1-1IQ was expressed along with Arabidopsis calmodulin because the light chains of many unconventional myosins are calmodulin (26–38). Similar to many unconventional myosins (X (, 29, 37), III, and VIIA (39) and our previous paper XI-Va chimera (19)), we added 1 μm Arabidopsis calmodulin (Arabidopsis CaM 3) during purification and experiments to ensure that the IQ domains had bound calmodulin.
A baculovirus transfer vector for Arabidopsis CAM3 (pFastBac Arabidopsis calmodulin 3) was generated as follows. An Arabidopsis cDNA encoding CAM3 was mutated to create an XbaI site at the 5′ end and XhoI site at the 3′ end (after the translation termination codon) using site-directed mutagenesis PCR. PCR products were digested with XbaI and XhoI and ligated to the XbaI and XhoI fragment of pFastBac 1 (Invitrogen). This construct (pFastBac Arabidopsis calmodulin 3) encodes full-length Arabidopsis CAM3. This was expressed in insect cells and purified as described previously (19).
For the promoter-GUS (β-glucuronidase) assay, 3 kb of 5′-flanking sequences containing the first exon of ATM1 was PCR-amplified and subcloned into pENTR-D-TOPO (Invitrogen) and subsequently exchanged into the binary vector pGWB533 (40) using LR Clonase® (Invitrogen) according to the manufacturer's instructions.
For transient expression in protoplasts, an ATM1 cDNA (AT3G19960) was amplified from total RNA purified from Arabidopsis seedlings (7-day-old) and subcloned into pENTR/D-TOPO (Invitrogen). The ATM1 sequence in the pENTR-D-TOPO cloning vector was exchanged into the binary vector pUGW0-sGFP using the LR reaction. For expression in Arabidopsis, full-length genomic ATM1 DNA, including the cDNA encoding sGFP upstream of the translational start codon, was generated by fluorescent tagging (41). The ATM1 fragment contains 3 kb of 5′- and 1 kb of 3′-flanking sequences. Amplified chimeric fragments were subcloned into the binary vector pGWB501 (40).
ATPase Activities and in Vitro Actin Gliding Assays
Steady-state ATPase activities were measured using a modified malachite green method (42). To avoid the possible inhibitory effect of ADP on binding of ATP to the active site, ATPase activities were measured when the molar ratio of ADP/ATP was less than 0.01.
The reaction mixtures for the assay of the basal Mg2+-ATPase activity contained 25 mm KCl, 4 mm MgCl2, 25 mm Hepes-KOH (pH 7.4), 1 mm EGTA, 1 mm DTT, 2 mm ATP, 1 mg/ml BSA (Sigma, catalog no. A0281), and 4 μm ATM1-MD or ATM1-1IQ. The reaction mixtures for the assay of actin-activated Mg2+-ATPase activity contained 25 mm KCl, 4 mm MgCl2, 25 mm Hepes-KOH (pH 7.4), 1 mm EGTA, 1 mm DTT, 2 mm ATP, 1 mg/ml BSA, 3–95 μm F-actin, and 0.005–0.03 μm ATM1-MD or ATM1-1IQ.
Actin-sliding velocities were measured using an anti-Myc antibody-based version of the in vitro actin-gliding assay as described (19). To avoid the possible inhibitory effect of ADP on actin-sliding velocities, an ATP regeneration system (0.4 mm phosphocreatine and 25 units/ml creatine phosphokinase) was included. To compare with other myosins (17, 19, 28, 29, 33, 34, 36, 43–48), the reactions of steady-state ATPase activities, in vitro actin-gliding assay, and kinetic measurements were conducted in the commonly used ionic strength (∼50 mm) and temperature (25 °C) unless stated otherwise. The free [Mg2+] was 1.8 mm unless otherwise stated. The standard solution was as follows: 25 mm KCl, 4 mm MgCl2, 25 mm Hepes-KOH (pH 7.4), 2 mm ATP, 10 mm DTT, 1 mm EGTA. In some experiments using either 0.17 or 0.46 mm of free [Mg2+], the ionic strengths were adjusted to 50 mm by changing the KCl concentration. The compositions of the assay mixtures were as follows: 1) 0.17 mm free [Mg2+]: 28 mm KCl, 1.7 mm MgCl2, 25 mm Hepes-KOH (pH 7.4), 2 mm ATP, 10 mm DTT, 1 mm EGTA; 2) 0.46 mm free [Mg2+]: 28 mm KCl, 2.3 mm MgCl2, 25 mm Hepes-KOH (pH 7.4), 2 mm ATP, 10 mm DTT, 1 mm EGTA. Free [Mg2+] and ionic strength were calculated using CALCON, which is based on Goldstein's algorithm (49). ATPase activities and in vitro actin-gliding assays were done at 25 °C. For ATPase activities and in vitro actin-gliding assays of ATM1-1IQ, 1 μm Arabidopsis calmodulin was added in the assay buffer.
Co-sedimentation Assays
Co-sedimentation assays were performed as described (29), except that the solution was 170 mm in ionic strength (90 mm KCl, 4 mm MgCl2, 25 mm Hepes-KOH (pH 7.4), 2 mm ATP, 1 mm EGTA, 5 mm DTT, 10 mm phosphocreatine, and 50 units/ml creatine phosphokinase). In brief, 1 μm ATM1-MD was mixed with 0–96 μm actin and centrifuged at 280,000 × g for 20 min at 25 °C in the presence of ATP and the ATP generation system. Less than 12 μm actin, phalloidin-actin was used. The supernatant of each actin concentration was subjected to SDS-PAGE, and the fraction of ATM1-MD bound to actin was determined by quantifying the amount of ATM1-MD in the supernatant using ImageJ software (National Institutes of Health). About 10% of ATM1 was precipitated in the absence of actin (0 μm actin). Thus, it is necessary to remove this artificial effect presumably caused by the aggregations of ATM1 to calculate the actual amount of acto-ATM1 precipitations. So, the amount of the pellet and the supernatant at 0 μm actin was set as zero and total amount of ATM1-MD, respectively. Therefore, the fraction unbound at each concentration of actin was calculated as follows: 100% × (the amount of supernatant at each concentration of actin)/(the amount of supernatant at 0 μm actin). The fraction bound was plotted as a function of actin concentration to determine the affinity of ATM1-MD for actin in the presence of ATP.
Transient Kinetic Measurements
All kinetic experiments were performed using an Applied Photophysics SX18MV stopped-flow spectrophotometer (dead time, 1.15 ms) as described (19). The solution used for the transient kinetic experiments was the same as that used for the ATPase activities and the in vitro actin-gliding assays unless stated otherwise.
Transient Expression in Protoplasts of Arabidopsis
The transient expression of GFP-ATM1 in protoplasts prepared from suspension cultures of Arabidopsis cells was conducted as follows: 2 g of cultured cells was incubated in 25 ml of enzyme solution (0.4 m mannitol, 5 mm EGTA, 1% cellulase R-10, and 0.05% pectolyase Y-23) for 1–2 h at 30 °C and filtered through a nylon mesh (125-μm pore). Protoplasts were washed twice with 25 ml of solution A (0.4 m mannitol, 70 mm CaCl2, and 5 mm MES-KOH (pH 5.7)) and resuspended in 1 ml of MaMg solution (0.4 m mannitol, 15 mm MgCl2, and 5 mm MES-KOH (pH 5.7)). After adding 20 μg of plasmid and 50 μg of carrier DNA to 100 μl of protoplast solution, 400 μl of DNA uptake solution (0.4 m mannitol, 40% polyethylene glycol 6000, and 0.1 m Ca(NO3)2) was added. The protoplasts were incubated on ice for 20 min and subsequently diluted with 10 ml of dilution solution (0.4 m mannitol, 125 mm CaCl2, 5 mm KCl, 5 mm glucose, and 1.5 mm MES-KOH (pH 5.7)). The protoplasts were resuspended in 4 ml of MS medium containing 0.4 m mannitol and incubated with gentle agitation at 23 °C for 16 h in the dark.
Plant Transformation
Plasmids were electroporated into Agrobacterium tumefaciens strain GV3101::pMP90 using a Gene Pulser (Bio-Rad). They were introduced into an Arabidopsis atm-1 knock-out line (SAIL_405_B08; AT3G19960) using the floral dipping method. T1 plants with resistance to hygromycin were selected. T2 generation plants were used for the promoter-GUS assay (50), and homozygous T3 plants were used for imaging full-length ATM1.
Confocal Laser Scanning Microscopy
GFP fluorescence in cells was detected using a spinning disk confocal laser scanning microscope (CSU10, Yokogawa, Kanazawa, Japan) equipped with a high resolution CCD camera (ORCA-AG, Hamamatsu Photonics, Hamamatsu, Japan). The images were processed using iVision Macintosh software (BioVision Technologies, Exton, PA).
RESULTS
Constructs
A schematic diagram of native ATM1 deduced from its amino acid sequence is shown in Fig. 1A, Native ATM1. Native ATM1 includes motor and neck domains with four IQ motifs and coiled-coil and globular tail domains. It is likely that calmodulin or calmodulin-like light chains bind to each IQ motif and that native ATM1 forms a dimer through the interaction of its coiled-coil domain. We generated two recombinant ATM1 constructs called ATM1-MD and ATM1-1IQ (Fig. 1A, Recombinant ATM1). ATM1-MD contains a single motor domain, and ATM1-1IQ includes a motor domain and the first IQ motif. The expected lever arm lengths of ATM-1MD, ATM1-1IQ, and native ATM1 are 3, 7, and 19 nm, respectively. ATM1-MD and ATM1-1IQ were expressed using a baculovirus system. ATM1-1IQ was expressed along with Arabidopsis calmodulin. ATM-1MD and ATM1-1IQ were purified by co-precipitation with actin and nickel-affinity resin. For ATM1-1IQ purification, 1 μm Arabidopsis calmodulin was added to the purification buffer throughout the purification. Purified ATM1-1IQ contained calmodulin with stoichiometry 1:1 (Fig. 1B, with CaM). When external calmodulin was deleted before washing the Ni-NTA column, the stoichiometry decreased below 1:1 (Fig. 1B, wo CaM). These results suggest that calmodulin was weakly bound to the first IQ motif as a light chain, which was in equilibrium with the external calmodulin. It is also possible that the IQ motif might bind other light chains, not just calmodulin.
FIGURE 1.
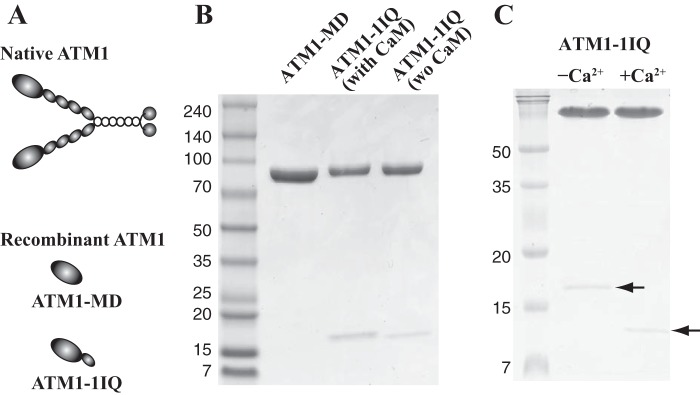
A, schematic diagrams showing native ATM1 and recombinant ATM1 constructs, ATM1-MD and ATM1-1IQ. The domain structure of native ATM1 was deduced from its amino acid sequence. B, SDS-PAGE of purified ATM1-MD and ATM1-1IQ. Purified ATM1-MD and ATM1-1IQ were analyzed using 4–20% SDS-PAGE and stained with Coomassie Brilliant Blue. For ATM1-1IQ (with CaM), throughout the purifications 1 μm calmodulin was added. For ATM1-1IQ (wo CaM), before washing the Ni-NTA-agarose column, external calmodulin was deleted. C, SDS-PAGE of purified ATM1-MD in the presence of EGTA or Ca2+. Purified ATM1-1IQ was incubated with either 5 mm CaCl2 (+Ca2+) or 5 mm EGTA (−Ca2+) and then analyzed using 16% SDS-PAGE and stained with Coomassie Brilliant Blue. Low molecular mass band (arrow) shifts the mobility by Ca2+, typical of calmodulin.
Steady-state ATPase Activity
The basal Mg2+-ATPase activities of ATM1-MD and ATM1-1IQ were extremely low (Table 1; 0.014 ± 0.0005 and 0.012 ± 0.0007 s−1, respectively, at 25 °C). The Mg2+-ATPase activities were markedly activated by actin (Fig. 2). Vmax of actin-activated Mg2+-ATPase activities (Table 1; ATM1-MD, 4.1 ± 0.1 s−1; ATM1-1IQ, 4.7 ± 0.2 s−1) are lower by a factor of 10–100 compared with those of plant class XI myosins (15, 17, 18) and are similar to those of animal unconventional myosins such as classes V (30), VI (51), and X (52). Kactin values (Table 1; ATM1-MD, 3.2 ± 0.4 μm; ATM1-1IQ, 4.3 ± 0.3 μm) are considerably less than those of plant-specific class XI myosins (15, 17, 18) and similar to those of animal unconventional myosins such as classes V (31) and VI (33).
TABLE 1.
Steady-state ATPase activity of ATM1
The basal ATPase rate (V0) was measured in the absence of actin. The actin-activated ATPase results were fit to the Michaelis-Menten equation to determine the maximum ATPase rate (Vmax) and actin concentration at which the ATPase rate was half-maximal (Kactin).
| Constructs | V0a | Vmaxb | Kactinb |
|---|---|---|---|
| s−1 | s−1 | (μm) | |
| ATM1-MD | 0.014 ± 0.0005 | 4.1 ± 0.1 | 3.2 ± 0.4 |
| ATM1-1IQ | 0.012 ± 0.0007 | 4.7 ± 0.2 | 4.3 ± 0.3 |
a Mean ± S.D. of six independent measurements from two independent protein preparations.
b Values are from the Michaelis-Menten equation (from Fig. 2).
FIGURE 2.
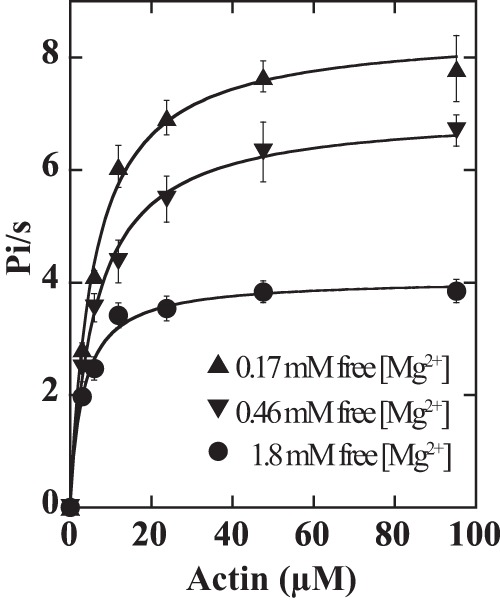
Actin-activated Mg2+-ATPase activities of ATM1 as a function of free magnesium concentrations. Assays were performed in the presence of 0.17, 0.46, or 1.8 mm free [Mg2+]. Values are averages of 3–9 assays from two to four independent preparations of ATM1-MD. The reactions were performed at 25 °C, and the data were fitted to the Michaelis-Menten equation. Vmax at 0.17, 0.46, and 1.8 mm free [Mg2+] were 8.5 ± 0.18, 7.0 ± 0.15, and 4.1 ± 0.10/s, respectively. Kactin values determined using 0.17, 0.46, and 1.8 mm free [Mg2+] were 5.6 ± 0.49, 6.2 ± 0.53, and 3.2 ± 0.39 μm, respectively. The values after ± indicate S.D. of the regression curves.
Actin-sliding Velocity
The actin-sliding velocities of ATM1-MD and ATM1-1IQ measured using an in vitro actin-gliding assay were 0.02 ± 0.003 and 0.089 ± 0.013 μm/s, respectively, at 25 °C (Fig. 3, 1.8 mm free Mg2+). The difference may be explained by the differences in their lever arm length because the velocities of myosins are proportional to their lever arm length, if their motor domains are the same (18, 19, 44). Based on these results and lever arm length of native ATM1, we estimated that the velocity of native ATM1 is ∼0.2 μm/s at 25 °C. This value is only 1% of those of plant-specific class XI myosins (15, 17, 18) and is similar to those of unconventional animal slow myosins such as classes V(30), VI (51), and X (52). These results suggest that ATM1 functions as a slow transporter and/or a tension generator.
FIGURE 3.
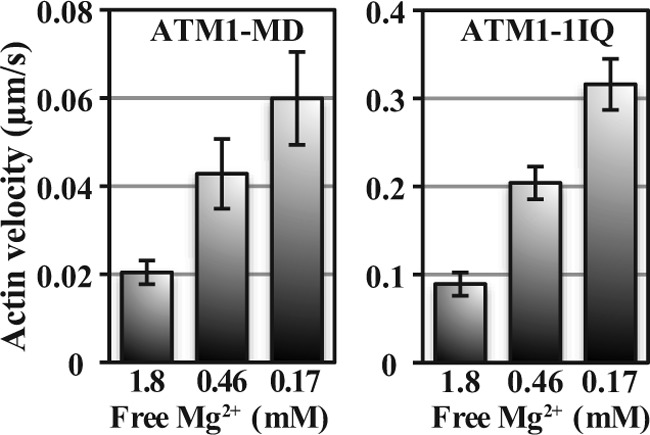
Actin-sliding velocities of ATM1-MD and ATM1-1IQ as a function of free magnesium concentration. Experiments were performed in the presence of 0.17, 0.46, and 1.8 mm free [Mg2+] at fixed ionic strength (50 mm) and ATP concentration (2 mm). There were significant differences among velocities of different free [Mg2+] (Student's t test, p < 0.001).
Modulation of Actin-activated ATPase Activity and Actin-sliding Velocity by Free [Mg2+]
Actin-activated ATPase activities and actin-sliding velocities of certain unconventional animal myosins that exhibit low actin-activated ATPase activities and slow actin velocities are regulated by free [Mg2+] (53–56). Free [Mg2+]i in animal cells is not stable but varies temporally and spatially in the range 0.2–2 mm (57–70). Although studies about free [Mg2+]i in plant cells was limited, a similar concentration (0.2–2 mm) was estimated (71, 72). Therefore, we investigated whether actin-sliding velocity and actin-activated ATPase activities of ATM1 were regulated by free [Mg2+] in this concentration range.
The relationship between velocities and free [Mg2+] was the same for ATM1-MD and ATM1-IQ. When free [Mg2+] increased, actin-sliding velocity decreased. Actin-sliding velocities in the presence of 0.46 and 0.17 mm free [Mg2+] were higher by factors of 2 and 3, respectively, than in the presence of 1.8 mm (Fig. 3). Actin-activated ATPase activities also decreased when free [Mg2+] increased. Vmax of actin-activated ATPase activities of ATM1-MD at 0.46 and 0.17 mm [Mg2+] were higher by factors of 1.7 and 2.1, respectively, than those in the presence of 1.8 mm [Mg2+] (Fig. 2).
ATP-induced Dissociation of Acto-ATM1
To unravel the molecular mechanism underlying slow actin-sliding velocity and the dependence of actin-activated ATPase activity and actin-sliding velocity on free [Mg2+], we investigated the kinetic properties of ATM1. We used ATM1-MD for kinetic analyses because its steady-state ATPase activity and modulation of actin-sliding velocity by free [Mg2+] were the same as those of ATM1-1IQ (Table 1 and Fig. 3), although it is possible that there could still be differences between ATM1-MD and ATM1-1IQ. Kinetic modeling and simulations of actomyosin were performed according to the simplified reaction mechanism as shown in Scheme 1, which has been used in kinetic studies of many myosins (28, 29, 34, 35, 56, 73–75).
SCHEME 1.
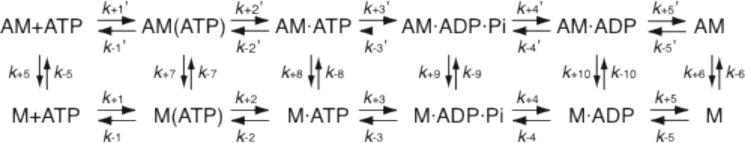
ATP hydrolysis cycle of actomyosin. A, actin; M, myosin.
We first investigated the molecular basis underlying slow actin-sliding velocity. In general, the actin-sliding velocities of myosins depend on the time when they are strongly bound to actin (ts). ts is primarily determined by the ADP dissociation rate from acto-myosin and the acto-myosin dissociation rate upon ATP binding at saturating ATP concentrations (76, 77). Therefore, we determined these rates.
The acto-myosin dissociation reaction upon ATP binding can be described as a two-step process (Scheme 2), and the rate constant is expressed as K′1k′+2[ATP]/(1 + K′1[ATP]) (76).
SCHEME 2.

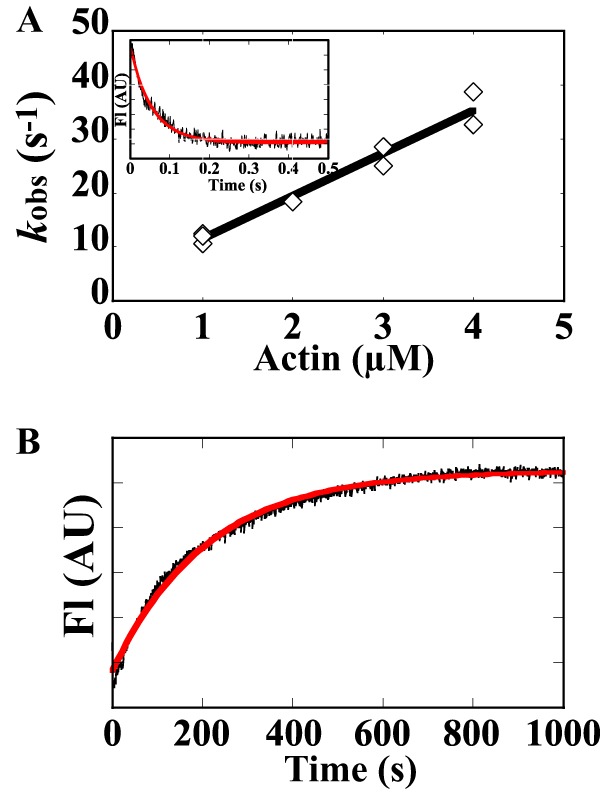
The first step in Scheme 2 (where A is actin, and M is myosin) is the formation of a collision complex between acto-myosin and ATP, which are in rapid equilibrium. The second step is the dissociation of myosin-ATP from actin following the isomerization of myosin. To determine K′1 and k′+2, a pyrene·actin·ATM1-MD complex was dissociated by mixing with 10–3000 μm ATP using a stopped-flow apparatus, and the acto-ATM1-MD dissociation was monitored by the increase in pyrene fluorescence (Fig. 4) (78). The values of K′1 and k′+2 were obtained by fitting the data to K′1k′+2 [ATP]/(1+ K1′[ATP]). The values of 1/K′1 and k′+2 were 450 ± 70 μm and 620 ± 40 s−1, respectively (Fig. 4 and Table 4). The acto-ATM1-MD dissociation rate in the presence of a physiological concentration of ATP (2 mm) was ∼500 s−1, which is extremely fast to explain the slow actin-sliding velocity of ATM1 (see “Discussion”).
FIGURE 4.
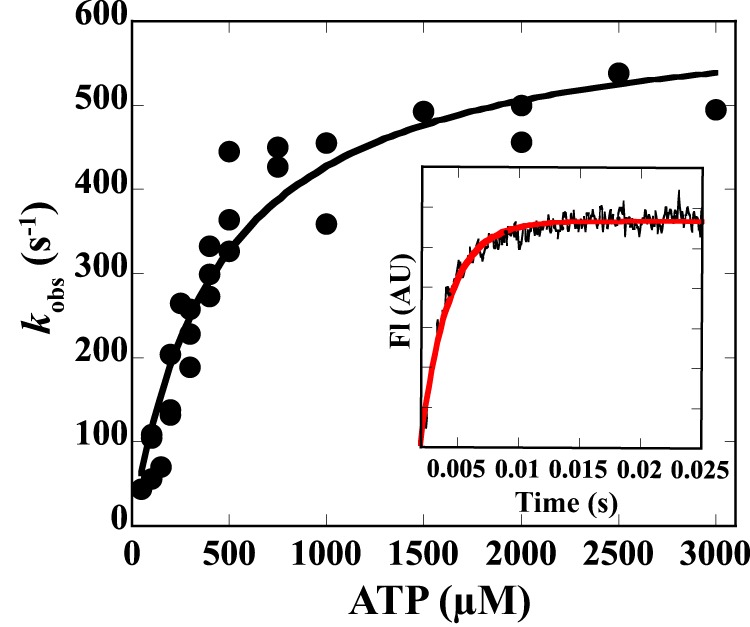
ATP-induced dissociation of the pyrene·acto-ATM1 complex. The observed rate constant of ATP-induced dissociation of the acto-ATM1-MD complex (kobs) was plotted against ATP concentrations. Values of K′1and k′+2 were obtained by fitting the data to K′1k′+2[ATP]/(1 + K′1[ATP]). The values of 1/K′1 and k′+2 were 450 ± 70 μm and 620 ± 40 s−1. The values after ± indicate S.D. of the regression curves. Inset, pyrene-acto-ATM1-MD (0.5 μm) was mixed with 500 μm ATP final concentration. The transient is the average of nine separate recordings, and the red line is a single exponential fit, which yielded a rate constant of 445 s−1. AU, arbitrary units.
TABLE 4.
Summary of kinetic and equilibrium constants for actin-activated ATPase of ATM1
All experiments were done using ATM1-MD at 50 mm ionic strength except that K8 was measured in 170 mm at ionic strength.
| Parameter | Value | Signal |
|---|---|---|
| ATP binding | ||
| K′1k′+2 (μm−1 s−1) | 1.4 ± 0.1a | Pyrene-actin |
| k′+2 (s−1) | 620 ± 40a | Pyrene-actin |
| 1/K′1 (μm) | 450 ± 70a | Pyrene-actin |
| ADP binding | ||
| k′+5 fast (s−1) | 5.4 ± 0.4b | mant-ADP |
| 4.7 ± 0.3c | Pyrene-actin | |
| k′+5 slow (s−1) | 0.35 ± 0.12b | mant-ADP |
| 0.46 ± 0.06c | Pyrene-actin | |
| k′+5 fast (μm−1 s−1) | 1.6 ± 0.11d | mant-ADP |
| k′+5 slow (s−1) | 3.0 ± 0.5d | mant-ADP |
| K′5 overall (μm) | 0.36 | Calculated from K′5 fast and k′5 slow |
| k+5 fast (s−1) | 2.4 ± 0.1e | mant-ADP |
| k+5 slow (s−1) | 0.16 ± 0.03e | mant-ADP |
| k−5 fast (μm−1 s−1) | 2.3 ± 0.11f | mant-ADP |
| k−5 slow (s−1) | 5.3 ± 1.4f | mant-ADP |
| K5 overall (μm) | 0.029 | Calculated from K5 fast and K5 slow |
| Actin binding | ||
| k−6 (μm−1 s−1) | 8.0 ± 0.6g | Pyrene-actin |
| k+6 (s−1) | 0.0057 ± 0.001g | Pyrene-actin |
| K6 (nm) | 0.66 | Calculated from k−6 and k+6 |
| K8 (μm) | 4.5 ± 0.7h | Actin co-sedimentation |
| Thermodynamic coupling between ADP and Actin binding | ||
| k′+5 fast/k+5 fast | 2.3 | Calculated |
ADP Dissociation from Acto-ATM1
The rate of ADP dissociation from acto-ATM1-MD was determined by measuring the decrease in the fluorescence intensity of mant3-ADP (28, 32, 33, 75). Time course of fluorescence change followed a double exponential with fast (k′+5, fast, 5.4 ± 0.4 s−1) and slow (k′+5, slow, 0.35 ± 0.12 s−1) rate constants in the presence of 1.8 mm free [Mg2+] (Fig. 5A and Tables 2 and 4). The relative amplitudes of the fast and slow phases were 82 ± 2 and 18 ± 2%, respectively. When pyrene-actin fluorescence was used to determine the ADP dissociation rate, similar double exponentials were observed (fast: k′+5, fast, 4.7 ± 0.3 s−1, relative amplitude of 75 ± 1%; slow: k′+5, slow, 0.46 ± 0.06 s−1, relative amplitude of 25 ± 1%; Tables 2 and 4). These results show that there are two acto-myosin-ADP states in ATM1. In animal, slow myosins such as myosin III, V, and VII, similar two actomyosin-ADP states were reported (29, 35, 54, 55, 79). In these studies, it is proposed that two states in the active site, namely open and closed pockets, are in equilibrium. According to these studies, we interpret our results as follows: k′+5, fast and k′+5, slow exhibit ADP dissociation rates from the open and closed pockets, respectively. k′+5, slow was much slower than the actin-activated Vmax value (4.1 s−1, Table 1). Because no transition on the main pathway can be slower than the transition that limits the overall ATPase cycle, it is more likely that the slow transition is indicative of a branched or a parallel pathway (Scheme 3).
FIGURE 5.
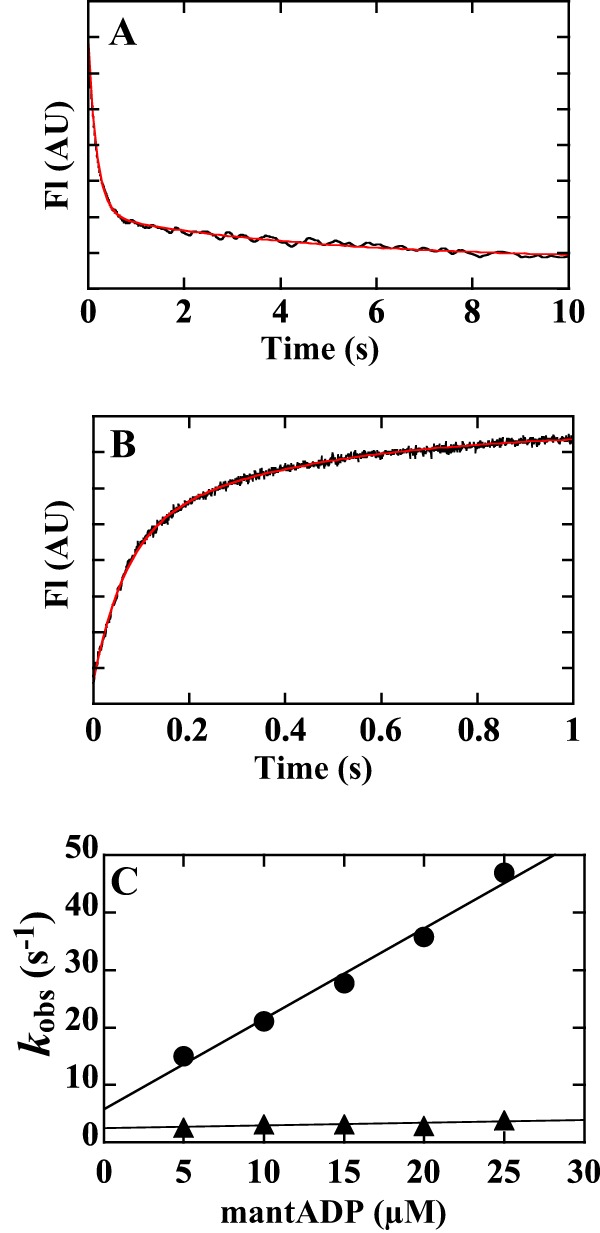
Mant-ADP binding to and dissociation from acto-ATM1. A, rate of dissociation of mant-ADP from acto-ATM1-MD in the presence of 1.8 mm free [Mg2+]. A mixture of 0.2 μm ATM1-MD, 5 μm actin, and 5 μm mant-ADP was mixed with 2 mm ATP (final concentration). The dissociation of mant-ADP from acto-ATM1-MD was measured using fluorescence energy transfer between tryptophans of ATM1-MD and mant-ADP. The transient is the average of eight separate recordings, and the red line is a double exponential fit, which yielded rate constants of 5.7 s−1 (k′+5, fast, relative amplitude of 80%) and 0.22 s−1 (k′+5, slow, relative amplitude of 20%) in the example shown. The averaged values from five independent assays (mean ± S.D.) were as follows: fast phase: k′+5, fast, 5.4 ± 0.4 s−1, relative amplitude of 82 ± 2%; slow phase: k′+5, slow, 0.35 ± 0.12 s−1, relative amplitude of 18 ± 2%). B, rate of mant-ADP binding to acto-ATM1-MD in the presence of 1.8 mm free [Mg2+]. 5 μm mant-ADP was mixed with 0.2 μm ATM1-MD and 5 μm phalloidin-labeled actin (final concentration). The transient is the average of nine separate recordings, and the red line is a double exponential fit, which yielded a rate constant = 15.0 s−1 (fast phase: relative amplitude of 59%) and 2.6 s−1 (slow phase: relative amplitude of 41%). C, observed fast and slow rate constants of mant-ADP binding to acto-ATM1-MD (kobs) were plotted against mant-ADP concentrations. 5–25 μm mant-ADP was mixed with 0.2 μm ATM1-MD and 5 μm phalloidin-labeled actin (final concentration). The slope of a linear fit of the fast rate constants gave a value for k′+5, fast of 1.6 ± 0.11 μm−1 s−1. The value after ± indicates S.D. of the regression line. AU, arbitrary units.
TABLE 2.
Free Mg2+ dependence of ADP dissociation rates from acto-ATM1
ADP dissociation rates from acto-ATM1-MD were measured using mant-ADP or pyrene-actin fluorescence at free Mg2+ concentrations of 0.17, 0.46, and 1.8 mm. Time course of fluorescence change followed a double exponential with fast (k′+5, fast) and slow (k′+5, slow) rate constants.
| Free Mg2+ | Fast |
Slow |
Signal | ||
|---|---|---|---|---|---|
| k′+5, fast | Amplitudea | k′+5, slow | Amplitudea | ||
| mm | s−1 | % | s−1 | % | |
| 1.8 | 5.4 ± 0.4 | 82 ± 2 | 0.35 ± 0.12 | 18 ± 2 | mant-ADP |
| 4.7 ± 0.3 | 75 ± 1 | 0.46 ± 0.06 | 25 ± 1 | Pyrene-actin | |
| 5.1 | 79 | 0.41 | 21 | Averageb | |
| 0.46 | 8.9 ± 0.7 | 88 ± 1 | 0.7 ± 0.1 | 12 ± 1 | mant-ADP |
| 7.0 ± 0.5 | 80 ± 2 | 0.54 ± 0.04 | 20 ± 2 | Pyrene-actin | |
| 8.0 | 84 | 0.62 | 16 | Average | |
| 0.17 | 11 ± 0.2 | 88 ± 1 | 0.90 ± 0.2 | 12 ± 1 | mant-ADP |
| 10 ± 1.4 | 83 ± 1 | 0.50 ± 0.1 | 17 ± 1 | Pyrene-actin | |
| 10.5 | 86 | 0.70 | 14 | Average | |
Mean ± standard deviation of 3–4 independent measurements from two independent protein preparations.
a Relative amplitude of k+5´fast and k+5´slow, respectively.
b Average of values from mant-ADP and pyrene-actin.
SCHEME 3.

The k′+5, fast value is similar to k′+5 for animal slow myosins (28, 33, 34) and most probably explains the slow actin-sliding velocity of ATM1 (see under “Discussion”). The value of k′+5, fast is nearly equal to the Vmax value of the actin-activated ATPase (4.1 s−1; Fig. 2, 1.8 mm free [Mg2+]), indicating that most of the actin-activated ATPase cycle is occupied with the strong binding state (primarily, acto-myosin·ADP state) and that ATM1 is a high duty ratio myosin.
Effect of Free [Mg2+] on ADP Dissociation from Acto-ATM1
We subsequently investigated the dependence of ADP dissociation rate from acto-ATM1-MD (k′+5) on free [Mg2+] because the actin-sliding velocity and actin-activated ATPase activity of ATM1 were significantly affected by free [Mg2+], and the rate-limiting step of these were ADP dissociations from acto-ATM1 as mentioned above. The value of k′+5, particularly that of k′+5, fast, depended strongly on free [Mg2+] (Table 2). The values of k′+5, fast in the presence of 0.17 and 0.46 mm free [Mg2+] were higher by factors of 2.1 and 1.6, respectively, than in the presence of 1.8 mm free [Mg2+]. These results indicate that free [Mg2+]-dependent modulation of the actin-sliding velocity and actin-activated ATPase activity of ATM1 is driven by free [Mg2+]-dependent modulation of ADP dissociation from acto-ATM1.
ADP Binding to Acto-ATM1
The rate of mant-ADP binding to acto-ATM1-MD was biphasic with observed fast and slow rate constants (Fig. 5B), consistent with the two acto-myosin·ADP states described above. The observed fast rate constants depended linearly on mant-ADP concentrations. The association rate constant of ADP with acto-ATM1-MD of the fast phase (k′−5, fast) was 1.6 ± 0.11 μm−1 s−1 (Fig. 5C and Table 4). The observed slow rate constants were almost independent of mant-ADP concentrations in the concentration range measured (5–25 μm) and were 3.0 ± 0.5 s−1 (Fig. 5C, k′−5, slow). The relative amplitudes of each fast and slow phase were similar at every mant-ADP concentration, and the average values were 49 ± 5 and 51 ± 5% for fast and slow phases, respectively.
The equilibrium dissociation constant for ADP binding to acto-ATM1 of the slow phase (K′5, slow) is calculated as k′+5, slow/k′−5, slow and is 0.12 (0.35/3.0 s−1). The equilibrium dissociation constant for ADP binding to acto-ATM1 of the fast phase (K′5, fast) is calculated as k′+5, fast/k′−5, fast and is 3.4 μm (5.4/1.6 μm−1 s−1). The overall equilibrium dissociation constant for ADP binding to acto-ATM1 (K′5, overall) is calculated as K′5, fast(K5′slow/(1 + K′5, slow)) (35, 55) and is 0.36 μm (Table 4). This value is similar to that of animal myosin Va (28) and is one of the lowest among all myosins, showing the high affinity of acto-ATM1 for ADP.
ADP Dissociation from ATM1
Kinetic parameters in the absence of actin were also measured. The rate of ADP dissociation from ATM1-MD was determined by measuring the decrease in fluorescence intensity of mant-ADP and followed by a double exponential with fast (k′+5, fast, 2.4 ± 0.1 s−1) and slow (k′+5, slow, 0.16 ± 0.03 s−1) rate constants in the presence of 1.8 mm free [Mg2+] (Fig. 6A and Tables 3 and 4). The relative amplitudes of fast and slow phases were 65 ± 4 and 36 ± 4%, respectively. Similar to the ADP dissociation rate from acto-ATM1-MD, the dissociation rate of ADP from ATM1-MD was also dependent on free [Mg2+] concentrations (Table 3).
FIGURE 6.
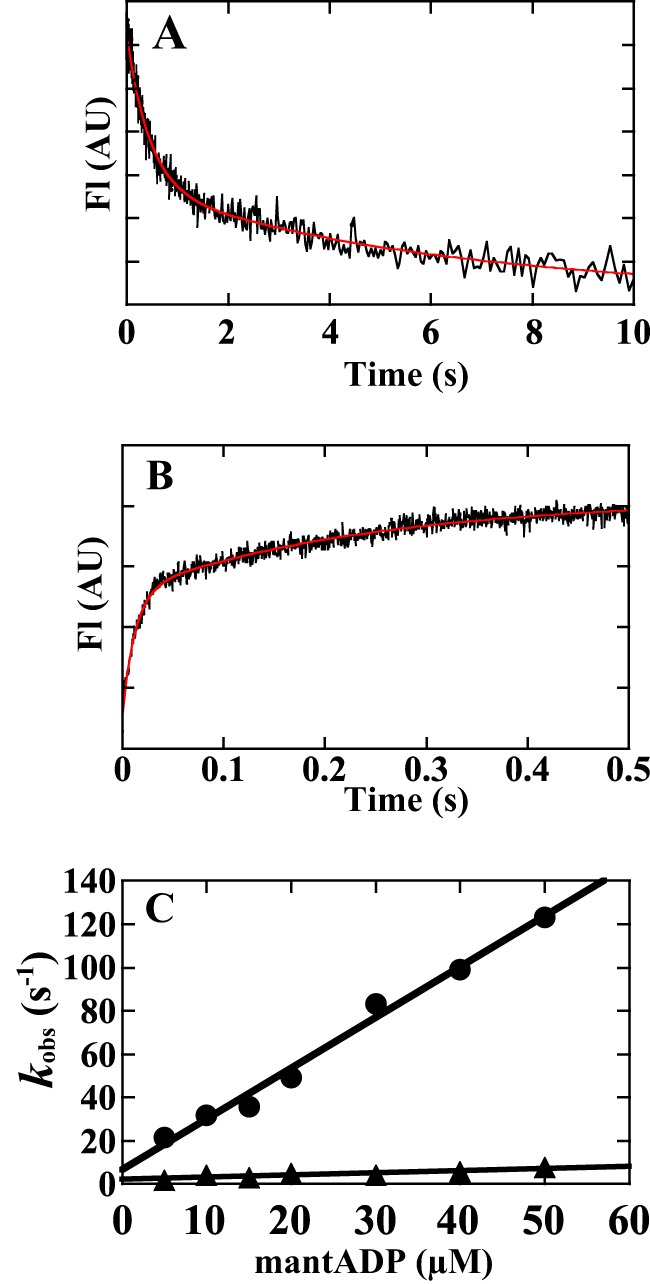
mant-ADP binding to and dissociation from ATM1. A, rate of mant-ADP dissociation from ATM1-MD in the presence of 1.8 mm free [Mg2+]. 0.1 μm ATM1-MD and 5 μm mant-ADP were mixed with 2 mm ATP (final concentration). The reaction of mant-ADP dissociation from ATM1-MD was measured using fluorescence energy transfer between the tryptophans of ATM1-MD and mant-ADP. The transient is the average of nine separate recordings, and the red line is a double exponential fit, which yielded rate constants of 2.3 ± 0.11 s−1 (k+5 fast, relative amplitude of 57%) and 0.17 s−1 (k+5 slow, relative amplitude of 44%) in the example shown. The averaged values from four independent assays were as follows: fast phase: k+5 fast, 2.4 ± 0.1 s−1, relative amplitude of 65 ± 4%; slow phase: k+5 slow: 0.16 ± 0.03 s−1, relative amplitude of 36 ± 4%). B, rate of mant-ADP binding to ATM1-MD in the presence of 1.8 mm free [Mg2+]. 30 μm mant-ADP was mixed with 0.2 μm ATM1-MD (final concentration). The transient is the average of five separate recordings, and the red line is a double exponential fit, which gave rate constants of 83 s−1 (fast phase: relative amplitude of 58%) and 4.2 s−1 (slow phase: relative amplitude of 42%). C, observed fast and slow rate constants of mant-ADP binding toATM1-MD (kobs) were plotted against mant-ADP concentrations. 10–50 μm mant-ADP was mixed with 0.2 μm ATM1-MD (final concentration). The slope of a linear fit of the fast rate constants gave a value for k−5 fast of 2.3 ± 0.11 μm−1 s−1. The value after ± indicates S.D. of the regression line. AU, arbitrary units.
TABLE 3.
Free Mg2+ dependence of ADP dissociation rates from ATM1
ADP dissociation rates from ATM1-MD were measured using mant-ADP at free Mg2+ concentrations of 0.17, 0.46, and 1.8 mm. Time course of fluorescence change followed a double exponential with fast (k+5 fast) and slow (k+5 slow) rate constants. Mean ± S.D. of 3–4 independent measurements from two independent protein preparations.
| Free Mg2+ | Fast |
Slow |
||
|---|---|---|---|---|
| k+5 fast | Amplitudea | k+5 slow | Amplitudea | |
| mm | s−1 | % | s−1 | % |
| 1.8 | 2.4 ± 0.1 | 65 ± 4 | 0.16 ± 0.03 | 35 ± 4 |
| 0.46 | 3.2 ± 0.5 | 68 ± 3 | 0.23 ± 0.06 | 32 ± 3 |
| 0.17 | 3.5 ± 0.2 | 73 ± 10 | 0.24 ± 0.04 | 27 ± 10 |
a Relative amplitude of k+5 fast and k+5 slow, respectively.
ADP Binding to ATM1
The rate of ADP binding to ATM1-MD was monitored using mant-ADP. The time courses of reactions were biphasic with observed fast and slow rate constants (Fig. 6B). The observed fast rate constants linearly depended on mant-ADP concentrations. The association rate constant of ADP with ATM1-MD of the fast phase (k′−5, fast) was 2.3 ± 0.11 μm−1 s−1 (Fig. 6C and Table 4). The observed slow rate constants (k′−5, slow) were almost independent of mant-ADP concentrations in the concentration range measured (10–50 μm) and were 5.3 ± 1.4 s−1 (Fig. 6C and Table 4). The relative amplitudes of each fast and slow phase were almost the same at every mant-ADP concentration, and the average values were 59 ± 5 and 41 ± 5% for fast and slow phases, respectively.
The equilibrium dissociation constant for ADP binding to ATM1 of the slow phase (K5 slow) is calculated as k+5 slow/k−5 slow and is 0.03 (0.16/5.3 s−1). The equilibrium dissociation constant for ADP binding to ATM1 of the fast phase (K5 fast) is calculated as k+5 fast/k−5 fast and is 1.0 μm (2.4/2.3 μm−1 s−1). The overall equilibrium dissociation constant for ADP binding to ATM1 (K5 overall) is calculated as K5 fast(K5 slow/(1 + K5 slow)) (35, 55) and is 0.029 μm (Table 4).
Actin-ATM1 Interaction in the Presence of ATP
To determine the affinity of ATM1 for actin in the presence of ATP, actin co-sedimentation assays (29) were performed under physiological ionic conditions. Fig. 7 shows the fraction of ATM1-MD bound to actin as a function of actin concentration. The data were fit to a hyperbola to determine the actin affinity in the presence of ATP. The equilibrium dissociation constant for actin binding to ATM1 in the presence of ATP (K8) was 4.5 ± 0.7 μm (Table 4). This value is similar to that of animal myosin III (29), which is known to have high affinity for actin. The maximum percentage bound to actin was 90 ± 4.5%, showing that ATM1 is a high duty ratio (∼90%) myosin.
FIGURE 7.
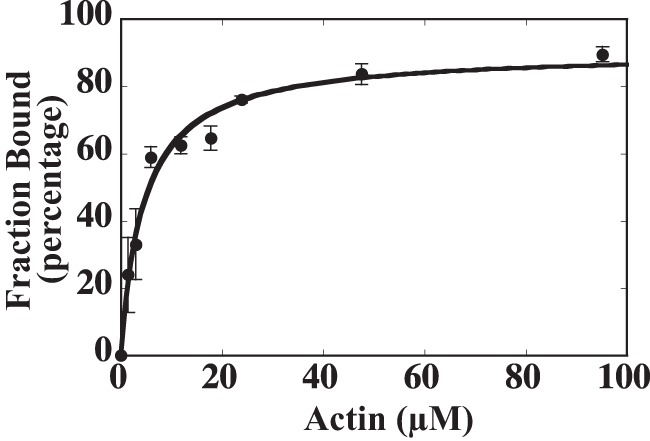
Affinity of ATM1 for actin in the presence of ATP. The affinity of ATM1-MD for actin filament was measured using the actin co-sedimentation assay. 1 μm ATM1-MD was equilibrated in the presence of various concentrations of actin, 2 mm ATP, and the ATP regeneration system, and the reaction mixture was subsequently centrifuged at 25 °C. The fraction of ATM1-MD bound to actin was quantified by performing densitometry on Coomassie-stained gels following SDS-PAGE. The plot of the fraction bound (closed circles) as a function of actin concentration was fit to a hyperbola to determine the affinity for actin (K8 of 4.5 ± 0.7 μm). The value after ± indicates S.D. of the regression curve.
Actin-ATM1 Interaction in the Absence of ATP
The affinity of ATM1 for actin in the absence of ATP (strong binding state) was measured using pyrene-actin (29, 75). The transients were fit to a single exponential function at each actin concentration (Fig. 8A, inset). The association rate constant linearly increased with actin concentration to yield the second-order rate constant (k−6) of 8.0 ± 0.6 μm−1 s−1 (Fig. 8A and Table 4). The intercept of Fig. 8A yields the acto-ATM1-MD dissociation rate constants (k+6) but is subject to a large uncertainty when it is low (34, 35), so dissociation was measured directly by competition with unlabeled actin filaments (Fig. 8B). The observed rates were fit to a single exponential function, which yielded a rate constant of 0.0057 ± 0.001 s−1 of k+6 (Fig. 8B and Table 4). The equilibrium dissociation constant for actin binding to ATM1 in the absence of ATP (K6) is calculated as k+6/k−6 and is 0.66 nm (0.0057 s−1/8.6 μm−1 s−1, Table 4). This value is lower by a factor of 50 than that of animal skeletal myosin II (80) and by a factor of 10 than that of animal myosins III and VII that are known to have high affinity for actin (29, 35, 75, 81). This indicates that ATM1 binds actin with very high affinity in the strong binding state.
FIGURE 8.
Actin binding to and dissociation from ATM1 in the absence of ATP. A, observed rate constants of the actin binding to ATM1-MD (kobs) were plotted against pyrene-actin concentrations. The concentration of ATM1-MD was kept at one-fifth of the pyrene-actin concentration. Linear fits to the data sets yielded second-order actin binding rate constants of 8.0 ± 0.6 μm−1 s−1 (k−6). The value after ± indicates S.D. of the regression line. Inset, 0.4 μm ATM1-MD was mixed with 2 μm pyrene-actin (in final concentration). The transient is the average of eight separate recordings, and the red line is a single exponential fit, which yielded a rate a constants of 18.4 s−1. AU, arbitrary units. B, rate of the dissociation of acto-ATM1. 0.2 μm pyrene-ATM1-MD was mixed with 5 μm unlabeled actin in the absence ATP (final concentration). The red line is a single exponential fit, which yielded a rate constant of 0.0048 s−1 in the example shown. The averaged values from eight independent assays was 0.0057 ± 0.001 s−1.
Expression Pattern of ATM1 in Arabidopsis
To determine the tissue-specific expression of ATM1, we created a transgenic Arabidopsis plant that expressed a GUS fusion protein under the transcriptional control of the ATM1 promoter. GUS staining indicated that ATM1 was abundantly expressed in seedlings, apices of shoots, shoots, and flowers (Fig. 9, A–D) but not in pollen (Fig. 9E).
FIGURE 9.

Promoter-reporter assay of ATM1 expression. The cDNA for β-glucuronidase was ligated in-frame to the coding region of ATM1 and introduced into Arabidopsis. The protein was expressed throughout Arabidopsis plants. A, 7-day-old seedling. B, apices of shoot of 7-day-old seedling. Scale bar, 0.2 mm. C, apices of the root of a 7-day-old seedling. Scale bar, 0.1 mm. D, shoots and flowers of a 30-day-old plant. Scale bar, 2 mm. E, male and female gamete tissues of a 30-day-old plant. Scale bar, 0.2 mm.
Localization of ATM1 in Arabidopsis
In earlier studies using an antibody against a peptide corresponding to a tail domain of ATM1, it was suggested that ATM1 is localized to the plasmodesmata and newly formed cell walls in root cells of maize and Arabidopsis (22). The same antibody was used to show the localization of ATM1 on plastid (82). Moreover, when the GFP-fused tail domain of ATM1 was expressed in Arabidopsis, it was localized to the plasma membrane and plasmodesmata (23, 83). To obtain accurate information about the localization of ATM1, we used GFP-fused full-length ATM1 (GFP-ATM1) in this study because tail domain expression sometimes acts as a dominant negative, leading to artifactual localization (84). First, GFP-ATM1 was transiently expressed in protoplasts of cultured Arabidopsis cells and was observed using a high speed confocal laser scanning microscope (Fig. 10, A–C). Fluorescent dots were observed at the cell cortex (Fig. 10, A and B), similar to the results of previous studies using the GFP-fused tail domain of ATM1 (23). However, in contrast to other studies, punctate structures were present on filamentous structures such as actin bundles (Fig. 10B). To ascertain that this structure was formed by F-actin, Lifeact-TagRFP was expressed together with GFP-ATM1. ATM1 was co-localized with Lifeact-TagRFP at the cell cortex (Fig. 10C), indicating that ATM1 associated with F-actin at the cell cortex. Live imaging showed little movement of the dots on F-actin (supplemental Movie S1). This is consistent with the results of the in vitro actin-gliding assays, which showed that ATM1 is an extremely slow myosin (Fig. 3).
FIGURE 10.
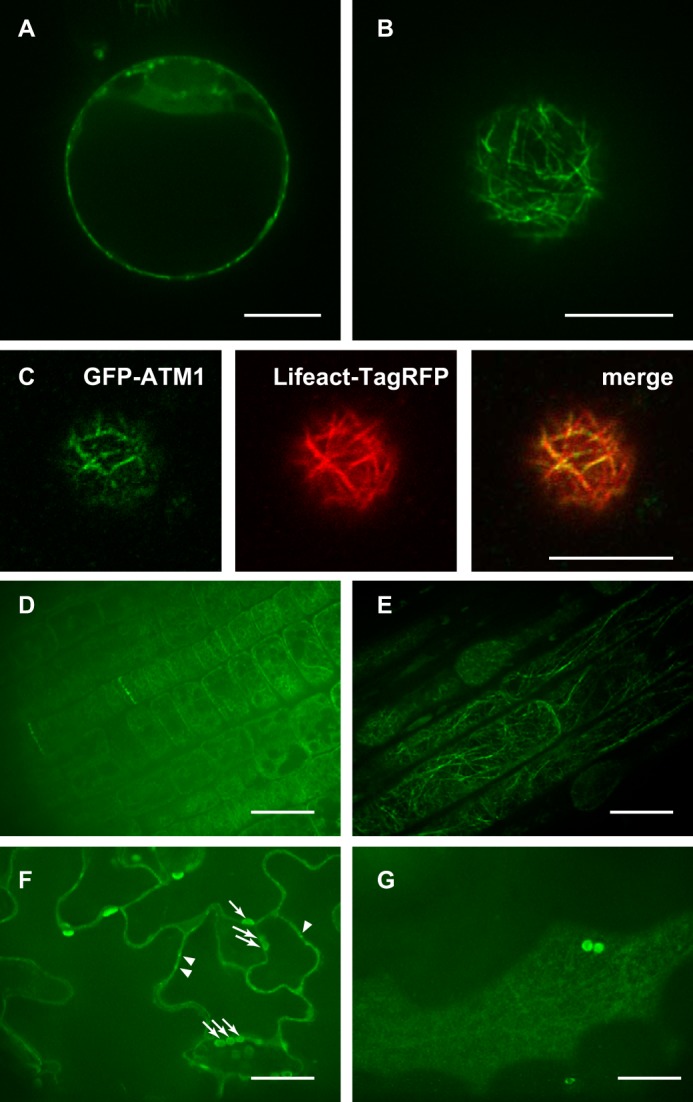
Subcellular localization of GFP-ATM1 in protoplasts and Arabidopsis plants. A–C, GFP fused to the N terminus of full-length ATM1 was transiently expressed in protoplasts prepared from suspension cultures of Arabidopsis cells. A, focusing on the center of the cell. B, focusing on subcortical region of the cell. C, co-expression of GFP-ATM1 and Lifeact-TagRFP shows that ATM1 is co-localized with actin. D–G, GFP fused to the N terminus of full-length ATM1 was expressed under the control of the native promoter of ATM1 in Arabidopsis plants. D, epidermal cells of root apical meristems. ATM1 is localized on the newly forming cell plate. E, epidermal cells in a growing root. ATM1 is localized at the filamentous structures. F, epidermal cells of the cotyledon. Focusing on middle of the cells. ATM1 is localized as dots at the cell cortex that border neighboring cells and organelles. G, epidermal cells of the cotyledon. Focusing on subcortical region of the cell. ATM1 is localized at the filamentous structures. A–G, scale bars, 10 μm.
Next, GFP-ATM1 was expressed in Arabidopsis plants (Fig. 10, D–G). To avoid artifacts arising from differences in expression level and pattern, a construct expressing GFP-ATM1 under the control of the native ATM1 promoter was transformed into an Arabidopsis ATM1-knock-out mutant (atm1). Fig. 10D shows the expression of GFP-ATM1 in epidermal cells of root tip meristems. GFP-ATM1 was localized to newly formed cell plates, consistent with another study (22). In a growing elongating zone of epidermal cells, GFP-ATM1 was observed as fluorescent dots on filamentous structures (Fig. 10E) similar to protoplasts (Fig. 10B). To determine whether these filamentous structures were composed of F-actin, we treated cells with cytoskeletal inhibitors. The filamentous structures did not form in the presence of latrunculin B (Fig. 11B) but persisted when the cells were exposed to oryzalin (Fig. 11A). These data confirm that the filamentous structures consisted of F-actin. Live imaging showed little movement of the fluorescent ATM1 dots on F-actin (supplemental Movie S2), consistent with the results of the in vitro actin-gliding assays. The expression of GFP-ATM1 in epidermal cells of cotyledons is shown in Fig. 10, F and G. Focusing on the center of the cell, ATM1 was localized to the punctate structures on plasma membranes that border neighboring cells (Fig. 10F, arrowheads), supporting an earlier observation that an anti-ATM1 antibody stains the plasmodesmata (85). ATM1 was also localized to structures presumed to be plastids (Fig. 10F, arrows), consistent with the results of a published study (82). Focusing on the subcortical region of the cell (Fig. 10G), ATM1 was observed at filamentous structures, most likely F-actin.
FIGURE 11.
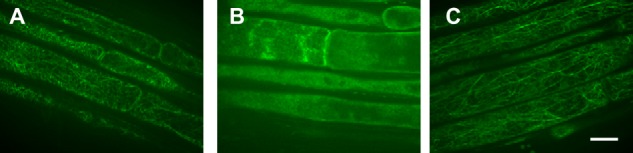
Effects of cytoskeletal inhibitors on ATM1 localization in epidermal cells in growing roots. A, treatment with 10 μm oryzalin. B, 2 μm latrunculin. C, 0.1% DMSO (control). Scale bar, 0.1 mm. Filamentous localization of ATM1 disappeared when treated with the actin-depolymerizing reagent, latrunculin B (B) but were present following treatment with Oryzalin, a microtubule depolymerizing reagent (A).
DISCUSSION
ATM1 Exhibits Low Enzymatic Activity and High Affinity for Actin
In this study, we reported the first analysis of the enzymatic properties of plant-specific class VIII myosin. We showed that actin-sliding velocity (Fig. 3) and actin-activated ATPase activity of Arabidopsis class VIII myosin, ATM1 (Fig. 2), were lower by a factor of 10–100 compared with those of class plant-specific XI myosins (15, 17, 18) and were similar to those of animal slow myosins (30, 51, 52). The affinity of ATM1 for actin was very high both in the presence (Fig. 7) and absence (Fig. 8) of ATP. However, it must be noted that the kinetics might be different due to phosphorylation or other post-translational modifications to the myosin.
Slow ADP Dissociation Accounts for Low Velocity, Low Enzymatic Activity, and High Duty Ratio
The ADP dissociation rate from acto-ATM1 (k′+5, fast Fig. 5 and Table 4) was almost the same as the Vmax of the actin-activated Mg2+-ATPase activity (4.1 s−1; Fig. 2). This indicates that the acto-myosin ATPase cycle primarily exists in the AM·ADP state and that ADP release from acto-ATM1 is the rate-limiting step of actin-activated ATPase. This was also supported by actin co-sedimentation experiments, which showed that duty ratio of ATM1 was ∼90% (Fig. 7).
The dissociation rates of ADP from myosins are accelerated by actin binding, and the acceleration (k′+5/k+5) differs between myosins. The value of the acceleration for fast class XI myosin is ∼1000-fold (19) and that for slow animal myosins is only 1–10-fold (28, 33). The value for ATM1 was 2.3-fold (Table 4) showing that, similar to slow animal myosins, dissociation of ADP was not markedly influenced by actin binding.
ATM1 Has the Kinetic Properties of a Tension Sensor
We have shown in this study that ATM1 has two ADP states, open ADP pocket and closed ADP pocket. These two ADP states have been observed only in slow myosins but not fast myosins (29, 35, 54, 55, 79). Nyitrai and Geeves (86) suggested that the closed and open ADP states are in equilibrium in all myosins and that the equilibrium was dependent on the myosin types; almost all the ADP state are in the open state for fast myosins, whereas a considerable portion of ADP states are in the closed state for slow myosins. Thus two ADP states (the closed ADP pocket) can be observed only in slow myosins.
The swinging lever arm model proposes that the large free energy associated with Pi release drives the power stroke of the cross-bridge (a swing of the converter and neck of the cross-bridge) to generate force. In some slow myosins, this swing is followed by a further swing of the converter and neck of the cross-bridge in the same direction as the power stroke when ADP is released (87–89). This additional swing concomitant with ADP release has been observed only in slow myosins but not fast myosins. Geeves et al. (26) suggested that this additional swing of the neck must be complete before the ADP binding pocket opens to allow ADP to escape. Such a mechanism provides a simple, elegant way of coupling ADP release to the load on the head because the load inhibits the swing and then ADP release. Thus, slow myosins in which a considerable portion of ADP states are in the closed state have tension-bearing and tension-sensing mechanisms (86) Because ATM1 falls into this category, it presumably senses tension (strain) and functions in Arabidopsis cells. It is possible that the kinetic rates could be gated by strain in a full molecule but that future experiments are required to address this possibility.
It has been reported that ATP binding to acto-myosin follows two phases (86). So we also tried to fit the transients of ATP binding to acto-ATM1-MD with a double exponential curve. Some could be fitted, but most could not be well fitted. The uncertainty may arise from the relatively noisy signals of ATP binding to acto-ATM1-MD Although we could not observe this, it is possible that two phases exist in transients of ATP binding to acto-ATM1.
Because myosin VIII has a coiled-coil domain, it may form a dimer like myosin V. However, the number of IQ motifs of ATM1 is four, although that of myosin V and myosin XI, which are known for the processive myosins, is six. The number of IQ motifs of myosin V defines the step size (90). The processivity of myosin V is also dependent on the number of IQ motifs, and six IQ motifs are most effective for the processivity (91). Thus ATM1 may be inadequate for the processive movement. Kinetic and morphological features of ATM1 suggest a tension-sensor role over a transport protein.
Free [Mg2+] Regulates Actin Velocity and Enzymatic Activity
Mg2+ is the most abundant divalent cation in animal and plant cells and is an essential cofactor required for the metabolism of ATP and nucleic acids as well as for the catalytic activities of several cellular enzymes. [Mg2+]i is in high millimolar range, and cytosolic Mg2+ mainly exists in complexes with ATP and other molecules. Therefore, the cytoplasmic free [Mg2+] is only a small percentage of the total (92). Many studies have been conducted on measuring free [Mg2+]i in animal cells and have shown as follows: free [Mg2+]i in animal cells is cell type-specific and in the range of 0.2–2 mm (57–68); Mg2+ is not uniformly distributed within the cells and is enriched in the vicinity of negatively charged phospholipids residing in cellular and intracellular membranes, and this enriched Mg2+ is related to free Mg2+ (57); and free [Mg2+]i changes over time (63, 67–70). There is growing evidence that free [Mg2+]i provides important functions in animal cells. Recently, it has been shown that free [Mg2+]i acts as a second messenger in human T-cells (92).
Although studies on the role of free [Mg2+]i in plant cells are lacking, it was reported that the range of free [Mg2+]i is similar to that in animal cells (0.2–2 mm) (71, 72). It is probable that free [Mg2+]i play an important function in plant cells as well as animal cells. We demonstrate that free [Mg2+] regulates the velocity and ATPase activity of ATM1 within the range of physiological concentrations. Actin velocity and ATPase activity determined using 0.17 mm free [Mg2+] were higher by factors of 2 and 3, respectively, compared with those determined using 1.8 mm [Mg2+] (Figs. 2 and 3). Furthermore, we demonstrate that these effects were exerted through free [Mg2+]-dependent modulation of ADP dissociation from acto-ATM1 (Table 2). It could be that the temporal and spatial changes in free [Mg2+] regulate the intracellular functions mediated by ATM1.
Functions of ATM1 in Arabidopsis
Expression of GUS under the control of the ATM1 promoter in Arabidopsis suggests that ATM1 is abundantly expressed in seedlings, apices of shoots, shoots, and flowers but not in pollen (Fig. 9). This result suggests that ATM1 functions in all tissues during all stages of the plant's life cycle.
Earlier studies using an antibody raised against a peptide corresponding to a tail domain of ATM1 suggested that ATM1 is localized at plasmodesmata, plasma membrane of newly formed cell walls, and plastid (22, 82). This was also supported by live cell imaging using the GFP-fused tail domain of ATM1 (23, 83). In this study, we further examined the localization of ATM1 in Arabidopsis using GFP-fused full-length ATM1 (GFP-ATM1). Furthermore, to avoid artifacts arising from differences of expression levels and pattern, GFP-ATM1 was expressed using the native promoter of Arabidopsis ATM1 in an ATM1-knock-out mutant (atm1). Consistent with the studies cited above, GFP-ATM1 was localized to the plasmodesmata (Fig. 10F), plasma membrane of newly formed cell walls (Fig. 10D), and plastids (Fig. 10F). However, in contrast to other studies, we observed that ATM1 was primarily localized to F-actin at the cell cortex in several tissues (Figs. 10, F and G, and 11). This was also confirmed by analysis of protoplasts prepared from suspension cultures of Arabidopsis cells (Fig. 10, A–C). ATM1 showed little movement on F-actin at the cell cortex (supplemental Movies S1 and S2), consistent with the results of the in vitro actin gliding assays.
Taken together, our enzymatic and localization studies suggest that in Arabidopsis class VIII myosin, ATM1 functions at various intracellular structures such as cell cortex, newly formed cell wall, plasmodesmata, and plastids as a tension sensor/generator.
Supplementary Material
Acknowledgments
We thank RIKEN Bio Resource Center (Tsukuba, Japan) for providing plasmids containing full-length cDNAs of Arabidopsis ATM1 (AT3G19960) and Arabidopsis CAM3 (AT3G56800), which were developed by the plant genome project of RIKEN Genomic Sciences Center (24, 25). We also thank T. Nakagawa (Center for Integrated Research in Science, Shimane University, Japan) for providing the binary vectors. We thank Dr. T. Ueda, Dr. T. Uemura, Dr. C. Saito, Dr. H. Abe, K. Shoda, E. Furuyama, K. Fukaya, R. Kiuch, and E. Matsumoto of the Nakano Laboratory for their assistance and suggestions.
This work was supported by Japan Society for the Promotion of Science KAKENHI Grants 21570159, 20001009, and 23770060.

This article contains supplemental Movies S1 and S2.
- mant
- N-methylanthraniloyl
- Ni-NTA
- nickel-nitrilotriacetic acid.
REFERENCES
- 1. Odronitz F., Kollmar M. (2007) Drawing the tree of eukaryotic life based on the analysis of 2,269 manually annotated myosins from 328 species. Genome Biol. 8, R196. [DOI] [PMC free article] [PubMed] [Google Scholar]
- 2. Reddy A. S., Day I. S. (2001) Analysis of the myosins encoded in the recently completed Arabidopsis thaliana genome sequence. Genome Biol. 2, RESEARCH0024. [DOI] [PMC free article] [PubMed] [Google Scholar]
- 3. Tominaga M., Kimura A., Yokota E., Haraguchi T., Shimmen T., Yamamoto K., Nakano A., Ito K. (2013) Cytoplasmic streaming velocity as a plant size determinant. Dev. Cell 27, 345–352 [DOI] [PubMed] [Google Scholar]
- 4. Avisar D., Prokhnevsky A. I., Makarova K. S., Koonin E. V., Dolja V. V. (2008) Myosin XI-K is required for rapid trafficking of Golgi stacks, peroxisomes, and mitochondria in leaf cells of Nicotiana benthamiana. Plant Physiol. 146, 1098–1108 [DOI] [PMC free article] [PubMed] [Google Scholar]
- 5. Hashimoto K., Igarashi H., Mano S., Nishimura M., Shimmen T., Yokota E. (2005) Peroxisomal localization of a myosin XI isoform in Arabidopsis thaliana. Plant Cell Physiol. 46, 782–789 [DOI] [PubMed] [Google Scholar]
- 6. Li J. F., Nebenführ A. (2007) Organelle targeting of myosin XI is mediated by two globular tail subdomains with separate cargo binding sites. J. Biol. Chem. 282, 20593–20602 [DOI] [PubMed] [Google Scholar]
- 7. Reisen D., Hanson M. R. (2007) Association of six YFP-myosin XI-tail fusions with mobile plant cell organelles. BMC Plant Biol. 7, 6. [DOI] [PMC free article] [PubMed] [Google Scholar]
- 8. Avisar D., Abu-Abied M., Belausov E., Sadot E., Hawes C., Sparkes I. A. (2009) A comparative study of the involvement of 17 Arabidopsis myosin family members on the motility of Golgi and other organelles. Plant Physiol. 150, 700–709 [DOI] [PMC free article] [PubMed] [Google Scholar]
- 9. Peremyslov V. V., Mockler T. C., Filichkin S. A., Fox S. E., Jaiswal P., Makarova K. S., Koonin E. V., Dolja V. V. (2011) Expression, splicing, and evolution of the myosin gene family in plants. Plant Physiol. 155, 1191–1204 [DOI] [PMC free article] [PubMed] [Google Scholar]
- 10. Prokhnevsky A. I., Peremyslov V. V., Dolja V. V. (2008) Overlapping functions of the four class XI myosins in Arabidopsis growth, root hair elongation, and organelle motility. Proc. Natl. Acad. Sci. U.S.A. 105, 19744–19749 [DOI] [PMC free article] [PubMed] [Google Scholar]
- 11. Sparkes I. (2011) Recent advances in understanding plant myosin function: life in the fast lane. Mol. Plant 4, 805–812 [DOI] [PubMed] [Google Scholar]
- 12. Ueda H., Yokota E., Kutsuna N., Shimada T., Tamura K., Shimmen T., Hasezawa S., Dolja V. V., Hara-Nishimura I. (2010) Myosin-dependent endoplasmic reticulum motility and F-actin organization in plant cells. Proc. Natl. Acad. Sci. U.S.A. 107, 6894–6899 [DOI] [PMC free article] [PubMed] [Google Scholar]
- 13. Ojangu E. L., Järve K., Paves H., Truve E. (2007) Arabidopsis thaliana myosin XIK is involved in root hair as well as trichome morphogenesis on stems and leaves. Protoplasma 230, 193–202 [DOI] [PubMed] [Google Scholar]
- 14. Yokota E., Shimmen T. (1994) Isolation and characterization of plant myosin from pollen tubes of lily. Protoplasma 177, 153–162 [Google Scholar]
- 15. Tominaga M., Kojima H., Yokota E., Orii H., Nakamori R., Katayama E., Anson M., Shimmen T., Oiwa K. (2003) Higher plant myosin XI moves processively on actin with 35 nm steps at high velocity. EMBO J. 22, 1263–1272 [DOI] [PMC free article] [PubMed] [Google Scholar]
- 16. Yamamoto K., Kikuyama M., Sutoh-Yamamoto N., Kamitsubo E. (1994) Purification of actin based motor protein from Chara corallina. Proc. Jpn. Acad. 70, 175–180 [Google Scholar]
- 17. Hachikubo Y., Ito K., Schiefelbein J., Manstein D. J., Yamamoto K. (2007) Enzymatic activity and motility of recombinant Arabidopsis myosin XI, MYA1. Plant Cell Physiol. 48, 886–891 [DOI] [PubMed] [Google Scholar]
- 18. Ito K., Kashiyama T., Shimada K., Yamaguchi A., Awata Jy, Hachikubo Y., Manstein D. J., Yamamoto K. (2003) Recombinant motor domain constructs of Chara corallina myosin display fast motility and high ATPase activity. Biochem. Biophys. Res. Commun. 312, 958–964 [DOI] [PubMed] [Google Scholar]
- 19. Ito K., Ikebe M., Kashiyama T., Mogami T., Kon T., Yamamoto K. (2007) Kinetic mechanism of the fastest motor protein, Chara myosin. J. Biol. Chem. 282, 19534–19545 [DOI] [PubMed] [Google Scholar]
- 20. Ito K., Yamaguchi Y., Yanase K., Ichikawa Y., Yamamoto K. (2009) Unique charge distribution in surface loops confers high velocity on the fast motor protein Chara myosin. Proc. Natl. Acad. Sci. U.S.A. 106, 21585–21590 [DOI] [PMC free article] [PubMed] [Google Scholar]
- 21. Knight A. E., Kendrick-Jones J. (1993) A myosin-like protein from a higher plant. J. Mol. Biol. 231, 148–154 [DOI] [PubMed] [Google Scholar]
- 22. Reichelt S., Knight A. E., Hodge T. P., Baluska F., Samaj J., Volkmann D., Kendrick-Jones J. (1999) Characterization of the unconventional myosin VIII in plant cells and its localization at the post-cytokinetic cell wall. Plant J. 19, 555–567 [DOI] [PubMed] [Google Scholar]
- 23. Golomb L., Abu-Abied M., Belausov E., Sadot E. (2008) Different subcellular localizations and functions of Arabidopsis myosin VIII. BMC Plant Biol. 8, 3. [DOI] [PMC free article] [PubMed] [Google Scholar]
- 24. Seki M., Carninci P., Nishiyama Y., Hayashizaki Y., Shinozaki K. (1998) High-efficiency cloning of Arabidopsis full-length cDNA by biotinylated CAP trapper. Plant J. 15, 707–720 [DOI] [PubMed] [Google Scholar]
- 25. Seki M., Narusaka M., Kamiya A., Ishida J., Satou M., Sakurai T., Nakajima M., Enju A., Akiyama K., Oono Y., Muramatsu M., Hayashizaki Y., Kawai J., Carninci P., Itoh M., Ishii Y., Arakawa T., Shibata K., Shinagawa A., Shinozaki K. (2002) Functional annotation of a full-length Arabidopsis cDNA collection. Science 296, 141–145 [DOI] [PubMed] [Google Scholar]
- 26. Geeves M. A., Perreault-Micale C., Coluccio L. M. (2000) Kinetic analyses of a truncated mammalian myosin I suggest a novel isomerization event preceding nucleotide binding. J. Biol. Chem. 275, 21624–21630 [DOI] [PubMed] [Google Scholar]
- 27. El Mezgueldi M., Tang N., Rosenfeld S. S., Ostap E. M. (2002) The kinetic mechanism of Myo1e (human myosin-IC). J. Biol. Chem. 277, 21514–21521 [DOI] [PubMed] [Google Scholar]
- 28. De La Cruz E. M., Wells A. L., Rosenfeld S. S., Ostap E. M., Sweeney H. L. (1999) The kinetic mechanism of myosin V. Proc. Natl. Acad. Sci. U.S.A. 96, 13726–13731 [DOI] [PMC free article] [PubMed] [Google Scholar]
- 29. Dosé A. C., Ananthanarayanan S., Moore J. E., Burnside B., Yengo C. M. (2007) Kinetic mechanism of human myosin IIIA. J. Biol. Chem. 282, 216–231 [DOI] [PubMed] [Google Scholar]
- 30. Homma K., Saito J., Ikebe R., Ikebe M. (2000) Ca2+-dependent regulation of the motor activity of myosin V. J. Biol. Chem. 275, 34766–34771 [DOI] [PubMed] [Google Scholar]
- 31. Wang F., Chen L., Arcucci O., Harvey E. V., Bowers B., Xu Y., Hammer J. A., 3rd, Sellers J. R. (2000) Effect of ADP and ionic strength on the kinetic and motile properties of recombinant mouse myosin V. J. Biol. Chem. 275, 4329–4335 [DOI] [PubMed] [Google Scholar]
- 32. Trybus K. M., Krementsova E., Freyzon Y. (1999) Kinetic characterization of a monomeric unconventional myosin V construct. J. Biol. Chem. 274, 27448–27456 [DOI] [PubMed] [Google Scholar]
- 33. De La Cruz E. M., Ostap E. M., Sweeney H. L. (2001) Kinetic mechanism and regulation of myosin VI. J. Biol. Chem. 276, 32373–32381 [DOI] [PubMed] [Google Scholar]
- 34. Yang Y., Kovács M., Xu Q., Anderson J. B., Sellers J. R. (2005) Myosin VIIB from Drosophila is a high duty ratio motor. J. Biol. Chem. 280, 32061–32068 [DOI] [PubMed] [Google Scholar]
- 35. Henn A., De La Cruz E. M. (2005) Vertebrate myosin VIIb is a high duty ratio motor adapted for generating and maintaining tension. J. Biol. Chem. 280, 39665–39676 [DOI] [PubMed] [Google Scholar]
- 36. Homma K., Ikebe M. (2005) Myosin x is a high duty ratio motor. J. Biol. Chem. 280, 29381–29391 [DOI] [PubMed] [Google Scholar]
- 37. Kovács M., Wang F., Sellers J. R. (2005) Mechanism of action of myosin X, a membrane-associated molecular motor. J. Biol. Chem. 280, 15071–15083 [DOI] [PubMed] [Google Scholar]
- 38. Inoue A., Saito J., Ikebe R., Ikebe M. (2002) Myosin IXb is a single-headed minus-end-directed processive motor. Nat. Cell Biol. 4, 302–306 [DOI] [PubMed] [Google Scholar]
- 39. Haithcock J., Billington N., Choi K., Fordham J., Sellers J. R., Stafford W. F., White H., Forgacs E. (2011) The kinetic mechanism of mouse myosin VIIA. J. Biol. Chem. 286, 8819–8828 [DOI] [PMC free article] [PubMed] [Google Scholar]
- 40. Nakagawa T., Suzuki T., Murata S., Nakamura S., Hino T., Maeo K., Tabata R., Kawai T., Tanaka K., Niwa Y., Watanabe Y., Nakamura K., Kimura T., Ishiguro S. (2007) Improved Gateway binary vectors: high-performance vectors for creation of fusion constructs in transgenic analysis of plants. Biosci. Biotechnol. Biochem. 71, 2095–2100 [DOI] [PubMed] [Google Scholar]
- 41. Tian G. W., Mohanty A., Chary S. N., Li S., Paap B., Drakakaki G., Kopec C. D., Li J., Ehrhardt D., Jackson D., Rhee S. Y., Raikhel N. V., Citovsky V. (2004) High-throughput fluorescent tagging of full-length Arabidopsis gene products in planta. Plant Physiol. 135, 25–38 [DOI] [PMC free article] [PubMed] [Google Scholar]
- 42. Kodama T., Fukui K., Kometani K. (1986) The initial phosphate burst in ATP hydrolysis by myosin and subfragment-1 as studied by a modified Malachite Green method for determination of inorganic phosphate. J. Biochem. 99, 1465–1472 [DOI] [PubMed] [Google Scholar]
- 43. Kuhlman P. A., Bagshaw C. R. (1998) ATPase kinetics of the Dictyostelium discoideum myosin II motor domain. J. Muscle Res. Cell Motil. 19, 491–504 [DOI] [PubMed] [Google Scholar]
- 44. Uyeda T. Q., Abramson P. D., Spudich J. A. (1996) The neck region of the myosin motor domain acts as a lever arm to generate movement. Proc. Natl. Acad. Sci. U.S.A. 93, 4459–4464 [DOI] [PMC free article] [PubMed] [Google Scholar]
- 45. Tsiavaliaris G., Fujita-Becker S., Dürrwang U., Diensthuber R. P., Geeves M. A., Manstein D. J. (2008) Mechanism, regulation, and functional properties of Dictyostelium myosin-1B. J. Biol. Chem. 283, 4520–4527 [DOI] [PubMed] [Google Scholar]
- 46. Ito K., Uyeda T. Q., Suzuki Y., Sutoh K., Yamamoto K. (2003) Requirement of domain-domain interaction for conformational change and functional ATP hydrolysis in myosin. J. Biol. Chem. 278, 31049–31057 [DOI] [PubMed] [Google Scholar]
- 47. Ito K., Liu X., Katayama E., Uyeda T. Q. (1999) Cooperativity between two heads of Dictyostelium myosin II in in vitro motility and ATP hydrolysis. Biophys. J. 76, 985–992 [DOI] [PMC free article] [PubMed] [Google Scholar]
- 48. Jontes J. D., Milligan R. A., Pollard T. D., Ostap E. M. (1997) Kinetic characterization of brush border myosin-I ATPase. Proc. Natl. Acad. Sci. U.S.A. 94, 14332–14337 [DOI] [PMC free article] [PubMed] [Google Scholar]
- 49. Goldstein D. A. (1979) Calculation of the concentrations of free cations and cation-ligand complexes in solutions containing multiple divalent cations and ligands. Biophys. J. 26, 235–242 [DOI] [PMC free article] [PubMed] [Google Scholar]
- 50. Mitsuda N., Hisabori T., Takeyasu K., Sato M. H. (2004) VOZ; isolation and characterization of novel vascular plant transcription factors with a one-zinc finger from Arabidopsis thaliana. Plant Cell Physiol. 45, 845–854 [DOI] [PubMed] [Google Scholar]
- 51. Yoshimura M., Homma K., Saito J., Inoue A., Ikebe R., Ikebe M. (2001) Dual regulation of mammalian myosin VI motor function. J. Biol. Chem. 276, 39600–39607 [DOI] [PubMed] [Google Scholar]
- 52. Homma K., Saito J., Ikebe R., Ikebe M. (2001) Motor function and regulation of myosin X. J. Biol. Chem. 276, 34348–34354 [DOI] [PubMed] [Google Scholar]
- 53. Fujita-Becker S., Dürrwang U., Erent M., Clark R. J., Geeves M. A., Manstein D. J. (2005) Changes in Mg2+ ion concentration and heavy chain phosphorylation regulate the motor activity of a class I myosin. J. Biol. Chem. 280, 6064–6071 [DOI] [PubMed] [Google Scholar]
- 54. Rosenfeld S. S., Houdusse A., Sweeney H. L. (2005) Magnesium regulates ADP dissociation from myosin V. J. Biol. Chem. 280, 6072–6079 [DOI] [PubMed] [Google Scholar]
- 55. Hannemann D. E., Cao W., Olivares A. O., Robblee J. P., De La Cruz E. M. (2005) Magnesium, ADP, and actin binding linkage of myosin V: evidence for multiple myosin V-ADP and actomyosin V-ADP states. Biochemistry 44, 8826–8840 [DOI] [PubMed] [Google Scholar]
- 56. Heissler S. M., Manstein D. J. (2012) Functional characterization of the human myosin-7a motor domain. Cell. Mol. Life Sci. 69, 299–311 [DOI] [PMC free article] [PubMed] [Google Scholar]
- 57. Günther T. (2006) Concentration, compartmentation and metabolic function of intracellular free Mg2+. Magnes. Res. 19, 225–236 [PubMed] [Google Scholar]
- 58. Murphy E., Freudenrich C. C., Levy L. A., London R. E., Lieberman M. (1989) Monitoring cytosolic free magnesium in cultured chicken heart cells by use of the fluorescent indicator Furaptra. Proc. Natl. Acad. Sci. U.S.A. 86, 2981–2984 [DOI] [PMC free article] [PubMed] [Google Scholar]
- 59. Raju B., Murphy E., Levy L. A., Hall R. D., London R. E. (1989) A fluorescent indicator for measuring cytosolic free magnesium. Am. J. Physiol. 256, C540–C548 [DOI] [PubMed] [Google Scholar]
- 60. Petersen A., Kristensen S. R., Jacobsen J. P., Hørder M. (1990) 31P-NMR measurements of ATP, ADP, 2,3-diphosphoglycerate and Mg2+ in human erythrocytes. Biochim. Biophys. Acta 1035, 169–174 [DOI] [PubMed] [Google Scholar]
- 61. Weghuber J., Dieterich F., Froschauer E. M., Svidovà S., Schweyen R. J. (2006) Mutational analysis of functional domains in Mrs2p, the mitochondrial Mg2+ channel protein of Saccharomyces cerevisiae. FEBS J. 273, 1198–1209 [DOI] [PubMed] [Google Scholar]
- 62. Westerblad H., Allen D. G. (1992) Myoplasmic Mg2+ concentration in Xenopus muscle fibres at rest, during fatigue and during metabolic blockade. Exp. Physiol. 77, 733–740 [DOI] [PubMed] [Google Scholar]
- 63. Okada K., Ishikawa S., Saito T. (1992) Cellular mechanisms of vasopressin and endothelin to mobilize [Mg2+]i in vascular smooth muscle cells. Am. J. Physiol. 263, C873–C878 [DOI] [PubMed] [Google Scholar]
- 64. Altura B. M., Zhang A., Cheng T. P., Altura B. T. (1993) Cocaine induces rapid loss of intracellular free Mg2+ in cerebral vascular smooth muscle cells. Eur. J. Pharmacol. 246, 299–301 [DOI] [PubMed] [Google Scholar]
- 65. Delva P., Pastori C., Degan M., Montesi G., Lechi A. (2004) Catecholamine-induced regulation in vitro and ex vivo of intralymphocyte ionized magnesium. J. Membr. Biol. 199, 163–171 [DOI] [PubMed] [Google Scholar]
- 66. Tashiro M., Konishi M. (1997) Basal intracellular free Mg2+ concentration in smooth muscle cells of guinea pig tenia cecum: intracellular calibration of the fluorescent indicator furaptra. Biophys. J. 73, 3358–3370 [DOI] [PMC free article] [PubMed] [Google Scholar]
- 67. Dai L. J., Quamme G. A. (1992) Cyclic nucleotides alter intracellular free Mg2+ in renal epithelial cells. Am. J. Physiol. 262, F1100–F1104 [DOI] [PubMed] [Google Scholar]
- 68. Singh J., Wisdom D. M. (1995) Second messenger role of magnesium in pancreatic acinar cells of the rat. Mol. Cell. Biochem. 149, 175–182 [DOI] [PubMed] [Google Scholar]
- 69. Iotti S., Malucelli E. (2008) In vivo assessment of Mg2+ in human brain and skeletal muscle by 31P-MRS. Magnes. Res. 21, 157–162 [PubMed] [Google Scholar]
- 70. Rijkers G. T., Griffioen A. W. (1993) Changes in free cytoplasmic magnesium following activation of human lymphocytes. Biochem. J. 289, 373–377 [DOI] [PMC free article] [PubMed] [Google Scholar]
- 71. Yazaki Y., Asukagawa N., Ishikawa Y., Ohta E., Sakata M. (1988) Estimation of cytoplasmic free Mg2+ levels and phosphorylation potentials in mung bean root tips by in vivo 31P NMR spectroscopy. Plant Cell Physiol. 29, 919–924 [Google Scholar]
- 72. Thaler M. (1991) Lichtabhängige Anderungen cytoplasmatischer Ionenaktivitäten bei Eremosphaera viridis. Untersuchungen mit ionenselektiven Mikroelektroden. Ph.D. thesis, University of Würzburg, Germany [Google Scholar]
- 73. De La Cruz E. M., Sweeney H. L., Ostap E. M. (2000) ADP inhibition of myosin V ATPase activity. Biophys. J. 79, 1524–1529 [DOI] [PMC free article] [PubMed] [Google Scholar]
- 74. Yengo C. M., Sweeney H. L. (2004) Functional role of loop 2 in myosin V. Biochemistry 43, 2605–2612 [DOI] [PubMed] [Google Scholar]
- 75. Kambara T., Komaba S., Ikebe M. (2006) Human myosin III is a motor having an extremely high affinity for actin. J. Biol. Chem. 281, 37291–37301 [DOI] [PubMed] [Google Scholar]
- 76. Millar N. C., Geeves M. A. (1983) The limiting rate of the ATP-mediated dissociation of actin from rabbit skeletal muscle myosin subfragment 1. FEBS Lett. 160, 141–148 [DOI] [PubMed] [Google Scholar]
- 77. Siemankowski R. F., Wiseman M. O., White H. D. (1985) ADP dissociation from actomyosin subfragment 1 is sufficiently slow to limit the unloaded shortening velocity in vertebrate muscle. Proc. Natl. Acad. Sci. U.S.A. 82, 658–662 [DOI] [PMC free article] [PubMed] [Google Scholar]
- 78. Geeves M. A., Jeffries T. E. (1988) The effect of nucleotide upon a specific isomerization of actomyosin subfragment 1. Biochem. J. 256, 41–46 [DOI] [PMC free article] [PubMed] [Google Scholar]
- 79. Yang Y., Kovács M., Sakamoto T., Zhang F., Kiehart D. P., Sellers J. R. (2006) Dimerized drosophila myosin VIIa: a processive motor. Proc. Natl. Acad. Sci. U.S.A. 103, 5746–5751 [DOI] [PMC free article] [PubMed] [Google Scholar]
- 80. Cremo C. R., Geeves M. A. (1998) Interaction of actin and ADP with the head domain of smooth muscle myosin: implications for strain-dependent ADP release in smooth muscle. Biochemistry 37, 1969–1978 [DOI] [PubMed] [Google Scholar]
- 81. Watanabe S., Ikebe R., Ikebe M. (2006) Drosophila myosin VIIA is a high duty ratio motor with a unique kinetic mechanism. J. Biol. Chem. 281, 7151–7160 [DOI] [PubMed] [Google Scholar]
- 82. Wojtaszek P., Anielska-Mazur A., Gabrys H., Baluska F., Volkmann D. (2005) Recruitment of myosin VIII towards plastid surfaces is root-cap specific and provides the evidence for actomyosin involvement in root osmosensing. Funct. Plant Biol. 32, 721–736 [DOI] [PubMed] [Google Scholar]
- 83. Sattarzadeh A., Franzen R., Schmelzer E. (2008) The Arabidopsis class VIII myosin ATM2 is involved in endocytosis. Cell Motil. Cytoskeleton 65, 457–468 [DOI] [PubMed] [Google Scholar]
- 84. Lapierre L. A., Kumar R., Hales C. M., Navarre J., Bhartur S. G., Burnette J. O., Provance D. W., Jr., Mercer J. A., Bähler M., Goldenring J. R. (2001) Myosin vb is associated with plasma membrane recycling systems. Mol. Biol. Cell 12, 1843–1857 [DOI] [PMC free article] [PubMed] [Google Scholar]
- 85. Avisar D., Prokhnevsky A. I., Dolja V. V. (2008) Class VIII myosins are required for plasmodesmatal localization of a closterovirus Hsp70 homolog. J. Virol. 82, 2836–2843 [DOI] [PMC free article] [PubMed] [Google Scholar]
- 86. Nyitrai M., Geeves M. A. (2004) Adenosine diphosphate and strain sensitivity in myosin motors. Philos. Trans. R. Soc. Lond. B Biol. Sci. 359, 1867–1877 [DOI] [PMC free article] [PubMed] [Google Scholar]
- 87. Jontes J. D., Wilson-Kubalek E. M., Milligan R. A. (1995) A 32° tail swing in brush border myosin I on ADP release. Nature 378, 751–753 [DOI] [PubMed] [Google Scholar]
- 88. Whittaker M., Wilson-Kubalek E. M., Smith J. E., Faust L., Milligan R. A., Sweeney H. L. (1995) A 35-Å movement of smooth muscle myosin on ADP release. Nature 378, 748–751 [DOI] [PubMed] [Google Scholar]
- 89. Veigel C., Wang F., Bartoo M. L., Sellers J. R., Molloy J. E. (2002) The gated gait of the processive molecular motor, myosin V. Nat. Cell Biol. 4, 59–65 [DOI] [PubMed] [Google Scholar]
- 90. Purcell T. J., Morris C., Spudich J. A., Sweeney H. L. (2002) Role of the lever arm in the processive stepping of myosin V. Proc. Natl. Acad. Sci. U.S.A. 99, 14159–14164 [DOI] [PMC free article] [PubMed] [Google Scholar]
- 91. Sakamoto T., Wang F., Schmitz S., Xu Y., Xu Q., Molloy J. E., Veigel C., Sellers J. R. (2003) Neck length and processivity of myosin V. J. Biol. Chem. 278, 29201–29207 [DOI] [PubMed] [Google Scholar]
- 92. Li F. Y., Chaigne-Delalande B., Kanellopoulou C., Davis J. C., Matthews H. F., Douek D. C., Cohen J. I., Uzel G., Su H. C., Lenardo M. J. (2011) Second messenger role for Mg2+ revealed by human T-cell immunodeficiency. Nature 475, 471–476 [DOI] [PMC free article] [PubMed] [Google Scholar]
Associated Data
This section collects any data citations, data availability statements, or supplementary materials included in this article.