

Abstract
The ability to perceive causality is a central human ability constructed from elemental spatial and temporal information present in the environment. Although the nature of causality has captivated philosophers and scientists since antiquity, the neural correlates of causality remain poorly understood. In the present study, we used functional magnetic resonance imaging (fMRI) to generate hypotheses for candidate brain regions related to component processes important for perceptual causality in the human brain: elemental space perception, elemental time perception, and decision-making (Experiment 1; n=16). We then used transcranial direct current stimulation (tDCS) to test neural hypotheses generated from the fMRI experiment (Experiment 2; n=16). In both experiments, participants judged causality in billiard-ball style launching events; a blue ball approaches and contacts a red ball. Spatial and temporal contributions to causal perception were assessed by parametrically varying the spatial linearity and the temporal delays of the movement of the balls. Experiment 1 demonstrated unique patterns of activation correlated with spatial, temporal, and decision-making components of causality perception. Using tDCS, we then tested hypotheses for the specific roles of the parietal and frontal cortices found in the fMRI experiment. Parietal stimulation only decreased participants’ perception of causality based on spatial violations, while frontal stimulation made participants less likely to perceive causality based on violations of space and time. Converging results from fMRI and tDCS indicate that parietal cortices contribute to causal perception because of their specific role in processing spatial relations, while the frontal cortices contribute more generally, consistent with their role in decision-making.
Keywords: Perceptual causality, space, time, decision-making, fMRI, tDCS
Introduction
The nature of causality has preoccupied philosophers since antiquity (e.g., Aristotle, 384-322BC; Aquinas, 1225-1275AD; Hume, 1711-1776AD; Kant, 1724-1804AD), in part, because the exact properties that make an event “causal” are not readily obvious. Yet, we seem to perceive causal relationships in physical and social events easily, allowing us to interpret events in our environment, predict future outcomes, and plan goal-directed actions. (e.g., Blakemore et al., 2001; Leslie, 1982, 1984; Leslie and Keeble, 1987; Michotte, 1946/1963; Oakes and Cohen, 1990; Scholl and Tremoulet, 2000; Wolpert, 2003, 2006, 2009). Furthermore, this critical ability may have been important in the evolutionary development of Homo sapiens (Wolpert, 2003 and 2009). When this ability is compromised, it appears to play an important role in paranoid delusions from schizophrenia, obsessive tendencies in obsessive-compulsive disorder, and social comprehension in autism spectrum disorder (Dettore, 2011; Ray and Schlottmann, 2007; Tschacher and Kupper, 2006). Unfortunately, the neural underpinnings of causality remain poorly understood. To address this issue, the present study gathers converging evidence from neuroimaging and non-invasive brain stimulation to shed light on the neural bases of causal perception.
The impression of causality in simple mechanical events is built on spatial and temporal elements (e.g., Blakemore et al., 2003; Buehner and Humphreys, 2010; Fonlupt, 2003; Fugelsang et al., 2005; Guski and Troje, 2003; Roser et al., 2005; Scholl and Tremoulet, 2000; Wolff, 2007, 2008; Woods et al., 2012). For example, in a mechanical event with two objects, spatial continuity and temporal contiguity increases the likelihood that a person will perceive causality (e.g., Straube and Chatterjee, 2010; Woods et al., 2012). When one object—for instance, a billiard ball—moves towards another, the timing and direction of movement of both objects influences our perception of whether one object causes the other to move. This spatial and temporal information conveys a sense of forces underlying causal relationships in an event (Wolff, 2007, 2008). Contextual information, such as recent experience and prior knowledge, also influences the perception of causality (Buehner and May, 2002, 2003; Gruber et al., 1957; Powesland, 1959; Schlottmann, 1999; Shanks, 1985; Woods et al., 2012). While we are beginning to understand the component perceptual and cognitive processes (elemental space and time perception, decision-making, etc.), involved in causal perception, we know little of the neural substrates of perceptual causality.
We used functional magnetic resonance imaging (fMRI) to generate hypotheses about neural systems involved in component processes of causal perception and transcranial direct current stimulation (tDCS) to test these hypotheses. While fMRI typically generates correlational evidence for brain-behavior relationships, it is poorly equipped to directly establish a necessary role of brain structure to cognitive function (Chatterjee, 2005). Non-invasive brain stimulation potentially provides converging evidence and a stringent test of neural hypotheses generated from fMRI. Thus, we used fMRI to identify possible neural correlates of spatial, temporal, and decision-making processes involved when perceiving causality in simple mechanical collision events. This experiment was followed by transcranial direct current stimulation (tDCS) to test hypotheses generated from the fMRI experiment about the contributions of parietal and frontal cortices to causality.
Experiment 1: Neural Correlates of Space, Time, and Decision-Making in Causality
Experiment 1 used fMRI to generate neural hypotheses for the neural systems involved in three component processes important for perceptual causality: elemental space perception, elemental time perception, and decision-making. Spatial, temporal, and decision-making parameters of a causal perception task depicting launching events were correlated with blood oxygen level dependent (BOLD) response to identify patterns of activation associated with each elemental process.
Materials and Methods
Participants
Sixteen right-handed human participants (mean age ± SD: 23±3 years, age range: 18–27, mean education: 14.5±2 years, education range: 12–16, 9 females) volunteered to participate. None of the participants had a history of neurological or psychiatric disorders. They all had normal or corrected-to-normal vision, and were naïve to the goals of the experiment. Metal in the head, implanted electrical devices, and/or history of seizures were exclusionary criteria for participation in the study. The research was in compliance with institutional guidelines and approved by the Institutional Review Board of the University of Pennsylvania.
Stimuli
Stimuli were 2s animated video clips, generated in Strata 3D, depicting a blue ball colliding with a red ball (i.e., a launching event). Contact of the blue ball then “launched” the red ball. Spatial linearity was parametrically varied by changing either the angle of approach of the blue ball or the angle of egress of the red ball (seven angles: 0, 7.5, 15, 22.5, 30, 45, and 60 degrees; Figure 1a and c). The ball depicting change in spatial linearity was counterbalanced such that 49 trials depicted the first ball (blue) with different angles of approach, while 49 trials depicted the second ball (red ball) with different angles of egress. The ball with a consistent spatial trajectory always traversed the horizontal axis. Temporal contiguity was parametrically varied between the contact of the blue ball and initial movement of the red ball (seven time delays: 0, 33, 67, 100, 133, 200, 267 ms; Figure 1b). All possible combinations of time delays and angle changes resulted in 49 different stimulus conditions (7 time delays x 7 angles), presented once with spatial linearity changing in the angle of approach (n = 49) and once in the angle of egress (n = 49). All videos (n=98) moved from left to right across the screen. The speed (9 cm/s), distance traveled (4.5 cm), and size (1.5 cm diameter) of each ball were constant. Each video was followed by a fixation cross with a variable duration of 2000 ms to 8000 ms (average jitter = 5000 ms). Videos were presented in random order using Presentation experimentation software and back projected on a screen (1024 x 768 pixel resolution) with an Epson 8100 3-LCD projector viewed via a mirror mounted on the MR head coil.
Figure 1.

Spatial and temporal parameters for launching events and example of design. a) Spatial launching events depicted variations in spatial angle between 0 and 60 degrees. b) Temporal launching events depicted variations in time delay between 0 and 267ms. Balls on the left were blue (r =14, g=5, b=223), balls on the right were red(r=255, g=0, b=0), and the background was gray (r =192, g=192, b=192). d) Diagram of fMRI behavioral task design.
Experimental Design
Following six representative practice trials, participants saw a block of 98 trials of launching events instructing them to judge the causal relationship between the balls using a two-alternative forced choice design (“Did the blue object cause the red object to move? Yes or No”; see Table 1 for exact instructions and Figure 1d for example of design). This block (Basic Instruction Condition) provided participants with exposure to the stimuli and experience in making causality judgments on launching events before administering space or time-biased instructions. Participants responded with their right hand and were asked to push a button with the index finger (Yes/causal) or middle finger (No/non-causal). Following the Basic Instruction Block, participants were given a questionnaire asking them to describe the factors that influenced their causality judgments. Following the questionnaire, participants were given additional instructions explicitly asking them to pay close attention to either spatial (Space Instruction Condition) or temporal (Time Instruction Condition) aspects of the events when judging causality, while ignoring other factors that might influence their judgments (see Table 1). After participants indicated comprehension of the instructions, the experimenter reiterated (Table 1) the space-specific or time-specific instructions using a predetermined script describing two example videos of launching events demonstrating extreme variations of the space or time condition. During delivery of the script, participants watched the appropriate example videos. The two example videos for the Space Instruction Condition depicted 1) the blue ball approaching at a 60 degree angle with the red ball moving away at zero degrees and no delay and 2) the blue ball approaching at a zero degree angle with the red ball moving away at 7.5 degrees and no delay. The two example videos for the Time Instruction Condition depicted both balls moving at zero degree angles with 1) a 267 ms time delay and 2) no time delay. Following the instructions, the script, and example videos, participants completed the second block of trials. Following completion of the second instruction condition, participants were given instructions for the remaining instruction condition, read the appropriate experimenter delivered script, and watched the appropriate example videos. Finally, participants completed the last block of trials.
Table 1.
Task instructions
| Basic Instruction Condition | In every video, you will see a blue object and a red object move across the screen. You will be asked to judge whether the blue object caused the red object to move. |
|
| (…) We are interested only in your perception. There are no right or wrong answers. Please respond as quickly as possible to each video. Press ‘index finger’ if you believe the blue object caused the red object to move. Press ‘middle finger’ if you do not. | ||
| Causal ‘index finger’ |
Non-Causal ‘middle finger’ |
|
|
| ||
| Space Instruction Condition | You will again see a blue object and a red object move across the screen. You may have noticed that the blue or red objects sometimes move at different angles relative to one another. We would like you to pay close attention to the angle that the blue and red objects move before and after they make contact when judging whether the blue object caused the red object to move. Please ignore any other factors in the event that might influence your judgment of whether the blue object caused the red object to move. … |
|
|
| ||
| Space Instruction Experimenter Script | As the instructions said, you may have noticed that the blue or red objects sometimes move at different angles relative to one another. For example (PLAY MOVIE 1), in this event the blue object approaches the red object from a steep angle and the red object moves off at a shallow angle – or like in this event (PLAY MOVIE 2), the blue object approaches the red object at a flat angle and the red object moves away at a shallow angle. Pay close attention to the angles of the blue and red objects movements when judging whether the blue object caused the red object to move – remember to ignore any other factors that might influence your judgment. Do you have any questions or want me to play the two example events again? | |
|
| ||
| Time Instruction Condition | You will again see a blue object and a red object move across the screen. You may have noticed that the red object can vary in how long it takes to start moving after contact with the blue object. We would like you to pay close attention to the duration of contact between the blue and red object when judging whether the blue object caused the red object to move. Please ignore any other factors in the event that might influence your judgment of whether the blue object caused the red object to move. … |
|
|
| ||
| Time Instruction Experimenter Script | As the instructions said, you may have noticed that the red object can vary in how long it takes to start moving after contact with the blue object. For example (PLAY MOVIE 1), in this event the red object pauses after contact with the blue object before moving away – or like in this event (PLAY MOVIE 2), the red object immediately moves away after the blue object makes contact. Pay close attention to how long it takes for the red object to start moving when judging whether the blue object caused the red object to move – remember to ignore any other factors that might influence your judgment. Do you have any questions or want me to play the two example events again? | |
Instructions denoted by (…) in the Basic Instruction Condition represent instructions common to all instruction conditions. All subsequent places marked by this notation indicate the location where common instructions should be inserted for a given instruction condition.
Order of presentation for Space and Time Instruction Conditions were counterbalanced across participants. Testing time in each of the three conditions was approximately 12 min (total time: 36 min). Each block was subdivided into two 6 min 3 s sessions containing 49 randomized trials. Each sub-block contained an equal proportion of spatial and temporal parameters.
Behavioral pilot study
A behavioral pilot experiment was conducted before the fMRI study on a separate group of sixteen healthy participants (mean age ± SD = 23 ± 2, 9 females). The results showed a strong influence of spatial and temporal instruction manipulations on participants use of space and time when judging causality. These behavioral findings were replicated in the fMRI experiment.
Behavioral data analyses
Participants’ data were analyzed using Generalized Linear Models (GenLM) in SPSS. Binary causal judgments were modeled as the dependent variable using the probit function in the SPSS GenLM procedure. Instruction Condition (Basic Instruction, Space Instruction, Time Instruction), spatial parameters (Space), temporal parameters (Time), and their interaction (Space x Time) were included in a factorial model. A significant Condition x Space, Condition x Time, or Condition x Space x Time Interaction would suggest that the use of spatial and temporal information to judge causality differed between at least one condition. Planned contrasts of individual Instruction Conditions were used to explore between session differences.
MRI data acquisition and analyses
MRI acquisition was performed in a Siemens 3T Magnetom Trio scanner using an 8-channel head coil. High-resolution whole-brain structural MR images were obtained for each participant using a T1-weighted three-dimensional (3D) magnetization-prepared rapid acquisition gradient-echo sequence (voxel size, 0.9 x 0.9 x 1.0 mm). For functional data, a time course series of 121 volumes per session was acquired using interleaved T2*-weighted gradient-echo echo-planar imaging sequences (voxel size, 3.0 mm isotropic). Each volume contained 48 transversal slices of 3 mm slice thickness oriented parallel to the AC-PC line covering the whole brain (TR = 3000 ms, TE = 30 ms, flip angle = 90°, FoV = 192 mm, 64 x 64 matrix, in plane-resolution = 3.0 x 3.0 mm). Six sessions were acquired during the experiment (total volumes = 726). Field map data were collected using a dual echo 2D gradient echo sequence with echoes at 2.69 and 5.27 ms, repetition time of 1000 ms, and voxel size of 3 mm isotropic. Participants wore headphones to allow communication of instructions between functional runs. Participants’ heads were fixed with foam pads to minimize head motion. Four participants required vision correction using either MRI-compatible contact lenses (n=3) or MRI-compatible plastic goggles. All participants reported no difficulty viewing stimuli or hearing instructions.
The first two volumes of each fMRI session were discarded to minimize T1 saturation effects. The remaining 119 volumes per session (n = 6) were used for analyses. Data were analyzed using statistical parametric mapping (SPM8; Wellcome Trust Centre for Neuroimaging, London, UK) in MATLAB (MathWorks; Friston et al., 1995). Following field map correction, realignment, and slice timing correction, images were coregistered to subjects’ high-resolution 3D T1-weighted structural MRI images. Spatial normalization of fMRI images into MNI space was performed using normalization parameters estimated from the segmented high-resolution structural data and SPM8 default normalization parameters. Anatomically normalized fMRI data were filtered using an 8mm Gaussian kernel to compensate for inter-subject variance in neuroanatomy.
Statistical analysis of the fMRI data
The signal time course of each subject was modeled with hemodynamic response functions, high-pass filtering (128 s), and session effects. Onsets were set 1.5 seconds after the start of the stimulus at the point of object interaction (i.e., when the object had changed its trajectory and/or the pause had occurred. The first two sessions corresponded to the Basic Instruction Condition, while the remaining four sessions corresponded to the Space Instruction and Time Instruction Conditions. For the Basic Instruction Condition, a design matrix was modeled with the single-subject BOLD responses of trials judged as causal (Causal Onset) and non-causal (Non-Causal Onset) by participants. This procedure led to a design matrix containing two contrasts of interest (Causal Onset, Non-Causal Onset). For Space Instruction and Time Instruction Conditions, a design matrix was modeled with the single-subject BOLD responses of the trials (onset; irrespective of causality judgment) with spatial angle (space), time delay (time), the interaction of spatial angle and time delay (space x time; mean centered), and reaction time (RT) modeled as regressors of interest. Thus, this procedure led to a design matrix with two instruction conditions (Space Instruction Condition and Time Instruction Condition) containing five regressors of interest (Onset, Space, Time, Space x Time, and RT). Volumes in which the change in global signal intensity was greater than three standard deviations from the mean or composite head movement was greater than 1 mm were excluded from analyses by modeling an outlier regressor generated by the Artifact Rejection Toolbox (ART). Less than 10 percent of volumes in any session for any participant were regarded as outliers.
Group level analyses
Random-effects group analyses were performed using flexible-factorial analysis in SPM8. Three separate flexible factorial analyses were used to identify 1) the neural correlates of causal and non-causal events representation, 2) the neural correlates of spatial and temporal processing in causality, and 3) the neural correlates of decision-making. First, contrast images of trials judged as causal (Causal Onsets) and non-causal (Non-causal Onset) in the Basic Instruction Condition were analyzed to assess differences in patterns of activation associated with causal versus non-causal judgments (Causal Onsets > Non-Causal Onsets). These data were further analyzed by performing baseline contrasts on Causal and Non-Causal Onsets (Causal>Baseline [fixation target], Non-Causal>Baseline [fixation target]) and performing a fixed-effects conjunction analysis to identify common areas of activation. Conjunction analysis used the conjunction null method based on the minimum statistic approach (see Nichols et al., 2005). Second, contrast images of space, time, and space x time in the Space Instruction and Time Instruction Conditions were analyzed to identify brain regions sensitive to variation in spatial and temporal stimulus parameters. Centered covariates in interaction with the conditions were included to assess the neural instantiation of spatial and temporal processing for judgments of causality. Covariates were the predicative values of space, time, and space x time for the judgment of causality. Predicative values for space, time, and space x time were included in analyses of Space Instruction and Time Instruction data to identify activation unique to participants use of either time or space to judge causality. Predictive values for individual subjects were calculated using logistic regressions modeling space, time, and space x time on causal judgments (causal/non-causal). This analysis led to three contrasts of interest (Space, Time, Space x Time). Third, contrast images of RT, after controlling for variation associated with spatial and temporal processing, in the Space and Time Instruction Conditions were analyzed to assess the neural instantiation of generalized decision-making processes involved in making causality judgments (RT>Resting Baseline [fixation object]. This strategy is based on the logic that difficult decisions take longer to make than easier ones and would be more likely to engage neural circuitry involved in decision-making (e.g., Wencil et al., 2010). RT results from behavioral data in Experiment 1 support this strategy and are provided in Appendix A. RT was calculated from the onset of the second balls movement. A conjunction analysis was performed on contrast images of RT from the Space Instruction and Time Instruction Conditions to evaluate significant patterns of coactivation across Instruction Conditions irrespective of instruction type (RT Space Instruction ∩ RT Time Instruction).
All fMRI statistical analyses were performed under a p < 0.001 (uncorrected) threshold. All reported clusters of activation were corrected for multiple comparisons using an FWE p < .05 cluster threshold (family wise error). Voxel coordinates are reported in MNI space and images oriented in neurological orientation (right = right, left = left). Anatomical localization of functional activation was performed using probabilistic cytoarchitectonic maps in the SPM Anatomy toolbox (v 1.8; Eickhoff et al., 2007).
Results
Behavioral Results
GenLM analyses of causality judgments demonstrated significant Condition x Space (Wald χ2 = 115.9, DF = 12, p < .001) and Condition x Time (Wald χ2 = 200.7, DF = 12, p < .001) interactions. However, there was not a significant Condition x Space x Time interaction (Wald χ2 = 28.6, DF = 72, p = .99). Planned contrasts of individual instruction conditions demonstrated that while participants used both space and time to judge causality in the Basic Instruction Condition (space: Wald χ2 = 250.0, DF = 6, p < .001; time: Wald χ2 = 111.4, DF = 6, p < .001), participants only used spatial information to make judgments of causality in the Space Instruction Condition (space: Wald χ2 = 431.6, DF = 6, p < .001; time: Wald χ2 = 8.5, DF = 6; p = .19) and only temporal information in the Time Instruction Condition (space: Wald χ2 =10.5, DF = 6, p = .09; time: Wald χ2 = 468.1, DF = 6, p < .001; See Figure 2). Space x Time interactions were not significant in individual instruction condition models (space: Wald χ2 = 16.3; DF = 36, p = .99; time: Wald χ2 = 19.4; DF = 36, p = .98).
Figure 2.

Probability of Causal judgment for all parameter combinations in each Instruction Condition: a) Basic Instruction Condition, b) Space Instruction Condition, and c) Time Instruction Condition. The size of each bubble is equal to the probability of causal judgment for a given parameter combination. The distribution of causal judgment can be seen shift along the x-axis (temporal parameters) and y-axis (spatial parameters) in relationship to the Instruction Conditions used in a given condition.
fMRI Results
Causal versus Non-Causal Events
Consistent with previous research, contrasts of trials judged as causal versus non-causal in the Basic Instruction Condition (Causal Onset > Non-Causal Onset, Non-Causal Onset > Causal Onset) did not identify brain regions associated with causal versus non-causal judgments (Straube and Chatterjee, 2010; Blos et al., 2012). Conjunction analysis of trials judged as Causal or Non-Causal (Causal>Baseline ∩ Non-Causal>Baseline) demonstrated a broad range of brain regions coactivated, including bilateral activation of the cerebellum, right inferior and middle temporal gyrus, right lingual gyrus, right caudate nucleus, bilateral putamen, bilateral insula, right inferior and superior parietal cortex, and middle frontal gyrus (see Table 2).
Table 2.
Activation Locations
| Anatomical Region | Cluster Extend | Side | MNI Coordinates | No. of voxels | t | ||
|---|---|---|---|---|---|---|---|
| x | y | z | |||||
| Basic Instruction Condition | |||||||
| Causal ∩ Non-Causal | |||||||
| Cerebellum | L | −33 | −64 | −28 | 441 | 7.62 | |
| Cerebellum | Inferior temporal gyrus, middle temporal gyrus | R | 27 | −58 | −46 | 299 | 7.03 |
| Lingual gyrus | Cerebellum, Cerebellar vermis | R | 18 | −52 | −1 | 209 | 5.74 |
| Caudate nucleus | Putamen, Insula | R | 15 | 2 | 17 | 257 | 5.71 |
| Insula | Putamen | L | −42 | 8 | −4 | 166 | 5.53 |
| Inferior parietal cortex | Superior parietal cortex | R | 51 | −46 | 56 | 161 | 5.46 |
| Middle frontal gyrus | Inferior frontal gyrus | R | 39 | 44 | 20 | 83 | 4.84 |
| Space Instruction Condition | |||||||
| Space | |||||||
| Inferior frontal gyrus | Precentral gyrus | L | −36 | 26 | 23 | 780 | 10.52 |
| Inferior parietal cortex | L | −33 | −46 | 32 | 545 | 9.08 | |
| Inferior parietal cortex | R | 42 | −40 | 38 | 96 | 8.17 | |
| Superior parietal cortex | R | 27 | −61 | 56 | 147 | 7.65 | |
| Inferior frontal gyrus | Rolandic operculum | R | 48 | 2 | 14 | 97 | 5.99 |
| Reaction Time | |||||||
| Supplementary motor association cortex | Postcentral gyrus, Inferior parietal cortex | L | −3 | 23 | 44 | 1590 | 7.60 |
| Inferior frontal gyrus | Insula | R | 36 | 20 | 2 | 691 | 6.30 |
| Inferior frontal gyrus | Insula, Middle orbital gyrus, Middle frontal gyrus | L | −30 | 26 | 7 | 655 | 6.23 |
| Precentral gyrus | Inferior frontal gyrus, Middle frontal gyrus | L | −54 | 11 | 38 | 156 | 5.86 |
| Inferior temporal gyrus | Fusiform gyrus, Middle temporal gyrus | R | 54 | −49 | −13 | 244 | 5.56 |
| Middle cingulate cortex | R/L | 2 | −12 | 33 | 103 | 5.18 | |
| Inferior parietal cortex | R | 39 | −43 | 44 | 207 | 4.98 | |
| Thalamus | Caudate nucleus | R | 12 | −13 | 2 | 76 | 4.12 |
| Time Instruction Condition | |||||||
| Time | |||||||
| Cerebellum (Lobule IX) | R/L | 3 | −49 | −55 | 88 | 5.91 | |
| Hippocampus | Parahippocampal gyrus | R | 27 | −22 | −13 | 94 | 5.58 |
| Reaction Time | |||||||
| Supplementary motor association cortex | Superior middle gyrus (R), Middle cingulate cortex (R) | R/L | 6 | 17 | 53 | 308 | 5.78 |
| Precentral gyrus | Postcentral gyrus, Superior frontal gyrus | L | −42 | −19 | 59 | 278 | 5.28 |
| Inferior frontal gyrus | Insula Rolandic operculum | R | 39 | 14 | 1 | 207 | 5.35 |
| Inferior frontal gyrus | Insula | L | −33 | 20 | 8 | 238 | 5.24 |
| Reaction Time: Space Instruction Condition ∩ Time Instruction Condition | |||||||
| Supplementary motor association cortex | Middle cingulate cortex | R/L | 3 | 17 | 53 | 279 | 5.75 |
| Inferior frontal gyrus | Insula, Rolandic operculum | R | 39 | 17 | −1 | 186 | 5.20 |
| Postcentral gyrus | Precentral gyrus, Superior frontal gyrus | L | −39 | −22 | 56 | 234 | 5.09 |
| Insula | L | −33 | 20 | 5 | 132 | 4.73 | |
L = Left; R = Right; FWE .05 cluster level threshold; all p’s < .05
Space
To assess the neural correlates of spatial processing in causality judgments, we identified brain regions sensitive to parametric increase in spatial stimulus parameters in the Space Instruction Condition and correlated corresponding activation maps with the predicative value of space for participants’ causality judgments (mean logistic regression beta±SE = −.51±.32). When participants were instructed to explicitly use spatial information to make causality judgments, increased sensitivity to the relationship between spatial linearity and causality correlated with increased activity in bilateral inferior frontal gyrus (extending to left precentral gyrus and right rolandic operculum), bilateral inferior parietal cortex, and right superior parietal cortex (Figure 3a; see Table 2).
Figure 3.

Brain activation for a.) Space Instruction Condition and b). Time Instruction Condition; p < .05, FWE cluster threshold corrected; IFG = inferior frontal gyrus, IPC = inferior frontal gyrus, SPC = superior parietal cortex, F = frontal, O = occipital, L = left, R = right.
Time
To assess the neural correlates of temporal processing in causality judgments, we identified brain regions sensitive to parametric increase in temporal stimulus parameters in the Time Instruction Condition and correlated corresponding activation maps with the predicative value of time for participants’ causality judgments (mean beta±SE = −.08±.05). When participants were instructed to explicitly use temporal information to make causality judgments, increased sensitivity to the relationship between temporal contiguity and causality correlated with increased activity in bilateral lobule IX (vermis) of the cerebellum and the right hippocampus (extending to parahippocampal gyrus; Figure 3b; see Table 2).
Decision-Making
Analyses of the neural correlates of decision-making processes involved in making causality judgments in the Space Instruction Condition (Space Instruction RT>Baseline) demonstrated bilateral activation of the supplementary motor association cortex (SMA), bilateral activation of inferior frontal gyrus (extending bilaterally into anterior insula and the left middle orbital and frontal gyri), the left precentral gyrus (extending into the inferior and middle frontal gyri), right inferior temporal gyrus (extending into fusiform and middle temporal gyrus), bilateral middle cingulate cortex, right parietal cortex, and the right thalamus (extending into caudate nucleus; see Table 2). For the Time Instruction Condition (Time Instruction RT>Baseline), analyses demonstrated bilateral activation of SMA (extending to right superior middle gyrus and middle cingulate cortex), left precentral gyrus (extending to postcentral and superior frontal gyrus), and bilateral activation of inferior frontal gyrus (extending bilaterally to anterior insula and right rolandic operculum; see 2). Conjunction analysis of decision-making-related brain regions commonly activated across both conditions (Space Instruction RT>Baseline ∩ Time Instruction RT>Baseline) demonstrated coactivation in bilateral SMA (extending to bilateral middle cingulate cortex), right inferior frontal gyrus (extending bilaterally to anterior insula and right rolandic operculum) and left postcentral gyrus (extending to precentral and superior frontal gyrus; Figure 4).
Figure 4.

Brain activation for reaction time across instruction conditions (Reaction Time: Space Instruction Condition ∩ Time Instruction Condition); p < .05, FWE cluster threshold corrected; SMA = supplementary motor association cortex, PoG = postcentral gyrus, F = frontal, O = occipital, L = left, R = right.
Discussion
Results from Experiment 1 generated a host of neural hypotheses for spatial, temporal, and decision-making processes potentially important for causal perception. Areas commonly activated for causal and non-causal judgments in the Basic Instruction Condition (see Table 2), were consistent overall with areas identified in Space and Time Instruction Conditions, with the exception of left IFG in the Space Instruction Condition, hippocampal activation in the Time Instruction Condition, and L PoG and SMA in the decision-making condition. All remaining areas found to be activated prior to biasing participants to use either spatial or temporal information were uniquely identified in either the Space or Time Instruction Conditions, suggesting involvement of these regions in processing causality perception. Nonetheless, as these findings from BOLD fMRI are correlational in nature, direct links between structure and function are impossible. However, the use of neural modulation techniques, like transcranial direct current stimulation, provides a direct method for probing the validity of these neural hypotheses.
Experiment 2: Effects of tDCS on Space, Time, and Causality
Experiment 2 used transcranial direct current stimulation (tDCS) to directly investigate the validity of neural hypotheses generated in Experiment 1 using fMRI. This particular investigation focused on probing the role of the frontal versus parietal cortices in perceptual causality. While results from Experiment 1 demonstrated that processing of spatial parameters in the launching event task were associated with BOLD activation in bilateral fronto-parietal regions and superior parietal cortex, decision-making was associated with change in BOLD response in RIFG and other areas outside the frontal cortices. Experiment 2 used tDCS to stimulate frontal versus parietal cortices to determine their specific roles in perceptual causality. Based on results from Experiment 1, we hypothesized that the parietal cortex contribute to perceptual causality through their role in processing spatial relations, while the frontal cortices contribute to generalized decision-making components of causal perception.
Methods and Materials
Participants
A new group of sixteen right-handed human participants (mean age ± SD: 22±2.7 years, age range: 18–26, mean education: 15±1.5 years, education range: 12–16, 10 females) participated in Experiment 2. Participants were negative for a history of neurological or psychiatric disorders, had normal or corrected-to-normal vision, and were naïve to the goals of the experiment. Metal in the head, implanted electrical devices, and/or history of seizures were exclusionary criteria for participation in the study. The research complied with institutional guidelines and approved by the Institutional Review Board of the University of Pennsylvania.
tDCS Montage Selection
Computational models of induced electrical fields based on a whole brain high-resolution magnetic resonance image from an adult male (for details, see Datta et al., 2009) were used to guide the selection of tDCS montages predicted to stimulate frontal versus parietal cortices (see Datta et al., 2009 for a detailed description of modeling methods and isotropic electrical conductivities). Briefly, the head model was segmented into separate compartments (brain grey matter, brain white matter, skull, scalp/skin, eye region, muscle, cerebrospinal fluid, and air) and assigned appropriate electrical conductivities. Square 5 x 5 cm sponge pads were modeled for the method of current delivery. The total current and pad configuration was modeled and maps plotting the magnitude of electrical fields were determined (Custom tDCS and Allocentric Processing 10 Segmentation, Soterix Medical, New York, NY). Models of bilateral montages with right anodal and left cathodal tDCS at CP3/CP4 and F3/F4 provided predicted patterns of stimulation contrasting frontal versus parietal cortices (Figure 5a and b). The CP3/CP4 model identified areas of increased current density in right posterior and superior parietal cortex, with lower levels of increased current density extending into posterior superior and middle temporal gyri (Figure 5a). The F3/F4 model identified areas of increased current density in inferior, middle, superior frontal gyri, and insula (Figure 5b). A similar pattern of decreased current density was modeled for homologous regions in the left hemisphere for each montage.
Figure 5.

High-definition MRI derived computational models of current density and flow. a) The CP3/CP4 model identified areas of peak increased current directionality in right posterior and superior parietal cortex, with lower levels of current intensity in posterior superior and middle temporal gyri. b.) The F3/F4 model identified areas of increased current directionality in inferior, middle, and superior frontal gyri. Peak current density = 0.21 A/m2
tDCS Procedure
Participants enrolled in three sessions on separate days spaced approximately one week apart (time range between sessions: 6–8 days). Each session used a different tDCS manipulation: frontal, parietal, or sham stimulation. tDCS was administered using a battery-driven, constant current Magstim Eldith device connected to two 25 cm2 saline-soaked square pads. Pad locations were determined using the International 10–20 EEG electrode placement system and pads kept in place using a rubber strap. All electrode montages administered right anode (CP4, F4) and left cathode (CP3, F3) stimulation. During Frontal (F3/F4) and Parietal (CP3/CP4) stimulation sessions, participants received 20m of 1.5 mA stimulation. During sham stimulation, participants underwent 30 s of 1.5 mA stimulation. The location of sham (F3/F4 or CP3/CP4) was counterbalanced across participants. Thirty seconds of stimulation was used in the sham condition to mimic sensation in real stimulation conditions and to serve as a control for both active stimulation conditions. All stimulation conditions used a 30s ramp time.
Experimental Stimuli
Participants saw separate blocks of launching events depicting either violations of spatial linearity (e.g., Figure 1a) or temporal contiguity (e.g., Figure 1b). Separate blocks were presented to avoid confounding tDCS effects with attentional mechanisms engaged using the instruction manipulation in Experiment 1. Spatial linearity was manipulated by varying the angle of egress for the second ball after contact of the first ball (0, 7.5, 11.25,315, 18.75, 22.5, 26.25, 30, 33.75, 37.25, 41.25, 45, 60). Temporal contiguity was manipulated by varying the time delay between contact of the first ball and initial movement of the second ball (time delays: 0, 16.7, 33.3, 50, 66.7, 83.3, 100, 116.7, 133.3, 150, 166.7, 200, and 267.7 ms). The distribution of stimulus parameters was chosen from pilot testing to increase sampling of events around the spatial and temporal points of ambiguity (50/50) for causality judgments. The sampling of spatial and temporal parameters was increased (n = 13) from Experiment 1 (n = 7) to maximize sensitivity to tDCS effects. Each stimulus parameter was repeated ten times for 130 trials per block and block order was counterbalanced across subjects. In all blocks, participants judged whether “the blue object caused the red object to move.” Instructions were identical to the Basic Instruction Condition instructions from Experiment 1 (see Table 1a). Neither space nor time was mentioned in instructions to participants. Judgments were made using either the index or middle finger of the right hand.
Behavioral Testing Procedure
Before stimulation, participants underwent a baseline condition of causality judgments. Each block of trials began with 10 representative practice trials, followed by 130 test trials. Following completion of baseline measurements, participants underwent the appropriate stimulation condition. During the first five minutes of frontal/parietal/sham stimulation, participants performed a task unrelated to our experimental task of interest to provide a consistent cognitive state during the initial period of stimulation. Furthermore, this task served to distract participants from the early physical sensations associated with stimulation to increase effectiveness of sham stimulation. During the initial five minutes, participants read as many of Aesop’s fables as quickly as possible while retaining information from the passages. Participants were instructed that they would indicate the last word read at the end of five minutes to assess reading rate and tested on reading comprehension at the end of the third testing session. At the end of session three, participants were debriefed regarding the purpose of the reading task. Reading comprehension was not measured. After five minutes of real/sham stimulation, spatial and temporal judgments of causality were measured a second time (i.e., during stimulation).
Behavioral Analyses
Participants’ data were analyzed using Generalized Linear Models (GenLM) in SPSS. Binary causal judgments were modeled as the dependent variable using the probit function in the SPSS GenLM procedure. Stimulation Location (Parietal, Frontal, Sham), Session (Baseline, During Stimulation) and Spatial or Temporal parameters were included in full factorial models. Interaction terms were non-mean centered. A significant Stimulation Location x Session interaction would suggest that at least one of the three stimulation conditions were significantly different from Baseline to During Stimulation testing of causal judgments. Pairwise comparisons were used to evaluate significant interactions. One subject’s data was excluded from GLMM analyses and subsequent analyses because change from Baseline to During Stimulation in the Sham condition was 3 standard deviations beyond change found in the other participants.
Results
Space
Results from GenLM of spatial judgments demonstrated a significant Session x Stimulation Location interaction (Wald χ2 = 6.6, DF = 2, p = .03). Session (Wald χ2 = 6.2, DF = 1, p = .01), Stimulus Location (Wald χ2 = 6.0, DF = 2, p = .04), and Angle (Wald χ2 = 2454, DF = 12, p < .001) were also significant in the model. Baseline performance was not significantly different between Stimulation Locations (Wald χ2 = 3.1, DF = 2, p = .2). Pairwise comparisons for the significant Session x Stimulation Location interaction demonstrated a significant decrease in the probability of causal judgment from Baseline to Stimulation for Frontal (Mean Difference (MD) = −6%, Standard Error (SE) = 2%, p = .003) and Parietal (MD = −4%, SE = 1.8%, p = .02) stimulation conditions (Figure 6a). Paired t-tests compared magnitude of change from Baseline to During Stimulation for sham vs. frontal (t = 3.7, DF = 12, p = .003) and sham vs. parietal (t = 2.2, DF = 12, p = .04) Stimulation Locations across spatial parameters and found significant differences between real and sham stimulation in both cases. Analyses of individual spatial parameters demonstrated that parietal stimulation reduced the probability of causal judgment for spatial parameters judged to have a 44–66% probability of representing a causal event at Baseline (Figure 7a). In contrast, frontal stimulation reduced the probability of causal judgment on a relatively broad range of spatial parameters (Figure 7b). There was no significant difference from Baseline to Stimulation in the Sham condition (MD = 1%, SE = 1.9%, p = .58). Sham stimulation did not significantly reduce the probability of causal judgment for any of the spatial parameters (Figure 7c).
Figure 6.
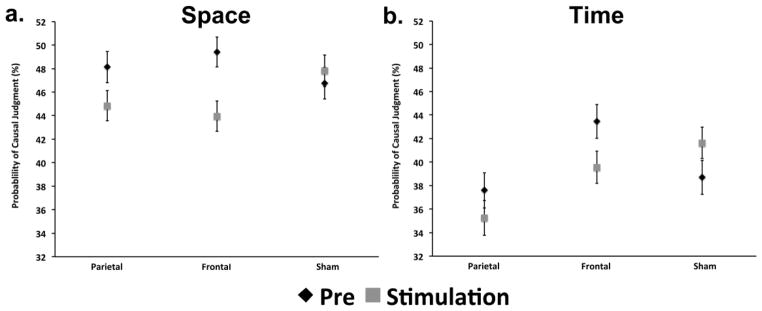
Effects of tDCS stimulation on a) spatial and b) temporal judgments of causality. Parietal stimulation significantly decreased the probability of causal judgment for spatial judgments of causality, while frontal stimulation significantly decreased the probability of causal judgment for spatial and temporal judgments. Sham stimulation did not significantly alter the probability of causal judgments for spatial or temporal judgments.
Figure 7.
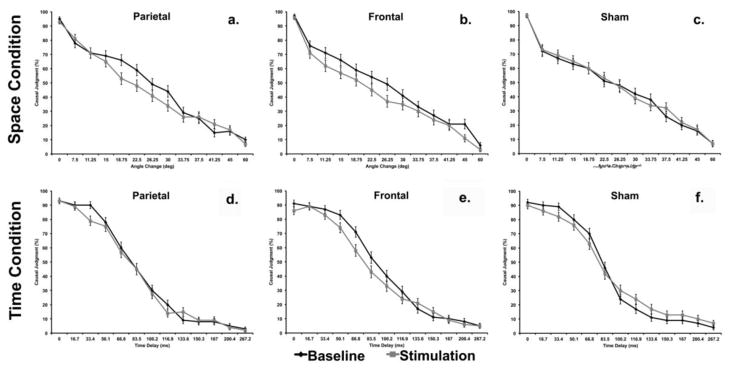
Effects of tDCS stimulation on individual parameters from Baseline to Stimulation, stratified by causality judgments based on spatial information (a–c), temporal information (d–f), and Stimulation Location.
Time
Results from GenLM of temporal judgments demonstrated a significant Session x Stimulation Location interaction (Wald χ2 = 6.5, DF = 2, p = .03). Stimulation Location (Wald χ2 = 12.9, DF = 2, p = .002) and Time (Wald χ2 = 4394, DF = 12, p < .001) were also significant in the model. Baseline performance was significantly different between frontal and parietal stimulation locations (Wald χ2 = 6.4, p = .04), but neither was significantly different from sham. Pairwise comparisons for the significant Session x Stimulation Location interaction demonstrated a significant decrease in the probability of causal judgment from Baseline to During Stimulation for the Frontal (MD = −4%, SE = 2%, p = .04) stimulation condition (Figure 6b). Paired t-tests compared magnitude of change from Baseline to During Stimulation for sham vs. frontal (t = 2.5, DF = 12, p = .03) conditions across temporal parameters and found significant differences between real and sham stimulation. Analyses of individual temporal parameters demonstrated that Frontal stimulation reduced the probability of causal judgment for temporal parameters judged to have a 53–83% probability of representing a causal event at Baseline (Figure 7e). There were not significant differences from Baseline to During Stimulation in the Parietal (MD = −2%, SE = 2.1%, p = .26; Sham vs. Parietal Paired t-test: t = 1.4, DF = 12, p = .17) or Sham conditions (MD = 3%, SE = 2%, p = .14). There were no consistent decreases or increases in the probability of causal judgment for spatial parameters following Parietal stimulation – one parameter increased, while another decreased (Figure 7d). Sham stimulation resulted in a decrease in the probability of causal judgment for only one of the thirteen temporal parameters (Figure 7f).
Discussion
Results from Experiment 2 demonstrated that parietal stimulation only altered perceptual causality based on spatial information. In contrast, frontal stimulation altered both spatial and temporal perception of causality. These data provide more direct insight into the function of these brain regions than can be obtained from BOLD fMRI alone. The data suggest that parietal contributions to perceptual causality revolve around their known contribution to elemental space perception. In contrast, the broad impact of frontal stimulation on perceptual causality is consistent with the frontal cortices broad role in decision-making.
General Discussion
The ability to perceive cause and effect in events is an essential feature of human cognition. This perception relies, in part, on sensitivity to spatial and temporal characteristics of events. While the neural instantiation of spatial and temporal representations have been well studied, we know very little about the neural instantiation of causality. The present study used fMRI (Experiment 1) to generate hypotheses about the neural correlates of causal perception, and transcranial direct current stimulation (Experiment 2) to test those hypotheses.
When participants were instructed to use spatial information to judge causality, their sensitivity to spatial parameters correlated with increased neural activation bilaterally in frontal and parietal regions. Right superior and inferior parietal cortices (IPC) might contribute to causality because of their role in spatial attention and representation (e.g., Singh-Curry and Husain, 2009; Straube and Chatterjee, 2010). Left IPC activity might integrate spatial and temporal information (Assmus et al., 2003). While inferior frontal gyri are not specifically implicated in spatial processing, they play an important role in perceptual decision-making, category selection, and response inhibition (Heekeren et al., 2008; Moss et al., 2005; Thielscher and Pessoa, 2007; Zhang et al., 2004, 2012). When participants were instructed to use temporal information to judge causality their sensitivity to temporal parameters correlated with increased activation in the vermis of the cerebellum (Lobule IX) and right hippocampus, regions implicated in processing temporal durations (Bueti et al, 2008; Gooch et al., 2011; Lee et al., 2007; Salman, 2002; Yin and Troger, 2011).
To identify the neural correlates of decision-making we analyzed participants’ RTs to making perceptual causality judgments. Difficult decisions take longer to make than easier ones and would be more likely to engage neural circuitry involved in decision-making (e.g., Wencil et al., 2010, see Appendix A). Increasing RTs when judging causality, across both conditions, evoked greater activation in the SMA, pre and post-central gyrus, RIFG, and anterior insula. SMA and pre and postcentral gyrus activation is consistent with processes important for motor preparation (Colebatch et al., 1991; Debaere et al., 2003; Picard and Strick, 2003; Yousry et al., 1997). In contrast, the RIFG is broadly implicated in perceptual decision-making (Thielscher and Pessoa, 2007; Wendelken et al., 2009; Zhang et al., 2012) and the anterior insular cortex plays roles in cognitive control and salient stimulus detection (Chang et al., 2013; Duncan and Owen 2000; Dosenbach et al. 2006; Menon and Uddin, 2010; Yarkoni et al., 2009). Recent research by Wende and Colleagues (in press) also suggests that the right inferior frontal gyrus may play a general role in causal judgments irrespective of context (e.g., perceptual, social, etc.; Wende et al., in press). Collectively, RIFG and insular cortex are thought to integrate sensory and cognitive information to facilitate goal-directed responses to stimuli in the environment (Dodds et al., 2011).
The fMRI results described above provide correlational evidence of brain regions related to space, time, and decision-making when perceiving causality in mechanical events. Based on these correlational results, we hypothesized that the parietal activations relate to spatial processing, while the frontal and insular activations relate to more general processing in decision-making, roles for which these brain regions are typically implicated. We used tDCS to test these lobe-based hypotheses and found that parietal stimulation affected spatial but not temporal perceptual causality judgments (Figure 7a and d), whereas frontal stimulation influenced both temporal and spatial causality judgments (Figure 7b and e). As an important control condition, sham stimulations did not alter causal judgments (Figure 7c and f).
Parietal stimulation resulted in more conservative attribution of causal relationships in spatial, but not temporal, variations of events. This finding is consistent with previous research suggesting that anodal stimulation of the right parietal cortex influences spatial processing of ambiguous stimuli (Straube et al., 2011). Collectively, these data confirm that parietal stimulation influences causal judgments by sensitizing participants’ to the contribution of space to the impression of causality.
Frontal stimulation resulted in more conservative perception of causal relationships in both spatial and temporal variations of mechanical collision events. Participants were less likely to perceive causality with violations of spatial continuity and temporal contiguity when stimulated in this region than when given sham stimulations. The generalized effect of frontal stimulation on both spatial and temporal conditions confirms our hypothesis that frontal cortices engage in generalized decision-making processes underlying causal perception. This hypothesis accords with reports of the effects of tDCS on prefrontal cortex in a variety of decision-making tasks (Feceteau et al., 2007; Hecht et al., 2010; Keeser et al., 2011) and general attentional processes (Laufs et al., 2003; Raichle et al., 2001; van de Heuvel et al., 2008; Nelson et al., in press). We cannot rule out the potential role of the insular cortex. Although the current density model for F3–F4 stimulation did not predict peak current changes in the insula, the model did predict mild to moderate changes in current for this region. Thus, change in insular activation may also contribute to the present findings, perhaps by modulating the perceived salience of the events. Future studies will investigate the distinct contribution of frontal versus insular cortices, contribution of right vs. left lateralized frontal and parietal cortices, and the other fMRI-generated neural hypotheses using both conventional and high-definition transcranial direction current stimulation.
As tDCS can facilitate neural plasticity (e.g., Bolognini et al., 2010; Kuo et al., 2013; Yoon et al., 2012), findings from the present study could have implications for treatment of some psychiatric symptoms. Difficulty comprehending the relationship between space, time, and causality is thought to contribute to obsessive tendencies in obsessive-compulsive disorder, paranoid delusions in schizophrenia, and difficulty understanding social relationships in autism spectrum disorder (Dettore, 2011; Ray and Schlottmann, 2007; Tschacher and Kupper, 2006). Some of these symptoms may reflect difficulty appropriately using space or time to judge causality. Impairments in causal judgments might arise from being too conservative or too liberal in accepting causal relationships, and not being flexible in establishing a proper threshold as appropriate for the context of an event.
Potential Limitations
The fMRI experiment in the present study did not control for eye movements during causality judgments. Eye movement data in the fMRI experiment would serve to further identify the elements (e.g., angle change or time delay) in the stimulus display on which participants focus their gaze when judging causality. As the present tDCS results cannot be used to infer lateralized roles of either frontal or parietal cortices, future studies using HD-tDCS targeting right vs. left lateralized effects or methods comparing 1mA stimulation changing left vs. right anode/cathode electrode placement in these lateralized brain regions could refine our understanding of the lateralization of causal perception. We also note that further research will be needed to translate present tDCS findings on a well-controlled laboratory task to clinical symptoms of psychiatric disorders. While the present findings are promising for future psychiatric research, we need deeper understanding of these systems before attempting to apply these methods in vulnerable populations.
Conclusions
Converging evidence from fMRI and tDCS reveals that the parietal cortex contributes to perceptual causality because of its role in processing spatial relations, while the frontal cortex contributes through its role in general decision-making. Distributed, yet coordinated, contribution from brain regions processing space, time, and decision-making may provide flexibility in human causal perception that is important for adaptation to changing contexts and circumstances. However, this same flexibility may predispose some psychiatric disorders to misattribute causality in events, a misattribution that might be amenable to tDCS treatment.
Supplementary Material
Highlights.
Transcranial direct current stimulation reduces the perception of causality
Frontal stimulation reduces causal perceptions of time and space
Parietal stimulation reduces causal perceptions of space
Parallel fMRI and tDCS provide direct probe of neural hypotheses
Acknowledgments
Funding: This work was supported by the National Institute of Health (T32NS007413, R01 DC008779, R24 HD050836), the Wallace H Coulter Foundation, and the McKnight Brain Research Foundation.
Footnotes
Publisher's Disclaimer: This is a PDF file of an unedited manuscript that has been accepted for publication. As a service to our customers we are providing this early version of the manuscript. The manuscript will undergo copyediting, typesetting, and review of the resulting proof before it is published in its final citable form. Please note that during the production process errors may be discovered which could affect the content, and all legal disclaimers that apply to the journal pertain.
References
- Assmus A, Marshall JC, Ritzl A, Noth J, Zilles K, Fink GR. Left inferior parietal cortex integrates time and space during collision judgments. Neuroimage. 2003;20:S82–S88. doi: 10.1016/j.neuroimage.2003.09.025. [DOI] [PubMed] [Google Scholar]
- Blakemore SJ, Boyer P, Pachot-Clouard M, Meltzoff A, Segebarth C, Decety J. The detection of contingency and animacy from simple animations in the human brain. Cereb Cortex. 2003;13:837–844. doi: 10.1093/cercor/13.8.837. [DOI] [PubMed] [Google Scholar]
- Blakemore SJ, Fonlupt P, Pachot-Clouard M, Darmon C, Boyer P, Meltzoff AN, et al. How the brain perceives causality: an event-related fMRI study. Neuroreport. 2001;12:3741–3746. doi: 10.1097/00001756-200112040-00027. [DOI] [PubMed] [Google Scholar]
- Blos J, Chatterjee A, Kircher T, Straube B. Neural correlates of causality judgment in physical and social context: the reversed effects of space and time. Neuroimage. 2012;63:882–893. doi: 10.1016/j.neuroimage.2012.07.028. [DOI] [PubMed] [Google Scholar]
- Bolognini N, Fregni F, Casati C, Olgiati E, Vallar G. Brain polarization of parietal cortex augments training-induced improvement of visual exploratory and attentional skills. Brain Res. 2010;1349:76–89. doi: 10.1016/j.brainres.2010.06.053. [DOI] [PubMed] [Google Scholar]
- Bueti D, Walsh V, Frith C, Rees G. Different brain circuits underlie motor and perceptual representations of temporal intervals. J Cogn Neurosci. 2008;20:204–214. doi: 10.1162/jocn.2008.20017. [DOI] [PubMed] [Google Scholar]
- Buehner MJ, Humphreys G. Causal contraction: spatial binding in the perception of collision events. Psychol Sci. 2010;21:44–48. doi: 10.1177/0956797609354735. [DOI] [PubMed] [Google Scholar]
- Buehner MJ, May J. Knowledge mediates the timeframe of covariation assessment in human causal induction. Think Reasoning. 2002;8:269–295. [Google Scholar]
- Buehner MJ, May J. Rethinking temporal contiguity and the judgment of causality: effects of prior knowledge, experience, and reinforcement procedure. Q J Exp Psychol A. 2003;56A:865–890. doi: 10.1080/02724980244000675. [DOI] [PubMed] [Google Scholar]
- Chang LJ, Yarkoni T, Khaw MW, Sanfey AG. Decoding the role of the insula in human cognition: functional parcellation and large-scale reverse inference. Cereb Cortex. 2013;23:739–749. doi: 10.1093/cercor/bhs065. [DOI] [PMC free article] [PubMed] [Google Scholar]
- Chatterjee A. A madness to the methods in cognitive neuroscience? Journal of Cognitive Neuroscience. 2005;17:847–849. doi: 10.1162/0898929054021085. [DOI] [PubMed] [Google Scholar]
- Colebatch JG, Deiber MP, Passingham RE, Friston K, Frackowiak RSJ. Regional cerebral blood flow during voluntary arm and hand movements in human subjects. J Neurophysiol. 1991;65:1392–1401. doi: 10.1152/jn.1991.65.6.1392. [DOI] [PubMed] [Google Scholar]
- Datta A, Bansal V, Diaz J, Patel J, Reato D, Bikson M. Gyri-precise head model of transcranial DC stimulation: Improved spatial focality using a ring electrode versus conventional rectangular pad. Brain Stimulation. 2009;2:201–207. doi: 10.1016/j.brs.2009.03.005. [DOI] [PMC free article] [PubMed] [Google Scholar]
- Debaere F, Wenderoth N, Sunaert S, Van Hecke P, Swinnen SP. Internal vs external generation of movements: differential neural pathways involved in bimanual coordination performed in the presence or absence of augmented visual feedback. Neuroimage. 2003;19:764–776. doi: 10.1016/s1053-8119(03)00148-4. [DOI] [PubMed] [Google Scholar]
- Dettore D. Obsessive-compulsive disorder and thinking illusions. Psicoterapia Cognitiva e Comportamentale. 2011;17:381–394. [Google Scholar]
- Dodds CM, Morein-Zamir S, Robbins TW. Dissociating inhibition, attention, and response control in the frontoparietal network using functional magnetic resonance imaging. Cereb Cortex. 2011;21:1155–1165. doi: 10.1093/cercor/bhq187. [DOI] [PMC free article] [PubMed] [Google Scholar]
- Dosenbach NU, Visscher KM, Palmer ED, Miezin FM, Wenger KK, Kang HC, et al. A core system for the implementation of task sets. Neuron. 2006;50:799–812. doi: 10.1016/j.neuron.2006.04.031. [DOI] [PMC free article] [PubMed] [Google Scholar]
- Duncan J, Owen AM. Common regions of the human frontal lobe recruited by diverse cognitive demands. Trends Neurosci. 2000;23:475–483. doi: 10.1016/s0166-2236(00)01633-7. [DOI] [PubMed] [Google Scholar]
- Eickhoff SB, Paus T, Caspers S, Grosbras MH, Evance AC, Zilles K, et al. Assignment of functional activations to probabilistic cytoarchitectonic areas revisited. Neuroimage. 2007;36:511–521. doi: 10.1016/j.neuroimage.2007.03.060. [DOI] [PubMed] [Google Scholar]
- Feceteau S, Pascual-Leone A, Zald DH, Liguori P, Theoret H, Boggio PS, et al. Activation of prefrontal cortex by transcranial direct current stimulation reduces appetite for risk during ambiguous decision making. J Neurosci. 2007;27:6212–6218. doi: 10.1523/JNEUROSCI.0314-07.2007. [DOI] [PMC free article] [PubMed] [Google Scholar]
- Fonlupt P. Perception and judgment of physical causality involve different brain structures. Cogn Brain Res. 2003;17:248–254. doi: 10.1016/s0926-6410(03)00112-5. [DOI] [PubMed] [Google Scholar]
- Friston KJ. Statistical Parametric Mapping: Ontology and Current Issues. J Cereb Blood Flow Metab. 1995;15:361–370. doi: 10.1038/jcbfm.1995.45. [DOI] [PubMed] [Google Scholar]
- Fugelsang JA, Roser ME, Corballis PM, Gazzaniga MS, Dunbar KN. Brain mechanisms underlying perceptual causality. Cogn Brain Res. 2005;24:41–47. doi: 10.1016/j.cogbrainres.2004.12.001. [DOI] [PubMed] [Google Scholar]
- Gooch CM, Wiener M, Hamilton AC, Coslett HB. Temporal discrimination of sub- and suprasecond time intervals: a voxel-based lesion mapping analysis. Front in Integrative Neurosci. 2011;5:59. doi: 10.3389/fnint.2011.00059. [DOI] [PMC free article] [PubMed] [Google Scholar]
- Gruber HE, Fink CD, Damm V. Effects of experience on the perception of causality. J Exp Psychol. 1957;53:89–93. doi: 10.1037/h0048506. [DOI] [PubMed] [Google Scholar]
- Guski R, Troje NF. Audiovisual phenomenal causality. Perception and Psychophysics. 2003;65:789–800. doi: 10.3758/bf03194815. [DOI] [PubMed] [Google Scholar]
- Hecht D, Walsh V, Lavidor M. Transcranial direct current stimulation facilitates decision making in a probabilistic guessing task. J Neurosci. 2010;30:4241–4245. doi: 10.1523/JNEUROSCI.2924-09.2010. [DOI] [PMC free article] [PubMed] [Google Scholar]
- Heekeren HR, Marrett S, Ungerleider LG. The neural systems that mediate human perceptual decision making. Nature Neurosci. 2008;9:467–479. doi: 10.1038/nrn2374. [DOI] [PubMed] [Google Scholar]
- Keeser D, Padberg F, Reisinger E, Pogarell O, Kirsch V, Palm U, et al. Prefrontal direct current stimulation modulates resting EEG and event-related potentials in healthy subjects: a standardized low resolution tomography. sLORETA. study. Neuroimage. 2011;55:644–657. doi: 10.1016/j.neuroimage.2010.12.004. [DOI] [PubMed] [Google Scholar]
- Kuo HI, Bikson M, Datta A, Minhas P, Paulus W, Kuo MF, et al. Comparing cortical plasticity induced by conventional and high-definition 4 × 1 ring tDCS: A neurophysiological study. Brain Stimulation. 2013;6:644–648. doi: 10.1016/j.brs.2012.09.010. [DOI] [PubMed] [Google Scholar]
- Laufs H, Krakow K, Sterzer P, Eger E, Beyerle A, Salek-Haddadi A, et al. Electroencephalographic signatures of attentional and cognitive default modes in spontaneous brain activity fluctuations at rest. Proc Natl Acad Sci USA. 2003;100:11053–11058. doi: 10.1073/pnas.1831638100. [DOI] [PMC free article] [PubMed] [Google Scholar]
- Lee K-H, Egelston PN, Brown WH, Gregory AN, Braker AT, Woodruff PWR. The role of the cerebellum in subsecond time perception: evidence from repetitive transcranial magnetic stimulation. J Cogn Neurosci. 2007;19:147–157. doi: 10.1162/jocn.2007.19.1.147. [DOI] [PubMed] [Google Scholar]
- Leslie AM. The perception of causality in infants. Perception. 1982;11:173–186. doi: 10.1068/p110173. [DOI] [PubMed] [Google Scholar]
- Leslie AM. Spatiotemporal continuity and the perception of causality in infants. Perception. 1984;13:287–305. doi: 10.1068/p130287. [DOI] [PubMed] [Google Scholar]
- Leslie AM, Keeble S. Do six-month-old infants perceive causality? Cognition. 1987;25:265–288. doi: 10.1016/s0010-0277(87)80006-9. [DOI] [PubMed] [Google Scholar]
- Menon V, Uddin LQ. Saliency, switching, attention and control: a network model of insula function. Brain Struct Funct. 2010;214:655–667. doi: 10.1007/s00429-010-0262-0. [DOI] [PMC free article] [PubMed] [Google Scholar]
- Michotte AE. In: The Perception of Causality. Miles TR, Miles E, editors. London: Methuen; 1946/1963. [Google Scholar]
- Moss HE, Abdallah S, Fletcher P, Bright P, Pilgrim L, Acres K, et al. Selecting among competing alternatives: selection and retrieval in the left inferior frontal gyrus. Cereb Cortex. 2005;15:1723–1735. doi: 10.1093/cercor/bhi049. [DOI] [PMC free article] [PubMed] [Google Scholar]
- Nelson JT, McKinley RA, Golob EJ, Warm JS, Parasuraman R. Enhancing vigilance in operators with prefrontal cortex transcranial direct current stimulation. tDCS. Neuroimage. doi: 10.1016/j.neuroimage.2012.11.061. in press. [DOI] [PubMed] [Google Scholar]
- Nichols T, Brett M, Andersson J, Wager T, Poline JB. Valid conjunction inference with the minimum statistic. Neuroimage. 2005;25:653–660. doi: 10.1016/j.neuroimage.2004.12.005. [DOI] [PubMed] [Google Scholar]
- Oakes LM, Cohen LB. Infant perception of a causal event. Cogn Dev. 1990;5:193–207. [Google Scholar]
- Picard N, Strick PL. Activation of the supplementary motor area. SMA. during performance of visually guided movements. Cereb Cortex. 2003;13:977–986. doi: 10.1093/cercor/13.9.977. [DOI] [PubMed] [Google Scholar]
- Powesland PF. The effect of practice upon the perception of causality. Can J Psychol. 1959;13:155–168. doi: 10.1037/h0083773. [DOI] [PubMed] [Google Scholar]
- Raichle ME, MacLeod AM, Snyder AZ, Powers WJ, Gusnard DA, Shulman GL. A default mode of brain function. Proc Natl Acad Sci USA. 2001;98:676–682. doi: 10.1073/pnas.98.2.676. [DOI] [PMC free article] [PubMed] [Google Scholar]
- Ray ED, Schlottmann A. The perception of social and mechanical causality in young children with ASD. Res Autism Spect Dis. 2007;1:266–280. [Google Scholar]
- Roser ME, Fugelsang JA, Dunbar KN, Corballis PM, Gazzaniga MS. Dissociating processes supporting causal perception and causal inference in the brain. Neuropsychology. 2005;19:591–602. doi: 10.1037/0894-4105.19.5.591. [DOI] [PubMed] [Google Scholar]
- Salman MS. The cerebellum: it’s about time! but timing is not everything-new insights into the role of the cerebellum in timing motor and cognitive tasks. J Child Neurol. 2002;17:1–9. doi: 10.1177/088307380201700101. [DOI] [PubMed] [Google Scholar]
- Schlottmann A. Seeing it happen and knowing how it works: how children understand the relation between perceptual causality and underlying mechanisms. Dev Psychol. 1999;3:303–317. doi: 10.1037//0012-1649.35.1.303. [DOI] [PubMed] [Google Scholar]
- Scholl BJ, Tremoulet P. Perceptual causality and animacy. Trends Cogn Sci. 2000;4:299–309. doi: 10.1016/s1364-6613(00)01506-0. [DOI] [PubMed] [Google Scholar]
- Shanks DR. Forward and backward blocking in human contingency judgment. Q J Exp Psychol B. 1985;37:1–21. [Google Scholar]
- Singh-Curry V, Husain M. The functional role of the inferior parietal lobe in the dorsal and ventral stream dichotomy. Neuropsychologia. 2009;47:1434–1448. doi: 10.1016/j.neuropsychologia.2008.11.033. [DOI] [PMC free article] [PubMed] [Google Scholar]
- Straube B, Chatterjee A. Space and time in perceptual causality. Front Human Neurosci. 2010;4:1–10. doi: 10.3389/fnhum.2010.00028. [DOI] [PMC free article] [PubMed] [Google Scholar]
- Straube B, Wolk D, Chatterjee A. The role of the right parietal lobe in the perception of causality: a tDCS study. Exp Brain Res. 2011;215:315–325. doi: 10.1007/s00221-011-2899-1. [DOI] [PubMed] [Google Scholar]
- Thielscher A, Pessoa L. Neural Correlates of Perceptual Choice and Decision Making during Fear–Disgust Discrimination. J Neurosci. 2007;27:2908–2917. doi: 10.1523/JNEUROSCI.3024-06.2007. [DOI] [PMC free article] [PubMed] [Google Scholar]
- Tschacher W, Kupper Z. Perception of causality in schizophrenia spectrum disorder. Schizophr Bull. 2006;32:106–112. doi: 10.1093/schbul/sbl018. [DOI] [PMC free article] [PubMed] [Google Scholar]
- van den Heuvel M, Mandl R, Luigjes J, Hulshoff Pol H. Microstructural organization of the cingulum tract and the level of default mode functional connectivity. J Neurosci. 2008;28:10844–10851. doi: 10.1523/JNEUROSCI.2964-08.2008. [DOI] [PMC free article] [PubMed] [Google Scholar]
- Wencil EB, Aguirre GK, Coslett HB, Chatterjee A. Carving the clock at its component joints: Neural basis for interval timing. J Neurophysiol. 2010;104:160–8. doi: 10.1152/jn.00029.2009. [DOI] [PMC free article] [PubMed] [Google Scholar]
- Wende KC, Nagels A, Blos J, Stratmann M, Chatterjee A, Kircher T, et al. Differences and commonalities in the judgment of causality in physical and social contexts: an fMRI study. Neuropsychologia. doi: 10.1016/j.neuropsychologia.2013.07.027. in press. [DOI] [PubMed] [Google Scholar]
- Wendelken C, Ditterich J, Bunge SA, Carter CS. Stimulus and response conflict processing during perceptual decision-making. Cogn Affect Behav Neurosci. 2009;9:437–447. doi: 10.3758/CABN.9.4.434. [DOI] [PubMed] [Google Scholar]
- Wolff P. Representing causation. J Exp Psychol: Gen. 2007;136:82–111. doi: 10.1037/0096-3445.136.1.82. [DOI] [PubMed] [Google Scholar]
- Wolff P. Dynamics and the perception of causal events. In: Shipley TF, Zacks JM, editors. Understanding Events. New York: Oxford University Press; 2008. pp. 555–585. [Google Scholar]
- Wolpert L. Casual belief and the origins of technology. Philos Trans R Soc Lond A. 2003;361:1709–1719. doi: 10.1098/rsta.2003.1231. [DOI] [PubMed] [Google Scholar]
- Wolpert L. Six Impossible Things Before Breakfast. London: Faber & Faber; 2006. [Google Scholar]
- Wolpert L. Cognition: evolution does help to explain how minds work. Nature. 2009;459:506. doi: 10.1038/459506a. [DOI] [PubMed] [Google Scholar]
- Woods AJ, Lehet M, Chatterjee A. Context modulates the contribution of time and space in causal inference. Front Psychol. 2012;3:371. doi: 10.3389/fpsyg.2012.00371. [DOI] [PMC free article] [PubMed] [Google Scholar]
- Yarkoni T, Poldrack RA, Nichols TE, Van Essen DC, Wager TD. Large-scale automated synthesis of human functional neuroimaging data. Nat Methods. 2011;8:665–670. doi: 10.1038/nmeth.1635. [DOI] [PMC free article] [PubMed] [Google Scholar]
- Yin B, Troger AB. Exploring the 4th dimension: hippocampus, time, and memory revisited. Front Integrative Neurosci. 2011;5:36. doi: 10.3389/fnint.2011.00036. [DOI] [PMC free article] [PubMed] [Google Scholar]
- Yoon KJ, Oh BM, Kim DY. Functional improvement and neuroplastic effects of anodal transcranial direct current stimulation. tDCS. delivered 1 day vs. 1 week after cerebral ischemia in rats. Brain Res. 2012;1452:61–72. doi: 10.1016/j.brainres.2012.02.062. [DOI] [PubMed] [Google Scholar]
- Yousry TA, Schmid UD, Alkadhi H, Schmidt D, Peraud A, Buettner A, Winkler P. Localization of the motor hand area to a knob on the precentral gyrus. A new landmark. Brain. 1997;120:141–157. doi: 10.1093/brain/120.1.141. [DOI] [PubMed] [Google Scholar]
- Zhang JX, Feng CM, Fox PT, Gao JH, Tab LH. Is left inferior frontal gyrus a general mechanism for selection? Neuroimage. 2004;23:596–603. doi: 10.1016/j.neuroimage.2004.06.006. [DOI] [PubMed] [Google Scholar]
- Zhang J, Hughes LE, Rowe JB. Selection and inhibition mechanisms for human voluntary action decisions. Neuroimage. 2012;63:392–402. doi: 10.1016/j.neuroimage.2012.06.058. [DOI] [PMC free article] [PubMed] [Google Scholar]
Associated Data
This section collects any data citations, data availability statements, or supplementary materials included in this article.