Abstract
In order to maintain its turgor pressure at a desired homeostatic level, budding yeast, Saccharomyces cerevisiae responds to the external variation of the osmotic pressure by varying its internal osmotic pressure through regulation of synthesis and transport of the intracellular glycerol. Hog1PP (dually phosphorylated Hog1), a final effector in the signalling pathway of the hyper osmotic stress, regulates the glycerol synthesis both at transcriptional and non-transcriptional stages. It is known that for a step-change in salt concentration leading to moderate osmotic shock, Hog1PP activity shows a transient response before it returns to the vicinity of pre-stimulus level. It is believed that an integrating process in a negative feedback loop can be a design strategy to yield such an adaptive response. Several negative feedback loops have been identified in the osmoadaptation system in yeast. However, the precise location of the integrating process in the osmoadaptation system which includes signalling, gene regulation, metabolism and biophysical modules is unclear. To address this issue, we developed a reduced model which captures various experimental observations of the osmoadaptation behaviour of wild type and mutant strains. Dynamic simulations and steady state analysis suggested that known information about the osmoadaptation system of budding yeast does not necessarily give a perfect integrating process through the known feedback loops of Hog1PP. On the other hand, regulation of glycerol synthesising enzyme degradation can result in a near integrating process leading to a near-perfect adaptation.
Electronic supplementary material
The online version of this article (doi:10.1007/s11693-013-9126-2) contains supplementary material, which is available to authorized users.
Keywords: Osmoadaptation, Hog1PP, Integral control, HOG pathway, Osmotic stress response, Perfect adaptation, Systems analysis
Introduction
Osmoadaptation in budding yeast, Saccharomyces cerevisiae represents a complex regulatory system that mediates osmotic stress. Upon osmotic shock, the cell shrinks due to the loss of turgor pressure with dire consequences for its survival. The recovery of the turgor pressure is achieved by enhancing synthesis of an intracellular osmolyte, such as glycerol. Experimental observations show that upon small to moderate shocks, the concentration of the key signalling molecule (Hog1PP) returns to the vicinity of its pre-shock levels indicating near-perfect adaptation (Adrover et al. 2011; Klipp et al. 2005; Macia et al. 2009; Muzzey et al. 2009). When subjected to larger shocks, Hog1PP demonstrates adaptation, albeit with larger deviations from its pre-shock value (Van Wuytswinkel et al. 2000). It is, therefore, of interest to understand how the complex osmoadaptation system, consisting of several feedback loops, could achieve near-perfect adaptation at moderate stress level and imperfect adaptation at higher stress level. Regardless of the strains, it is important to derive a plausible physiological implementation of the mechanism, which can explain the various degrees of adaptation at different shock levels as seen experimentally (Adrover et al. 2011; Klipp et al. 2005; Muzzey et al. 2009). Such an analysis helps in gaining a system-level insight into the single cell behaviour.
Negative feedbacks with an integrating process are known to impart perfect adaptation. Note that the variability in measurements and heterogeneity in cell population rules out verification of a truly perfect adaptation and we therefore use the term near-perfect adaptation. One of the first studies to address the issue of near-perfect adaptation was by Muzzey et al. (2009), who argued that there must be an integrating process in the glycerol producing machinery (GPM). You et al. (2012) have also suggested presence of such an integrating process in the GPM in osmoadaptation of C. albicans. However, the GPM includes several processes which are regulated by various enzymes. Thus, one of the unanswered questions in the osmoadaptation system is the precise location of the integrating process in the GPM. The osmoadaptation system has been explored by integrating vast amounts of data to identify specific mechanisms responsible for the observed adaptation behaviour (Mettetal et al. 2008; Schaber et al. 2012). The molecular interaction map of the system has been well characterised (Hohmann 2002) and resulted in development of detailed mathematical models (Klipp et al. 2005; Parmar et al. 2009). However, only a system-wide analysis can answer fundamental questions, such as (1) is perfect adaptation feasible in osmoadaptation system of yeast?; (2) is the adaptation behaviour robust against variation of system parameters?; and (3) why does a cell fail to give near-perfect adaptation when subjected to higher osmotic stress? To address this, we make use of mechanisms in the various detailed models to develop a reduced system-level model which captures the key features of the detailed model. It should be noted that while the detailed model is likely to be quantitatively accurate, a reduced model can aid in identifying system-level properties through analysis. In particular, the reduced model of osmoadaptation system is based on the error in the turgor pressure, that is, the deviation of turgor pressure from its pre-shock value. Our analysis indicates that the stability of the glycerol synthesising enzymes could be one of the crucial mechanisms responsible for the near-perfect adaptation at low stress level and imperfect adaptation at higher stress level.
Reduced model of osmoadaptation system in yeast S. cerevisiae
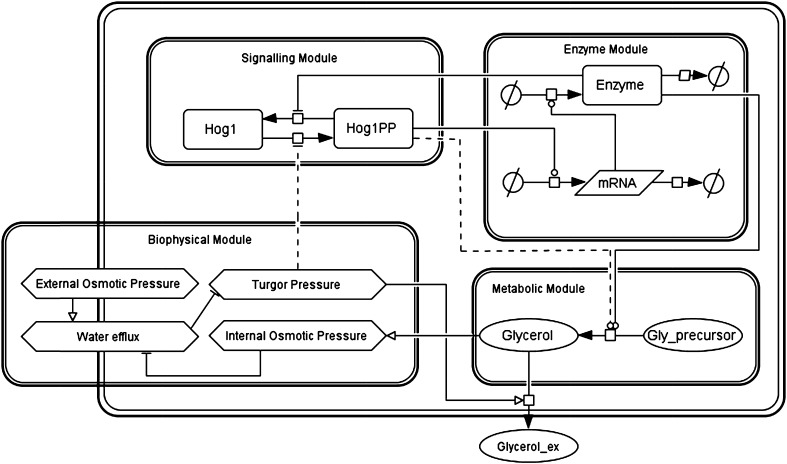
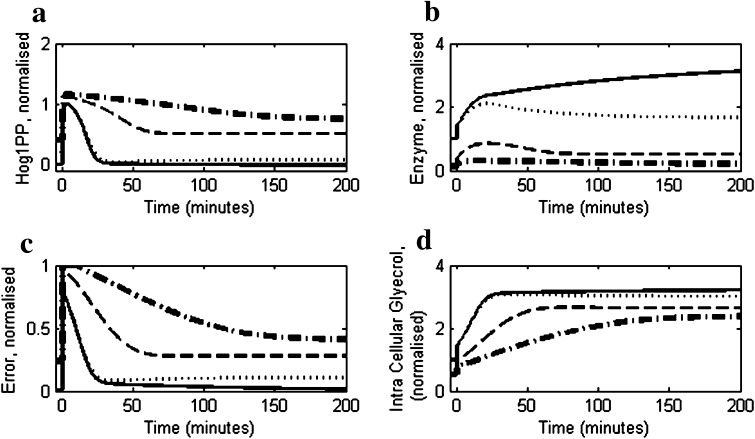
A system-level model of osmoadaptation in yeast S. cerevisiae can be visualised as consisting of four sub-systems namely, signalling, enzyme, metabolic and biophysical modules (Fig. 1). As current study is focused on a single cell behaviour during osmoadaptation period, we have considered that the external volume, i.e. volume of medium in which cell is growing, is large compared to the volume of a single cell. Below, we briefly describe the four modules and their roles in the osmoadaptation system.
Fig. 1.
Schematic of osmoadaptation system of Saccharomyces cerevisiae. The system representation consists of four modules namely, signalling, enzyme, metabolic and biophysical modules. On increase in osmotic pressure of medium, the turgor pressure decreases in the biophysical module, this in turn activates the signalling module. The activation of the signalling module results in the phosphorylation of Hog1, which is translocated to the nucleus. Hog1PP directly triggers synthesis of glycerol (see dashed line connecting Hog1PP to metabolic module) in addition to the transcription mediated synthesis through enzyme GPP2. The glycerol synthesis enzymes transcribed in the enzyme module channels the glycolytic flux towards glycerol synthesis in the metabolic module, which further restores the turgor pressure in the biophysical module. Thus, the error in the turgor pressure caused due to osmotic stress is eliminated
Biophysical module
Upon osmotic shock, the external osmotic pressure (πe) increases due to increase in the salt concentration in the external medium, thereby lowering the cell volume. This, in turn, increases the internal osmotic pressure (πi) and reduces the turgor pressure (πt). The adaptation process consists of recovering turgor pressure (πt) back to its pre-shock level (πt0), which can be characterised by error in the turgor pressure as follows,
 |
1 |
The biophysical module presented here is based on the model represented by Klipp et al. (2005) and Parmar et al. (2009). The turgor pressure recovery is brought about by a reorientation of the metabolic pathway that results in enhanced glycerol accumulation, thereby increasing the internal osmotic pressure (πi), which is modelled as follows,
 |
2 |
 |
3 |
where nT represents total concentration of intracellular osmolyte which includes glycerol (G) as well as other osmolyte (N0, X)., V0 and V(t) represent the cell volume before shock and after a lapse of time t post shock, respectively. Consistent with the assumption made in Schaber et al. (2012), we assume that the other osmolytes are not up-regulated and remain inside the cell without any transport to the medium during the adaptation. The enhanced internal osmotic pressure on account of osmolyte accumulation aids in the recovery of cell volume, which can be modeled as,
 |
4 |
Recovery of turgor pressure is assumed to be linearly related to the cell volume as follows,
 |
5 |
where kp and C1 are constants and ΔV represents the deviation in cell volume from its pre-shock level and is a primary indicator of the effect of the shock (Petelenz-Kurdziel et al. 2011). The error in turgor pressure defined in Eq. 1, can be related to volume changes as follows,
 |
6 |
The magnitude of the above error activates the HOG pathway response in the signalling module, as discussed next.
Signalling module
The signalling pathway has been well characterised and consists of two independent branches, each consisting of several components and these branches eventually phosphorylate Hog1 (Hohmann 2002). In the reduced model however, we assume that the Hog1 activation (dual phosphorylation) is a monotonic function of error in turgor pressure. Note that we have assumed that intermediate steps from the change in turgor pressure sensed by Sho1 and Sln1 branches leading to dual phosphorylation of Hog1 are fast relative to the downstream processes. This assumption allows a direct relationship between activation of Hog1 and loss of turgor pressure. Although not identical, this assumption is qualitatively consistent with the reduced model given by Schaber et al. (2012) in which they have assumed that Hog1 activation rate is directly proportional to the deviation of turgor pressure from the pre-shock value. Another mechanism is the deactivation (dephosphorylation) of Hog1PP (a dualy phosphorylated Hog1), which occurs due to presence of a basal level of phosphatase as well as through a negative feedback regulation which up-regulates PTP phosphatase due to Hog1PP. Thus, the activation of Hog1PP in response to error in the turgor pressure, can be modelled as follows,
 |
7 |
where  represents the dilution rate due to increase in cell volume (V). The first, second and third terms on the right hand side of Eq. 7 represent error induced activation, PTP induced dephosphorylation and basal dephosphorylation with corresponding rate constants KHOG, KD,HOG,PTP and KD,HOG, respectively. Hog1T0 represents the total initial Hog1 concentration consisting of the phosphorylated and unphosphorylated species. Ph0 represents the initial basal phosphatase concentration. It should be noted that both total Hog1 and basal phosphatase concentration levels vary during the course of adaptation due to variation in the cell volume, therefore, the dilution effects was incorporated by multiplying the volume ratio (V0/V(t)) to both Hog1T and Ph0. Parameters n1, n2 and Km1, KmPTP are the coefficients and half saturation constants, respectively. Kb,HOG represents the basal phosphorylation rate of Hog1PP. The PTP level is considered as identical to other enzyme level, which is quantified in the next section.
Enzyme module
Hog1PP in nucleus acts as a transcriptional activator for several genes including GPD1, GPP2 and PTP. It can be noted that glycerol-3-phosphate dehydrogenase (GPD1), glycerol-1-phosphatase (GPP2) and many other enzymes are responsible for the synthesis of glycerol by up-regulation of metabolic flux towards glycerol (Norbeck and Blomberg 1997; Rep et al. 1999). As in the previously reported models, we pooled all the Hog1PP regulated enzymes into a single enzyme called E. The transcription of genes for E is modelled as follows,
 |
8 |
where mRNA refers to concentration of mRNA, Krna and KD,rna are rate constants for transcription and degradation, respectively.
Further, the translation process yields the enzyme concentration, E, modeled as follows,
 |
9 |
where KE and KD,E are rate constants for translation and degradation rates of E, respectively.
It should be noted that enzyme E represents the net active protein after the post translation modification and is available for glycerol synthesis. Previous models assume a fixed low degradation rate constant for enzymes. However, it is known that during hyper osmotic stress, proteins are susceptible to damage and subsequently several molecular chaperones are upregulated (Hohmann 2002). These molecular chaperones are known to play a key role in protein stability. Moreover, glycerol and trehalose are now widely accepted as protein stabilisers under stressed conditions (Jain and Roy 2010; Street et al. 2006). Further, at higher stress, toxicity of the medium and availability of resources for post translation modification could play a major role. To qualitatively capture these two antagonistic effects in the hyper osmotic shock, we assume a regulated degradation of enzyme E, which depends on external osmolyte concentration (Osmex) and the enzyme level (E). This regulated enzyme degradation is modelled as follows,
 |
10 |
where KD,E0 is the maximum degradation rate constant of the enzyme and corresponds to degradation in the absence of external osmolyte. n3, n4 and Km3, Km4 correspond to Hill coefficients and half saturation constants, respectively. It is clear from Eq. 10 that the degradation of enzyme is significant only at a critical higher enzyme levels. The effect of external osmolyte (i.e. Osmex) on the degradation rate represented by a Hill type expression (in Eq. 10) captures the stabilization of enzyme through the upregulated internal osmolytes and chaperons (Hohmann 2002).
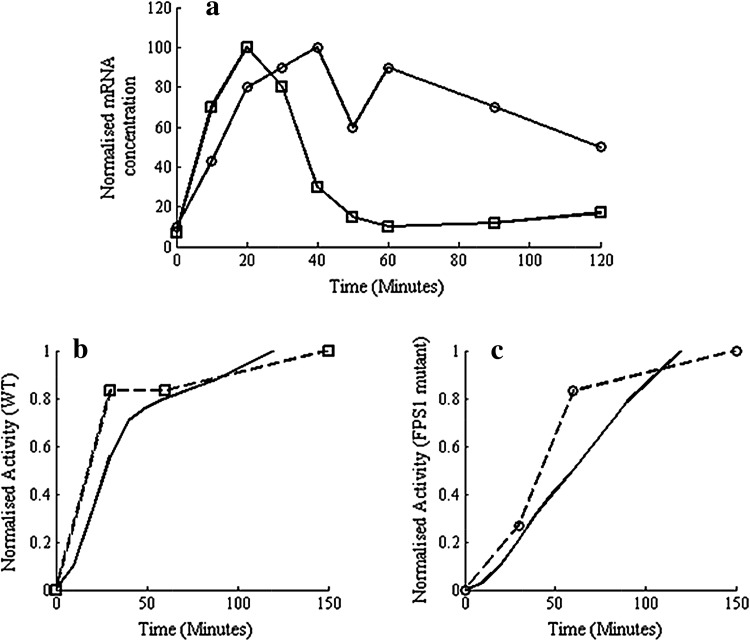
The above regulated degradation of enzyme is based on analysis of experimental observations of mRNA and enzyme activity reported by Klipp et al. (2005). Figure 2a shows the mRNA profiles for the wild type and a mutant in which FPS1, a glycerol transporter membrane protein (Tamás et al. 1999), is made putatively open, for cells in a 0.5 M NaCl solution, (re-plotted from the data in Klipp et al. (2005)). Note that the unregulated expression of FPS1 increases leakage of glycerol thereby reducing the ability of the cell to adapt. Equation 9 indicates that a linearly proportional relationship between the enzyme activity and the integral of measured mRNA would imply that the degradation rate constant KD,E as well as dilution rate are negligible, that is,  . Figure 2b, c compare the integral of the mRNA with the measured enzyme activity for wild type and mutant, respectively. It can be seen from Fig. 2b that in case of WT exposed to moderate shock (0.5 M NaCl), the enzyme profile closely matches with the integral of mRNA. However, in case of FPS1 over-expressed mutant, the glycerol synthesis is highly up-regulated to compensate for higher glycerol transportation and the integral of mRNA continues to increase due to up-regulated Hog1PP, while the enzyme level tends to saturate (see Fig. 2c). This implies that if measurements of protein activity are indication of enzyme concentration, then the degradation rate constant at high enzyme concentration is not negligible. In summary, the experimental data of (Klipp et al. 2005) suggests that,
At low enzyme levels, since the integral of mRNA matches with the enzyme level, the enzyme degradation is negligible, that is the enzyme is stable (see Fig. 2a, b).
At high enzyme levels, since measured protein activity tends to saturate while integral of mRNA increases, the degradation of enzyme is not negligible as compared to the synthesis.
Fig. 2.
Enzyme synthesis integrates mRNA expression in time for wild type but not for a mutant with unregulated FPS1. a mRNA (GPD1) expression (Klipp et al. 2005) for wild type and the mutant with unregulated FPS1 to 0.5 M NaCl shock. The data obtained from Klipp et al. (2005) was replotted. The symbols open squares and open circles indicate wild type and mutant, respectively. b Comparison of integral of mRNA and GPD1 activity in wild type (data from Klipp et al. (2005) replotted) with integral of mRNA levels shown in (a). c Comparison of integral of mRNA and enzyme activity for the mutant
The regulated enzyme degradation model presented in Eq. 10 can capture the above observations.
Metabolite module
The common pool of enzymes represented by E, catalyses the glycolytic metabolites (G3P, DHAP, etc.) into glycerol in a single step. Recently, a non-transcriptional upregulation of glycerol synthesis by Hog1PP has been reported by Petelenz-Kurdziel et al. (2013), which suggest a role of Hog1PP dependent activation of Pfk26/27 in stabilising glycolytic flux. Further, the study has suggested that such regulation diverts metabolic flux from biomass to intermediates of glycerol and therefore ensures stable glycerol flux (Petelenz-Kurdziel et al. 2013). Also Westfall et al. (2008) have shown that Hog1PP dependence is critical for the glycerol synthesis during hyper osmotic stress. Therefore, in the current model, we assumed that the glycerol synthesis is mainly regulated by the enzyme E and Hog1PP. This assumption is also consistent with the modelling approach used in Schaber et al. (2012). The glycerol concentration inside the cell is quantified as follows,
 |
11 |
where KG and KT are rate constants for the synthesis and transport of glycerol, respectively. The first term in Eq. 11 represents the synthesis of glycerol inside the cell. The synthesis rate of glycerol is assumed to be dependent on enzyme concentration and active Hog1PP. The second term in Eq. 11 represents transport of intracellular glycerol to the external medium, which is mainly through FPS1 channel. Although the molecular mechanism of regulation is unclear, it is believed that FPS1 is regulated by Hog1 system, (Beese et al. 2009). In this model, the transport rate is quantified as a function of fractional recovery in turgor pressure. In addition to regulation of transport mechanism by the turgor pressure, the glycerol transport rate is also dependent on the facilitated diffusion of glycerol, which is driven by the difference in the intracellular glycerol concentration and that in the medium. As mentioned in the beginning of model description, we have considered very large volume of external medium. Thus the external glycerol concentration can be neglected compared to the internal glycerol concentration. Thus the glycerol transport rate is determined only by turgor pressure and internal glycerol concentration.
Equations (1–11) represent the reduced model that captures the adaptation behaviour in response to hyperosmotic stress. A detailed description of variables and parameters is given in the supplementary information (see Table S1, S2, S3 and S4).
Results
Osmoadaptation at moderate stress levels
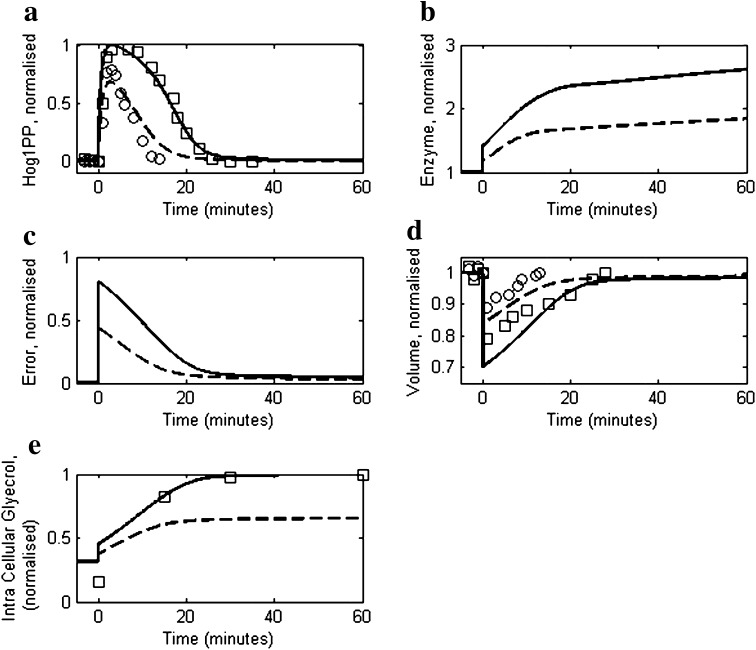
We compared model simulations with experimental data reported by Muzzey et al. (2009) for 0.2 and 0.4 M NaCl shock (step change) on a mutant strain (DMY017) having only Sln1 signalling branch. Figure 3a compares the predicted dynamic response of Hog1PP with the experimental data at 0.2 and 0.4 M NaCl concentrations. The model is able to predict the time needed by Hog1PP level to return to 5 % of its maximum deviation from its initial level, that is, 15 and 25 min for cells exposed to 0.2 and 0.4 M NaCl, respectively. The corresponding simulated enzymes levels are shown in Fig. 3b, which indicates that the fold change in enzyme level after 60 min step change in case of 0.2 M NaCl is approximately 50 % of the fold change in case of 0.4 M NaCl shock. The error dynamics depicted in Fig. 3c show that after an initial transient phase, the cell exhibits near-perfect adaptation. The recovery of cell volume during adaptation is shown in Fig. 3d which mimics the inverse of error dynamics. Figure 3e shows the model comparison of glycerol accumulation with experimental data for the 0.4 M NaCl shock.
Fig. 3.
Comparison of reduced model simulation with the experimental data for moderate osmotic stress response of yeast cells as reported in Muzzey et al. (2009). Dashed and solid lines represent model simulations for 0.2 and 0.4 M salt concentrations, respectively. Open circles and squares represent experimental data for 0.2 and 0.4 M salt concentrations, respectively. In all the cases the NaCl concentration was increased from 0 M to their corresponding level at t = 0 min. a The profiles of Hog1PP deviations (i.e. deviation from pre-shock level), normalised by the maximum deviation obtained in case of 0.4 M. b The profile of enzyme levels, normalized by the pre-shock level. c Model prediction of error as defined in Eq. 1. d Cell volume profiles, normalised by the pre-shock cell volume. e Intracellular glycerol profile, normalised by the maximum level obtained in 0.4 M NaCl shock
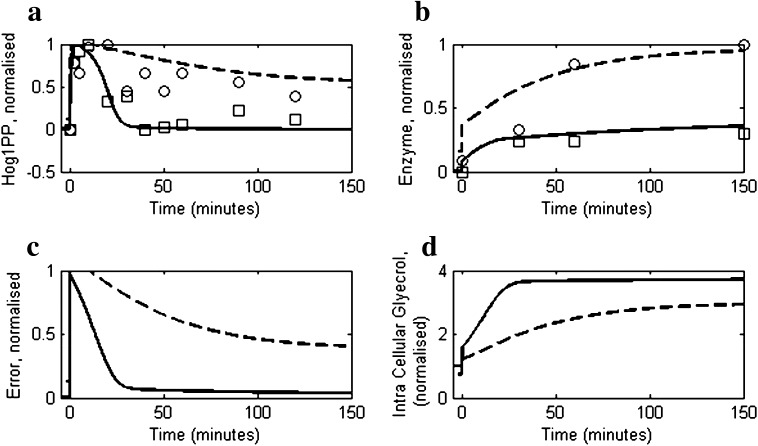
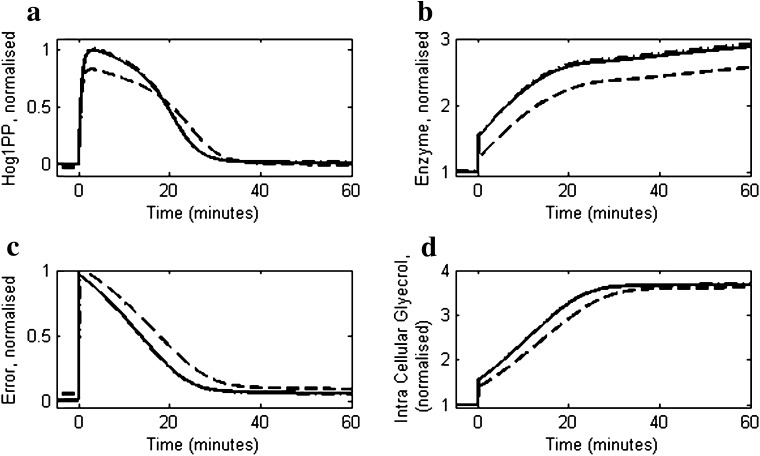
Although model parameters are estimated by regression using the data of Muzzey et al. (2009), the model is also able to capture the behaviour of a wild type strain W303 and a putative FPS1 mutant reported by Klipp et al. (2005). Figure 4 shows model prediction for a wild type strain exposed to 0.5 M NaCl (solid line) and compares with the experimental data (Klipp et al. 2005). It should be noted that the Hog1PP in our model corresponds to active Hog1PP in the nucleus, whereas the data available in Klipp et al. (2005) is for the total Hog1PP, which includes both cytosolic and nucleus Hog1PP. Therefore, the suboptimal fit of the model simulation to the experimental data is expected. However, the qualitative trend predicted for both wild type and mutant strains by the model is similar to that observed in the experimental data. To mimic a putative FPS1 mutant conditions, a 2.75 fold increase was effected in the glycerol transportation rate constant (KT,G in Eq. 11), while the regulation of transport mechanism by turgor pressure is removed (see Table S4 and Table S6 for details about initial conditions and mutant implementation, respectively). Figure 4 also shows the comparison of levels of Hog1PP and enzyme E, between the putative FPS1mutant (dashed line) as predicted by the model and the experimental data (Klipp et al. 2005) for cells exposed to 0.5 M NaCl. It is clear from the figure that the leaky FPS1 channel fails to adapt, resulting in a continually activated level of Hog1PP (about 50 % of maximum). This in turn results in a 3 fold excess synthesis of the protein (Fig. 4b) in the mutant strain relative to the wild type. The degradation of enzyme for FPS1 mutant ensures that the new level is reached in spite of the fact that transcriptional factor Hog1PP is continually active. Figure 4c shows that the higher error in case of the mutant results in inability to adapt, which is reflected in the insufficient accumulation of glycerol (Fig. 4d) relative to wild type.
Fig. 4.
Comparisons of reduced model simulations for the wild type and putative FPS1 mutant with the experimental data (Klipp et al. 2005). The osmotic shock was applied at t = 0 min by increasing the salt concentration from 0 to 0.5 M. The solid and dashed lines represent the insilico wild type and the mutant, respectively. Symbols open squares and open circles represent the experimental data for wild type and the putative FPS1 mutant, respectively. a Profiles of Hog1PP deviation (i.e. deviation from pre-shock level of wild type), normalised by the maximum deviation obtained in wild type. b The profiles of enzyme levels (deviation from pre-shock level of wild type), normalised by a fixed enzyme level. c Normalised error in turgor pressure as defined in Eq. 1. d Intracellular glycerol accumulation, normalised by pre-shock level in wild type
Osmoadaptation at higher stress levels
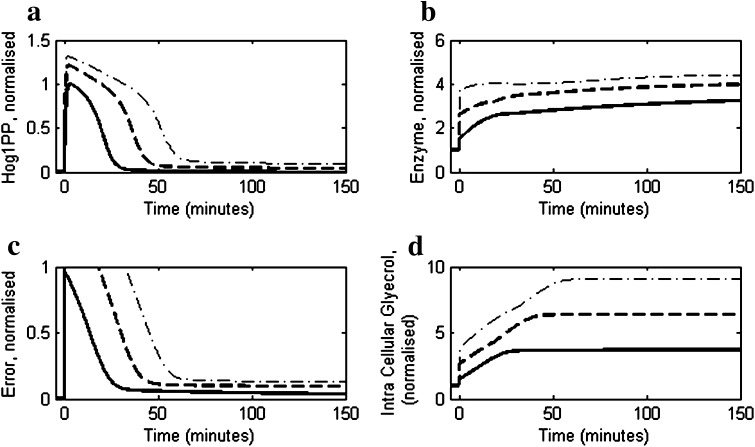
The model was used to predict the effect of higher salt concentration on the osmoadaptive behaviour of the cell. Figure 5a shows comparison of Hog1PP profile at higher stress levels (1.5 and 1.0 M) with that observed at moderate stress (0.5 M). It is clear that the Hog1PP concentration does not return to pre-stimulus levels for higher stress indicating imperfect adaptation. This is also reflected in the dynamics of the error, wherein not only the recovery is delayed but also the deviation from the pre-stimulus values at steady state is large (see Fig. 5c). Van Wuytswinkel et al. (2000) and recently Miermont et al. (2013) have reported that at 1.4 M NaCl, the Hog1 phosphorylation and transcriptional response is delayed. Moreover, it was observed by these authors that there is persistence activation of Hog1PP even after long time (240 min in Van Wuytswinkel et al. (2000)) indicating imperfect adaptation at higher stress levels. Our model does not predict delayed activation of Hog1PP. This could be due to the fact that the effect of delay due to nuclear transport of Hog1 at higher stress (Miermont et al. 2013) was not considered in our model. However, the persistent activity of Hog1PP predicted by the model is consistent with their experimental observations. The imperfect adaptation at higher salt concentration can be explained by the regulated enzyme degradation mechanism used in the reduced model. As seen from Fig. 5a, at higher stress level the Hog1PP levels are larger resulting in higher enzyme levels (see Fig. 5b) leading to a larger degradation rate constant as modelled by Eq. 10.
Fig. 5.
Simulations using the reduced model under high stress conditions using salt concentrations 0.5 M (solid) 1.0 M (dashed) and 1.5 M (dash-dotted). In all the cases the salt concentration was increased from 0 M to corresponding level t = 0 min. a The profiles of deviation of Hog1PP (i.e. deviation from pre-shock level), normalised by the maximum deviation obtained in 0.5 M. b Enzyme profiles, normalised by the pre-shock enzyme level. c Normalised error in turgor pressure as defined in Eq. 1. d Intracellular glycerol accumulation, normalised by pre-shock level
Effect of feedback mechanism on the adaptation process
Several feedback loops are known to act in the osmoadaptation system. Parmar et al. (2009) identified the following five feedback loops.
Inhibition of Sho1 and Ste50 by activated Hog1PP, resulting in two negative feedback loops.
Activation of phophatase PTP by activated Hog1PP, resulting in a negative feedback loop
Inhibition of glycerol transport by regulation of FPS1 channel through an unknown mechanism
The inherent thermodynamic negative feedback through glycerol accumulation leading to recovery of turgor pressure.
Parmar et al. (2009) have shown that the first two feedbacks are only transient in nature and do not play a role in steady state Hog1PP concentration. Further, the thermodynamically driven feedback through glycerol accumulation does not constitute a regulatory design. Therefore the analysis of reduced model focuses on the feedback implemented through PTP and inhibition of the FPS1 channel.
Significance of PTP feedback
Activated Hog1PP acts as a transcriptional activator for the synthesis of PTPase, which in turn dephosphorylates Hog1PP thereby inactivating it (see Eq. 7). It is of interest to determine the significance of the feedback on the adaptation system. To address this issue, we constructed two in silico mutated systems, namely (1) ΔPTP mutant and (2) over-expressed PTP mutant (see Table S4 and Table S6 for details about initial conditions and mutant implementation, respectively). Figure 6 shows the dynamic response of the Hog1PP and error in turgor pressure for the two mutants and the wild type for a 0.5 M NaCl shock. It is clear from Fig. 6a that ΔPTP mutant behaves similar to wild type and shows near-perfect adaptation. This indicates that PTP feedback is not essential to achieve adaptation. In case of the mutant that over-expresses PTPase, initial deactivation of Hog1PP is rapid and near-perfect adaptation is achieved at steady state, as in the case of WT and ΔPTP. However, in the later part of adaptation, the deactivation of Hog1PP is slow due to inadequate glycerol synthesis (see Fig. 6d) due to lower levels of enzyme (see Fig. 6b). It can be seen From Fig. 6c that error recovery is delayed in case of PTP over-expression. The Hog1PP dynamics for over expressed mutant is consistent with experimental observation reported by Klipp et al. (2005).
Fig. 6.
Comparison of responses of different in silico PTP mutants with wild type (solid line). Mutants considered are (1) A mutant (ΔPTP) in which PTP is not present (dashed dotted line) (2) A mutant in which PTP is over expressed (dashed line). In all cases considered here osmotic stress was applied at t = 0 min and its level was equivalent to 0.5 M NaCl shock. a Profiles of Hog1PP deviation (i.e. deviation from pre-shock level of wild type), normalised by the maximum deviation obtained in wild type. b Profiles of Enzyme E, normalised by the pre-shock level in wild type. c Normalised error in turgor pressure as defined in Eq. 1. d Intracellular glycerol accumulation, normalised by pre-shock level in wild type. Note that in all the subplots, the dash-dotted line is not clearly visible due to its overlapping with the solid line
Significance of regulation of FPS1, the glycerol transporter
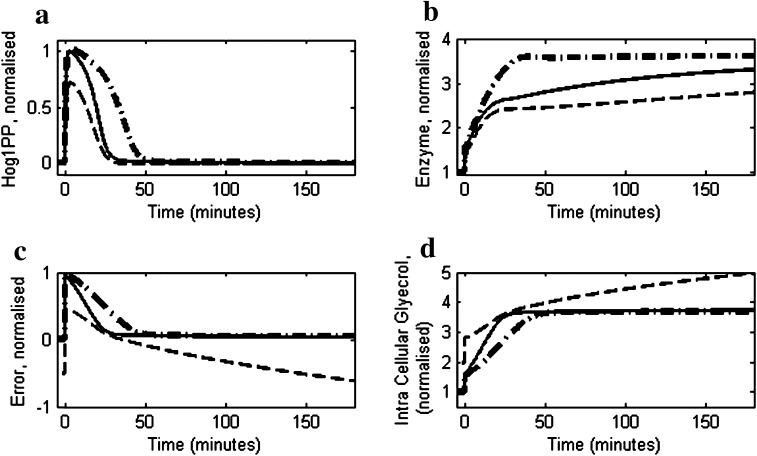
To characterise the effect of regulated transport of glycerol, we construct two in silico mutants namely, (1) ΔFPS1 mutant and (2) unregulated FPS1 mutant in which FPS1 is not regulated by turgor pressure (see Table S4 and Table S6 for details about initial conditions and mutant implementation, respectively). Figure 7 shows the dynamic response of mutants and wild type exposed to a 0.5 M NaCl shock. In the absence of FPS1, the mutant demonstrates a rapid adaptation with Hog1PP returning to its pre-shock value in 20 min (see Fig. 7a). However, the enzyme (Fig. 7b) and thereby, the intracellular glycerol does not achieve steady state and keeps on increasing (Fig. 7d), leading to an increase in the internal osmotic pressure as well as the error which results in the error dynamics as shown in Fig. 7b. The continuous increase in the cell volume due to inadequacy in glycerol export from the cell would physically leads to bursting of cell (Beese et al. 2009). In case of the unregulated transport mutant, while the adaptation of Hog1PP is similar to the WT, the volume recovery and Hog1PP dynamics are slower. Adrover et al. (2011) have shown that the release of cell cycle arrest occurs at a critical value of Hog1PP which is achieved prior to the return of Hog1PP to the pre-shock level. Thus, a cell with unregulated transport will take larger time to commence cell division relative to the wild type upon shock.
Fig. 7.
Response of two insilico FPS1 mutants to 0.5 M NaCl shock applied at t = 0 min. Mutants are (1) ΔFPS1: Mutant in which PTP and glycerol feedbacks are present but FPS1 is not present so there is very less leakage of glycerol (dashed line). (2) Mutant in which FPS1 channel is not regulated by turgor pressure, thereby, the glycerol transport rate is not sensitive to the turgor pressure (dash-dotted line). Solid line represents wildtype response. a Profiles of deviation of Hog1PP (i.e. deviation from pre-shock level in wild type) normalised by the maximum deviation obtained in wild type. b Profiles of Enzyme, normalised by pre-shock level in wild type. c Normalised error in turgor pressure as defined in Eq. 1. d Profile of intracellular glycerol accumulation, normalised by pre-shock level in the wild type
The above analysis suggests that while the individual feedbacks have distinct roles, they do not contribute to the near-perfect adaptation for moderate shocks, wherein Hog1PP levels return to the vicinity of the pre-shock levels. Muzzey et al. (2009) suggests that glycerol synthesis by the Hog1PP dependent mechanism is crucial for the near-perfect adaptation of Hog1PP adaptation. A pertinent question is, if none of the four thermodynamic feedbacks in the osmoadaptation system listed above contribute to the near-perfect adaptation, which component of the glycerol synthesis machinery is responsible for the same.
Significance of feedbacks in the glycerol synthesis process
The glycerol synthesis process mainly includes two regulations (1) upregulation of glycerol synthesis enzymes e.g. GPD1 and GPP2 by Hog1PP and (2) a direct effect of Hog1PP (see Eq. 10). We investigated the significance of both the mechanisms on the adaptation behaviour of Hog1PP by invoking three mutants as follows:
a mutant in which the direct effect of Hog1PP on glycerol synthesis is absent but it induces the enzyme E through transcription. To quantify this, the dependence of glycerol synthesis rate on Hog1PP is eliminated in Eq. 10, (i.e. the first term in the right hand side is dependent on only E).
a mutant in which the dependence of glycerol synthesis on enzyme E is eliminated in Eq. 10 (i.e. the first term on the right hand side of equation is dependent on Hog1PP only).
a mutant lacking both transcriptional and non-transcriptional Hog1PP effect on glycerol synthesis process (i.e. both Hog1PP and E were kept constant in Eq. 10).
Figure 8 shows the comparison of the three in silco mutants at 0.4 M NaCl with the wild type response (solid line). Figure 8 suggests that out of the three mutants mentioned above, only the mutant in which glycerol has enzyme dependence (transcriptional feedback) (dashed line) is able to show near-perfect adaptation. The other two mutants that did not include the enzyme dependence on glycerol synthesis indicate that a necessary condition for adaptation is the synthesis of glycerol through enzyme synthesised by transcriptional Hog1PP. It should be noted that near-perfect adaptation may not be necessary for the survival of cell, hence non-transcriptional effect of Hog1PP may be sufficient for the cell to survive (Westfall et al. 2008). The utility of Hog1PP in glycerol synthesis in addition to the enzyme dependence (i.e. wild type) indicates that the Hog1PP merely makes the response faster. In summary, the above analysis with the various mutants suggests that, the near-perfect adaptation is neither due to PTPase/FPS1 regulation, nor due to the effect of Hog1PP in glycerol synthesis but due to some mechanism related to enzyme synthesis. Therefore, a relevant question is how does transcriptional feedback maintains such a high degree of adaptation.
Fig. 8.
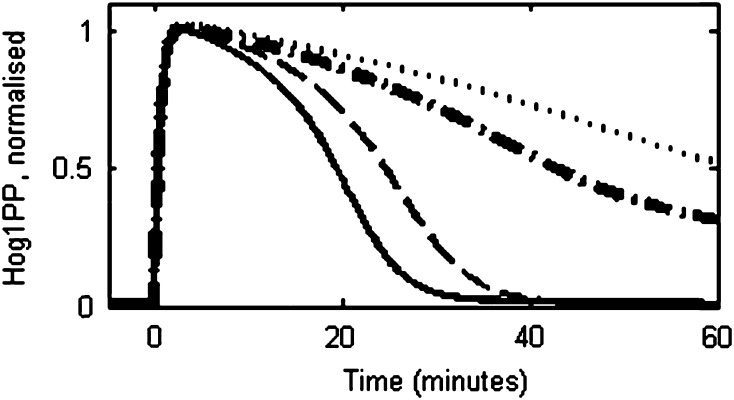
Comparison of Hog1PP response of three insilico mutants with wild type. The solid and dashed lines represent wild type and a mutant in which direct Hog1PP effect (non-transcriptional effect on glycerol synthesis) is absent. The dash-dotted and dotted lines represent the mutant in which glycerol synthesis is not dependent on enzyme levels (transcriptional Hog1PP effect is absent) and a mutant with un-induced (dependence on both enzyme and Hog1PP levels are absent) glycerol synthesis, respectively. In all cases considered here osmotic stress were applied at t = 0 min and its level was equivalent to 0.5 M NaCl shock. The profiles shown in the figure indicate the profiles of deviation of Hog1PP (i.e. deviation from preshock level in wild type), normalised by the maximum deviation obtained in wild type
As seen from Fig. 2, under moderate stress condition, the mRNA levels are proportional to the error in the turgor pressure while the enzyme levels are proportional to the integral of the error. This suggests that the integrating mechanism could be achieved in the enzyme accumulation as mediated by Eq. 8 rather than in components upstream of enzyme accumulation. The above arguments lead to the conclusion that the integration mechanism in the enzyme accumulation is possible only if the enzyme degradation is regulated as hypothesized in the reduced model.
To test the relevance of regulated degradation rate, the reduced model was simulated for 0.5 M NaCl using a fixed degradation rate constant (KD,E) instead of the regulated degradation (see supplementary information). Figure 9a shows the Hog1PP profiles at various values of degradation rate constant (KD,E). It can be observed from the figure (dotted line in Fig. 9a) that a fixed value of rate constant KD,E equivalent to the maximum degradation rate constant in wild type (i.e. KD,E0) results in a steady state offset in Hog1PP adaptation. It is clear from Fig. 9 that as the rate constant KD,E increases, the adaptation process becomes increasingly imperfect (dashed and dash-dotted lines) due to the lower value of enzyme concentration (Fig. 9b), which in turn lowers recovery in turgor pressure (Fig. 9c). The slower accumulation of glycerol in case of larger fixed degradation constant is evident from Fig. 9d.
Fig. 9.
Simulation of reduced model with various degradation rate constants of enzyme i.e. K D,E. In all the cases considered here; osmotic stress is equivalent to 0.4 M NaCl shock applied at t = 0 min and; the enzyme degradation rate constant was unregulated with a fixed value of K D,E. The dotted, dashed and dash-dotted lines represent profiles with enzyme degradation rate constant equivalent to K D,E0, 10·K D,E0 and 33.33·K D,E0, respectively, where K D,E0 is maximum rate constant for degradation of enzyme in wild type. a The profiles of deviation of Hog1PP (i.e. deviation from pre-shock level in wild type), normalised by the maximum deviation obtained in wild type. b Profiles of Enzyme level, normalised by the pre-shock level in wild type. c Normalised error in turgor pressure as defined in Eq. 1. d Profiles of intracellular glycerol level, normalised by the preshock level in wild type
Response of wild type to a ramp input
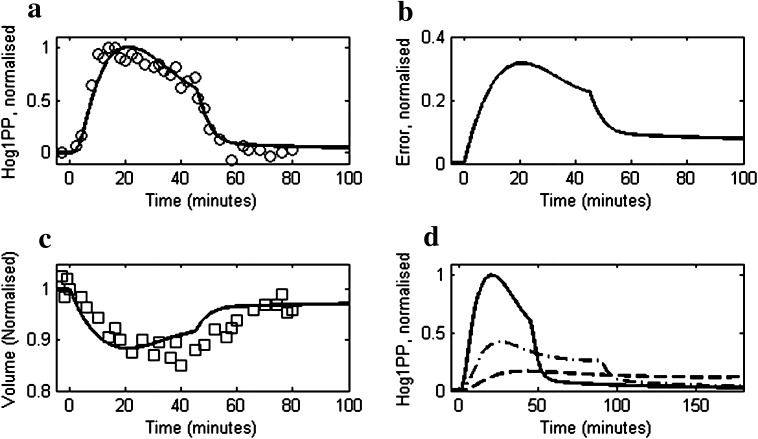
Muzzey et al. (2009) reported experiments where the cells were exposed to osmotic stress by increasing the salt concentration as a ramp input. It is well known that adaptation to a ramp input is feasible only in the presence of two distinct integrating processes in series (Muzzey et al. 2009). The reduced model was used to verify the above by simulating the ramp input and comparing the result with the reported experimental data (see Table S4 and Table S6 for details about initial conditions and implementation, respectively). Figure 10a shows the profile of Hog1PP for the ramp input until 45 min after which the salt concentration was kept constant. Both, the experimental observation (open circles) by Muzzey et al. (2009) and the reduced model predictions (solid line) show that the Hog1PP level does not return to pre-shock level till 45 min, indicating a failure to adapt to ramp input. However, after 45 min, the Hog1PP level returns to the pre-shock level. Figure 10b shows that the error in turgor pressure demonstrates a trend similar to Hog1PP. Figure 10c compares the volume predictions by model (solid) with the experimental data (open squares) of Muzzey et al. (2009). Figure 10d shows simulation result for various ramp inputs, each of which were applied with a distinct rate of increase of NaCl and a distinct ramp duration. It should be noted that, post ramp NaCl concentration is identical in all the three cases. Figure 10d shows that the Hog1PP level did not return to the pre-shock level during the ramp phase in all the three cases. This clearly indicates that the osmoadaptation system in yeast has evolved to a discrete change in the salt concentration but not to a continuous change, thereby suggesting the presence of a single integrating process.
Fig. 10.
Model predictions for a ramp input in salt concentration. a Profiles of deviation of Hog1PP (i.e. deviation from pre-shock level in wild type) for a ramp input with rate 0.0166 (M NaCl/min) up to 45 min followed by maintaining a fixed NaCl concentration (i.e. 0.75 M NaCl) beyond 45 min. Solid line and open square symbols represent model predictions and experimental data from Muzzey et al. (2009). b Normalised error in turgor pressure as defined in Eq. 1. c Cell volume, normalised by pre-shock level in wild type. The open squares presents data of Muzzey et al. (2009). d Hog1PP dynamics for three conditions of ramp input; Case 1: Stress is increased at 0.0166 M/min NaCl till 45 min and maintained constant then after (solid); Case 2: Stress is increased with a rate of 0.0083 M/min NaCl, which is half that in Case 1, and maintained constant after 90 min (dash-dotted) and; Case 3: Stress is increased at rate 0.00425 M/min NaCl, which is 1/4th that in Case 1, till 180 min (dashed). Note that at the end of the ramp input, the net concentration of NaCl is the same for all the cases
Analysis of robustness of osmoadaptation system
The reduced model is motivated by the observation that upon moderate osmotic shock, mRNA levels, transcribed by osmolyte expressing genes return to the vicinity of the pre-shock level while the enzyme levels continue to remain elevated long after the adaptive phase (see Fig. 2). This clearly suggests that the adaptive behaviour is on account of phenomena corresponding to the transcription dependent glycerol synthesis. Therefore, we assumed the existence of only the transcriptional regulation by Hog1PP and neglected other feedbacks (i.e. FPS1/PTP regulations and direct Hog1PP effect on glycerol synthesis are omitted). A key advantage of an error driven model, as presented here, is the ability to relate system parameters directly to the adaptive behaviour. For the feedback loop involving only transcriptional Hog1PP effect, the steady state behaviour of the reduced model (Eqs. 1–11) can be obtained to directly relate the error to the external input (see supplementary information S5 for derivation) as follows,
 |
12 |
where,
 |
13 |
The lumped parameter Φ (Eq. 13) includes the multiplication of ratios of rate constants for deactivation (or degradation or transport) and activation (or synthesis) of Hog1PP, mRNA, enzyme and glycerol. Equation 12 suggests that as the value of Φ decreases, the error in the turgor pressure also decreases. Equation 13 clearly indicates that the ratios of rate constants for degradation/deactivation to synthesis/activation of variables are crucial to achieve perfect adaptation. Notably higher deactivation to activation ratio at the steady state creates larger error in the turgor pressure.
Equation 12 clearly indicates that mechanisms that minimize the lumped parameter Φ results in greater capacity to adapt. Indeed for Φ = 0, the steady state error becomes zero, indicating perfect adaptation regardless of the salt concentration. A small value of Φ could be obtained if any of the degradation/deactivation/transport parameter in the numerator are set to a small value. Although in literature there are reports of both transient and persistent regulations of degradation of mRNA (Miller et al. 2011; Romero-Santacreu et al. 2009), the regulated degradation constants of mRNA are still much higher compare to the transcription rate constants. Moreover, from the dynamic data provided by Klipp et al. 2005 for both wild type and putative FPS1 mutant, a small value of degradation rate constants for mRNA and Hog1PP is not evident. On the other hand, stable enzyme activity for the cells under moderate osmotic shock in Fig. 2 clearly suggests a small value of KD,E. The imperfect adaptation at higher salt concentration indicates that stability of enzyme cannot be maintained at higher enzyme concentration. The regulated protein degradation model captures these observations through a Hill equation (see Eq. 10).
In summary, we conclude that while transcriptional response contributes to the glycerol synthesis, it also acts as a control module which drives the osmoadaptation response of the system. The regulated degradation of enzyme E hypothesised in the reduced model predicts that error in turgor pressure can be made less dependent on the system parameters and thereby enhancing the robustness of the system. It is known that in yeast, as a part of general stress response, stabiliser proteins (chaperones) are enhanced during hyper osmotic stress (Hohmann 2002). The analysis presented above therefore suggests a need for investigation for the role of these chaperones in stabilising the enzymes which upregulates glycolytic flux towards glycerol, and also in stabilising the enzymes which negatively feedbacks onto Hog1PP directly (e.g. PTP). It is also known that under severe stress condition enzymes in yeast cell are susceptible to damage (Hohmann 2002). In such a case, the enzyme level is significantly less than the total enzyme synthesised, which is dependent on the integral of error in the turgor pressure, and thus, imperfect adaptation is observed at higher stress levels.
Discussions
Experiments have demonstrated a near-perfect adaption of S. cerevisiae to moderate osmotic shock. Specifically, an error caused due to a step change in osmolarity can be eliminated or minimized during the adaptation. It is speculated that a perfect adaptation process is achieved due to presence of an integral action in the negative feedback loop in the glycerol production machinery. Experimental demonstration of the near-perfect adaptation in osmoadaptation raised the question as to where does such an integrating component reside. Based on experimental studies, Muzzey et al. (2009) argue that the integrator lies upstream of glycerol synthesis process. A key system-level insight provided by Muzzey et al. (2009) is that the adaptation is driven by one integrating mechanism based on Hog1PP kinase activity. Further, the integrating mechanism regulates glycerol synthesis but not its transportation across the cell membrane. The glycerol synthesis module includes number of steps like transcriptional activation of metabolism and conversion of G3P, a glycolytic intermediate mainly through enzyme activity of GPP2.
The reduced model developed in this work and its analysis indicated that (1) the notion of perfect integral control and hence perfect adaptation (as a property of system) does not exist in yeast osmoadaptation; (2) the presence of known feedbacks in the yeast osmoadaptation system does not constitute a design responsible for the adaptation process; (3) a near-perfect adaption can be achieved by a mechanism consisting of regulated degradation/deactivation of the signalling activity from turgor sensing to protein translation; and (4) the known dynamics of the signalling, mRNA and protein available in the literature suggest that it is more likely that regulation is in the protein degradation.
The analysis using the reduced model demonstrates that the negative feedback loops in the signalling, transport modules and non-transcriptional glycerol synthesis do not contribute to the near-perfect adaptation of Hog1PP for moderate stress. Specifically, the feedbacks by PTPase in the signalling module, feedback though FPS1 channel in the transport module and from Hog1PP kinase on glycerol synthesis have been shown to play no role in either together or individually in near-perfect adaptation. The role of biophysical module in the global feedback captures the thermodynamic effect of accumulation of osmolyte on turgor pressure recovery and also does not play a role in the integral control mechanism. The analysis of reported results and simulation of the reduced model indicated that the integrating mechanism does not reside in the signalling, biophysical and glycerol accumulation modules, and it may reside in the enzyme regulation module.
The integrating mechanism responsible for near-perfect adaptation may be a part of regulatory design or a process mechanism itself. An integrating mechanism is one in which the rate of change of a control variable is proportional to the error in variable of interest. The enzyme activity, which is equivalent to the control variable of the osmoadaptation process, is governed by its synthesis as well as degradation. Since the synthesis of the enzyme is dependent on the transcriptional activator i.e. nuclear Hog1PP and hence to the error in turgor pressure, it is independent of the enzyme level. On the other hand, enzyme degradation depends on its own concentration. It is therefore clear that obtaining a perfect adaptation through an integrating mechanism in the enzyme regulation module is possible only by setting the degradation rate constant to zero. However, it is known that every protein has a degradation rate and therefore a non-zero turnover. This turnover is essential so that the enzymes can switch off osmoadaptation process upon removal of stress. Thus, in the presence of quintessential degradation, an integration mechanism cannot be realised. A simple approach to realise a near-perfect adaptation is by stabilising the enzymes which bring in the integrating mechanism during the early phase of adaptation.
It is known that during hyper osmotic stress, proteins are susceptible to damage and subsequently several molecular chaperones are upregulated (Hohmann 2002). These molecular chaperones are known to play a key role in protein stability. Moreover, glycerol and trehalose are now widely accepted as protein stabilisers under stressed conditions (Jain and Roy 2010; Street et al. 2006). It is well documented that differential regulation of protein degradation brings about a dramatic difference in its in vivo stability. Selective proteolysis has been reported to be a key process at particular stages of cell cycle (Freire et al. 2012, Marrocco et al. 2010) and in the developmental phase after specific metabolite change or environmental stimuli (Judy 1995). In the clear absence of roles of known feedback for the near-perfect adaptation in the osmoadaptation system, we hypothesize that the controlled proteolysis of enzymes like GPD1/GPP2 etc. may be the key factor in imparting integral control like behaviour.
Electronic supplementary material
Acknowledgments
A.K.P. acknowledges Parmar Jignesh for useful discussions. K.V.V. acknowledges funds from Department of Science and Technology (DST), India.
Contributor Information
Anilkumar K. Patel, Phone: +91-22-25767223, FAX: +91-22-5726895, Email: anilpatel@iitb.ac.in
Sharad Bhartiya, Email: bhartiya@che.iitb.ac.in.
K. V. Venkatesh, Email: venks@che.iitb.ac.in
References
- Adrover MÀ, Zi Z, Duch A, Schaber J, González-Novo A, Jimenez J, Nadal-Ribelles M, Clotet J, Klipp E, Posas F (2011) Time-dependent quantitative multicomponent control of the G 1-S network by the stress-activated protein kinase Hog1 upon osmostress. Sci Signal 4(192):ra63 [DOI] [PubMed]
- Beese SE, Negishi T, Levin DE (2009) Identification of positive regulators of the yeast Fps1 glycerol channel. PLoS Genet 5(11):e1000738 [DOI] [PMC free article] [PubMed]
- Freire P, Vinod PK, Novak B. Interplay of transcriptional and proteolytic regulation in driving robust cell cycle progression. Mol BioSyst. 2012;8:863–870. doi: 10.1039/c2mb05406j. [DOI] [PubMed] [Google Scholar]
- Hohmann S. Osmotic stress signaling and osmoadaptation in yeasts. Microbiol Mol Biol Rev. 2002;66:300–372. doi: 10.1128/MMBR.66.2.300-372.2002. [DOI] [PMC free article] [PubMed] [Google Scholar]
- Jain NK, Roy I (2010) Trehalose and protein stability. Curr Protoc Protein Sci 59:4.9.1–4.9.12 [DOI] [PubMed]
- Judy C. Regulation of protein degradation. Plant Cell. 1995;7:845–857. doi: 10.1105/tpc.7.7.845. [DOI] [PMC free article] [PubMed] [Google Scholar]
- Klipp E, Nordlander B, Krüger R, Gennemark P, Hohmann S. Integrative model of the response of yeast to osmotic shock. Nat Biotechnol. 2005;23:975–982. doi: 10.1038/nbt1114. [DOI] [PubMed] [Google Scholar]
- Macia J, Regot S, Peeters T, Conde N, Solé R, Posas F (2009) Dynamic signaling in the Hog1 MAPK pathway relies on high basal signal transduction. Sci Signal 2(63):ra13 [DOI] [PubMed]
- Marrocco K, Bergdoll M, Achard P, Criqui M-C, Genschik P. Selective proteolysis sets the tempo of the cell cycle. Curr Opin Plant Biol. 2010;13:631–639. doi: 10.1016/j.pbi.2010.07.004. [DOI] [PubMed] [Google Scholar]
- Mettetal JT, Muzzey D, Gómez-Uribe C, Van Oudenaarden A. The frequency dependence of osmo-adaptation in Saccharomyces cerevisiae. Science. 2008;319:482–484. doi: 10.1126/science.1151582. [DOI] [PMC free article] [PubMed] [Google Scholar]
- Miermont A, Waharteb F, McCleand MN, Bottania S, Léone S, Hersena P (2013) Severe osmotic compression triggers a slowdown of intracellular signaling, which can be explained by molecular crowding. Proc Natl Acad Sci USA 110:5725–5730 [DOI] [PMC free article] [PubMed]
- Miller C, Schwalb B, Maier K, Schulz D, Dümcke S, Zacher B, Mayer A, Sydow J, Marcinowski L, Dölken L et al (2011) Dynamic transcriptome analysis measures rates of mRNA synthesis and decay in yeast. Mol Syst Biol 7:458 [DOI] [PMC free article] [PubMed]
- Muzzey D, Gómez-Uribe CA, Mettetal JT, van Oudenaarden A. A systems-level analysis of perfect adaptation in yeast osmoregulation. Cell. 2009;138:160–171. doi: 10.1016/j.cell.2009.04.047. [DOI] [PMC free article] [PubMed] [Google Scholar]
- Norbeck J, Blomberg A. Metabolic and regulatory changes associated with growth of Saccharomyces cerevisiae in 1.4 M NaCl. Evidence for osmotic induction of glycerol dissimilation via the dihydroxyacetone pathway. J Biol Chem. 1997;272:5544–5554. doi: 10.1074/jbc.272.9.5544. [DOI] [PubMed] [Google Scholar]
- Parmar JH, Bhartiya S, Venkatesh KV. A model-based study delineating the roles of the two signaling branches of Saccharomyces cerevisiae, Sho1 and Sln1, during adaptation to osmotic stress. Phys Biol. 2009;6:036019. doi: 10.1088/1478-3975/6/3/036019. [DOI] [PubMed] [Google Scholar]
- Petelenz-Kurdziel E, Eriksson E, Smedh M, Beck C, Hohmann S, Goksör M. Quantification of cell volume changes upon hyperosmotic stress in Saccharomyces cerevisiae. Integr Biol. 2011;3:1120–1126. doi: 10.1039/c1ib00027f. [DOI] [PubMed] [Google Scholar]
- Petelenz-Kurdziel E, Kuehn C, Nordlander B, Klein D, Hong K–K, Jacobson T, Dahl P, Schaber J, Nielsen J, Hohmann S, et al. Quantitative analysis of glycerol accumulation, glycolysis and growth under hyper osmotic stress. PLoS Comput Biol. 2013;9:e1003084. doi: 10.1371/journal.pcbi.1003084. [DOI] [PMC free article] [PubMed] [Google Scholar]
- Rep M, Reiser V, Gartner U, Thevelein JM, Hohmann S, Ammerer G, Ruis H. Osmotic stress-induced gene expression in Saccharomyces cerevisiae requires Msn1p and the novel nuclear factor Hot1p. Mol Cell Biol. 1999;19:5474–5485. doi: 10.1128/mcb.19.8.5474. [DOI] [PMC free article] [PubMed] [Google Scholar]
- Romero-Santacreu L, Moreno J, Pérez-Ortín JE, Alepuz P. Specific and global regulation of mRNA stability during osmotic stress in Saccharomyces cerevisiae. RNA. 2009;15:1110–1120. doi: 10.1261/rna.1435709. [DOI] [PMC free article] [PubMed] [Google Scholar]
- Schaber J, Baltanas R, Bush A, Klipp E, Colman-Lerner A (2012) Modelling reveals novel roles of two parallel signalling pathways and homeostatic feedbacks in yeast. Mol Syst Biol 8:622 [DOI] [PMC free article] [PubMed]
- Street TO, Bolen DW, Rose GD. A molecular mechanism for osmolyte-induced protein stability. Proc Natl Acad Sci. 2006;103:13997–14002. doi: 10.1073/pnas.0606236103. [DOI] [PMC free article] [PubMed] [Google Scholar]
- Tamás MJ, Luyten K, Sutherland FCW, Hernandez A, Albertyn J, Valadi H, Li H, Prior BA, Kilian SG, Ramos J, et al. Fps1p controls the accumulation and release of the compatible solute glycerol in yeast osmoregulation. Mol Microbiol. 1999;31:1087–1104. doi: 10.1046/j.1365-2958.1999.01248.x. [DOI] [PubMed] [Google Scholar]
- Van Wuytswinkel O, Reiser V, Siderius M, Kelders MC, Ammerer G, Ruis H, Mager WH. Response of Saccharomyces cerevisiae to severe osmotic stress: evidence for a novel activation mechanism of the HOG MAP kinase pathway. Mol Microbiol. 2000;37:382–397. doi: 10.1046/j.1365-2958.2000.02002.x. [DOI] [PubMed] [Google Scholar]
- Westfall PJ, Patterson JC, Chen RE, Thorner J. Stress resistance and signal fidelity independent of nuclear MAPK function. Proc Natl Acad Sci USA. 2008;34:12212–12217. doi: 10.1073/pnas.0805797105. [DOI] [PMC free article] [PubMed] [Google Scholar]
- Yi T-M, Huang Y, Simon MI, Doyle J. Robust perfect adaptation in bacterial chemotaxis through integral feedback control. Proc Natl Acad Sci USA. 2000;97:4649–4653. doi: 10.1073/pnas.97.9.4649. [DOI] [PMC free article] [PubMed] [Google Scholar]
- You T, Ingram P, Jacobsen MD, Cook E, McDonagh A, Thorne T, Lenardon MD, De Moura AP, Romano MC, Thiel M et al (2012) A systems biology analysis of long and short-term memories of osmotic stress adaptation in fungi. BMC Res Notes 5:258 [DOI] [PMC free article] [PubMed]
Associated Data
This section collects any data citations, data availability statements, or supplementary materials included in this article.


