

Abstract
Accurate reconstruction of the regulatory networks that control gene expression is one of the key current challenges in molecular biology. Although gene expression and chromatin state dynamics are ultimately encoded by constellations of binding sites recognized by regulators such as transcriptions factors (TFs) and microRNAs (miRNAs), our understanding of this regulatory code and its context-dependent read-out remains very limited. Given that there are thousands of potential regulators in mammals, it is not practical to use direct experimentation to identify which of these play a key role for a particular system of interest. We developed a methodology that models gene expression or chromatin modifications in terms of genome-wide predictions of regulatory sites and completely automated it into a web-based tool called ISMARA (Integrated System for Motif Activity Response Analysis). Given only gene expression or chromatin state data across a set of samples as input, ISMARA identifies the key TFs and miRNAs driving expression/chromatin changes and makes detailed predictions regarding their regulatory roles. These include predicted activities of the regulators across the samples, their genome-wide targets, enriched gene categories among the targets, and direct interactions between the regulators. Applying ISMARA to data sets from well-studied systems, we show that it consistently identifies known key regulators ab initio. We also present a number of novel predictions including regulatory interactions in innate immunity, a master regulator of mucociliary differentiation, TFs consistently disregulated in cancer, and TFs that mediate specific chromatin modifications.
Since the seminal work of Jacob and Monod (1961), much has been learned about the molecular mechanisms by which gene expression is regulated and the molecular components involved. Historically, most work has focused on transcription factors (TFs), arguably the most important regulators of gene expression, which bind to cognate sites in DNA and regulate the rate of transcription initiation. However, more recently it has become clear that the state of the chromatin, which can be modulated through modifications of the DNA nucleobases and of the histone tails of nucleosomes, also plays a crucial role. For example, the local chromatin state affects the ability of TFs to access their binding sites, and the chromatin state can in turn be modified through TF-guided recruitment of chromatin modifying enzymes. Furthermore, an entirely new layer of post-transcriptional regulation has been uncovered in recent years in the form of microRNAs (miRNAs) (Bartel 2009). These guide RNA-induced silencing complexes to target mRNAs, inhibiting their translation and accelerating their decay (Fabian et al. 2010).
In spite of these many insights, our current understanding of the function of genome-wide gene regulatory networks in mammals is still rudimentary. For example, we only know the sequence specificity of less than half (Matys et al. 2003; Wasserman and Sandelin 2004; Pachkov et al. 2007) of the ∼1500 (Vaquerizas et al. 2009) TFs in mammalian genomes. Our knowledge of how TF binding is affected by chromatin state, of the combinatorial interactions between TFs and their cofactors, and the impact of post-translational modifications on TF activity, is even more fragmentary. Our understanding of the transcriptome-wide effects of miRNAs on gene expression remains similarly limited. Given that we are clearly still far from being able to develop realistic quantitative models of genome-wide gene regulatory dynamics, the most constructive contribution that computational approaches can currently provide is to develop models that help guide experimental efforts.
Due to the dramatic decrease in high-throughput measurement costs, it has become relatively straightforward to measure gene expression (i.e., with microarray or RNA-seq) or chromatin state (with ChIP-seq) genome-wide across a set of samples for a particular system of interest. Consequently, researchers interested in a particular developmental or cellular differentiation process, or in the response of a tissue to a particular perturbation, have increasingly turned to genome-wide profiling of expression and various chromatin marks, with the aim of using such data to elucidate the key regulatory circuitry acting in their system. However, deriving insights into regulatory circuitry from high-throughput data requires sophisticated computational analysis methods.
In recent years, comparative genomic methods have been developed that allow relatively accurate computational prediction of regulatory sites for hundreds of TFs and miRNAs on a genome-wide scale (van Nimwegen 2007; Friedman et al. 2009; Arnold et al. 2012a). In addition, through extensive experimental efforts, genome-wide annotations of transcript structures (The FANTOM Consortium et al. 2005; Djebali et al. 2012) and promoters (Balwierz et al. 2009) have become available. Capitalizing on these developments, we recently presented a general method called Motif Activity Response Analysis (MARA) for inferring key gene regulatory circuitry from genome-wide gene expression data by modeling the observed gene expression dynamics in terms of computationally predicted regulatory sites. We showed that this method can reconstruct core transcription regulatory networks in a human differentiation system ab initio (The FANTOM Consortium et al. 2009). Furthermore, several recent studies confirm that computational modeling of observed expression and chromatin dynamics is a powerful approach to reconstructing regulatory circuitry (Novershtern et al. 2011; Yosef et al. 2013) (to give just two examples) and show that MARA-like approaches can be extended to include miRNA regulation (Setty et al. 2012) and the dynamics of genome-wide histone modifications (Arnold et al. 2012b).
Unfortunately, applying MARA-like methods to high-throughput data is technically challenging and requires the expertise of dedicated computational biology groups. Thus, whereas many laboratories are now routinely producing high-throughput data sets, and methodologies for analyzing such data have been described in the literature, the vast majority of groups that produce data have to develop collaborations with expert computational groups to apply these methods. Indeed, in recent years MARA has been applied to a large range of mammalian systems studied by various experimental collaborators and experimentally validated predicted regulatory circuitry in these systems (Summers et al. 2010; Aceto et al. 2012; Arner et al. 2012; Hasegawa et al. 2012; Pérez-Schindler et al. 2012; Suzuki et al. 2012; Eisele et al. 2013; Meier-Abt et al. 2013; Tiwari et al. 2013a,b; Vervoort et al. 2013). Although these studies further validated the power of the method, they required a considerable investment of time and effort for the analysis of each new data set. Through these experiences we became convinced that lack of easy access to such computational analysis procedures is currently a major bottleneck in the field, and we decided to invest our efforts into developing a completely automated system for performing MARA.
Here we present ISMARA (Integrated System for Motif Activity Response Analysis), a completely automated computational tool that aims to make the computational reconstruction of regulatory circuitry from high-throughput data easily accessible to any researcher. Given as input a set of genome-wide gene expression or chromatin state measurements across a number of samples, ISMARA uses motif activity response analysis to identify the key regulators (i.e., TFs and miRNAs) driving gene expression/chromatin state changes across the samples, the activity profiles of these regulators, their target genes, and the sites on the genome through which these regulators act. The analysis combines precalculated annotations of regulatory sites for hundreds of regulators across genes in mammalian genomes with automated processing of input data, modeling and parameter inference, and post-processing to provide a large collection of analysis results. To use ISMARA, users only need to upload their data to the web server http://ismara.unibas.ch/ and submit it to the system, without the need of setting or tuning any parameters. All results are presented through a user-friendly graphical web interface. In ISMARA, the motif activity response analysis has been extended to model not only gene expression data from various platforms (microarray, RNA-seq), but essentially any sequencing data reflecting a genomic mark (ChIP-seq), including chromatin modifications or TF binding. In addition, ISMARA models not only the effects of TFs on mammalian gene expression but also the effects of miRNAs.
Below, we first outline the methodologies that we developed for automating the computational modeling and provide an overview of all results that ISMARA provides by applying it to RNA-seq data of a human tissue atlas. After this, we further demonstrate ISMARA using a number of example data sets that highlight different aspects of the method.
Results
As schematically depicted in Figure 1, ISMARA takes raw gene expression (microarray or RNA-seq) or chromatin state (ChIP-seq) data from any number of samples and automatically models this data in terms of computationally predicted regulatory sites, thereby predicting the genome-wide regulatory interactions that drive the observed expression or chromatin state changes across the samples. ISMARA is available through a web interface http://ismara.unibas.ch/ as part of our SwissRegulon resources (Pachkov et al. 2007). Users can directly upload unprocessed microarray (CEL files), RNA-seq, or ChIP-seq data (BED or BAM files), which are then analyzed automatically without the need for any additional input from the user (Fig. 1B). The results are made available through a web interface and can also be downloaded in flat-file format.
Figure 1.

Outline of the Integrated System for Motif Activity Response Analysis. (A) ISMARA starts from a curated genome-wide collection of promoters and their associated transcripts. Using a comparative genomic Bayesian methodology (Arnold et al. 2012a), transcription factor binding sites (TFBSs) for ∼200 regulatory motifs are predicted in proximal promoters. Similarly, miRNA target sites for ∼100 seed families are annotated in the 3′ UTRs of transcripts associated with each promoter (Friedman et al. 2009). (B) Users provide measurements of gene expression (microarray, RNA-seq) or chromatin state (ChIP-seq). The raw data are processed automatically, and a signal is calculated for each promoter in each sample. For ChIP-seq data, the signal is calculated from the read density in a region around the transcription start. For gene expression data, the signal is calculated from read densities across the associated transcripts (RNA-seq) or intensities of associated probes (microarray). (C) The site predictions and measured signals are summarized in two large matrices. The components Npm of matrix N contain the total number of sites for motif m (TF or miRNA) associated with promoter p. The components Eps of matrix E contain the signal associated with promoter p in sample s. (D) The linear MARA model is used to explain the signal levels Eps in terms of bindings sites Npm and unknown motif activities Ams, which are inferred by the model. The constants cp and  correspond to basal levels for each promoter and sample, respectively. (E) As output, ISMARA provides the inferred motif activity profiles Ams of all motifs across the samples, s, sorted by the significance of the motifs. A sorted list of all predicted target promoters is provided for each motif, together with the network of known interactions between these targets (provided by the String database, http://string-db.org/) and a list of Gene Ontology categories that are enriched among the predicted targets. Finally, for each motif, a local network of predicted direct regulatory interactions with other regulators is provided.
In order to be able to provide such completely automated analysis, ISMARA makes use of precalculated genome-wide annotations of promoters, sets of transcripts associated with each promoter, multiple alignments of promoter regions across seven mammals, a curated collection of mammalian regulatory motifs, TFBS predictions for all motifs across all promoters, and predicted target transcripts of miRNAs (Fig. 1A). Additionally, we developed a substantial number of analysis procedures in order to automatically process and normalize the raw input data (Fig. 1B) and transform them into a standardized format to which the motif activity response analysis can be applied (Fig. 1C). The analysis procedures involved in all these steps are outlined in Methods and detailed in the Supplemental Methods.
Overview of the analyses performed by ISMARA
To give an overview of the analysis results that ISMARA automatically provides for any data set, and to outline how these analyses are performed, we applied ISMARA to an example RNA-seq data set of expression profiles across 16 human cell types, i.e., data from the Illumina Body Map 2 (GEO accession GSE30611) (IBM2). The results obtained after submitting the raw RNA-seq data to ISMARA are available at http://ismara.unibas.ch/supp/dataset1_IBM/ismara_report/.
As described in Methods, ISMARA infers the motif activities according to a linear model (Fig. 1D) using a Bayesian procedure. Importantly, a Gaussian prior on motif activities is used to avoid overfitting, and the parameter of this prior is fit automatically by ISMARA for each input data set using a cross-validation scheme. Motif activities are fitted from 80% of the promoters and the performance of the model, i.e., the fraction of the variance in Eps explained by the model, is assessed on the remaining 20% of promoters.
Although our model fits Eps, it is important to note that it is not the model’s aim to provide an accurate fit of the signal Eps. As discussed in the introduction, we do not expect the highly simplified linear model to provide an accurate fit to the signal Eps at individual promoters. Indeed, the model explains 7.7% of the variance in Eps for the IBM2 data, and across the data sets studied here, we find that the model typically captures 5%–15% of the variance of Eps across samples (Supplemental Fig. 2). Although these fractions are modest, given that tens of thousands of promoters are involved, they are extremely significant, i.e., using randomization of the association between site-count and expression, we estimate that the P-value for explaining 7.7% of the variance by chance is ∼10−235 (Supplemental Methods; Supplemental Fig. 3).
ISMARA’s main aim is to identify which regulatory motifs, m, play an important role and how these motifs contribute to Eps across the samples. First, ISMARA’s output lists all regulatory motifs sorted by a Z-score, which summarizes the importance of the motif for explaining the expression variation across the samples. This score roughly corresponds to the average number of standard deviations the motif activity is away from zero (see Methods and Supplemental Methods). Besides the Z-score of each motif, the list also displays the set of TFs or miRNAs that bind to sites of the motif, a thumbnail of its activity across the input samples, and a sequence logo for each motif (Supplemental Fig. 4). Following the link from the motif name leads to a page with a large number of predictions regarding the motif’s precise regulatory role. To illustrate these, Figure 2 shows some of ISMARA’s results for the HNF1A, MYB, hsa-miR-124/hsa-miR-506, and the SREBF motifs.
Figure 2.

Results for the Illumina Body Map 2. Each panel corresponds to a motif (indicated with name and sequence logo) and shows the inferred motif activities across the 16 tissues (activities with error bars in panels A and C, and activity Z-values in panels B and D). Tables show Gene Ontology categories enriched among predicted targets of each motif, and individual target promoters (D). The networks (B,C) show direct regulatory interactions between the motif and other regulators. (A) Red and black curves correspond to motif activities from two replicate measurements. The inset shows the correlation between motif activity and HNF1A mRNA levels. (B) The inset shows that MYB is predicted to directly target the RFX4 promoter with target score 8.134. (C) The regulatory network inset and GO table show that hsa-miR-124/hsa-miR-506 is predicted to directly target many TFs. (D) The red bars show Z-values of the average motif activity of the SREBF motif for samples coming from older (age 58–86) and younger (age 19–47) donors.
HNF1A was the most significant motif for the IBM2 data set, and its predicted activity is highly tissue-specific, being almost entirely restricted to liver and kidney (Fig. 2A; Supplemental Figs. 5, 6). The associated transcription factor hepatocyte nuclear factor 1 homeobox A (HNF1A) is relatively well-studied and indeed known to be mainly expressed in liver, kidney, stomach, and intestine (Kuo et al. 1990; Serfas and Tyner 1993), where it is essential for organ function (Pontoglio et al. 1996). Figure 2A also illustrates that the inferred motif activities are highly reproducible. In fact, motif activities are more reproducible than the expression profiles from which the motif activities were inferred (Supplemental Fig. 16). The reason for this high reproducibility of motif activities is that each motif, m, typically targets hundreds to thousands of promoters, and the inferred motif activities, Ams, are statistical averages of the behaviors of a large number of promoters. This averaging causes the complexities at individual promoters to effectively cancel out and ensures that the overall influence of a motif can still be reliably inferred.
For many of the regulatory motifs, there are multiple TFs that can bind to the sites of the motif, and it is not a priori clear which of the TFs is most responsible for the motif activity in a given system. ISMARA infers motif activities from the behavior of the predicted targets of the motif. That is, roughly speaking, an increased activity is inferred when its targets show on average an increase in expression that cannot be explained by the presence of sites for other motifs in their promoters. The mRNA expression profiles of the TFs associated with a motif thus provide independent information about the link between the TFs and the motif activities, and ISMARA provides an analysis of the correlation between motif activities and the expression profiles of the associated TFs. For HNF1A, there is a good correlation between mRNA expression of the TF and the inferred motif activity (Fig. 2A, inset). However, for the fourth most significant motif (POU2F), only one of the three POU2F factors, POU2F2 (also known as OCT2), shows significant correlation of its mRNA level with motif activity, and it is the most highly expressed. This suggests that POU2F2 is mainly responsible for the motif activity in these tissues (Supplemental Figs. 7, 8). The fact that the correlation is positive also strongly suggests that POU2F2 acts as an activator. In contrast, whenever a negative correlation between motif activity and TF expression is observed, the TF most likely acts as a repressor, e.g., as observed for the known repressor ZHX2 (Supplemental Fig. 9; Kawata et al. 2003). However, it should be noted that motif activity does not need to be a direct function of TF expression, i.e., the effect of a TF on its targets will not only depend on its expression but possibly on post-translational modifications, on cellular localization, and on the presence of specific cofactors. Therefore, although a strong correlation between TF expression and motif activity is a good indication that the TF is responsible for the motif activity, the absence of such a correlation does not imply that the TF is not involved in the motif’s activity.
ISMARA predicts individual target promoters p for each motif m by calculating the difference Spm of the log-likelihood of the model with the original site-count matrix N and the log-likelihood of the model in which only the binding sites for motif m in promoter p have been removed (Methods and Supplemental Methods). For each motif, a searchable and resizable list is provided of all target promoters, their associated transcripts, and associated genes (Supplemental Fig. 10). For HNF1A, the accuracy of ISMARA’s target predictions is suggested by the fact that most of the top predicted targets are supported by the literature, including some of the oldest known direct targets of HNF1A (Courtois et al. 1988). For each target promoter, ISMARA provides a link to the genome browser view of the promoter (Supplemental Fig. 11), showing the precise genomic location of the predicted regulatory site. To provide the user with a more intuitive picture of the predicted list of targets of the motif, a link is provided to a network view of the target genes as provided by the STRING database (Jensen et al. 2009), where network links indicate known associations between the genes. For HNF1A, the STRING network reveals a large, highly connected cluster of predicted targets that are known to be involved in the metabolism of drugs and toxins in the liver (Supplemental Fig. 12). As another means to provide insights into the pathways targeted by a given motif, ISMARA also provides lists of enriched Gene Ontology categories (Fig. 2; Supplemental Fig. 13; Ashburner et al. 2000), which in this case confirms that HNF1A targets genes involved in the metabolism of drugs and xenobiotics.
To gain insight in the transcription regulatory networks that control expression profiles, it is of particular interest to identify direct regulatory connections between the TFs themselves. In ISMARA, a direct regulatory interaction from motif m to m′ is predicted when motif m is predicted to target a promoter of one of the TFs associated with m′. To visualize the predicted direct regulatory interactions between regulators, ISMARA provides, for each motif m, a local network picture that shows all predicted regulatory connections between m and promoters of TFs that are associated with other motifs (Supplemental Fig. 14). The user can interactively change the cutoff on the target score Spm to draw this picture. For HNF1A, we find that the strongest predicted targets are HNF4A, FOXA2, NR5A2, and HNF1A itself (Supplemental Fig. 14). In addition, HNF4A and FOXA2 are predicted to target the HNF1A promoter as well. Remarkably, all these predictions are supported by independent experimental evidence (Piaggio et al. 1994; Boj et al. 2001; Bartoov-Shifman et al. 2002; Tomaru et al. 2009; Bochkis et al. 2012; Molero et al. 2012).
ISMARA predicts that the MYB motif is by far most active in testis, and it targets genes that are involved in meiosis and spermatogenesis (Fig. 2B). In addition, the MYB motif is predicted to target the RFX4, RFX2, and NR5A1 promoters. A literature search reveals that MYBL1, a close homolog of MYB that binds to the same regulatory sites, is a master regulator of male meiosis and spermatogenesis (Toscani et al. 1997; Bolcun-Filas et al. 2011). Moreover, RFX2 has been implicated as a direct target of MYBL1 in spermatogenesis (Horvath et al. 2009). ISMARA’s prediction that RFX4 is also regulated by the MYB motif (presumably through MYBL1) is novel to our knowledge. Finally, ISMARA’s prediction that the MYB promoter is targeted by the E2F motif is also supported by the literature (Campanero et al. 1999).
To illustrate ISMARA’s predictions of the regulatory role of miRNAs, Figure 2C shows results for the second most significant miRNA seed family, hsa-miR-124/hsa-miR-506. This seed family has the strongest negative activity in brain, and its targets are highly enriched for TFs (Fig. 2C). Indeed, hsa-miR-124 is a well-known brain-specific miRNA (Landgraf et al. 2007). Moreover, of the top nine predicted TF target genes of hsa-miR-124, six (TEAD1, CEBPA, AR, SP1, SNAI2, NFATC1) are supported by independent experimental evidence (Lim et al. 2005; Baek et al. 2008; Ponomarev et al. 2011; Liang et al. 2013; Shi et al. 2013), again confirming the high accuracy of ISMARA’s target predictions.
Of course, most of the results highlighted in Figure 2, such as the function of HNF1A in liver and the brain-specific role of hsa-miR-124, are well-known from the literature. However, all these results, including very specific predictions of the precise targets of each regulator, were obtained by a completely automated analysis of RNA-seq data from 16 human tissues, without any free parameters or specific processing of the data. Moreover, they constitute only a small selection of the predictions made by ISMARA.
By default, ISMARA focuses on regulatory motifs that explain changes in expression levels across the input samples. However, some users may be interested in regulators that are predictive for a consistently high or consistently low expression level across all samples. To address this, ISMARA also fits the absolute expression levels of the promoters, i.e., averaged over all input samples, in terms of ‘mean activities’ (Methods; Supplemental Methods). For the IBM2 data set, we find that the TFs YY1 and NRF1 are most predictive of high average expression, whereas the known repressors REST and RREB1 are most predictive for low average expression (Supplemental Fig. 15).
Experiments are often performed in multiple replicates, and ISMARA implements procedures for specifically identifying motifs that behave reproducibly across the replicates. The ISMARA results page links to a section where users can provide batch and replicate annotation for their samples, which is then used by ISMARA to calculate motif activity profiles that are averaged over replicates using a rigorous Bayesian procedure (Supplemental Methods). In addition, updated motif Z-scores quantify to what extent a motif’s activity varies across samples in a way that is reproducible across the replicates (Supplemental Methods). For example, the replicate-averaged results for the IBM2 data set are available at http://ismara.unibas.ch/supp/dataset1_IBM/averaged_replicates/averaged_report/.
Apart from replicate averaging, this procedure can further be used to calculate contrasts between subsets of samples. To illustrate this, we noted that the samples of the 16 tissues of the IBM2 data set derived from donors of different ages, and we investigated whether any motifs have consistently different activities between samples from older and younger individuals. We divided the samples into those deriving from donors aged 19–47 and those deriving from donors aged 58–86. We then directed ISMARA to calculate averaged activities for ‘young’ and ‘old’ samples for each motif (results at http://ismara.unibas.ch/supp/dataset1_IBM/averaged_age/averaged_report/). We found that only the SREBF motif is significantly differently regulated between old and young samples (Fig. 2D). The targets of SREBF are up-regulated in older tissues relative to the younger ones and are highly enriched for lysosomal genes. Lysosomes are responsible for the degradation of many macromolecules, including proteins, and increase in lysosomal mass is a well-known characteristic of aging and senescence in cells (Cuervo and Dice 2000; Kurz et al. 2000). In addition, evidence is increasing that a progressive decrease in the efficiency of autophagy and lysosomes with age plays a key role in aging-associated degenerative changes in mammals (Rubinsztein et al. 2011). Several recent findings support that SREBP TFs play a key role in these processes. SREBF1 expression increases with age in rat brains (Okamoto et al. 2006), SREBF1-mediated lipogenesis is involved in senescence (Kim et al. 2010), SREBF2 regulates autophagy (Seo et al. 2011), and SREBF activity is regulated by mTOR complex 1 (Peterson et al. 2011). It is remarkable that simply by contrasting motif activities in tissues from younger and older donors, ISMARA was able to automatically identify SREBF as a key regulator of aging-related changes in expression of lysosomal genes.
As another example of the power of motif activity contrasts across sets of samples, we searched for motifs consistently disregulated in cancer by joint analysis of the human GNF atlas of 79 tissues and cell lines (Su et al. 2004) and the NCI-60 reference cancer cell lines (Ross et al. 2000) (for full results, see http://ismara.unibas.ch/supp/dataset2/ismara_report/). Supplemental Tables 2 and 3 show the motifs that are most consistently up-regulated or down-regulated in cancers, including miRNAs. As discussed in the Supplemental Material, many of the top disregulated motifs, such as HIF1A and hsa-miR-205 miRNA (Supplemental Fig. 17), are well-known in cancer biology, again supporting the accuracy of ISMARA’s predictions. Besides well-known oncogenes and tumor suppressors, ISMARA also makes several novel predictions of regulators consistently disregulated in cancers, including the TFs HAND1, KLF12, BPTF, FOXD3, and ZNF143.
Inferring motif activity dynamics: inflammatory response
To illustrate ISMARA’s analysis of time series data, we applied it to a time series of expression data obtained after activation of human umbilical vein endothelial cells (HUVECs) with tumor necrosis factor (TNF, also known as TNF-alpha). Messenger RNA expression was measured every 15 min for the first 4 h after treatment, and every 30 min for the next 4 h (Wada et al. 2009). Whereas the original study focused solely on nascent transcription, we here show that standard application of ISMARA to this data set (http://ismara.unibas.ch/supp/dataset3/ismara_report/) uncovers the transcription regulatory network involved in this inflammatory response in remarkable detail.
The response of endothelial cells to TNF is known to be mediated by TFs of the NFkappaB family, GATA2, IRF1, and JUN (Inoue et al. 2006) TFs. TFs of the NFkappaB family in particular are crucial for the resulting inflammatory response (Kempe et al. 2005). Indeed, ISMARA infers that the two most significant motifs are IRF1,2,7 and NFKB1/REL/RELA. The activity of NFKB1/REL/RELA increases sharply in the first 45 min and slower afterward, until it reaches a steady activity after 3 h. The activity of the IRF1,2,7 motif increases steadily starting at 30 to 45 min after treatment until the end of the time course (Fig. 3A). As shown by NFKB1/REL/RELA’s local network figure (Fig. 3B and on the ISMARA results website), ISMARA predicts that IRF1 is activated directly at the level of transcription by these regulators, which is confirmed by the experimental literature (Harada et al. 1994). Other predicted targets of NFKB1/REL/RELA that are also significantly up-regulated in this process are TNF receptor genes, components of the JAK-STAT pathway (note that STAT2,4,6 is the 11th most significant motif, indicating that STAT activity changes, affecting the level of its targets) and MHC class I genes. The latter are also predicted to be regulated by IRF1,2,7, which is confirmed by experimental data (Ten et al. 1993). ISMARA makes the novel predictions that both NFKB1/REL/RELA and IRF1,2,7 activate the fifth most significant motif, PRDM1, which is an important developmental regulator in the B-cell and T-cell lineages and is required for the secretory pathway in B-cells (Martins and Calame 2008). PRDM1 activity increases, like that of IRF, across the entire time course, and these two regulators appear to share many of their predicted targets, including type 1 interferon pathway genes, the immunoproteasome (Seifert et al. 2010), ubiquitin conjugating enzymes, antigen peptide transporters, and MHC class I genes. These targets suggest that the IRF and PRDM1 TFs may be responsible for activation of the antigen presenting pathway.
Figure 3.
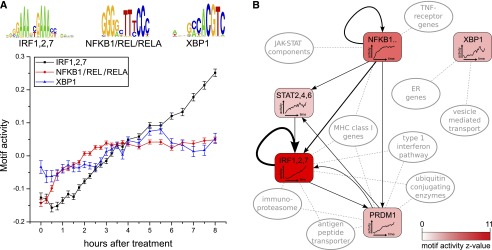
Analysis of an inflammatory response time series of human umbilical vein endothelial cells responding to TNF. (A) Time-dependent activities of the three most significant motifs, i.e., NFKB1/REL/RELA (red), IRF1/2/7 (black), and XBP1 (blue). Error bars denote standard deviations of the inferred activities. (B) Summary of the inferred core regulatory network. Selected top motifs are shown together with interactions between them and pathways/functional categories that are enriched among the targets of these motifs. The intensity of the color corresponds to the Z-score of the motif, its time-dependent activity is indicated inside the node, and the thickness of each edge corresponds to its target score Spm.
Although our TFBS predictions incorporate cross-species conservation analysis, this does not mean that the predicted targets must be conserved across mammals. For example, the third most significant TF target of the IRF motif is the ATF5 promoter, which is targeted through a TFBS that is primate-specific (Supplemental Fig. 18).
To provide an example assessment of the accuracy of ISMARA’s genome-wide target predictions, we compared the predicted targets of NFKB1/REL/RELA with targets identified through ChIP-seq in lymphoblastoid cell lines derived from 10 individuals of African, European, and Asian ancestry (Kasowski et al. 2010). We find that almost two-thirds of the top 50 targets, >50% of the top 150 targets, and ∼40% of the top 300 targets are supported by ChIP-seq binding at the promoter (Supplemental Fig. 19). To put these numbers in perspective, we compared the validation of ISMARA’s targets with the variability in NFKB1/REL/RELA binding across individuals and replicate samples. We used the ChIP-seq data from each sample to predict target promoters, and then ‘validated’ these ‘predictions’ using the other ChIP-seq data sets in complete analogy to the way we validated ISMARA’s targets. The typical validation rate for the ChIP-seq data was higher than for the ISMARA target predictions, i.e., 60%–70% versus 40%–66%. This is not surprising given that all ChIP-seq data were obtained in the same lymphoblastoid cell type, which differs from the HUVEC cells. Still, we found significant variability across the ChIP-seq data sets, and the targets from some ChIP-seq data sets had lower intersection with the other ChIP-seq data sets than ISMARA’s targets (Supplemental Fig. 19). This analysis shows that ISMARA’s genome-wide predictions can reach accuracies comparable to those obtained from a ChIP-seq study.
Finally, the third most significant motif is XBP1, which is activated only after 2.5 h. Its predicted targets are highly over-represented for endoplasmic reticulum (ER) genes and genes involved in vesicle-mediated and Golgi transport, consistent with the fact that XBP1 is a major regulator of ER stress and the unfolded protein response (UPR) (Glimcher 2010). Moreover, several studies support that the UPR is a general characteristic resulting from inflammation or TNF activation in endothelial cells (Gargalovic et al. 2006; Civelek et al. 2009). Interestingly, the induction of XBP1’s activity occurs at the same time that the NFKB1/REL/RELA activity stops increasing, which is in line with studies showing that the UPR can attenuate the induction of inflammation as mediated by TFs of the NFkappaB family (Kaser et al. 2008; Kitamura 2011; Li et al. 2011). The induction of XBP1’s activity is not reflected in the expression of XPB1 itself, which is almost constant across the time course (Supplemental Fig. 20). This underscores that ISMARA infers a motif’s activity from the expression of its predicted targets and does not use the regulator’s own expression. Indeed, it has been established that XBP1 activity is regulated post-transcriptionally through alternative splicing (Yoshida et al. 2001; Calfon et al. 2002). Together, these results demonstrate that ISMARA reconstructs the core regulatory circuitry of the innate immune response in HUVEC cells (Fig. 3B) ab initio using only time course expression data.
Identifying novel master regulators: mucociliary differentiation of bronchial epithelial cells
Next, we turned to an example system for which much less is known, namely the mucociliary differentiation of bronchial epithelial cells on an air–liquid interface. Aiming to elucidate the regulation of bronchial development, Ross et al. (2007) performed differentiation experiments in triplicate over a period of 28 days with cells from three separate donors. This data was then analyzed with commonly used bioinformatic procedures, i.e., genes were clustered into coexpression clusters, and the clusters were analyzed for over-represented gene ontology categories and pathways. This analysis uncovered clusters associated with TGF-beta pathway genes, extra-cellular adhesion genes, and genes associated with the microtubule cytoskeleton, but no key regulators or regulatory interactions that drive these expression changes were identified.
In contrast, applying ISMARA to this gene expression data set, we obtain the prediction that by far the most important regulatory motif in this system is RFX, whose activity is strongly increasing over the period from roughly day 4 to day 10 in all three donors (Fig. 4A) (http://ismara.unibas.ch/supp/dataset4/ismara_report/). The predicted targets of RFX are highly enriched in genes known to be associated with cilium assembly, axoneme, and the microtubule cytoskeleton genes (Fig. 4B), suggesting that RFX directs ciliogenesis in bronchial epithelial cells.
Figure 4.
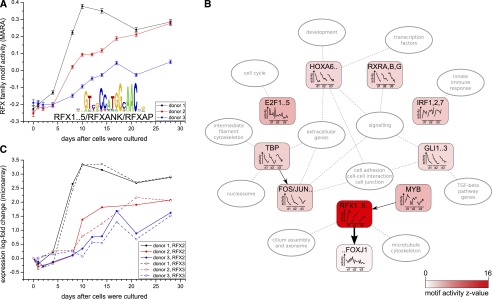
Mucociliary differentiation. (A) Inferred RFX motif activity profile in mucociliary differentiation of bronchial epithelial cells from three independent donors (black, red, and blue lines). (B) Key predicted regulators and their targets in this system. Selected top motifs are shown together with predicted interactions between them and pathways/functional categories that are enriched among predicted targets of these motifs. The intensity of the color corresponds to the Z-score of the motif, its time-dependent activity for each donor is indicated inside the node, and the thickness of the edges corresponds to the target score Spm. (C) mRNA expression profiles of the RFX2 (solid) and RFX3 (dashed) genes across the differentiation (colors of the donors as in A).
The RFX family of TFs contains seven members, and it is not a priori clear which of these are driving the bronchial differentiation. Comparison of the mRNA expression profiles with activity profiles shows that two of the family members, RFX2 and RFX3, exhibit a striking correlation in their expression with the motif activity (Fig. 4A,C). Together these results strongly suggest that the TFs RFX2/3 are master regulators of ciliogenesis in this system. This prediction is consistent with previous studies that have shown that Rfx3 is necessary for the ciliogenesis of nodal cilia in mouse embryonic development (Bonnafe et al. 2004) and during ciliogenesis of motile cilia in a mouse cell-culture system (El Zein et al. 2009).
Strikingly, ISMARA’s results on the IBM2 data set also identified the RFX motif as the key regulator of ciliogenesis in spermatogenesis. As discussed above, in that system ISMARA predicted that the RFX2 and RFX4 promoters were directly targeted by the MYB motif (most likely through the MYBL1 TF). Here we find that ISMARA predicts MYB to target the RFX2 promoter in the mucociliary differentiation system as well (Fig. 4B). In addition, ISMARA’s prediction that RFX directly up-regulates FOXJ1 in this system was also made in the results on the IBM2 data set. Indeed, Rfx3 was found to activate Foxj1 during ciliogenesis in the mouse cell-culture system mentioned above (El Zein et al. 2009). These observations suggest that the core regulatory network involved in ciliogenesis, with MYBL1 targeting RFX promoters and RFX TFs targeting FOXJ1, is conserved across multiple mammalian systems.
As indicated in Figure 4B, ISMARA additionally predicts that, in this system, IRF1,2,7 up-regulates innate immune response genes, and a short spike of E2F activity up-regulates cell-cycle genes at day 1. Finally, there is a group of motifs (TBP, FOS_FOS{B,L1}_JUN{B,D}, RXR{A,B,G}, HOX{A6,A7,B6,B7}, and GLI1..3) whose targets are progressively down-regulated across the differentiation time course. The targets of these motifs are generally enriched for extracellular proteins involved in cell adhesion, cell–cell junctions, and signaling. More specifically, targets of GLI1..3 involve genes from the TGF-beta pathway, targets of TBP involve nucleosomal and intermediate filament cytoskeletal genes, and targets of the homeodomain motif (HOX{A6,A7,B6,B7}) are enriched for developmental genes and transcription factors. The genes in these pathways are most likely involved in the transition of the tissue from squamous to columnar epithelial that occurs during differentiation. Thus, in contrast to the methods used in the original study (Ross et al. 2007), ISMARA predicts which regulators are directing various aspects of the differentiation process, including ciliogenesis, the innate immune response, and the transition from squamous to stratified epithelial. As far as we are aware, these predictions of the core regulatory network controlling mucociliary differentiation are all novel.
Interactions between TFs and miRNAs: epithelial-mesenchyme transition
To illustrate ISMARA’s ability to integrate the role of both TFs and miRNAs in the gene regulatory network, we took advantage of data from a system in which miRNAs are known to play important regulatory roles: the epithelial-to-mesenchymal transition (EMT). We applied ISMARA to expression measurements from epithelial and mesenchymal subpopulations (Scheel et al. 2011) (for results, see http://ismara.unibas.ch/supp/dataset5/ismara_report/) and used replicate averaging to identify regulators that explain the differences between epithelial and mesenchymal cells (for results, see http://ismara.unibas.ch/supp/dataset5/averaged_report/). As discussed in the Supplemental Material and Supplemental Figure 21, ISMARA automatically inferred much of the key regulatory interactions between TFs and miRNAs involved in EMT (for a review, see Polyak and Weinberg 2009) using only the gene expression data.
TF activities affecting chromatin state: analysis of ChIP-seq data
Beyond analyzing gene expression data, motif activity response analysis can be applied to modeling any signal along the genome in terms of the local occurrence of TFBSs. Indeed, in recent work (Arnold et al. 2012b) we applied the MARA approach to ChIP-seq data mapping the dynamics of trimethylation at lysine 27 of histone 3 (H3K27me3) and identified TFs involved in recruiting this epigenetic mark that is set by the Polycomb system. In ISMARA, the analysis of ChIP-seq data has now been completely automated. In particular, given a ChIP-seq data set, ISMARA quantifies the signal at all promoters across all samples and models this in terms of the TFBSs at each promoter. For the details of ISMARA’s processing and normalization of the ChIP-seq data, see Methods and Supplemental Methods. Similarly to the transcriptomic data, ISMARA thus by default focuses on the variation in ChIP-seq signals at promoters only. However, the approach can easily be applied genome-wide; and to allow expert users to apply MARA to any collection of genomic regions, the ISMARA website includes an ‘expert mode’ that allows users to upload their own signal and site-count matrices and apply MARA with these matrices.
To illustrate ISMARA’s results on ChIP-seq data, we make use of data from the ENCODE Project in which, besides gene expression, nine different chromatin marks were measured across eight different cell types (all modifications and cell types are listed in Supplemental Tables 4 and 5) (Ernst et al. 2011). We first ran ISMARA separately on each of the 10 data sets, i.e., expression and nine chromatin modifications (see Supplemental Table 6 for the URLs of the results on all data sets). We observed that motifs that are highly significant for explaining differences in levels of a particular chromatin mark across tissues were often also highly significant for explaining mRNA expression differences. This was particularly the case for methylation of lysine 4 on histone H3 (H3K4me2, H3K4me3), for acetylation of histone H3 (H3K9ac, H3K27ac), and for trimethylation of lysine 36 on histone H3 (H3K36me3). For example, Figure 5A shows the activity profiles for these marks for the SNAI1..3 motif, which is recognized by the snail TFs (see Supplemental Fig. 22 for additional examples). As is clear from these figures, for these motifs the activity profile for expression is highly similar to those of all of these histone marks. Indeed, this reflects that these chromatin marks are associated with promoter activity (Wang et al. 2008), and several recent studies have shown that the levels of these marks can be used to predict gene expression levels (Karlic et al. 2010; Dong et al. 2012; Tippmann et al. 2012).
Figure 5.

ISMARA predicts TFs involved in recruiting specific chromatin marks. (A) Activity across cell types of the SNAI1..3 motif in explaining expression (black), and levels of the chromatin marks H3K4me3 (dark green), H3K4me2 (light green), H3K9ac (dark blue), H3K27ac (light blue), and H3K36me3 (brown). (B) First principal component explaining the majority of variation in chromatin mark levels across all cell types. The bars indicate the relative contributions to the principal component of each mark. (C) Motif activities of the SNAI1..3 motif, as in A, but after removal of the first principal component. (D) Z-values and specificities (see text) of motifs for explaining H3K27me3 levels. The REST motif, with both highest Z-value and highest specificity, is indicated in red. (E) As in D, for H3K9ac levels. The two most significant motifs are shown in red. (F) As in D and E, for H3K27ac levels. (G) Activity, after removal of the first principal component, of the RFX motif for explaining H3K9ac (dark blue) and H3K27ac (light blue) levels. (H) As in G, for the ATF5_CREB motif.
To investigate the correlations between the levels of the different chromatin marks more quantitatively, we performed principal component analysis (PCA) of the levels of the 10 different marks across all promoters, separately for each sample (Supplemental Methods). Strikingly, we find that in each sample the first principal component explains the majority of the variance across promoters, typically explaining ∼60% of the total variance (Supplemental Fig. 23). Moreover, we find that the first principal component looks virtually identical for each sample (Supplemental Fig. 23), and Figure 5B shows the first principal component obtained using PCA on the pooled data from all cell types. The first principal vector has its highest positive component along the expression axis; and the activation-associated marks H3K4me3, H3K4me2, H3K9ac, H3K27ac, and H3K36me3 also all have a strong positive component in this vector, whereas the known repressive mark H3K27me3 has a negative component. These findings strongly suggest that variation along the first principal vector corresponds roughly to variation in ‘promoter activity.’ In addition, the fact that this first principal vector is identical in all tissues suggests that the relative levels of the different marks in this first principal vector result not from tissue-specific but from general factors, e.g., conceivably they may result from the general transcription machinery recruiting chromatin modifying enzymes.
Because the variation in promoter activity captures almost two-thirds of the variation in all 10 measured levels at the promoter, any motif explaining variation in expression will also appear to explain variation in all chromatin marks associated with promoter activity and confounds identification of TFs that are involved in affecting specific marks. To address this, for each motif we discarded the part of its activity profile along the first PCA component, retaining only variation in motif activities orthogonal to promoter activity. As illustrated in Figure 5C and Supplemental Figure 22, after removal of the first principal component, there are no longer any obvious correlations in the remaining motif activity profiles for different activating marks.
We next analyzed the remaining motif activities and calculated, for each motif and each mark, a Z-value quantifying the motif’s contribution to explaining the mark’s levels and also a ‘specificity’ that measures the fraction of a motif’s overall significance that is associated with a given mark (Supplemental Methods). Strikingly, we find that for many of the marks, the motifs that most significantly affect the mark are also among the most specific for that mark. For example, REST is the motif with the highest Z-value for H3K27me3 levels and is also by far the most specific for H3K27me3 (Fig. 5D). Indeed, in recent work (Arnold et al. 2012b), we showed that REST is involved in recruiting this mark during the differentiation of murine embryonic stem cells into pyramidal neurons, specifically at the neural progenitor state. With respect to the two acetylation marks, i.e., H3K9ac and H3K27ac, we find that the same two motifs, i.e., RFX and ATF/CREB, are most significant for both these marks (Fig. 5E,F). It is well known that ATF/CREB TFs can recruit histone acetylases (HATs), such as CREB binding protein (CREBBP) and EP300 (Yuan and Gambee 2001); and for RFX TFs it has also been established that they can recruit HATs at particular promoters (Masternak et al. 2003). Our results thus suggest that recruitment of HATs by TFs bound to ATF/CREB and RFX motifs make an important contribution to genome-wide histone acetylation at promoters. Moreover, the activity profiles of these motifs for H3K9ac and H3K27ac are highly similar, suggesting that these two marks may be recruited through a common or highly overlapping pathways. Supplemental Figure 24 shows the most significant motifs for each of the other marks. Among the additional predictions made by ISMARA is that the PITX motif is associated with both mono- and dimethylation of lysine 4 of histone 3. This prediction is supported by recent biochemical evidence that PITX2 can recruit methyltransferases that methylate H3K4 (Gan et al. 2011). As expected, CTCF is the most significant motif explaining CTCF binding. ISMARA also makes several predictions that are completely novel, as far as we have been able to determine: It predicts that the hepatocyte nuclear factors HNF1A and HNF4A have the most significant effect on the levels of the H3K36me3 mark, which is known to be set by elongating RNA polymerase (Kizer et al. 2005; Yuan et al. 2009), and the YY1 and the NF-Y complex (consisting of NFYA, NFYB, and NFYC) most significantly explain variations in H4K20me1 levels.
Discussion
The advent of high-throughput technologies now allows the routine measurement of genome-wide mRNA expression across conditions, and such data in principle provide the opportunity to systematically investigate gene regulation on a genome-wide scale across different model systems. However, a major bottleneck in the field is that such investigations require sophisticated computational approaches that are not available to most experimental researchers. Here we have presented ISMARA, a completely automated system that enables any researcher to apply sophisticated computational modeling, on data from their system of interest, and obtain concrete predictions on the key regulators acting in their system, their activities, their genome-wide targets, and so on.
That the computational model at the core of ISMARA, i.e., motif activity response analysis, is a powerful method for reconstructing regulatory interactions from high-throughput data has already been demonstrated, not only in its original application (The FANTOM Consortium et al. 2009), but in a substantial number of recent studies across a wide range of mammalian systems (Summers et al. 2010; Aceto et al. 2012; Arner et al. 2012; Arnold et al. 2012b; The FANTOM Consortium et al. 2012; Hasegawa et al. 2012; Pérez-Schindler et al. 2012; Eisele et al. 2013; Meier-Abt et al. 2013; Tiwari et al. 2013a,b; Vervoort et al. 2013). In each of these studies, MARA successfully inferred key regulators and their regulatory interactions ab initio. The applications in this work not only further confirm that in systems where key regulatory interactions are already known, ISMARA successfully infers them, but it also provides a large collection of novel regulatory predictions across different systems in human and mouse, e.g., novel regulators that are disregulated in cancers, novel regulatory interactions in the inflammatory response, and the core regulatory circuitry involved in mucociliary differentiation and ciliogenesis. We believe that by empowering experimental researchers to automatically apply this approach to their own data, ISMARA can make a substantial contribution to the study of gene regulatory networks.
The applications we presented highlighted several of ISMARA’s advantages. First, by inferring a regulator’s activity from the behavior of its targets, ISMARA does not rely on changes in a TF’s expression to infer activity changes and readily detects activity changes due to alternative splicing, post-translation modifications, changes in cellular localization, etc. Second, when motif activity is transcriptionally regulated, comparing motif activity with TF expression allows ISMARA to identify the relevant TF(s), i.e., as illustrated by the identification of RFX2 and RFX3 as the key regulators of mucociliary differentiation. Such comparisons can also indicate whether a regulator acts as a repressor or an activator. An important goal of ISMARA is to provide predictions that are amenable to direct experimental follow-up. In this respect, the GO enrichment and STRING network analysis are typically very helpful in identifying the biological processes and pathways targeted by each motif, often suggesting potential markers for experimentally validating their predicted regulatory roles. Similarly, ISMARA’s predictions of direct regulatory interactions between the key regulatory motifs provide concrete hypotheses regarding the regulatory circuitry that is acting in a given system, e.g., the predicted regulatory feedbacks between NFKB1/REL/RELA, IRF TFs, and PRDM1, or the prediction that MYBL1 is an upstream activator of RFX TFs in ciliogenesis. Moreover, the links to a genome browser view of the individual binding sites on the genome (Pachkov et al. 2007) allow for targeted validation of such individual regulatory interactions. There are many indications that the actions of miRNAs and TFs are tightly integrated (Cui et al. 2006; Hornstein and Shomron 2006; Zhou et al. 2007), and ISMARA’s incorporation of miRNA regulation allows for the automated identification of regulatory interactions between TFs and miRNAs as demonstrated by the analysis of the EMT data. Finally, gene expression regulation involves a tight interplay between the actions of TFs and changes in the chromatin state. ISMARA’s ability to not only model expression data, but any ChIP-seq signal at promoters genome-wide, allows for the identification of key TFs that are involved in dynamic regulation of the chromatin state, as exemplified here by the analysis of ChIP-seq data from the ENCODE Project, which predicted, among other things, regulatory factors involved in recruiting histone acetylations.
There are of course several limitations to ISMARA’s current approach which we aim to address in future work. First, using a simple linear model (Gao et al. 2004) has the advantage of being exactly solvable, but it ignores saturation effects that undoubtedly occur in reality. Second, the approach currently assumes that a given TF acts either mainly as an activator or mainly as a repressor, whereas it is clear that some TFs can act as an activator on some targets and as a repressor on others. Indeed, it has been recently shown (Bauer et al. 2010) that allowing such dual function of TFs can significantly increase correlation between model predictions and measurement. Explicitly considering higher-order constellations of TFBSs, e.g., the occurrence of pairs or triplets of TFBSs for particular combinations of TFs, is another extension that we are currently evaluating. The regulatory motifs currently included in ISMARA represent ∼350 of the roughly 1500 mammalian TFs. However, through developments in protein array technology (Bulyk 2006) and the decreasing cost in ChIP-seq experiments, regulatory motifs for a rapidly increasing number of additional mammalian TFs have recently become available. We are currently working on curating a new, highly extended set of regulatory motifs, which we expect to incorporate into ISMARA in the near future.
Finally, ISMARA currently focuses solely on predicted TFBSs in proximal promoters, ignoring the effects of distal enhancers. In contrast to promoters, accurate genome-wide maps of enhancers have not been available until recently. However, the discovery that active enhancers exhibit characteristic chromatin modification patterns (Heintzman et al. 2009), DNA methylation patterns (Stadler et al. 2011), and more generally DNA accessibility patterns (Boyle et al. 2008), has now led to the first genome-wide mappings of enhancers in specific cell types (Shen et al. 2012). If a set of relevant enhancers for a particular system of interest is available, it is in principle straightforward to predict TFBSs in these enhancers, and we are currently developing methodology for automatically incorporating the effects of TFBSs at distal enhancers into MARA. However, enhancers are highly cell-type specific; and in many cases, the data that users upload to ISMARA may come from systems for which no accurate mappings of distal enhancers are available. Therefore, automated incorporation of the effects of distal enhancers into ISMARA will only be possible when general methods for mapping active enhancers in any system have become available. Of course, the dynamics of chromatin accessibility and enhancer activity are themselves also controlled by constellations of regulatory sites on the genome, and our ultimate goal is to develop computational models that are able to predict genome-wide DNA accessibility and enhancer activity in terms of local constellations of regulatory sites.
Methods
In this section we outline the methods that were used for automated processing and modeling of the data. More detailed descriptions of all procedures are provided in Supplemental Methods.
Promoteromes and regulatory site predictions
For each model organism of interest (in this work we will focus exclusively on data from human and mouse), ISMARA relies on two precalculated resources: a genome-wide annotation of promoters and a comprehensive collection of transcription factor binding site (TFBS) predictions in all promoters (Fig. 1A,C). The genome-wide annotation of promoters in human and mouse, i.e., so-called “promoteromes,” were constructed primarily from deep sequencing data of transcription start sites (deepCAGE data) (de Hoon and Hayashizaki 2008) using Bayesian methods that we described previously (Balwierz et al. 2009). To infer expression levels of promoters from microarrays of RNA-seq data, it is necessary to associate all promoters with the transcripts that they drive. We thus collected the 5′ ends of all known mRNA mappings from the UCSC Genome Database, filtered these for mapping quality, and clustered all promoters and 5′ ends that are within 150 base pairs (bps). In this way, we obtained comprehensive sets of promoters and their associated transcripts for both human (36,383 promoters) and mouse (34,050 promoters). We also classified the promoters into CpG-rich and CpG-poor promoters based on their CG and CpG content.
We next comprehensively predicted TFBSs in the proximal promoter regions of all promoters. Briefly, we curated a collection of 190 WMs representing ∼350 mammalian TFs using data from the JASPAR (Wasserman and Sandelin 2004) and TRANSFAC (Matys et al. 2003) databases, additional motifs from the literature, and our own analysis of ChIP-chip and ChIP-seq data. For each promoter, we extracted 500 bps upstream of and downstream from the TSS and orthologous segments in six other mammals. The seven orthologous sequences were then multiply aligned using T-Coffee (Notredame et al. 2000). Using the 190 regulatory motifs and a phylogenetic tree of the species (Supplemental Fig. 1) as input, we then applied our MotEvo algorithm (Arnold et al. 2012a) to predict functional TFBSs for all TF regulatory motifs across all promoters in human and mouse (Fig. 1A,C). MotEvo is a Bayesian algorithm that considers all possible ways in which configurations of binding sites for all motifs, as well as additional conserved elements of unknown function, can be assigned to the input alignments, calculating likelihoods for all configurations using a rigorous model of the evolution of TFBSs and neutral sequence across the phylogeny. Since different motifs show different positioning preferences and abundances relative to TSS, which differ between CpG-rich and CpG-poor promoters, we also incorporated position-dependent prior probabilities for all motifs, separately for CpG and non-CpG promoters. We summarize the TFBS predictions in a matrix N, where Npm is the sum of the posterior probabilities of all predicted TFBSs for motif m in promoter p.
When modeling expression levels in terms of regulatory sites using a linear model, it is relatively straightforward to extend the modeling to not only include effects of TFBSs but also the effects of miRNA regulation, e.g., as recently introduced in a supervised learning scheme for modeling regulation in glioblastomas (Setty et al. 2012). In ISMARA, the effects of miRNA regulation have been incorporated into a completely automated procedure that can be applied to any expression data set. Specifically, we used miRNA target site predictions from TargetScan using preferential conservation scoring (PCT) (Friedman et al. 2009), which assigns target scores for 86 miRNA seed families to all RefSeq transcripts. To associate a target score Npm for miRNA seed family m targeting promoter p, we average TargetScan’s scores over all transcripts associated with promoter p.
Processing of raw microarray, ChIP-seq, and RNA-seq data
To perform ISMARA analysis, the user only needs to upload raw microarray (i.e., CEL files), RNA-seq, or ChIP-seq (BED or BAM files) data. The latter should contain the genomic mappings of the raw sequencing reads. The first part of ISMARA’s analysis consists of processing these raw data into a matrix E, where Eps denotes the ‘signal’ associated with promoter p for sample s.
When gene expression data is provided in the form of microarrays, ISMARA first automatically detects the particular type of microarray used and then applies corrections for background and unspecific binding tailored to that microarray type. Microarray platforms currently supported by ISMARA are listed in Supplemental Table 1. Using Gaussian mixture modeling, probes are classified into ‘expressed’ and ‘non-expressed’ for each sample. Probes that are consistently nonexpressed are removed and the intensities of the remaining probes are quantile normalized. Instead of relying on annotation of the manufacturer, we map all probe sequences to all transcripts associated with our promoters. The final log-expression of a given promoter is given by a weighted average of the log-intensities of all probes mapping to the transcripts associated with the promoter.
In many applications of next-generation sequencing data, a main aim of the analysis is to detect genomic regions that are significantly enriched, or transcripts that are significantly differentially expressed, so that the analysis crucially depends on the noise statistics of sequencing data (Balwierz et al. 2009; Anders and Huber 2010). In contrast, ISMARA aims to model the variation in ‘signal’ Eps, i.e., the amount of chromatin immunoprecipitation or the amount of expression, across promoters p and samples s in terms of predicted TFBSs. Our aim is thus not to assess the statistical significance of changes in the signal, but to estimate the relative strength of the signal across promoters and conditions. When processing ChIP-seq data, the signal Eps is calculated as the estimated logarithm of the fraction of reads in sample s that map to a 2-kilobase region centered on promoter p. To avoid large fluctuations in Eps at promoters with low signal due to sequencing noise, this estimate involves using a uniform prior distribution across the genome.
When processing RNA-seq data, the mapped reads are first mapped to our transcript set in a weighted manner. That is, when a read maps to n separate transcripts, each transcript’s read count is incremented by 1/n. The expression of each transcript is then estimated by dividing its read count by transcript length, and the expression of a promoter is calculated by summing the expression of the transcripts associated with it. The final level Eps is the logarithm of the estimated number of transcripts per million transcripts in the cells of sample s that derived from promoter p.
Inference of motif activities
At the core of ISMARA is the MARA model (The FANTOM Consortium et al. 2009) which, similar to previous linear modeling approaches (Gao et al. 2004; Nguyen and D’haeseleer 2006), assumes that the ‘signal’ at each promoter p is a linear function of its binding sites Npm:
where cp is a term reflecting the average activity of promoter p across the samples;  reflects the total expression in sample s; and the Ams are the (unknown) activities of each motif m in each sample s, which the model will infer. We set the constants
  and cp to their maximum likelihood estimates.
As a result, Equation (1) is renormalized into
where the matrix E′ is obtained by subtracting the row and column averages from the entries of E. Similarly, N′ is obtained by subtracting the column averages, i.e., the average number of sites 〈Nm〉 for each motif m, from the entries of N. Finally, the activities A′ are obtained by subtracting the average motif activities Am across the samples from the activities Ams. That is, in Equation (2) the expression changes across the samples, and promoters are modeled in terms of changes in site counts across promoters and changes in motif activities across the samples.
As explained in the Supplemental Methods, the noise term in the above equation is dominated not by measurement or biological replicate noise, but by the error in the model, and we assume these errors are Gaussian distributed with an unknown variance, σ2, that is integrated out of the likelihood. To infer the activities, ISMARA uses a Bayesian procedure that combines the Gaussian likelihood model for the difference between the measured signal  and the predicted signal with a Gaussian prior distribution for the activities. This prior distribution, which favors small activities, is used to avoid overfitting. Its parameter is estimated automatically using 80/20 cross-validation: The activities are inferred on a randomly chosen ‘training set’ of 80% of the promoters, and the prior’s parameter is set so as to maximize the fit of the predicted expression profiles on the ‘test set’ consisting of the remaining 20% of the promoters. In this way, ISMARA automatically adapts its prior to each data set that is submitted.
The final posterior distribution of motif activities is a multivariate Gaussian, which is determined using singular value decomposition (see Supplemental Methods). By projecting the multivariate Gaussian onto individual motifs, ISMARA also calculates standard deviations  on all motif activities. Finally, the overall significance of each motif m in explaining variations in
  is summarized by a z-like statistic,
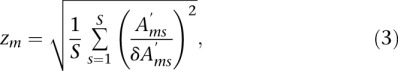 |
where S is the number of samples. The Z-scores calculate how many standard deviations away from zero on average the inferred motif activities are.
Popular alternatives to a Gaussian prior include Laplacian priors, also referred to as Lasso regularization (Tibshirani 1996), or a product of Gaussian and Laplacian priors, also referred to as elastic net regularization (Zou and Hastie 2005). These priors are often considered attractive because they induce sparsity, i.e., a subset of the fitted parameters will be set strictly to zero. However, since ISMARA by default sorts motifs by their significance zm, motifs with weak activities move to the bottom of the list, where they will be ignored by most users. Moreover, in some cases a user might be interested in the inferred activity of a particular motif, even if its significance is weak, and the Gaussian prior ensures that a nonzero motif activity profile is inferred for every motif.
Although users will typically be primarily interested in motif activity changes that explain expression changes across the conditions, in some situations it would also be interesting to fit the average expression 〈Ep〉 of each promoter, i.e., averaged across all samples, in terms of average motif activities Am. ISMARA fits such average activities using the same procedure, using a separate prior for the average motif activities Am, and fitting this prior separately using cross-validation.
Target predictions
ISMARA also predicts which individual promoters are regulated by each motif m. As detailed in the Supplemental Methods, for each promoter with predicted TFBSs for the motif (i.e., Npm > 0), ISMARA estimates the log-likelihood ratio Spm of the entire model with the TFBSs for m in p present and the model in which the entry Npm has been set to zero. That is, we in silico mutate the promoter p such that its TFBSs for motif m are removed and then recalculate the probability of the data E with this mutated site-count matrix, integrating over all unknown activities. Thus, Spm rigorously quantifies how much removal of the sites for m in p decreases the fit of the model to the data.
Finally, enrichment of targets within particular Gene Ontology categories is done by selecting all targets where inclusion of motif m substantially helps predicting the expression levels (Spm > 1) and performing a standard hypergeometric test. Target networks between motifs are constructed by drawing a link from motif m to m′ whenever m is predicted to target one of the promoters associated with a TF that is associated with motif m′.
Materials
The publically available data sets of gene expression profiling were obtained from Gene Expression Omnibus (http://www.ncbi.nlm.nih.gov/geo): time course of HUVEC after TNF treatment (GSE9055), mucociliary differentiation of airway epithelial cells (GSE5264), Novartis (GNF) SymAtlas (GSE1133), epithelial and mesenchymal subpopulations within immortalized human mammary epithelial cells (GSE28681), ENCODE ChIP-seq (GSE26386) and expression profiling (GSE26312) in human cell lines, and the Illumina Body Map 2 (GSE30611). Microarray files from the NCI-60 samples were downloaded from the project web page (http://genome-www.stanford.edu/nci60/).
Acknowledgments
We would like to thank Jean Hausser for help in the probewise processing of microarray data and members of the van Nimwegen research group for helpful discussions. E.v.N., P.A., and P.J.B. were supported by Grant SNF 3100A0-118318 from the Swiss National Science Foundation and by SystemsX.ch, the Swiss Initiative in Systems Biology, through the CellPlasticity project. A.J.G. was supported by the Werner Siemens-Foundation. M.P. was supported by a grant from the Swiss Institute of Bioinformatics.
Footnotes
[Supplemental material is available for this article.]
Article published online before print. Article, supplemental material, and publication date are at http://www.genome.org/cgi/doi/10.1101/gr.169508.113.
Freely available online through the Genome Research Open Access option.
References
- Aceto N, Sausgruber N, Brinkhaus H, Gaidatzis D, Martiny-Baron G, Mazzarol G, Confalonieri S, Quarto M, Hu G, Balwierz PJ, et al. 2012. Tyrosine phosphatase SHP2 promotes breast cancer progression and maintains tumor-initiating cells via activation of key transcription factors and a positive feedback signaling loop. Nat Med 18: 529–537 [DOI] [PubMed] [Google Scholar]
- Anders S, Huber W 2010. Differential expression analysis for sequence count data. Genome Biol 11: R106. [DOI] [PMC free article] [PubMed] [Google Scholar]
- Arner E, Mejhert N, Kulyté A, Balwierz PJ, Pachkov M, Cormont M, Lorente-Cebrián S, Ehrlund A, Laurencikiene J, Hedén P, et al. 2012. Adipose tissue microRNAs as regulators of CCL2 production in human obesity. Diabetes 61: 1986–1993 [DOI] [PMC free article] [PubMed] [Google Scholar]
- Arnold P, Erb I, Pachkov M, Molina N, van Nimwegen E 2012a. MotEvo: integrated Bayesian probabilistic methods for inferring regulatory sites and motifs on multiple alignments of DNA sequences. Bioinformatics 28: 487–494 [DOI] [PubMed] [Google Scholar]
- Arnold P, Schöler A, Pachkov M, Balwierz P, Jørgensen H, Stadler MB, van Nimwegen E, Schübeler D 2012b. Modeling of epigenome dynamics identifies transcription factors that mediate Polycomb targeting. Genome Res 23: 60–73 [DOI] [PMC free article] [PubMed] [Google Scholar]
- Ashburner M, Ball CA, Blake JA, Botstein D, Butler H, Cherry JM, Davis AP, Dolinski K, Dwight SS, Eppig JT, et al. 2000. Gene ontology: tool for the unification of biology. The Gene Ontology Consortium. Nat Genet 25: 25–29 [DOI] [PMC free article] [PubMed] [Google Scholar]
- Baek D, Villén J, Shin C, Camargo FD, Gygi SP, Bartel DP 2008. The impact of microRNAs on protein output. Nature 455: 64–71 [DOI] [PMC free article] [PubMed] [Google Scholar]
- Balwierz PJ, Carninci P, Daub CO, Kawai J, Hayashizaki Y, Belle WV, Beisel C, van Nimwegen E 2009. Methods for analyzing deep sequencing expression data: constructing the human and mouse promoterome with deepCAGE data. Genome Biol 10: R79. [DOI] [PMC free article] [PubMed] [Google Scholar]
- Bartel D 2009. MicroRNAs: target recognition and regulatory functions. Cell 136: 215–233 [DOI] [PMC free article] [PubMed] [Google Scholar]
- Bartoov-Shifman R, Hertz R, Wang H, Wollheim CB, Bar-Tana J, Walker MD 2002. Activation of the insulin gene promoter through a direct effect of hepatocyte nuclear factor 4α. J Biol Chem 277: 25914–25919 [DOI] [PubMed] [Google Scholar]
- Bauer DC, Buske FA, Bailey TL 2010. Dual-functioning transcription factors in the developmental gene network of Drosophila melanogaster. BMC Bioinformatics 11: 366. [DOI] [PMC free article] [PubMed] [Google Scholar]
- Bochkis IM, Schug J, Ye DZ, Kurinna S, Stratton SA, Barton MC, Kaestner KH 2012. Genome-wide location analysis reveals distinct transcriptional circuitry by paralogous regulators Foxa1 and Foxa2. PLoS Genet 8: e1002770. [DOI] [PMC free article] [PubMed] [Google Scholar]
- Boj SF, Parrizas M, Maestro MA, Ferrer J 2001. A transcription factor regulatory circuit in differentiated pancreatic cells. Proc Natl Acad Sci 98: 14481–14486 [DOI] [PMC free article] [PubMed] [Google Scholar]
- Bolcun-Filas E, Bannister LA, Barash A, Schimenti KJ, Hartford SA, Eppig JJ, Handel MA, Shen L, Schimenti JC 2011. A-MYB (MYBL1) transcription factor is a master regulator of male meiosis. Development 138: 3319–3330 [DOI] [PMC free article] [PubMed] [Google Scholar]
- Bonnafe E, Touka M, AitLounis A, Baas D, Barras E, Ucla C, Moreau A, Flamant F, Dubruille R, Couble P, et al. 2004. The transcription factor RFX3 directs nodal cilium development and left-right asymmetry specification. Mol Cell Biol 24: 4417–4427 [DOI] [PMC free article] [PubMed] [Google Scholar]
- Boyle AP, Davis S, Shulha HP, Meltzer P, Margulies EH, Weng Z, Furey TS, Crawford GE 2008. High-resolution mapping and characterization of open chromatin across the genome. Cell 132: 311–322 [DOI] [PMC free article] [PubMed] [Google Scholar]
- Bulyk ML 2006. DNA microarray technologies for measuring protein-DNA interactions. Curr Opin Biotechnol 17: 422–430 [DOI] [PMC free article] [PubMed] [Google Scholar]
- Calfon M, Zeng H, Urano F, Till JH, Hubbard SR, Harding HP, Clark SG, Ron D 2002. IRE1 couples endoplasmic reticulum load to secretory capacity by processing the XBP-1 mRNA. Nature 415: 92–96 [DOI] [PubMed] [Google Scholar]
- Campanero MR, Armstrong M, Flemington E 1999. Distinct cellular factors regulate the c-myb promoter through its E2F element. Mol Cell Biol 19: 8442–8450 [DOI] [PMC free article] [PubMed] [Google Scholar]
- Civelek M, Manduchi E, Riley RJ, Stoeckert CJ Jr, Davies PF 2009. Chronic endoplasmic reticulum stress activates unfolded protein response in arterial endothelium in regions of susceptibility to atherosclerosis. Circ Res 105: 453–461 [DOI] [PMC free article] [PubMed] [Google Scholar]
- Courtois G, Baumhueter S, Crabtree GR 1988. Purified hepatocyte nuclear factor 1 interacts with a family of hepatocyte-specific promoters. Proc Natl Acad Sci 85: 7937–7941 [DOI] [PMC free article] [PubMed] [Google Scholar]
- Cuervo AM, Dice JF 2000. When lysosomes get old. Exp Gerontol 35: 119–131 [DOI] [PubMed] [Google Scholar]
- Cui Q, Yu Z, Purisima E, Wang E 2006. Principles of microRNA regulation of a human cellular signaling network. Mol Syst Biol 2: 46. [DOI] [PMC free article] [PubMed] [Google Scholar]
- de Hoon M, Hayashizaki Y 2008. Deep cap analysis gene expression (CAGE): genome-wide identification of promoters, quantification of their expression, and network inference. Biotechniques 44: 627–632 [DOI] [PubMed] [Google Scholar]
- Djebali S, Davis CA, Merkel A, Dobin A, Lassmann T, Mortazavi A, Tanzer A, Lagarde J, Lin W, Schlesinger F, et al. 2012. Landscape of transcription in human cells. Nature 489: 101–108 [DOI] [PMC free article] [PubMed] [Google Scholar]
- Dong X, Greven MC, Kundaje A, Djebali S, Brown JB, Cheng C, Gingeras TR, Gerstein M, Guigo R, Birney E, et al. 2012. Modeling gene expression using chromatin features in various cellular contexts. Genome Biol 13: R53. [DOI] [PMC free article] [PubMed] [Google Scholar]
- Eisele PS, Salatino S, Sobek J, Hottiger MO, Handschin C 2013. The peroxisome proliferator-activated receptor γ coactivator 1α/β (PGC-1) coactivators repress the transcriptional activity of NF-κB in skeletal muscle cells. J Biol Chem 288: 2246–2260 [DOI] [PMC free article] [PubMed] [Google Scholar]
- El Zein L, Ait-Lounis A, Morlé L, Thomas J, Chhin B, Spassky N, Reith W, Durand B 2009. RFX3 governs growth and beating efficiency of motile cilia in mouse and controls the expression of genes involved in human ciliopathies. J Cell Sci 122: 3180–3189 [DOI] [PubMed] [Google Scholar]
- Ernst J, Kheradpour P, Mikkelsen TS, Shoresh N, Ward LD, Epstein CB, Zhang X, Wang L, Issner R, Coyne M, et al. 2011. Mapping and analysis of chromatin state dynamics in nine human cell types. Nature 473: 43–49 [DOI] [PMC free article] [PubMed] [Google Scholar]
- Fabian MR, Sonenberg N, Filipowicz W 2010. Regulation of mRNA translation and stability by microRNAs. Annu Rev Biochem 79: 351–379 [DOI] [PubMed] [Google Scholar]
- The FANTOM Consortium, Carninci P, Kasukawa T, Katayama S, Gough J, Frith MC, Maeda N, Oyama R, Ravasi T, Lenhard B, et al. 2005. The transcriptional landscape of the mammalian genome. Science 309: 1559–1563 [DOI] [PubMed] [Google Scholar]
- The FANTOM Consortium, Suzuki H, Forrest ARR, van Nimwegen E, Daub CO, Balwierz PJ, Irvine KM, Lassmann T, Ravasi T, Hasegawa Y, et al. 2009. The transcriptional network that controls growth arrest and differentiation in a human myeloid leukemia cell line. Nat Genet 41: 553–562 [DOI] [PMC free article] [PubMed] [Google Scholar]
- Friedman RC, Farh KKH, Burge CB, Bartel DP 2009. Most mammalian mRNAs are conserved targets of microRNAs. Genome Res 19: 92–105 [DOI] [PMC free article] [PubMed] [Google Scholar]
- Gan Q, Thiébaud P, Thézé N, Jin L, Xu G, Grant P, Owens GK 2011. WD repeat-containing protein 5, a ubiquitously expressed histone methyltransferase adaptor protein, regulates smooth muscle cell-selective gene activation through interaction with pituitary homeobox 2. J Biol Chem 286: 21853–21864 [DOI] [PMC free article] [PubMed] [Google Scholar]
- Gao F, Foat BC, Bussemaker HJ 2004. Defining transcriptional networks through integrative modeling of mRNA expression and transcription factor binding data. BMC Bioinformatics 5: 31. [DOI] [PMC free article] [PubMed] [Google Scholar]
- Gargalovic PS, Gharavi NM, Clark MJ, Pagnon J, Yang WP, He A, Truong A, Baruch-Oren T, Berliner JA, Kirchgessner TG, et al. 2006. The unfolded protein response is an important regulator of inflammatory genes in endothelial cells. Arterioscler Thromb Vasc Biol 26: 2490–2496 [DOI] [PubMed] [Google Scholar]
- Glimcher LH 2010. XBP1: the last two decades. Ann Rheum Dis (Suppl 1) 69: i67–i71 [DOI] [PubMed] [Google Scholar]
- Harada H, Takahashi E, Itoh S, Harada K, Hori TA, Taniguchi T 1994. Structure and regulation of the human interferon regulatory factor 1 (IRF-1) and IRF-2 genes: implications for a gene network in the interferon system. Mol Cell Biol 14: 1500–1509 [DOI] [PMC free article] [PubMed] [Google Scholar]
- Hasegawa R, Tomaru Y, de Hoon M, Suzuki H, Hayashizaki Y, Shin JW 2012. Identification of ZNF395 as a novel modulator of adipogenesis. Exp Cell Res 319: 68–76 [DOI] [PubMed] [Google Scholar]
- Heintzman ND, Hon GC, Hawkins RD, Kheradpour P, Stark A, Harp LF, Ye Z, Lee LK, Stuart RK, Ching CW, et al. 2009. Histone modifications at human enhancers reflect global cell-type-specific gene expression. Nature 459: 108–112 [DOI] [PMC free article] [PubMed] [Google Scholar]
- Hornstein E, Shomron N 2006. Canalization of development by microRNAs. Nat Genet (Suppl) 38: S20–S24 [DOI] [PubMed] [Google Scholar]
- Horvath GC, Kistler MK, Kistler WS 2009. RFX2 is a candidate downstream amplifier of A-MYB regulation in mouse spermatogenesis. BMC Dev Biol 9: 63. [DOI] [PMC free article] [PubMed] [Google Scholar]
- Inoue K, Kobayashi M, Yano K, Miura M, Izumi A, Mataki C, Doi T, Hamakubo T, Reid PC, Hume DA, et al. 2006. Histone deacetylase inhibitor reduces monocyte adhesion to endothelium through the suppression of vascular cell adhesion molecule-1 expression. Arterioscler Thromb Vasc Biol 26: 2652–2659 [DOI] [PubMed] [Google Scholar]
- Jacob F, Monod J 1961. Genetic regulatory mechanisms in the synthesis of proteins. J Mol Biol 3: 318–356 [DOI] [PubMed] [Google Scholar]
- Jensen LJ, Kuhn M, Stark M, Chaffron S, Creevey C, Muller J, Doerks T, Julien P, Roth A, Simonovic M, et al. 2009. STRING 8—a global view on proteins and their functional interactions in 630 organisms. Nucleic Acids Res 37: D412–D416 [DOI] [PMC free article] [PubMed] [Google Scholar]
- Karlic R, Chung HR, Lasserre J, Vlahovicek K, Vingron M 2010. Histone modification levels are predictive for gene expression. Proc Natl Acad Sci 107: 2926–2931 [DOI] [PMC free article] [PubMed] [Google Scholar]
- Kaser A, Lee AH, Franke A, Glickman JN, Zeissig S, Tilg H, Nieuwenhuis EES, Higgins DE, Schreiber S, Glimcher LH, et al. 2008. XBP1 links ER stress to intestinal inflammation and confers genetic risk for human inflammatory bowel disease. Cell 134: 743–756 [DOI] [PMC free article] [PubMed] [Google Scholar]
- Kasowski M, Grubert F, Heffelfinger C, Hariharan M, Asabere A, Waszak SM, Habegger L, Rozowsky J, Shi M, Urban AE, et al. 2010. Variation in transcription factor binding among humans. Science 328: 232–235 [DOI] [PMC free article] [PubMed] [Google Scholar]
- Kawata H, Yamada K, Shou Z, Mizutani T, Yazawa T, Yoshino M, Sekiguchi T, Kajitani T, Miyamoto K 2003. Zinc-fingers and homeoboxes (ZHX) 2, a novel member of the ZHX family, functions as a transcriptional repressor. Biochem J 373: 747–757 [DOI] [PMC free article] [PubMed] [Google Scholar]
- Kempe S, Kestler H, Lasar A, Wirth T 2005. NF-κB controls the global pro-inflammatory response in endothelial cells: evidence for the regulation of a pro-atherogenic program. Nucleic Acids Res 33: 5308–5319 [DOI] [PMC free article] [PubMed] [Google Scholar]
- Kim YM, Shin HT, Seo YH, Byun HO, Yoon SH, Lee IK, Hyun DH, Chung HY, Yoon G 2010. Sterol regulatory element-binding protein (SREBP)-1-mediated lipogenesis is involved in cell senescence. J Biol Chem 285: 29069–29077 [DOI] [PMC free article] [PubMed] [Google Scholar]
- Kitamura M 2011. Control of NF-κB and inflammation by the unfolded protein response. Int Rev Immunol 30: 4–15 [DOI] [PubMed] [Google Scholar]
- Kizer KO, Phatnani HP, Shibata Y, Hall H, Greenleaf AL, Strahl BD 2005. A novel domain in Set2 mediates RNA polymerase II interaction and couples histone H3 K36 methylation with transcript elongation. Mol Cell Biol 25: 3305–3316 [DOI] [PMC free article] [PubMed] [Google Scholar]
- Kuo CJ, Conley PB, Hsieh CL, Francke U, Crabtree GR 1990. Molecular cloning, functional expression, and chromosomal localization of mouse hepatocyte nuclear factor 1. Proc Natl Acad Sci 87: 9838–9842 [DOI] [PMC free article] [PubMed] [Google Scholar]
- Kurz DJ, Decary S, Hong Y, Erusalimsky JD 2000. Senescence-associated β-galactosidase reflects an increase in lysosomal mass during replicative ageing of human endothelial cells. J Cell Sci 113: 3613–3622 [DOI] [PubMed] [Google Scholar]
- Landgraf P, Rusu M, Sheridan R, Sewer A, Iovino N, Aravin A, Pfeffer S, Rice A, Kamphorst AO, Landthaler M, et al. 2007. A mammalian microRNA expression atlas based on small RNA library sequencing. Cell 129: 1401–1414 [DOI] [PMC free article] [PubMed] [Google Scholar]
- Li J, Wang JJ, Zhang SX 2011. Preconditioning with endoplasmic reticulum stress mitigates retinal endothelial inflammation via activation of X-box binding protein 1. J Biol Chem 286: 4912–4921 [DOI] [PMC free article] [PubMed] [Google Scholar]
- Liang YJ, Wang QY, Zhou CX, Yin QQ, He M, Yu XT, Cao DX, Chen GQ, He JR, Zhao Q 2013. MiR-124 targets Slug to regulate epithelial-mesenchymal transition and metastasis of breast cancer. Carcinogenesis 34: 713–722 [DOI] [PMC free article] [PubMed] [Google Scholar]
- Lim LP, Lau NC, Garrett-Engele P, Grimson A, Schelter JM, Castle J, Bartel DP, Linsley PS, Johnson JM 2005. Microarray analysis shows that some microRNAs downregulate large numbers of target mRNAs. Nature 433: 769–773 [DOI] [PubMed] [Google Scholar]
- Martins G, Calame K 2008. Regulation and functions of Blimp-1 in T and B lymphocytes. Annu Rev Immunol 26: 133–169 [DOI] [PubMed] [Google Scholar]
- Masternak K, Peyraud N, Krawczyk M, Barras E, Reith W 2003. Chromatin remodeling and extragenic transcription at the MHC class II locus control region. Nat Immunol 4: 132–137 [DOI] [PubMed] [Google Scholar]
- Matys V, Fricke E, Geffers R, Gößling E, Haubrock M, Hehl R, Hornischer K, Karas D, Kel AE, Kel-Margoulis OV, et al. 2003. TRANSFAC: transcriptional regulation, from patterns to profiles. Nucleic Acids Res 31: 374–378 [DOI] [PMC free article] [PubMed] [Google Scholar]
- Meier-Abt F, Milani E, Roloff T, Brinkhaus H, Duss S, Meyer DS, Klebba I, Balwierz PJ, van Nimwegen E, Bentires-Alj M 2013. Parity induces differentiation and reduces Wnt/Notch signaling ratio and proliferation potential of basal stem/progenitor cells isolated from mouse mammary epithelium. Breast Cancer Res 15: R36. [DOI] [PMC free article] [PubMed] [Google Scholar]
- Molero X, Vaquero EC, Flández M, González AM, Ortiz MA, Cibrián-Uhalte E, Servitja JM, Merlos A, Juanpere N, Massumi M, et al. 2012. Gene expression dynamics after murine pancreatitis unveils novel roles for Hnf1α in acinar cell homeostasis. Gut 61: 1187–1196 [DOI] [PubMed] [Google Scholar]
- Nguyen DH, D’haeseleer P 2006. Deciphering principles of transcription regulation in eukaryotic genomes. Mol Syst Biol 2: 2006.0012. [DOI] [PMC free article] [PubMed] [Google Scholar]
- Notredame C, Higgins DG, Heringa J 2000. T-Coffee: a novel method for fast and accurate multiple sequence alignment. J Mol Biol 302: 205–217 [DOI] [PubMed] [Google Scholar]
- Novershtern N, Subramanian A, Lawton LN, Mak RH, Haining WN, McConkey ME, Habib N, Yosef N, Chang CY, Shay T, et al. 2011. Densely interconnected transcriptional circuits control cell states in human hematopoiesis. Cell 144: 296–309 [DOI] [PMC free article] [PubMed] [Google Scholar]
- Okamoto K, Kakuma T, Fukuchi S, Masaki T, Sakata T, Yoshimatsu H 2006. Sterol regulatory element binding protein (SREBP)-1 expression in brain is affected by age but not by hormones or metabolic changes. Brain Res 1081: 19–27 [DOI] [PubMed] [Google Scholar]
- Pachkov M, Erb I, Molina N, van Nimwegen E 2007. SwissRegulon: a database of genome-wide annotations of regulatory sites. Nucleic Acids Res 35: D127–D131 [DOI] [PMC free article] [PubMed] [Google Scholar]
- Pérez-Schindler J, Summermatter S, Salatino S, Zorzato F, Beer M, Balwierz PJ, van Nimwegen E, Feige JN, Auwerx J, Handschin C 2012. The corepressor NCoR1 antagonizes PGC-1α and ERRα in the regulation of skeletal muscle function and oxidative metabolism. Mol Cell Biol 32: 4913–4924 [DOI] [PMC free article] [PubMed] [Google Scholar]
- Peterson TR, Sengupta SS, Harris TE, Carmack AE, Kang SA, Balderas E, Guertin DA, Madden KL, Carpenter AE, Finck BN, et al. 2011. mTOR complex 1 regulates lipin 1 localization to control the SREBP pathway. Cell 146: 408–420 [DOI] [PMC free article] [PubMed] [Google Scholar]
- Piaggio G, Tomei L, Toniatti C, De Francesco R, Gerstner J, Cortese R 1994. LFB1/HNF1 acts as a repressor of its own transcription. Nucleic Acids Res 22: 4284–4290 [DOI] [PMC free article] [PubMed] [Google Scholar]
- Polyak K, Weinberg RA 2009. Transitions between epithelial and mesenchymal states: acquisition of malignant and stem cell traits. Nat Rev Cancer 9: 265–273 [DOI] [PubMed] [Google Scholar]
- Ponomarev ED, Veremeyko T, Barteneva N, Krichevsky AM, Weiner HL 2011. MicroRNA-124 promotes microglia quiescence and suppresses EAE by deactivating macrophages via the C/EBP-α-PU.1 pathway. Nat Med 17: 64–70 [DOI] [PMC free article] [PubMed] [Google Scholar]
- Pontoglio M, Barra J, Hadchouel M, Doyen A, Kress C, Bach JP, Babinet C, Yaniv M 1996. Hepatocyte nuclear factor 1 inactivation results in hepatic dysfunction, phenylketonuria, and renal Fanconi syndrome. Cell 84: 575–585 [DOI] [PubMed] [Google Scholar]
- Ross DT, Scherf U, Eisen MB, Perou CM, Rees C, Spellman P, Iyer V, Jeffrey SS, de Rijn MV, Waltham M, et al. 2000. Systematic variation in gene expression patterns in human cancer cell lines. Nat Genet 24: 227–235 [DOI] [PubMed] [Google Scholar]
- Ross AJ, Dailey LA, Brighton LE, Devlin RB 2007. Transcriptional profiling of mucociliary differentiation in human airway epithelial cells. Am J Respir Cell Mol Biol 37: 169–185 [DOI] [PubMed] [Google Scholar]
- Rubinsztein DC, Marino G, Kroemer G 2011. Autophagy and aging. Cell 146: 682–695 [DOI] [PubMed] [Google Scholar]
- Scheel C, Eaton EN, Li SHJ, Chaffer CL, Reinhardt F, Kah KJ, Bell G, Guo W, Rubin J, Richardson AL, et al. 2011. Paracrine and autocrine signals induce and maintain mesenchymal and stem cell states in the breast. Cell 145: 926–940 [DOI] [PMC free article] [PubMed] [Google Scholar]
- Seifert U, Bialy LP, Ebstein F, Bech-Otschir D, Voigt A, Schröter F, Prozorovski T, Lange N, Steffen J, Rieger M, et al. 2010. Immunoproteasomes preserve protein homeostasis upon interferon-induced oxidative stress. Cell 142: 613–624 [DOI] [PubMed] [Google Scholar]
- Seo YK, Jeon TI, Chong HK, Biesinger J, Xie X, Osborne TF 2011. Genome-wide localization of SREBP-2 in hepatic chromatin predicts a role in autophagy. Cell Metab 13: 367–375 [DOI] [PMC free article] [PubMed] [Google Scholar]
- Serfas MS, Tyner AL 1993. HNF-1 α and HNF-1 β expression in mouse intestinal crypts. Am J Physiol 265: G506–G513 [DOI] [PubMed] [Google Scholar]
- Setty M, Helmy K, Khan AA, Silber J, Arvey A, Neezen F, Agius P, Huse JT, Holland EC, Leslie CS 2012. Inferring transcriptional and microRNA-mediated regulatory programs in glioblastoma. Mol Syst Biol 8: 605. [DOI] [PMC free article] [PubMed] [Google Scholar]
- Shen Y, Yue F, McCleary DF, Ye Z, Edsall L, Kuan S, Wagner U, Dixon J, Lee L, Lobanenkov VV, et al. 2012. A map of the cis-regulatory sequences in the mouse genome. Nature 488: 116–120 [DOI] [PMC free article] [PubMed] [Google Scholar]
- Shi XB, Xue L, Ma AH, Tepper CG, Gandour-Edwards R, Kung HJ, deVere White RW 2013. Tumor suppressive miR-124 targets androgen receptor and inhibits proliferation of prostate cancer cells. Oncogene 32: 4130–4138 [DOI] [PMC free article] [PubMed] [Google Scholar]
- Stadler MB, Murr R, Burger L, Ivanek R, Lienert F, Scholer A, van Nimwegen E, Wirbelauer C, Oakeley EJ, Gaidatzis D, et al. 2011. DNA-binding factors shape the mouse methylome at distal regulatory regions. Nature 480: 490–495 [DOI] [PubMed] [Google Scholar]
- Su AI, Wiltshire T, Batalov S, Lapp H, Ching KA, Block D, Zhang J, Soden R, Hayakawa M, Kreiman G, et al. 2004. A gene atlas of the mouse and human protein-encoding transcriptomes. Proc Natl Acad Sci 101: 6062–6067 [DOI] [PMC free article] [PubMed] [Google Scholar]
- Summers KM, Raza S, van Nimwegen E, Freeman TC, Hume DA 2010. Co-expression of FBN1 with mesenchyme-specific genes in mouse cell lines: implications for phenotypic variability in Marfan syndrome. Eur J Hum Genet 18: 1209–1215 [DOI] [PMC free article] [PubMed] [Google Scholar]
- Suzuki T, Nakano-Ikegaya M, Yabukami-Okuda H, de Hoon M, Severin J, Saga-Hatano S, Shin JW, Kubosaki A, Simon C, Hasegawa Y, et al. 2012. Reconstruction of monocyte transcriptional regulatory network accompanies monocytic functions in human fibroblasts. PLoS ONE 7: e33474. [DOI] [PMC free article] [PubMed] [Google Scholar]
- Ten RM, Blank V, Le Bail O, Kourilsky P, Israël A 1993. Two factors, IRF1 and KBF1/NF-kappa B, cooperate during induction of MHC class I gene expression by interferon alpha beta or Newcastle disease virus. C R Acad Sci III 316: 496–501 [PubMed] [Google Scholar]
- Tibshirani R 1996. Regression shrinkage and selection via the lasso. J R Stat Soc Ser B Methodol 58: 267–288 [Google Scholar]
- Tippmann SC, Ivanek R, Gaidatzis D, Schöler A, Hoerner L, van Nimwegen E, Stadler PF, Stadler MB, Schübeler D 2012. Chromatin measurements reveal contributions of synthesis and decay to steady-state mRNA levels. Mol Syst Biol 8: 593. [DOI] [PMC free article] [PubMed] [Google Scholar]
- Tiwari N, Meyer-Schaller N, Arnold P, Antoniadis H, Pachkov M, van Nimwegen E, Christofori G 2013a. Klf4 is a transcriptional regulator of genes critical for EMT, including Jnk1 (Mapk8). PLoS ONE 8: e57329. [DOI] [PMC free article] [PubMed] [Google Scholar]
- Tiwari N, Tiwari VK, Waldmeier L, Balwierz PJ, Arnold P, Pachkov M, Meyer-Schaller N, Schübeler D, van Nimwegen E, Christofori G 2013b. Sox4 is a master regulator of epithelial-mesenchymal transition by controlling Ezh2 expression and epigenetic reprogramming. Cancer Cell 23: 768–783 [DOI] [PubMed] [Google Scholar]
- Tomaru Y, Nakanishi M, Miura H, Kimura Y, Ohkawa H, Ohta Y, Hayashizaki Y, Suzuki M 2009. Identification of an inter-transcription factor regulatory network in human hepatoma cells by Matrix RNAi. Nucleic Acids Res 37: 1049–1060 [DOI] [PMC free article] [PubMed] [Google Scholar]
- Toscani A, Mettus RV, Coupland R, Simpkins H, Litvin J, Orth J, Hatton KS, Reddy EP 1997. Arrest of spermatogenesis and defective breast development in mice lacking A-myb. Nature 386: 713–717 [DOI] [PubMed] [Google Scholar]
- van Nimwegen E 2007. Finding regulatory elements and regulatory motifs: a general probabilistic framework. BMC Bioinformatics (Suppl 6) 8: S4. [DOI] [PMC free article] [PubMed] [Google Scholar]
- Vaquerizas JM, Kummerfeld SK, Teichmann SA, Luscombe NM 2009. A census of human transcription factors: function, expression and evolution. Nat Rev Genet 10: 252–263 [DOI] [PubMed] [Google Scholar]
- Vervoort SJ, Lourenço AR, van Boxtel R, Coffer PJ 2013. SOX4 mediates TGF-β-induced expression of mesenchymal markers during mammary cell epithelial to mesenchymal transition. PLoS ONE 8: e53238. [DOI] [PMC free article] [PubMed] [Google Scholar]
- Wada Y, Ohta Y, Xu M, Tsutsumi S, Minami T, Inoue K, Komura D, Kitakami J, Oshida N, Papantonis A, et al. 2009. A wave of nascent transcription on activated human genes. Proc Natl Acad Sci 106: 18357–18361 [DOI] [PMC free article] [PubMed] [Google Scholar]
- Wang Z, Zang C, Rosenfeld JA, Schones DE, Barski A, Cuddapah S, Cui K, Roh TY, Peng W, Zhang MQ, et al. 2008. Combinatorial patterns of histone acetylations and methylations in the human genome. Nat Genet 40: 897–903 [DOI] [PMC free article] [PubMed] [Google Scholar]
- Wasserman WW, Sandelin A 2004. Applied bioinformatics for the identification of regulatory elements. Nat Rev Genet 5: 276–287 [DOI] [PubMed] [Google Scholar]
- Yosef N, Shalek AK, Gaublomme JT, Jin H, Lee Y, Awasthi A, Wu C, Karwacz K, Xiao S, Jorgolli M, et al. 2013. Dynamic regulatory network controlling TH17 cell differentiation. Nature 496: 461–468 [DOI] [PMC free article] [PubMed] [Google Scholar]
- Yoshida H, Matsui T, Yamamoto A, Okada T, Mori K 2001. XBP1 mRNA is induced by ATF6 and spliced by IRE1 in response to ER stress to produce a highly active transcription factor. Cell 107: 881–891 [DOI] [PubMed] [Google Scholar]
- Yuan LW, Gambee JE 2001. Histone acetylation by p300 is involved in CREB-mediated transcription on chromatin. Biochim Biophys Acta 1541: 161–169 [DOI] [PubMed] [Google Scholar]
- Yuan W, Xie J, Long C, Erdjument-Bromage H, Ding X, Zheng Y, Tempst P, Chen S, Zhu B, Reinberg D 2009. Heterogeneous nuclear ribonucleoprotein L is a subunit of human KMT3a/Set2 complex required for H3 Lys-36 trimethylation activity in vivo. J Biol Chem 284: 15701–15707 [DOI] [PMC free article] [PubMed] [Google Scholar]
- Zhou Y, Ferguson J, Chang J, Kluger Y 2007. Inter- and intra-combinatorial regulation by transcription factors and microRNAs. BMC Genomics 8: 396. [DOI] [PMC free article] [PubMed] [Google Scholar]
- Zou H, Hastie T 2005. Regularization and variable selection via the elastic net. J R Stat Soc Ser B Methodol 67: 301–320 [Google Scholar]