

Abstract
Ag presentation to CD8+ T cells commences immediately after infection, which facilitates their rapid expansion and control of pathogen. This paradigm is not followed during infection with virulent Salmonella enterica serovar Typhimurium (ST), an intracellular bacterium that causes mortality in susceptible C57BL/6J mice within 7 days and a chronic infection in resistant mice (129 × 1SvJ). Infection of mice with OVA-expressing ST results in the development of a CD8+ T cell response that is detectable only after the second week of infection despite the early detectable bacterial burden. The mechanism behind the delayed CD8+ T cell activation was evaluated, and it was found that dendritic cells/macrophages or mice infected with ST-OVA failed to present Ag to OVA-specific CD8+ T cells. Lack of early Ag presentation was not rescued when mice or dendritic cells/macrophages were infected with an attenuated aroA mutant of ST or with mutants having defective Salmonella pathogenicity island I/II genes. Although extracellular ST proliferated extensively, the replication of ST was highly muted once inside macrophages. This muted intracellular proliferation of ST resulted in the generation of poor levels of intracellular Ag and peptide-MHC complex on the surface of dendritic cells. Additional experiments revealed that ST did not actively inhibit Ag presentation, rather it inhibited the uptake of another intracellular pathogen, Listeria monocytogenes, thereby causing inhibition of Ag presentation against L. monocytogenes. Taken together, this study reveals a dichotomy in the proliferation of ST and indicates that selectively reduced intra-cellular proliferation of virulent pathogens may be an important mechanism of immune evasion.
Antigen presentation to CD8+ T cells commences immediately after infection (1–3), followed by an intense phase of expansion of the CD8+ T cell response (4). Subsequently, the majority (>95%) of the primed CD8+ T cells are eliminated, and only a small portion of those T cells survive (<5%) for extended periods as memory cells (5–9). Memory CD4+ and CD8+ T cells have been segregated phenotypically and functionally into effector memory and central memory populations based on the expression of CD62L and CCR7 (10–12). Tissue-homing “effector memory T cells” (CD62LlowCCR7−) are capable of immediate effector function, whereas lymph node homing “central memory T cells” (CD62LhighCCR7+) are devoid of effector activity in vitro (12) but proliferate profoundly in vivo (8, 13–15).
In addition to playing a key role during viral infections, CD8+ T cells also play an important role in mediating protection against intracellular bacteria such as Listeria monocytogenes (LM)3 (16–18), Mycobacterium tuberculosis (19), and Salmonella enterica serovar Typhimurium (ST) (20, 21). ST is a highly virulent pathogen that induces gastroenteritis in humans. In susceptible C57BL/6J mice, which lack natural resistance-associated macrophage proteins (NRAMP), ST (strain SL1344) induces a systemic lethal infection even when used at doses as low as 102 i.v., and all mice die within 7 days of infection. In contrast, ST induces a chronic but nonlethal infection in resistant 129SvJ or B6.129 F1 mice (which express NRAMP), and the infection is usually cleared around days 60–90. ST survives within macrophages and epithelial cells, and the intracellular replication of ST is considered to be essential for virulence (22). The genes that are involved in Salmonella invasion of epithelial cells are clustered at one location on the bacterial chromosome (centisome 63; Salmonella pathogenicity island (SPI)-1 (23–26). They encode several factors, including a type III secretory apparatus that exports specific proteins (effectors) into the host cell. The invA mutant of ST is unable to invade epithelial cells and is attenuated for oral but not i.v. infection of mice (27). invA is a putative inner membrane component of the SPI-1 type III secretion system (25). Two major virulence loci allow Salmonella to survive and replicate inside cells (28). The two-component regulatory system phoP/phoQ, which controls >40 different genes (29, 30), is involved in intracellular survival (31). ssaR is a mutant of another pathogenicity island (SPI-2) that encodes a second type III secretion system that mediates resistance to intracellular killing and is key to bacterial virulence (32, 33).
We have previously reported that both naive and memory CD8+ T cells respond with delayed kinetics during ST-OVA infection (34). OVA-specific CD8+ T cells that are eventually induced against ST-OVA display a persistently activated phenotype, secrete IFN-γ, and kill targets specifically in vivo, suggesting that the OVA-specific CD8+ T cells generated are functional (34). In this report we examined whether the muted CD8+ T cell priming during infection with ST is due to its poor intracellular proliferation or to its active inhibition of Ag presentation. Using various mutants of ST and various in vitro and in vivo models of Ag presentation, our results indicate that ST displays selectively poor intracellular proliferation that translates into the generation of poor intracellular Ag levels and MHC-peptide complexes and hence results in poor CD8+ T cell priming.
Materials and Methods
Bacterial strains
The gene for OVA was introduced into the virulent SL1344 ST strain and into various mutants (aroA, phoP, ssaR, and invA) of ST. The plasmid pKK-OVA (35, 36) (10–100 ng of DNA) carrying the full-length OVA was electroporated into ST as described previously (34). Expression of OVA by recombinant wild-type (WT) ST-OVA and the various mutants of ST-OVA was determined by an enhanced chemiluminescence detection system as described previously (37). ST-OVA were grown in liquid culture at 37°C under constant shaking in brain-heart infusion (BHI) medium (Difco Laboratories). At mid-log phase (OD600 nm = 0.8), bacteria were harvested and frozen at −80°C (in 20% glycerol). CFU were determined by performing serial dilutions in 0.9% NaCl, which were spread on BHI-streptomycin agar plates.
OVA-expressing LM (LM-OVA), as described previously (38), was grown to an OD600 nm of 0.4. The bacteria were grown in BHI medium (Difco Laboratories) supplemented with 50 μg/ml streptomycin (Sigma-Aldrich). At mid-log phase (OD.600 = 1.0), bacteria were harvested and frozen in 20% glycerol and stored at −80°C. CFU were determined by performing serial dilutions in 0.9% NaCl, which were spread on BHI-streptomycin agar plates.
Mice and immunizations
C57BL/6 and 129 × 1SvJ mice were obtained from The Jackson Laboratory. B6129 F1 mice were generated in-house in our experimental animal facility by mating 129 × 1SvJ female mice with C57BL/6 male mice. CD45.1+45.2−OT-1 TCR transgenic mice were derived in house by mating OT-1 mice (The Jackson Laboratory) with B6.SJL mice (The Jackson Laboratory). For immunization, frozen stocks of bacteria were thawed and diluted in 0.9% NaCl. Mice were inoculated with 1 × 10³ organisms suspended in 200 μl of 0.9% NaCl via the lateral tail vein (i.v.).
Assessment of bacterial burden
Single cell suspensions were obtained from the spleens of infected mice in RPMI 1640. An aliquot of the suspension was lysed with water for 30 s and then evaluated for the numbers of viable bacteria. CFU were determined by plating 100-μl aliquots of serial 10-fold dilutions in 0.9% saline on BHI plates as described above.
Quantitative RT-PCR
Quantitative RT-PCR was performed as described in detail previously (37, 39). Expression of OVA mRNA and total bacterial RNA (16S) was evaluated in LM-OVA and ST-OVA growing extracellularly in broth cultures, intracellularly within macrophages in vitro, and within spleens in vivo. For evaluation of expression in infected spleens, 5–10 μg of total RNA was taken for cDNA synthesis. For in vitro cultures, only 50–250 ng of RNA was used for cDNA synthesis and ~100 ng of cDNA was used for real-time PCR. To obtain a standard curve for each primer-template set, five different PCRs were performed in parallel by using as a template 10-fold dilutions of known amounts of ST-OVA or LM-OVA chromosomal DNA (0.01, 0.1, 1, 10, and 100 attomol), together with triplicate or duplicate reactions of the uncharacterized samples. PCR conditions were optimized based on the melting curve of each primer and its target. PCR was performed in sealed tubes in a 96-well microtiter plate in an iCycler iQ thermal cycler (Bio-Rad Laboratories). The 26-μl reaction consisted of 12.5 μl of quantitative PCR SYBR Green SuperMix (ABgene), 1.2 μl of each primer, 9.1 μl of DNase/RNase-free, double-distilled H2O, and 1 μl of template. Thermal conditions were as follows: activation at 95°C for 15 min, followed by 40 cycles of denaturation at 95°C for 30 s, annealing at 60°C for 30 s, and extension at 72°C for 1 min. Melting curve protocol was performed to verify that the products had the expected melting temperature. Fluorescence was measured during the annealing step and plotted against the amplification cycle. Absolute quantitative analysis of the data was extrapolated from the standard curve, and attomole quantities were mathematically converted to numbers of detectable RNA molecules. Primer efficiencies were between 98 and 100%.
Intracellular proliferation
The intracellular proliferation of LM and ST was evaluated on IC-21 macrophages (H-2b) as described previously (22). IC-21 cells were seeded (in RPMI 1640 plus 8% FBS) into 24-well plates (104–105/well) and infected with LM-OVA or ST-OVA. After 15 min, cells were washed and extra-cellular bacteria removed after incubation in medium containing gentamicin (50 μg/ml). Each incubation step was conducted at 37°C in a CO2 incubator. Two hours after infection, cells were washed with medium containing gentamicin (5 μg/ml) and the numbers of intracellular bacteria were enumerated by lysing macrophages and plating serial dilutions on BHI agar plates. Aliquots of cells were further cultured in RPMI plus 8% FBS medium containing 5 μg/ml gentamicin to allow intracellular, but not extra-cellular, proliferation of LM or ST. At various time intervals, intracellular bacterial burden was evaluated. Cells were spun down, medium was aspirated, and cells were lysed using cell lysis buffer (1% Triton X-100 plus 0.1% SDS in PBS (pH 7.2)). Appropriate dilutions were made in 0.9% saline, and 100-μl aliquots were plated on BHI plates.
Ag presentation models
Ag presentation was evaluated using in vitro and in vivo models. For evaluation of Ag presentation in vitro, macrophages (IC-21 cells; H-2b) or dendritic cells (JAWS, H-2b) were irradiated (10,000 rad) and seeded (in RPMI 1640 plus 8% FBS) into 24-well plates (104–105/well) and infected with bacteria (various doses). After 15 min, cells were washed and extra-cellular bacteria were removed after incubation in medium containing gentamicin (50 μ g/ml). Each incubation step was conducted at 37°C in a CO2 incubator. At 2 h, cells were washed with medium containing gentamicin (5 μg/ml). OT-1 (CD45.1+45.2−) cells were labeled with CFSE (40) and added to the cultures (1 × 10⁶/well). After 4 days of culture, cells were harvested from the wells, stained with anti-CD8 and anti-CD45.1 Abs, and the expression of CFSE on OT-1 cells was evaluated by flow cytometry.
For evaluation of Ag presentation in vivo, CFSE-labeled OT-1 cells were injected (5 × 10⁶) into B6.129 F1 mice i.v.. Within 3–4 days, mice were infected with various bacteria through the i.v. route. Five days after infection, spleens were removed from the recipient mice. The presence of donor OT-1 CD8+ T cells (CD45.1+) and the reduction in CFSE intensity of donor cells was evaluated.
Flow cytometry
Aliquots (5 × 10⁶) of spleen cells were incubated in 200 μl of PBS plus 1% BSA (PBS-BSA) with anti-CD16/32 at 4°C. Cells were then incubated on ice for 30 min with anti-CD8 and anti-CD45.1 Abs. Cells were washed and then incubated at room temperature with PE-H-2KbOVA257–264 tetramer. After 30 min, cells were washed with PBS and fixed in 0.5% formaldehyde and acquired on BD FACSCanto flow cytometer.
Imaging of LM- and ST-infected cells
Frozen stock of LM was thawed and spun down to remove the medium. The centrifuged bacteria were suspended in 200 μl of PBS containing 0.1 mg of tetramethylrhodamine-5-isothiocyanate (Invitrogen-Molecular Probes) and incubated at 37°C for 30 min. After incubation, the excess dye was removed by repeated washings with PBS and finally suspended in RPMI 1640 containing 8% FBS for macrophage infection.
Calculated numbers of IC-21 or JAWS cells were allowed to adhere on 22 × 22-cm glass coverslips (Fischer) placed in a 6-well cell culture dish for 1 h. Cells were then infected with ST-GFP, LM-tetramethylrhodamine isothiocyanate (TRITC), or ST-GFP and LM-TRITC combined at a multiplicity of infection (MOI) of 10. The plates were centrifuged at 1600 rpm for 10 min followed by incubation at 37°C for 30 min. After the pulse, the extracellular bacteria were removed by washing with RPMI 1640 containing 50 μg/ml gentamicin. The intracellular bacteria were further chased for 2 h in RPMI 1640 containing 8% FBS and 50 μg/ml gentamicin. Following the chase, cells were fixed with 4% paraformaldehyde for 20 min at room temperature. The cover slips were then mounted on glass slides using ProLong Gold antifade reagent (Invitrogen-Molecular Probes) and observed under a fluorescence microscope (Olympus IX81).
Measurement of cell viability
IC21 cells were seeded at a 2 × 10⁴ cells/well in a 96-well, flat-bottom culture plate. Cells were infected at various MOI with ST-OVA, LM-OVA, or a combination of both for 1 h at 37°C. Infection medium was removed and cells were washed and subsequently incubated in RPMI 1640 plus 8% FBS and 50 μg/ml gentamicin for 1 h, after which the cells were incubated in the same medium containing 5 μg/ml gentamicin for 24 h at 37°C. Subsequently, a neutral red dye cytotoxicity kit (Xenometrix) was used to assess cell viability following the manufacturer’s instructions. Briefly, culture medium was removed and the labeling solution containing the Neutral Red dye was added and incubated at 37°C for 3 h. Cells were inspected under a microscope to ensure minimal crystal formation and uptake of the dye by the cells (cells appear red in color). Subsequently, the labeling solution was aspirated and the cells were washed with fixative solution (0.1% CaCl2 in 0.5% formaldehyde) for 1 min. Finally, the fixative solution was removed and the dye was solubilized using a solubilization solution (1% acetic acid in 50% ethanol). The colorimetric reading was measured in a plate reader at 540 nm with a reference wavelength of 690 nm.
Results
ST infection of mice does not result in early CD8+ T cell activation
B6.129 F1 mice were infected with 103 ST or LM. On day 6 of infection, ~10% of CD8+ T cells (irrespective of antigenic specificity) in LM-infected mice expressed an activated phenotype (CD44highCD62Llow) (Fig. 1A). In contrast, ST-infected mice did not show any appreciable level of activation in CD8+ T cells. Similar results were obtained when the activation status of CD4+ T cells was evaluated (our unpublished observations). To evaluate the response in an Ag-specific manner, mice were infected with 103 ST-OVA (i.v.). For comparison, we infected a separate group of mice with LM-OVA (103; i.v.). At various time intervals, bacterial burden (Fig. 1B) and the frequency of OVA-specific IFN-γ-secreting CD8+ T cell responses (Fig. 1C) were evaluated. LM-OVA infection resulted in a potent increase in bacterial numbers that peaked by day 2, and the burden was undetectable by day 7. In contrast, ST-OVA infection resulted in a reduced burden initially that increased substantially afterward, peaking around day 15 and tapering off gradually afterward (Fig. 1C). LM-OVA infection resulted in a rapid development of OVA-specific CD8+ T cell response (measured by ELISPOT) that peaked around day 7 and underwent substantial contraction thereafter, resulting in the development of a stable memory response by day 30 (Fig. 1C). In contrast, the OVA-specific CD8+ T cell response was undetectable during the first 2 wk of ST-OVA infection. At day 30 after infection, significant OVA-specific CD8+ T cell response had developed in ST-OVA-infected mice with little evidence of contraction subsequently.
FIGURE 1.

Lack of early T cell activation during infection of mice with ST. B6.129 F1 mice were infected i.v. with 103 LM or ST. A, One and 6 days after infection, spleens were removed from infected mice and stained with anti-CD8, anti-CD44, and anti-CD62L Abs. The relative numbers of activated CD8+ T cells (CD44highCD62Llow) were enumerated. B and C, B6.129 F1 mice were infected i.v. with 103 ST-OVA or LM-OVA. At various time intervals spleens were harvested and the bacterial burden determined (B). Spleens were harvested, processed, and the frequency of OVA-specific CD8+ T cells was enumerated by ELISPOT assay (C). CD8+ T cells were purified using the Dynal magnetic bead system. Purified CD8+ T cells (90–98% pure) were incubated for 48 h with IL-2 (0.1 ng/ml) in the presence or absence of OVA peptide (5 μg/ml), using IP plates (Millipore) precoated with anti-IFN-γ Ab (R46A2; 13 μg/ml in NaHCO3 buffer). Plates were washed with 0.01% PBS with Tween 20 and incubated with biotinylated anti-IFN-γ Ab (XMG1.2). Subsequently the plates were washed, incubated with SA-HRP, and finally developed using 3-amino-9-ethylcarbazole substrate. Dots corresponding to IFN-γ-producing cells were enumerated under a microscope.
Early priming of CD8+ T cells is undetectable in ST-OVA-infected mice
We tested the possibility that the enormous delay in CD8+ T cell response in ST-OVA-infected mice despite the high bacterial burden was related to a possible lack of Ag presentation. To test this, we used the in vivo Ag presentation model in which mice are injected with 103 bacteria and CFSE-labeled OT-1 CD8+ T cells (i.v.). If Ag is presented, then this would result in activation of OT-1 CD8+ T cells and the subsequent dilution of CFSE expression. At day 5 after infection, transferred OT-1 CD8+ T cells had undergone extensive proliferation in LM-OVA-infected mice (Fig. 2, A–C), whereas ST-OVA infection failed to stimulate the OT-1 CD8+ T cells. All of the infected mice had significant bacterial burden at day 5 after infection (Fig. 2D).
FIGURE 2.

Infection of mice with ST-OVA does not result in measurable early Ag presentation in vivo. CFSE-labeled OT-1-SJL splenocytes (CD45.1+) were adoptively transferred into B6.129 F1 (CD45.2+) mice. Twenty-four hours later these recipient mice were infected i.v. with bacteria (103 CFU). Five days after infection, spleens were harvested and processed and spleen cell suspensions were stained with PerCP-conjugated anti-CD8α, and allophycocyanin-conjugated anti-CD45.1 Abs. A and B, Proliferation of CD8+ donor T cells was evaluated by measuring CFSE dilution by flow cytometry. C, The numbers of donor CD8+ T cells (CD45.1+) in the entire spleen were also enumerated. D, The bacterial burden in the infected spleens is also shown and was determined as described previously.
We also evaluated the relative expansion in donor OT-1 cells within 7-day intervals during the various stages of ST-OVA infection. OT-1 cells transferred on day 1, 7, or 14 of infection did not undergo appreciable expansion (Fig. 3). When OT-1 cells were transferred on days 21, 30, or 60 there was an appreciable increase in the numbers of OT-1 cells indicative of significant Ag presentation during these time periods. On day 120 of ST-OVA infection the transferred OT-1 cells did not increase in number appreciably. In the case of LM-OVA infection, OT-1 cells increased in number massively when transferred on the first day of infection, but failed to do so when transferred on day 7 or beyond.
FIGURE 3.
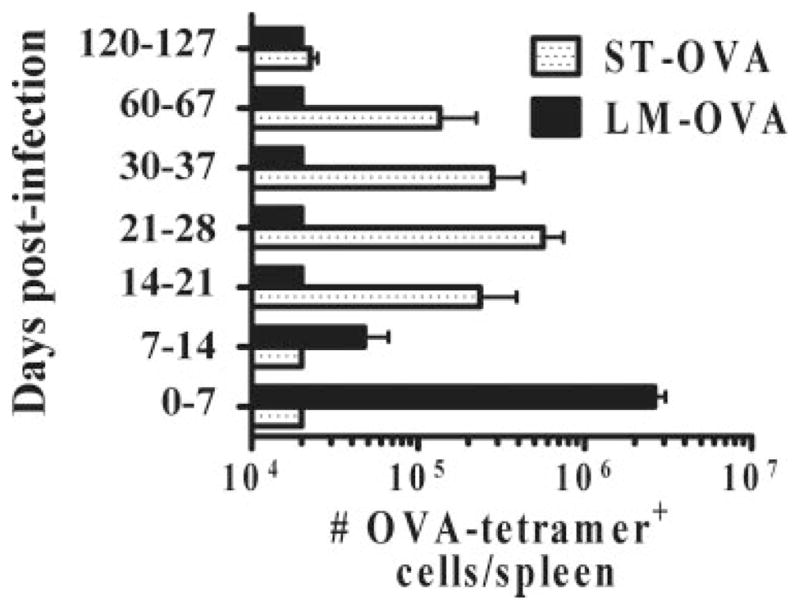
Delayed Ag presentation during ST-OVA infection. B6.129 F1 mice were infected with ST-OVA or LM-OVA (103; i.v.). At various time intervals, separate groups of mice received OT-1 CD8+ T cells (104/ mouse, i.v.) on days 0, 7, 14, 21, 30, 60, and 120, respectively. Seven days after the OT-1 transfer, spleens were removed from recipient mice and the relative numbers of transferred OT-1 cells were enumerated per spleen.
Macrophages and dendritic cells infected with ST-OVA fail to stimulate CD8+ T cells
To further address the mechanism behind the lack of rapid CD8+ T cell priming in ST-OVA infected mice, we set up an in vitro model of Ag presentation. First, we determined the sensitivity of this assay and noted that a minimum of 10 pmol of OVA-peptide concentration was needed for CFSE-labeled OT-1 cells to undergo division (Fig. 4A). When dendritic cells or macrophages were infected with LM-OVA, they induced massive cycling of CFSE-labeled OT-1 cells indicative of potent Ag presentation (Fig. 4, B and C). However, infection with ST-OVA failed to induce cycling of OT-1 cells, reiterating the notion that Ag presentation does not occur readily during infection with ST-OVA.
FIGURE 4.

Macrophages and dendritic cells infected with ST-OVA fail to promote Ag presentation. A, CFSE-labeled OT-1 cells were cultured with various concentrations of OVA-peptide. After four days, the proliferation of CD8+ T cells was evaluated by measuring CFSE dilution by flow cytometry. B and C, Dendritic cells (JAWS, H-2b) (B) and macrophages (IC-21, H-2b) (C) were seeded in 24-well-plates in RPMI 1640 plus 8% FBS. Bacteria were added at various MOI values and the plates were centrifuged to promote bacterial adsorption and incubated at 37°C for 15 min. Cells were subsequently washed vigorously and incubated with medium containing gentamicin (50 μg/ml) for 2 h. Subsequently, cells were washed and cultured in medium containing gentamicin (5 μg/ml) with CFSE-labeled OT-1 splenocytes. After 4 days, cells were harvested and stained with anti-CD8α and anti-CD45.1 Abs. The degree of CD8+ T cell proliferation induced by infected dendritic cells (B) and macrophages (C) was evaluated by measuring CFSE dilution using flow cytometry.
Virulence factors of ST are not the reason for the lack of Ag presentation
Because it was possible that some of the virulence factors of ST may be responsible for causing inhibition of Ag presentation, we tested Ag presentation in the in vitro model using the various mutants of ST, including phoP (global regulator of virulence), invA (Spi-1 mutant), ssaR (Spi-2 mutant), and aroA (defective for in vivo replication). Mutants with defective intracellular survival and invasion were tested. We have previously reported that all the mutants express similar levels of OVA compared with WT (37). Macrophages infected with LM-OVA, ST-OVA, and the various mutants of ST displayed similar burdens at 1 h after infection, indicating similar infection (Fig. 5A). None of the mutants of ST rescued Ag presentation (Fig. 5B), suggesting that the tested virulence factors do not inhibit Ag presentation.
FIGURE 5.
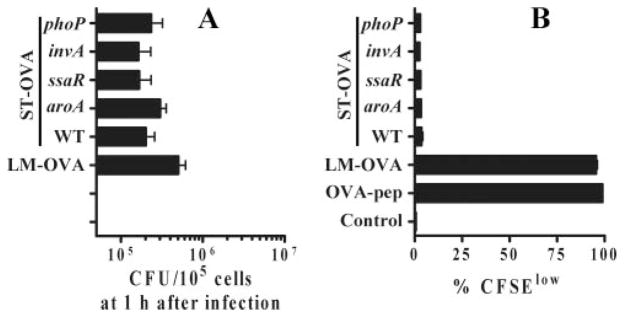
Lack of Ag presentation by ST-infected APCs is not due to virulence factors. IC-21 macrophages were seeded in 24-well-plates in RPMI 1640 plus 8% FBS. Bacteria were added at an MOI of 10 and plates were centrifuged to promote bacterial adsorption and incubated at 37°C for 15–30 min. Cells were subsequently washed vigorously and incubated with medium containing gentamicin (50 μg/ml). A, At 1 h, bacterial burden (CFU) was determined to enumerate the degree of infection. Differences in bacterial uptake were not significant (p = 0.077) as determined by one-way ANOVA. B, Subsequently, cells were washed and cultured in medium containing lower levels of gentamicin (5 μg/ml) with CFSE-labeled OT-1 splenocytes. After 4 days, cells were harvested and stained with anti-CD8α and anti-CD45.1 Abs. The degree of CD8+ T cell proliferation was evaluated by measuring CFSE dilution using flow cytometry. OVA-pep, OVA-peptide.
It was possible that the in vitro model may have missed the potential Ag presentation ability of some of the mutants of ST. We thus evaluated Ag presentation in the in vivo model. When all of the mice received a uniform dose (103; i.v.) of bacteria, only LM-OVA induced the proliferation of transferred CFSE-labeled OT-1 cells (Fig. 6, A and B). As expected, infection of mice with the various mutants of ST resulted in a variable bacterial burden at day 5 postinfection (Fig. 6C). In another set of experiments, we increased the dose of the various mutants of ST to the maximum without causing fatality. Even after infection with high doses of mutants, transferred CFSE-labeled OT-1 cells failed to proliferate (Fig. 6, D and E). Infection with higher doses of mutants resulted in increased bacterial burden relative to WT (Fig. 6F).
FIGURE 6.

Virulence effectors of ST are not the reason for lack of Ag presentation by ST-infected APCs in vivo. CFSE-labeled OT-1-SJL splenocytes (CD45.1+) were adoptively transferred into B6.129 F1 (CD45.2+) mice. Twenty-four hours later these recipient mice were infected i.v. with 103 (A–C) or different doses (D–F) of bacteria. Five days after infection, spleens were harvested and processed and spleen cell suspensions were stained with PerCP-conjugated anti-CD8α and allophycocyanin-conjugated anti-CD45.1 Abs. Proliferation of CD8+ donor T cells was evaluated by measuring CFSE dilution by flow cytometry (A and D). The numbers of donor CD8+ T cells (CD45.1+) in the entire spleen was also evaluated (B and E). The bacterial burden in the infected spleens (C and F) was determined as described previously.
Dichotomy in the intracellular vs extracellular proliferation of ST
It is well established that ST grows rapidly in culture, faster than LM (41). Based on culture studies, we calculated the relative doubling time for LM-OVA to be 50 min in comparison to 30 min for ST (Fig. 7A). This ~2-fold difference in doubling becomes large over time. ST grows to numbers that are 10-fold more than those of LM within 4 h. However, for Ag presentation it is more relevant to determine the relative intracellular doubling of the pathogen. We first determined the relative infection of dendritic cells with LM and ST. JAWS cells were infected with ST-GFP and TRITC-labeled LM. LM-infected cells had ~2- to 4-fold more bacteria 1 h after infection (Fig. 7B). Similarly, when bacterial uptake was determined by measuring CFU at 1 h after infection, LM uptake was 2- to 4-fold more (Fig. 7C). Having seen only a modest difference in the relative uptake of LM vs ST by APCs, we measured the relative intracellular doubling of LM-OVA and ST-OVA in macrophages and dendritic cells. Extracellular growth of the pathogens was controlled by maintaining the cells in medium containing low levels of the antibiotic gentamicin (42). Intracellular proliferation of LM was significantly greater than that of ST (Fig. 7D). Within macrophages, the calculated intracellular doubling time was 1.85 h for LM-OVA and 7 h, for ST-OVA respectively. Taken together, these results indicate that the relative uptake of ST is slightly lower than that of LM; however, once inside macrophages and dendritic cells, ST does not appear to proliferate as strongly as LM.
FIGURE 7.

Dichotomous extracellular vs intracellular proliferation of ST. IC21 macrophages (104/well) were infected with LM-OVA and ST-OVA (10 MOI). A, After 15 min, the majority of extracellular bacteria was removed by centrifugation and washing. At various time intervals aliquots were taken from the supernatants to determine the extracellular CFU, which was enumerated as described in Materials and Methods. B, To determine the relative infection of APCs, JAWS cells were seeded into 24-well flat-bottom plates and infected with TRITC-labeled LM and ST-GFP (10 MOI) followed by gentamicin treatment. After 1 h, cells were analyzed by fluorescence microscopy. C, Bacterial burden was also enumerated at 1 h postinfection to determine the relative infection of JAWS and IC-21 cells. Differences in bacterial uptake were not significant (p = 0.076) as determined by t test. D, To determine intracellular CFU, JAWS and IC-21 macrophages were seeded into 24-well flat-bottom plates and infected with bacteria (10 MOI), followed by gentamicin treatment and subsequent maintenance in gentamicin-containing medium as described in Materials and Methods. At various time intervals cells were lysed and intracellular CFU were measured.
Generation of reduced intracellular Ag levels upon infection with ST-OVA
When LM-OVA and ST-OVA were grown extracellularly, the numbers of OVA mRNA molecules and the total bacterial (16S) RNA molecules generated were similar (Fig. 8A). We have previously reported that LM-OVA and ST-OVA also express similar levels of OVA protein (34). We wished to determine the relative level of OVA generated by the two bacteria when they are growing intracellularly within macrophages. LM-OVA-infected macrophages contained high levels of 16S RNA and OVA mRNA (Fig. 8B). In contrast, macrophages infected with ST-OVA contained low levels of total (16S) and OVA mRNA. The initial infection of macrophages with LM-OVA and ST-OVA was relatively similar 1 h after infection (Fig. 8C), however, LM-OVA proliferated enormously during the subsequent 24 h in contrast to ST-OVA (Fig. 8D), which explains the reduced level of OVA mRNA in ST-OVA-infected macrophages.
FIGURE 8.

Reduced intracellular Ag expression by ST corroborates the poor intracellular proliferation of ST. Expression of OVA mRNA and total bacterial RNA (16S) was measured for ST-OVA and LM-OVA growing extracellularly (A) and intracellularly within IC-21 macrophages (B). In the case of extracellularly growing bacteria the cultures were stopped when the OD at 600 nm reached 0.48–0.50. An aliquot was collected and 2 vol of the RNAprotect bacterial reagent (Qiagen) were added. After 10 min of incubation at room temperature, bacteria were pelleted by centrifugation and stored at −80°C. RNA was extracted from these samples as described in Materials and Methods. Expression levels of OVA RNA and 16S rRNA in response to LM-OVA and ST-OVA infection were measured by quantitative RT-PCR. Mole values were converted into the number of RNA molecules based on Avogadro’s number (A). To measure Ag expression intracellularly, IC-21 cells were seeded into 24-well plates and infected at an MOI of 1 with either ST-OVA or LM-OVA. Thirty minutes later, cells were washed and cultured in medium containing high Gentamicin concentration (50 μg/ml). At 1 h postinfection, bacterial uptake was measured to determine the relative infection of IC-21 cells (C). Differences in bacterial uptake at 1 h were not significant (p = 0.33) as determined by t test. Cells were subsequently washed vigorously and maintained in low gentamicin (5 μg/ml) medium for 24 h at 37°C. RNA was extracted from cells as described in Materials and Methods. Expression levels of OVA RNA and 16S rRNA in response to LM-OVA and ST-OVA infection are expressed as fold change to noninfected samples (B). The intracellular CFUs from these samples were also plotted (D), correlating well with 16S rRNA expression.
ST-OVA infection does not result in detectable MHC-peptide complex levels
One of the key events in Ag presentation is the generation of sufficient MHC-peptide levels on the surface of dendritic cells. We therefore determined the relative levels of H-2Kb-OVA257–264 complex levels on ST-OVA and LM-OVA dendritic cells. For this, we used an Ab that specifically binds to this complex (43). First, we determined the sensitivity of this assay and noted that a minimum of 10 nmol of OVA-peptide levels were needed for detection by this Ab (Fig. 9A). Infection of DCs with LM-OVA, ST-OVA, and the various mutants of ST-OVA was not appreciably different at 1 h after infection (Fig. 9B). Infection of dendritic cells with LM-OVA, but not LM, resulted in significant augmentation of MHC-peptide levels (Fig. 9C). WT ST-OVA and the various mutants failed to induce any detectable MHC-peptide levels on the surface of dendritic cells. Taken together, these results indicate that although ST induces a productive infection in DCs similar to that induced by LM, the inefficient proliferation of ST intracellularly results in the generation of reduced Ag levels that culminates in poor generation of MHC-I-peptide complexes on the surface of dendritic cells.
FIGURE 9.

ST-OVA infection of dendritic cells results in inadequate levels of MHC-peptide complexes. JAWS II dendritic cells were seeded in 24-well-plates at 1 × 10⁶cells/well. Various amounts of SIINFEKL (OVA257–264) peptide ranging from 0.002–200 nmol were used to establish a standardization plot. Cells were pulsed with peptide for 1 h after which cells were collected and stained (A). To measure the initial uptake of the bacteria, dendritic cells were pulsed with 10 MOI of bacteria as described previously, and the intracellular bacteria were enumerated at 1 h postinfection (B). Differences in bacterial uptake (B) were not significant (p = 0.109) as determined by one-way ANOVA. To measure the levels of MHC-peptide complexes during infection (C), dendritic cells were infected at an MOI of 10 as described previously and incubated thereafter for 24 h at 37°C in low Gentamicin medium. Subsequently, cells were harvested and stained with an Ab specific for H-2Kb-OVA257–264 complex (25D1.16, solid line) or an IgG1 isotype control (dotted line). Cells were washed with PBS, reconstituted in 1% PBS-BSA, and stained with a goat-anti-mouse PE-conjugated Ab. Finally, cells were washed with PBS and resuspended in 0.5% fixative.
Reduced Ag levels in the spleens of ST-OVA-infected mice
We determined the levels of OVA mRNA and the total bacterial (16S) RNA in the spleens of mice infected with LM-OVA and ST-OVA. In ST-OVA-infected mice, 16S RNA was detectable at all the time intervals; however, the relative level of OVA mRNA fell below the limit of detection (Fig. 10A). In LM-OVA infected mice, low levels of OVA mRNA could be detected at the peak of infection (day 3). For both 16S as well as OVA mRNA, the levels generated were higher in the spleens of LM-OVA-infected mice. In the long term, ST-OVA infected mice had high bacterial burden in the spleens (Fig. 10C), yet the levels of 16S RNA and OVA were low. The experiments described above were done in mice that were infected with a 103 dose of the bacteria (i.v.). This dose could not be increased due to experimental limitations, as higher doses of ST cause lethality.
FIGURE 10.

Ag expression during ST-OVA infection in vivo is undetectable. B6129 F1 mice were infected with 103 CFU of ST-OVA or LM-OVA i.v. Spleens were isolated under aseptic conditions and immediately frozen in a dry ice. RNA was extracted from these samples as described in Materials and Methods. Expression levels of OVA mRNA and 16S rRNA in response to ST-OVA (A) and LM-OVA (B) infection was determined and expressed as fold change to noninfected samples. Splenic bacterial burden was also plotted (C) and correlated well with 16S rRNA expression (n = 3).
ST-OVA infection does not result in active inhibition of Ag presentation
We wished to evaluate the alternative possibility that ST infection induces inhibition of Ag presentation, although our results with mutants of ST indicated otherwise. Macrophages pulsed with LM-OVA induced Ag presentation to CFSE-labeled OT-1 cells (Fig. 11). Infection of macrophages with ST-OVA did not stimulate OT-1 cells. Furthermore, coinfection of macrophages with LM-OVA and ST-OVA (10 MOI of each) did not result in inhibition of LM-OVA-Ag presentation, indicating that ST-OVA-pulsed macrophages do not inhibit general Ag presentation.
FIGURE 11.
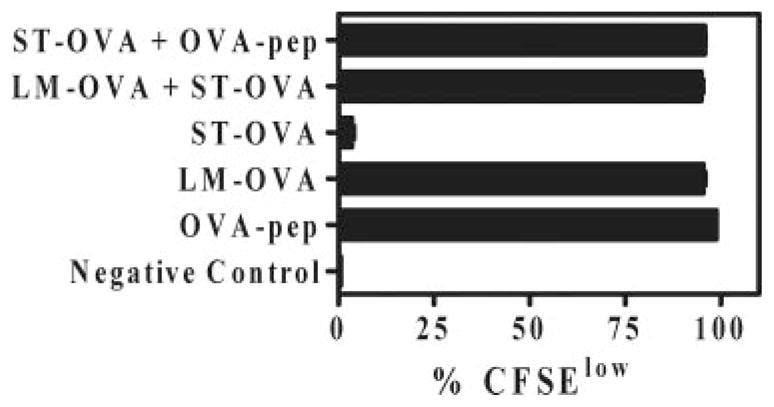
Coinfection of macrophages with LM-OVA and ST-OVA does not result in the inhibition of Ag presentation against LM-OVA. IC-21 macrophages were seeded in 24-well-plates. Bacteria were added separately or together at an MOI of 10 and plates centrifuged to promote bacterial adsorption and incubated at 37°C for 30–60 min. Cells were subsequently washed vigorously and incubated with medium containing gentamicin (50 μg/ml) for 1–2 h to eliminate extracellular bacteria. Subsequently, cells were cocultured with CFSE-labeled OT-1 cells for 4 days in medium containing low levels of gentamicin (5 μg/ml). Cells were finally harvested and stained with anti-CD8α Ab. The degree of CD8+ T cell proliferation was evaluated by measuring CFSE dilution using flow cytometry. OVA-pep, OVA-peptide.
To further evaluate the possible inhibition of Ag presentation, we pulsed macrophages with LM-OVA and coinfected them with increasing doses of ST. Bacterial burden in the macrophages was evaluated at 1and 24 h after infection. When macrophages were infected with a very high dose of ST, reduced LM-OVA burden could be detected even at 1 h after infection, implying that a high dose of ST impairs the uptake of LM-OVA (Fig. 12A). At 24 h postinfection there was an increase in the burden of LM-OVA in macrophages; however, the absolute count of LM-OVA was less when cells were coinfected with 100 MOI of ST. ST and LM-OVA colonies could be differentially counted based on the difference in colony size, with LM-OVA colonies being relatively smaller in size (Fig. 12B). Interestingly, infection with high doses of LM-OVA did not influence the uptake of ST (Fig. 12C). As before, ST failed to display significant proliferation within macrophages from 1 h until 24 h. We also enumerated the infection of macrophages at 1 h by immunofluorescence. Macrophages displayed a 2- to 3-fold higher LM (TRITC labeled) uptake in comparison to ST (GFP), and coinfection of ST and LM resulted in a reduction of LM uptake without influencing ST uptake (Fig. 12D). Coinfection of LM-OVA-infected macrophages with a high dose of ST resulted in a reduction of the proliferation of CFSE-labeled OT-1 cells (Fig. 12E). However, considering that coinfection with a high dose of ST resulted in significantly less LM-OVA uptake, this result indicates that the apparent suppression of Ag presentation may be due to bacterial competition rather than active inhibition of Ag presentation. Coinfection of macrophages with LM-OVA and a high dose of ST-OVA (100 MOI) did not influence the survival of macrophages significantly as enumerated by the uptake of a vital dye, neutral red, which accumulates in the lysosomes of viable cells (Fig. 12F).
FIGURE 12.

Coinfection of macrophages with LM-OVA and a high dose of ST results in bacterial competition that brings about suppression of Ag presentation. IC-21 macrophages were seeded in 24-well plates. Bacteria were added individually or together at various MOI values and plates were centrifuged to promote bacterial adsorption and incubated at 37°C for 30 min. Cells were subsequently washed vigorously and incubated in medium containing gentamicin (50 μg/ml) for 1–2 h. Subsequently, cells were cocultured with CFSE-labeled OT-1 splenocytes for 4 days in medium containing lower levels (5 μg/ml) of gentamicin. Cells were finally harvested and stained with anti-CD8α Ab. Intracellular bacterial burden for LM-OVA (A) and ST (C) in different coinfection scenarios was also determined at 1 h and 24 h postinfection. LM-OVA (small colonies) and ST (big colonies) were clearly distinguishable based on size and morphology (B). Macrophages were also pulsed with TRITC-labeled LM and ST-GFP and the relative infection of macrophages with LM and ST was enumerated at 1 h postinfection by fluorescence microscopy (D). The degree of CD8+ T cell proliferation by infected macrophages was evaluated by measuring CFSE dilution using flow cytometry (E). Survival of macrophages was enumerated by measuring the uptake of vital dye, neutral red (F).
Discussion
Memory CD8+ T cells play key roles against viral infections as well as against intracellular bacteria such as LM (16–18), M. tuberculosis (19), and ST (20, 21). The general paradigm of CD8+ T cell differentiation (8, 13) implies that Ag presentation occurs within, but not after, the first few days of infection (2, 3, 44), resulting in the generation of a potent CD8+ T cell response that peaks at ~7 days postinfection. We have previously reported that this model of CD8+ T cell differentiation is not followed during the infection of mice with virulent ST (34), where CD8+ T cell response is greatly delayed. Because susceptible (C57BL/6J) mice die before T cells are activated (day 7), addressing the mechanisms of why T cells are not engaged early on in infection is important. The lack of an early CD8+ T cell response against ST could be due to inhibition of Ag presentation, generation of inappropriate inflammation, or generation of poor antigenic levels in vivo. Our results indicate that contrary to the expected result, ST displays reduced intracellular proliferation within APCs that results in poor generation of antigenic peptide-MHC levels, precluding early Ag presentation.
Several lines of evidence point to the notion that early Ag presentation is lacking during ST infection. Firstly, irrespective of the antigenic specificity of T cells (Fig. 1A), they fail to down-regulate CD62L expression. Secondly, CD8+ T cell response does not develop by day 7 (34, 37), a time period when CD8+ T cell response peaks in most infection models (8). Thirdly, adoptively transferred OT-1 cells do not down-regulate CFSE expression during the first 5 days of ST-OVA infection. Finally, dendritic cells infected in vitro with a 100-fold more ST-OVA fail to stimulate OT-1 cells. An important question that arises is how Ag presentation is eventually induced against ST. Many potential routes of cross-presentation have been suggested (45, 46). Dendritic cells may pick up Ag from dying APCs and present it to CD8+ T cells (47). ST induces rapid death of macrophages and dendritic cells (48, 49), and it has been shown that cross-presentation of ST Ags occurs through dendritic cells (50). It has also been shown that the genes of the SPI-I induce rapid apoptosis of infected macrophages (48, 51). Furthermore, in the absence of caspase-1 activity or under SPI-2-inducing conditions, macrophage death is greatly delayed (52). Although it is conceivable that the classical Ag-processing pathway operates with a greater efficiency, a direct comparison of the relative speed and efficiency of “cross-priming” vs classical Ag-processing pathway is not clear (53).
It has been previously shown that ST interferes with the acidification of phagosomes, causing an arrest of phagosome-lysosome fusion (54). Furthermore, there are several reports indicating that ST inhibits Ag presentation and that this may be due to the expression of SPI-II-dependent virulence mechanisms (55–58). Most of these studies were done in different in vitro models and involve the measurement of Ag presentation to CD4+ T cells using ST strains that are not as virulent. In another study it was shown that Ag presentation by ST-infected APCs does not depend on virulence factors of ST (36). Our results, in vitro and in vivo, indicate that a significant problem lies with the poor intracellular proliferation of ST within APCs. Several lines of evidence lead us toward this interpretation. Firstly, if suppression were to occur, then it should manifest strongly after the second week of infection, a time period when ST burden is at its peak. However, CD8+ T cell response is induced after the second week of infection, precluding the existence of suppressive mechanisms beyond day 15. Secondly, none of the mutants (aroA; SPI-I/II) of ST induced rapid Ag presentation, indicating that the known virulence mechanisms of ST do not inhibit Ag presentation. Thirdly, when mice were coinfected with LM and ST, the rapid CD8+ T cell response against LM was not impaired (our unpublished observations). Fourthly, we have previously reported that normal memory CD8+ T cells respond better when stimulated with Ag-pulsed spleen cells from ST-infected mice in comparison to normal spleen cells, indicating that the splenic environment in ST-infected mice is stimulatory, not suppressive (37). Finally, in another study SM1 CD4+ T cell transgenic cells failed to respond to low-dose infection with ST but responded efficiently when flagellin-peptide was administered in the same environment (59).
With an intracellular doubling time of 7 h for ST, T cell response should still develop much earlier. It is not clear what the threshold levels are for activating T cells in vivo. ST resides in the phagosomes of infected cells, so the Ags may be presented via the alternate pathway, which may induce further delay. We have consistently noted a slightly reduced uptake of ST by dendritic cells that, coupled with the poor intracellular replication of ST within APCs, may cause an even greater delay in T cell priming. Incubation of DCs with a 100-fold more ST-OVA in comparison with LM-OVA did not induce Ag presentation, indicating that the relative difference in infection of APCs by itself may not explain the lack of Ag presentation. In comparison with LM, ST induces enormous and persistent inflammatory responses characterized by expression of numerous chemokines and inflammatory cytokines (our unpublished observations). It is possible that some of these events influence the maturation and Ag-presenting ability of DCs (58).
Intracellular proliferation is a prerequisite for proper Ag presentation and T cell activation in case of live intracellular pathogens or vaccines (60, 61). Logically, bacterial proliferation directly affects Ag abundance and, therefore, Ag presentation. CD8+ T cell response against ST peaks only after the bacterial burden peaks (second week of infection) (34), supporting the notion that minimal antigenic threshold levels must be achieved before T cell priming proceeds (62). Indeed, when transferred into ST-OVA infected mice on day 21 of infection, OT-1 cells undergo rapid expansion within a 7-day period (Fig. 2), suggesting that at day 21 APCs have acquired the ability to present ST Ags to T cells rapidly. By referring to the loading calibration plot (Fig. 4), it can be inferred that when cells are infected with 1 MOI of LM-OVA, the levels of OVA-peptide generated are more than the EC50 of 0.005 nmol. By contrast, even at 100 MOI of ST-OVA the levels of OVA-peptide generated are lower than the EC50 and, therefore, not enough to prime CD8+ T cells. The fact that ST-OVA infection of dendritic cells does not result in detectable surface MHC-peptide complex expression supports this notion. The sensitivity of our MHC-peptide titration curve remarkably overlaps with the one generated by Germain’s group (43).
There have been an increasing number of reports emphasizing the slow proliferation rate of ST in the intracellular compartment (63–67). Because ST is not an obligate intracellular pathogen, it appears that at any given time point ~50% of ST in the spleen are not cell associated (our unpublished observations). A revised view thus emerges regarding proliferation of ST in vivo, namely that despite the extensively perceived proliferation of ST, intracellular numbers within macrophages remain low, suggesting that the growth of ST occurs in fits and starts, with extracellular bacteria amplifying net numbers and intracellular bacteria contributing to chronicity and persistence. ST proliferates within epithelial cells (22), and this could also contribute toward an increase in the overall bacterial numbers. The reduced intracellular replication rates in APCs may be a deliberate pathogenic strategy of Salmonella to avoid immune responses, relying on extracellular replication to increase bacterial load.
Susceptible mice, including C57BL/6J, succumb to ST infection within 7 days. In contrast, resistant 129 × 1SvJ mice harbor a chronic infection lasting >60 days. Because ST resides in the phagosomes of infected cells, this has been attributed to the function of the NRAMP1 gene (68), which codes for an ion transporter that helps deplete phagosomes of critical ions, such as manganese and iron. Furthermore, the phagosomes of infected cells pose a hostile environment characterized by poor nutrient content, low pH, antibacterial peptides, and lysosomal enzymes (28). Although ST appears to have evolved strategies to adapt to these conditions (69, 70), it is conceivable that ST merely persists, rather than proliferates, in such an environment.
All of the mutants that we used in this study expressed similar levels of OVA as determined by Western blotting and quantitative RT-PCR analysis (37), which indicates that the lack of Ag presentation by APCs infected with mutants could not be due to the disproportionate expression of OVA by mutants. We have previously reported that the SPI-I and SPI-II mutants of ST induce poor CD8+ T cell response, leading to the conclusion that the magnitude of the CD8+ T cell response is governed by pathogen virulence (37).
Previously, we reported that even conventional memory CD8+ T cells, when transferred into naive hosts and challenged with ST-OVA, respond with delayed kinetics similar to those of naive CD8+ T cells (34). How can vaccine-induced memory CD8+ T cells facilitate protection against a pathogen whose Ags are not readily processed and presented? In such a scenario, irrespective of the number of memory T cells generated, they will not be able to expand into effectors rapidly. Considering that the susceptible mice die within 7 days of infection, a delay in T cell priming can be viewed as catastrophic. Relative to CD8+ T cells, CD4+ T cells have been shown to be intrinsically slow in responding to pathogens in general (71). Therefore, the immune system may have to rely on the innate immune compartment to curb ST burden for the first few weeks of infection. It may then be envisaged that down-regulation of innate immunity due to aging, pregnancy (72), or other reasons can have catastrophic outcomes. In this report we have highlighted that there is a dichotomy in the proliferation of ST. Rapid extracellular proliferation makes ST a highly virulent pathogen that needs to be controlled immediately for host survival. At the same time, the muted intracellular proliferation of ST within APCs compromises the development of acquired immune response and facilitates immune evasion.
Footnotes
This work was supported by a grant from the Canadian Institutes of Health Research and the National Research Council.
Abbreviations used in this paper: LM, Listeria monocytogenes; BHI, brain-heart infusion; MOI, multiplicity of infection; NRAMP, natural resistance-associated macrophage protein; SPI, Salmonella pathogenicity island; ST, Salmonella enterica serovar Typhimurium; TRITC, tetramethylrhodamine isothiocyanate; WT, wild type.
Disclosures
The authors have no financial conflict of interest.
References
- 1.Bevan MJ. Antigen presentation to cytotoxic T lymphocytes in vivo. J Exp Med. 1995;182:639–641. doi: 10.1084/jem.182.3.639. [DOI] [PMC free article] [PubMed] [Google Scholar]
- 2.van Stipdonk MJ, Lemmens EE, Schoenberger SP. Naive CTLs require a single brief period of antigenic stimulation for clonal expansion and differentiation. Nat Immunol. 2001;2:423–429. doi: 10.1038/87730. [DOI] [PubMed] [Google Scholar]
- 3.Kaech SM, Ahmed R. Memory CD8+ T cell differentiation: initial antigen encounter triggers a developmental program in naive cells. Nat Immunol. 2001;2:415–422. doi: 10.1038/87720. [DOI] [PMC free article] [PubMed] [Google Scholar]
- 4.Murali-Krishna K, Altman JD, Suresh M, Sourdive DJ, Zajac AJ, Miller JD, Slansky J, Ahmed R. Counting antigen-specific CD8 T cells: a reevaluation of bystander activation during viral infection. Immunity. 1998;8:177–187. doi: 10.1016/s1074-7613(00)80470-7. [DOI] [PubMed] [Google Scholar]
- 5.Ahmed R, Gray D. Immunological memory and protective immunity: understanding their relation. Science. 1996;272:54–60. doi: 10.1126/science.272.5258.54. [DOI] [PubMed] [Google Scholar]
- 6.Sprent J, Tough DF. T cell death and memory. Science. 2001;293:245–248. doi: 10.1126/science.1062416. [DOI] [PubMed] [Google Scholar]
- 7.Wong P, Pamer EG. CD8 T cell responses to infectious pathogens. Annu Rev Immunol. 2003;21:29–70. doi: 10.1146/annurev.immunol.21.120601.141114. [DOI] [PubMed] [Google Scholar]
- 8.Kaech SM, Wherry EJ, Ahmed R. Effector and memory T-cell differentiation: implications for vaccine development. Nat Rev Immunol. 2002;2:251–262. doi: 10.1038/nri778. [DOI] [PubMed] [Google Scholar]
- 9.Dutton RW, Bradley LM, Swain SL. T cell memory. Annu Rev Immunol. 1998;16:201–223. doi: 10.1146/annurev.immunol.16.1.201. [DOI] [PubMed] [Google Scholar]
- 10.Oehen S, Brduscha RK. Differentiation of naive CTL to effector and memory CTL: correlation of effector function with phenotype and cell division. J Immunol. 1998;161:5338–5346. [PubMed] [Google Scholar]
- 11.Usherwood EJ, Hogan RJ, Crowther G, Surman SL, Hogg TL, Altman JD, Woodland DL. Functionally heterogeneous CD8+ T-cell memory is induced by Sendai virus infection of mice. J Virol. 1999;73:7278–7286. doi: 10.1128/jvi.73.9.7278-7286.1999. [DOI] [PMC free article] [PubMed] [Google Scholar]
- 12.Sallusto F, Lenig D, Forster R, Lipp M, Lanzavecchia A. Two subsets of memory T lymphocytes with distinct homing potentials and effector functions [see comments] Nature. 1999;401:708–712. doi: 10.1038/44385. [DOI] [PubMed] [Google Scholar]
- 13.Wherry EJ, Teichgraber V, Becker TC, Masopust D, Kaech SM, Antia R, von Andrian UH, Ahmed R. Lineage relationship and protective immunity of memory CD8 T cell subsets. Nat Immunol. 2003;4:225–234. doi: 10.1038/ni889. [DOI] [PubMed] [Google Scholar]
- 14.Masopust D, Vezys V, Marzo AL, Lefrancois L. Preferential localization of effector memory cells in nonlymphoid tissue. Science. 2001;291:2413–2417. doi: 10.1126/science.1058867. [DOI] [PubMed] [Google Scholar]
- 15.Reinhardt RL, Khoruts A, Merica R, Zell T, Jenkins MK. Visualizing the generation of memory CD4 T cells in the whole body. Nature. 2001;410:101–105. doi: 10.1038/35065111. [DOI] [PubMed] [Google Scholar]
- 16.Harty JT, Bevan MJ. CD8+ T cells specific for a single nonamer epitope of Listeria monocytogenes are protective in vivo. J Exp Med. 1992;175:1531–1538. doi: 10.1084/jem.175.6.1531. [DOI] [PMC free article] [PubMed] [Google Scholar]
- 17.Roberts AD, Ordway DJ, Orme IM. Listeria monocytogenes infection in β2 microglobulin-deficient mice. Infect Immun. 1993;61:1113–1116. doi: 10.1128/iai.61.3.1113-1116.1993. [DOI] [PMC free article] [PubMed] [Google Scholar]
- 18.White DW, Harty JT. Perforin-deficient CD8+ T cells provide immunity to Listeria monocytogenes by a mechanism that is independent of CD95 and IFN-γ but requires TNF-α. J Immunol. 1998;160:898–905. [PubMed] [Google Scholar]
- 19.Flynn JL, Goldstein MM, Triebold KJ, Koller B, Bloom BR. Major histocompatibility complex class I-restricted T cells are required for resistance to Mycobacterium tuberculosis infection. Proc Natl Acad Sci USA. 1992;89:12013–12017. doi: 10.1073/pnas.89.24.12013. [DOI] [PMC free article] [PubMed] [Google Scholar]
- 20.Lo WF, Ong H, Metcalf ES, Soloski MJ. T cell responses to Gram-negative intracellular bacterial pathogens: a role for CD8+ T cells in immunity to Salmonella infection and the involvement of MHC class Ib molecules. J Immunol. 1999;162:5398–5406. [PubMed] [Google Scholar]
- 21.Mittrucker HW, Kaufmann SH. Immune response to infection with Salmonella typhimurium in mice. J Leukocyte Biol. 2000;67:457–463. doi: 10.1002/jlb.67.4.457. [DOI] [PubMed] [Google Scholar]
- 22.Leung KY, Finlay BB. Intracellular replication is essential for the virulence of Salmonella typhimurium. Proc Natl Acad Sci USA. 1991;88:11470–11474. doi: 10.1073/pnas.88.24.11470. [DOI] [PMC free article] [PubMed] [Google Scholar]
- 23.Bliska JB, Galan JE, Falkow S. Signal transduction in the mammalian cell during bacterial attachment and entry. Cell. 1993;73:903–920. doi: 10.1016/0092-8674(93)90270-z. [DOI] [PubMed] [Google Scholar]
- 24.Zhou D, Galan J. Salmonella entry into host cells: the work in concert of type III secreted effector proteins. Microbes Infect. 2001;3:1293–1298. doi: 10.1016/s1286-4579(01)01489-7. [DOI] [PubMed] [Google Scholar]
- 25.Galan JE, Curtiss R., III Cloning and molecular characterization of genes whose products allow Salmonella typhimurium to penetrate tissue culture cells. Proc Natl Acad Sci USA. 1989;86:6383–6387. doi: 10.1073/pnas.86.16.6383. [DOI] [PMC free article] [PubMed] [Google Scholar]
- 26.Hardt WD, Chen LM, Schuebel KE, Bustelo XR, Galan JE. S. typhimurium encodes an activator of Rho GTPases that induces membrane ruffling and nuclear responses in host cells. Cell. 1998;93:815–826. doi: 10.1016/s0092-8674(00)81442-7. [DOI] [PubMed] [Google Scholar]
- 27.Galan JE. Salmonella interactions with host cells: type III secretion at work. Annu Rev Cell Dev Biol. 2001;17:53–86. doi: 10.1146/annurev.cellbio.17.1.53. [DOI] [PubMed] [Google Scholar]
- 28.Jones BD, Falkow S. Salmonellosis: host immune responses and bacterial virulence determinants. Annu Rev Immunol. 1996;14:533–561. doi: 10.1146/annurev.immunol.14.1.533. [DOI] [PubMed] [Google Scholar]
- 29.Groisman EA, Chiao E, Lipps CJ, Heffron F. Salmonella typhimurium phoP virulence gene is a transcriptional regulator. Proc Natl Acad Sci USA. 1989;86:7077–7081. doi: 10.1073/pnas.86.18.7077. [DOI] [PMC free article] [PubMed] [Google Scholar]
- 30.Miller SI, Kukral AM, Mekalanos JJ. A two-component regulatory system (phoP phoQ) controls Salmonella typhimurium virulence. Proc Natl Acad Sci USA. 1989;86:5054–5058. doi: 10.1073/pnas.86.13.5054. [DOI] [PMC free article] [PubMed] [Google Scholar]
- 31.Garvis SG, Beuzon CR, Holden DW. A role for the PhoP/Q regulon in inhibition of fusion between lysosomes and Salmonella-containing vacuoles in macrophages. Cell Microbiol. 2001;3:731–744. doi: 10.1046/j.1462-5822.2001.00153.x. [DOI] [PubMed] [Google Scholar]
- 32.Hensel M, Shea JE, Gleeson C, Jones MD, Dalton E, Holden DW. Simultaneous identification of bacterial virulence genes by negative selection. Science. 1995;269:400–403. doi: 10.1126/science.7618105. [DOI] [PubMed] [Google Scholar]
- 33.Shea JE, Hensel M, Gleeson C, Holden DW. Identification of a virulence locus encoding a second type III secretion system in Salmonella typhimurium. Proc Natl Acad Sci USA. 1996;93:2593–2597. doi: 10.1073/pnas.93.6.2593. [DOI] [PMC free article] [PubMed] [Google Scholar]
- 34.Luu RA, Gurnani K, Dudani R, Kammara R, van Faassen H, Sirard JC, Krishnan L, Sad S. Delayed expansion and contraction of CD8+ T cell response during infection with virulent Salmonella typhimurium. J Immunol. 2006;177:1516–1525. doi: 10.4049/jimmunol.177.3.1516. [DOI] [PMC free article] [PubMed] [Google Scholar]
- 35.Takahashi N, Orita T, Hirose M. Production of chicken ovalbumin in Escherichia coli. Gene. 1995;161:211–216. doi: 10.1016/0378-1119(95)00234-w. [DOI] [PubMed] [Google Scholar]
- 36.Niedergang F, Sirard JC, Blanc CT, Kraehenbuhl JP. Entry and survival of Salmonella typhimurium in dendritic cells and presentation of recombinant antigens do not require macrophage-specific virulence factors. Proc Natl Acad Sci USA. 2000;97:14650–14655. doi: 10.1073/pnas.97.26.14650. [DOI] [PMC free article] [PubMed] [Google Scholar]
- 37.Sad S, Dudani R, Gurnani K, Russell M, van Faassen H, Finlay B, Krishnan L. Pathogen proliferation governs the magnitude but compromises the function of CD8 T cells. J Immunol. 2008;180:5853–5861. doi: 10.4049/jimmunol.180.9.5853. [DOI] [PMC free article] [PubMed] [Google Scholar]
- 38.Dudani R, Chapdelaine Y, Faassen HH, Smith DK, Shen H, Krishnan L, Sad S. Multiple mechanisms compensate to enhance tumor-protective CD8+ T cell response in the long-term despite poor CD8+ T cell priming initially: comparison between an acute versus a chronic intracellular bacterium expressing a model antigen. J Immunol. 2002;168:5737–5745. doi: 10.4049/jimmunol.168.11.5737. [DOI] [PubMed] [Google Scholar]
- 39.Russell MS, Iskandar M, Mykytczuk OL, Nash JH, Krishnan L, Sad S. A reduced antigen load in vivo, rather than weak inflammation, causes a substantial delay in CD8+ T cell priming against Mycobacterium bovis (bacillus Calmette-Guerin) J Immunol. 2007;179:211–220. doi: 10.4049/jimmunol.179.1.211. [DOI] [PMC free article] [PubMed] [Google Scholar]
- 40.van Faassen H, Dudani R, Krishnan L, Sad S. Prolonged antigen presentation, APC-, and CD8+ T cell turnover during mycobacterial infection: comparison with Listeria monocytogenes. J Immunol. 2004;172:3491–3500. doi: 10.4049/jimmunol.172.6.3491. [DOI] [PubMed] [Google Scholar]
- 41.van Faassen H, Saldanha M, Gilbertson D, Dudani R, Krishnan L, Sad S. Reducing the stimulation of CD8+ T cells during infection with intracellular bacteria promotes differentiation primarily into a central (CD62Lhigh CD44high) subset. J Immunol. 2005;174:5341–5350. doi: 10.4049/jimmunol.174.9.5341. [DOI] [PubMed] [Google Scholar]
- 42.Brumell JH, Tang P, Zaharik ML, Finlay BB. Disruption of the Salmonella-containing vacuole leads to increased replication of Salmonella enterica serovar typhimurium in the cytosol of epithelial cells. Infect Immun. 2002;70:3264–3270. doi: 10.1128/IAI.70.6.3264-3270.2002. [DOI] [PMC free article] [PubMed] [Google Scholar]
- 43.Porgador A, Yewdell JW, Deng Y, Bennink JR, Germain RN. Localization, quantitation, and in situ detection of specific peptide-MHC class I complexes using a monoclonal antibody. Immunity. 1997;6:715–726. doi: 10.1016/s1074-7613(00)80447-1. [DOI] [PubMed] [Google Scholar]
- 44.Mercado R, Vijh S, Allen SE, Kerksiek K, Pilip IM, Pamer EG. Early programming of T cell populations responding to bacterial infection. J Immunol. 2000;165:6833–6839. doi: 10.4049/jimmunol.165.12.6833. [DOI] [PubMed] [Google Scholar]
- 45.Schaible UE, Winau F, Sieling PA, Fischer K, Collins HL, Hagens K, Modlin RL, Brinkmann V, Kaufmann SH. Apoptosis facilitates antigen presentation to T lymphocytes through MHC-I and CD1 in tuberculosis. Nat Med. 2003;9:1039–1046. doi: 10.1038/nm906. [DOI] [PubMed] [Google Scholar]
- 46.Houde M, Bertholet S, Gagnon E, Brunet S, Goyette G, Laplante A, Princiotta MF, Thibault P, Sacks D, Desjardins M. Phagosomes are competent organelles for antigen cross-presentation. Nature. 2003;425:402–406. doi: 10.1038/nature01912. [DOI] [PubMed] [Google Scholar]
- 47.Albert ML, Sauter B, Bhardwaj N. Dendritic cells acquire antigen from apoptotic cells and induce class I-restricted CTLs. Nature. 1998;392:86–89. doi: 10.1038/32183. [DOI] [PubMed] [Google Scholar]
- 48.Hersh D, Monack DM, Smith MR, Ghori N, Falkow S, Zychlinsky A. The Salmonella invasin SipB induces macrophage apoptosis by binding to caspase-1. Proc Natl Acad Sci USA. 1999;96:2396–2401. doi: 10.1073/pnas.96.5.2396. [DOI] [PMC free article] [PubMed] [Google Scholar]
- 49.van der Velden AW, Lindgren SW, Worley MJ, Heffron F. Salmonella pathogenicity island 1-independent induction of apoptosis in infected macrophages by Salmonella enterica serotype typhimurium. Infect Immun. 2000;68:5702–5709. doi: 10.1128/iai.68.10.5702-5709.2000. [DOI] [PMC free article] [PubMed] [Google Scholar]
- 50.Yrlid U, Wick MJ. Salmonella-induced apoptosis of infected macrophages results in presentation of a bacteria-encoded antigen after uptake by bystander dendritic cells. J Exp Med. 2000;191:613–624. doi: 10.1084/jem.191.4.613. [DOI] [PMC free article] [PubMed] [Google Scholar]
- 51.Lindgren SW, Stojiljkovic I, Heffron F. Macrophage killing is an essential virulence mechanism of Salmonella typhimurium. Proc Natl Acad Sci USA. 1996;93:4197–4201. doi: 10.1073/pnas.93.9.4197. [DOI] [PMC free article] [PubMed] [Google Scholar]
- 52.Knodler LA, Finlay BB. Salmonella and apoptosis: to live or let die? Microbes Infect. 2001;3:1321–1326. doi: 10.1016/s1286-4579(01)01493-9. [DOI] [PubMed] [Google Scholar]
- 53.Freigang S, Egger D, Bienz K, Hengartner H, Zinkernagel RM. Endogenous neosynthesis vs. cross-presentation of viral antigens for cytotoxic T cell priming. Proc Natl Acad Sci USA. 2003;100:13477–13482. doi: 10.1073/pnas.1835685100. [DOI] [PMC free article] [PubMed] [Google Scholar]
- 54.Buchmeier NA, Heffron F. Inhibition of macrophage phagosome-lysosome fusion by Salmonella typhimurium. Infect Immun. 1991;59:2232–2238. doi: 10.1128/iai.59.7.2232-2238.1991. [DOI] [PMC free article] [PubMed] [Google Scholar]
- 55.Cheminay C, Mohlenbrink A, Hensel M. Intracellular Salmonella inhibit antigen presentation by dendritic cells. J Immunol. 2005;174:2892–2899. doi: 10.4049/jimmunol.174.5.2892. [DOI] [PubMed] [Google Scholar]
- 56.Tobar JA, Carreno LJ, Bueno SM, Gonzalez PA, Mora JE, Quezada SA, Kalergis AM. Virulent Salmonella enterica serovar typhimurium evades adaptive immunity by preventing dendritic cells from activating T cells. Infect Immun. 2006;74:6438–6448. doi: 10.1128/IAI.00063-06. [DOI] [PMC free article] [PubMed] [Google Scholar]
- 57.Halici S, Zenk SF, Jantsch J, Hensel M. Functional analysis of the Salmonella pathogenicity island 2-mediated inhibition of antigen presentation in dendritic cells. Infect Immun. 2008;76:4924–4933. doi: 10.1128/IAI.00531-08. [DOI] [PMC free article] [PubMed] [Google Scholar]
- 58.Alaniz RC, Cummings LA, Bergman MA, Rassoulian-Barrett SL, Cookson BT. Salmonella typhimurium coordinately regulates FliC location and reduces dendritic cell activation and antigen presentation to CD4+ T cells. J Immunol. 2006;177:3983–3993. doi: 10.4049/jimmunol.177.6.3983. [DOI] [PubMed] [Google Scholar]
- 59.Srinivasan A, Foley J, Ravindran R, McSorley SJ. Low-dose Salmonella infection evades activation of flagellin-specific CD4 T cells. J Immunol. 2004;173:4091–4099. doi: 10.4049/jimmunol.173.6.4091. [DOI] [PubMed] [Google Scholar]
- 60.Brunt LM, Portnoy DA, Unanue ER. Presentation of Listeria monocytogenes to CD8+ T cells requires secretion of hemolysin and intracellular bacterial growth. J Immunol. 1990;145:3540–3546. [PubMed] [Google Scholar]
- 61.Berche P, Gaillard JL, Sansonetti PJ. Intracellular growth of Listeria monocytogenes as a prerequisite for in vivo induction of T cell-mediated immunity. J Immunol. 1987;138:2266–2271. [PubMed] [Google Scholar]
- 62.Vijh S, I, Pilip M, Pamer EG. Effect of antigen-processing efficiency on in vivo T cell response magnitudes. J Immunol. 1998;160:3971–3977. [PubMed] [Google Scholar]
- 63.Tierrez A, Garcia-del Portillo F. New concepts in Salmonella virulence: the importance of reducing the intracellular growth rate in the host. Cell Microbiol. 2005;7:901–909. doi: 10.1111/j.1462-5822.2005.00540.x. [DOI] [PubMed] [Google Scholar]
- 64.Garcia-del Portillo F, Nunez-Hernandez C, Eisman B, Ramos-Vivas J. Growth control in the Salmonella-containing vacuole. Curr Opin Microbiol. 2008;11:46–52. doi: 10.1016/j.mib.2008.01.001. [DOI] [PubMed] [Google Scholar]
- 65.Segura I, Casadesus J, Ramos-Morales F. Use of mixed infections to study cell invasion and intracellular proliferation of Salmonella enterica in eukaryotic cell cultures. J Microbiol Methods. 2004;56:83–91. doi: 10.1016/j.mimet.2003.09.004. [DOI] [PubMed] [Google Scholar]
- 66.Jantsch J, Cheminay C, Chakravortty D, Lindig T, Hein J, Hensel M. Intracellular activities of Salmonella enterica in murine dendritic cells. Cell Microbiol. 2003;5:933–945. doi: 10.1046/j.1462-5822.2003.00334.x. [DOI] [PubMed] [Google Scholar]
- 67.Garcia-del Portillo F. Salmonella intracellular proliferation: where, when and how? Microbe Infect. 2001;3:1305–1311. doi: 10.1016/s1286-4579(01)01491-5. [DOI] [PubMed] [Google Scholar]
- 68.Vidal S, Tremblay ML, Govoni G, Gauthier S, Sebastiani G, Malo D, Skamene E, Olivier M, Jothy S, Gros P. The Ity/Lsh/Bcg locus: natural resistance to infection with intracellular parasites is abrogated by disruption of the Nramp1 gene. J Exp Med. 1995;182:655–666. doi: 10.1084/jem.182.3.655. [DOI] [PMC free article] [PubMed] [Google Scholar]
- 69.Fields PI, Groisman EA, Heffron F. A Salmonella locus that controls resistance to microbicidal proteins from phagocytic cells. Science. 1989;243:1059–1062. doi: 10.1126/science.2646710. [DOI] [PubMed] [Google Scholar]
- 70.Steele-Mortimer O, Meresse S, Gorvel JP, Toh BH, Finlay BB. Biogenesis of Salmonella typhimurium-containing vacuoles in epithelial cells involves interactions with the early endocytic pathway. Cell Microbiol. 1999;1:33–49. doi: 10.1046/j.1462-5822.1999.00003.x. [DOI] [PubMed] [Google Scholar]
- 71.Foulds KE, Zenewicz LA, Shedlock DJ, Jiang J, Troy AE, Shen H. Cutting edge: CD4 and CD8 T cells are intrinsically different in their proliferative responses. J Immunol. 2002;168:1528–1532. doi: 10.4049/jimmunol.168.4.1528. [DOI] [PubMed] [Google Scholar]
- 72.Pejcic-Karapetrovic B, Gurnani K, Russell MS, Finlay BB, Sad S, Krishnan L. Pregnancy impairs the innate immune resistance to Salmonella typhimurium leading to rapid fatal infection. J Immunol. 2007;179:6088–6096. doi: 10.4049/jimmunol.179.9.6088. [DOI] [PubMed] [Google Scholar]