

Abstract
Molecular dynamics (MD) simulations and hybrid quantum mechanical/molecular mechanical (QM/MM) calculations have been perforemd to explore the dynamic behaviors of cytochrome P450 2A6 (CYP2A6) binding with nicotine analogs (that are typical inhibitors) and to calculate their binding free energies in combination with Poisson-Boltzmann surface area (PBSA) calculations. The combined MD simulations and QM/MM-PBSA calculations reveal that the most important structural parameters affecting the CYP2A6-inhibitor binding affinity are two crucial internuclear distances, i.e. the distance between the heme iron atom of CYP2A6 and the coordinating atom of the inhibitor, and the hydrogen-bonding distance between the N297 side chain of CYP2A6 and the pyridine nitrogen of the inhibitor. The combined MD simulations and QM/MM-PBSA calculations have led to dynamic CYP2A6-inhibitor binding structures that are consistent with the observed dynamic behaviors and structural features of CYP2A6-inhibitor binding, and led to the binding free energies that are in good agreement with the experimentally-derived binding free energies. The agreement between the calculated binding free energies and the experimentally-derived binding free energies suggests that the combined MD and QM/MM-PBSA approach may be used as a valuable tool to accurately predict the CYP2A6-inhibitor binding affinities in future computational design of new, potent and selective CYP2A6 inhibitors.
1. Introduction
Smoking is known as the leading cause of preventable disease, disability and death.1 In the United States, about 440,000 people are killed directly or indirectly by cigarette smoking every year.2 This number is even bigger than that caused by alcohol, illegal drug use, homicide, suicide, car accidents, and AIDS combined. It has also been known that 90% of lung cancer cases can be attributed to cigarette smoking. Most smokers realized that tobacco is health-eroding, and expressed a desire to stop or reduce smoking. However, more than 85% of these smokers get relapsed in a week.3 Nicotine, an alkaloid found in tobacco leaves, is the primary compound responsible for tobacco dependence.4,5 Currently, the most widely used therapies for smoking cessation include nicotine replacement therapies (NRT), the dopamine reuptake inhibitor bupropion, tricyclic antidepressant nortryptaline and the anti-anxiety agent buspirone. The success rate for these therapies is up to 36.5% as counted at the year of 2008, plus numerous side effects.6,7 These factors have made it a high priority to implement new smoking cessation agents with novel mechanisms of action.
Latest studies8,9,10,11,12,13,14,15,16,17,18 have found that the cytochrome P450 2A6 (CYP2A6) is the primary enzyme for nicotine metabolism. This enzyme metabolizes nicotine into cotinine and nornicotine. Other enzymes such as CYP2A13 mainly metabolize the procarcinognic nitrosamines from tobacco. CYP82E4 acts as a nicotine N-demethylase, metabolizing nicotine into nornicotine. CYP2A6 is found predominantly in the liver, and its inhibition by Methoxsalen and other compounds decrease nicotine metabolism and, thus, decrease further smoking.4,9,15,19,20,21 Therefore, the inhibition of CYP2A6 can be used as a novel therapeutic strategy for smoking cessation and tobacco-use reduction. For this reason, a number of compounds, including Methoxsalen and nicotine analogs, have been designed and used as selective inhibitors of CYP2A6.9,19,20, 22, 23, 24, 25 However, the inhibitory activity of these compounds is only at μM level and their selectivity needs to be further improved.24,25 In order to rationally design new, potent and selective inhibitors of CYP2A6, it is very important to be able to accurately predict the binding affinity of CYP2A6 with its potential inhibitors. Accurate calculation of CYP2A6-inhibitior binding free energy could provide a valuable tool for future computational design of new CYP2A6 inhibitors. Among a series of methods of binding free energy calculations, molecular mechanics-Poisson-Boltzmann surface area (MM-PBSA) approach has been popularly used to determine the mode of ligand binding and to discover novel lead compounds in virtual screening.26,27,28,29,30,31,32 However, the MM-PBSA calculations usually depend heavily on the conformation sampling by MD simulations and the type of force field parameters.30 In our previous study, 33 a combined use of the hybrid quantum mechanical/molecular mechanical (QM/MM) geometry optimizations and the PBSA calculations (i.e. a QM/MM-PBSA protocol using our recently developed/modified computer codes, see below) was carried out to more reasonably re-assign a key residue side-chain conformations in the previously reported X-ray crystal structures of an enzyme (i.e. phosphodiesterase10) interacting with its reaction products. Further, we would like to know whether our QM/MM-PBSA protocol in combination with MD simulations can be used to reliably predict binding free energies for CYP2A6 binding with its ligands. Hence, the combined MD and QM/MM-PBSA approach has been examined, in the present study, in calculating the binding free energies of CYP2A6 with four typical inhibitors that are nicotine analogs (Scheme 1). Starting from the X-ray crystal structures of CYP2A6 in complex with these inhibitors,24,25 the dynamic behavior of the CYP2A6-inhibitor binding was explored by MD simulations and analysis of critical intermolecular interactions. The simulated binding structures and calculated binding free energies are in good agreement with the corresponding experimental data for the CYP2A6-inhibitor binding. The agreement between the calculated and experimentally-derived binding free energies suggests that the QM/MM-PBSA method may be a valuable tool capable of accurately predicting the CYP2A6-inhibitor binding free energies and, thus, may be valuable for future computational design of new, potent and selective CYP2A6 inhibitors.
Scheme 1.
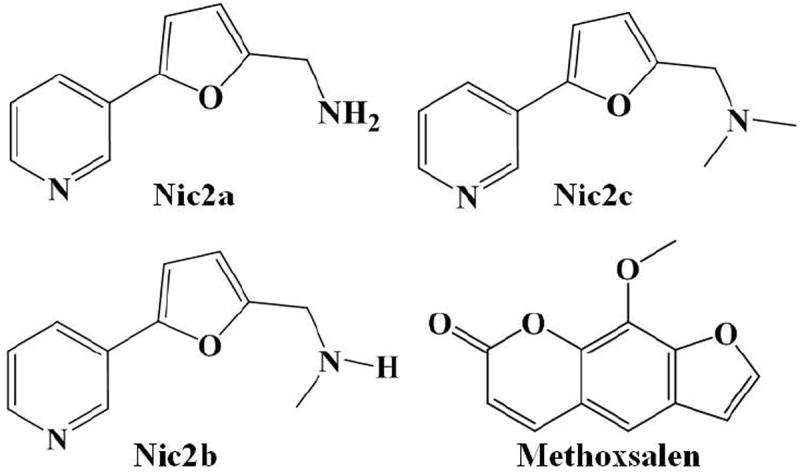
Molecular structures of CYP2A6 inhibitors examined in this study.
2. Computational Methods
Our combined MD and QM/MM-PBSA approach is based on a combined use of molecular dynamics simulations (MD), quantum mechanical/molecular mechanical (QM/MM) calculations, and Poisson-Boltzmann surface area (PBSA) calculations. By using the combined MD and QM/MM-PBSA approach for an enzyme-inhibitor binding system, one first needs to perform MD simulations on the system and obtain a stable MD trajectory, followed by QM/MM geometry optimizations starting from the snapshots of the MD trajectory and, finally, the QM/MM-PBSA binding free energy calculations.
MD simulations
The initial structure of each CYP2A6-inhibitor complex was prepared directly from the available X-ray structures of the CYP2A6-inhibitor complexes.24,25 The PDB codes are 2FDW at resolution of 2.05 Å for CYP2A6-Nic2a complex, 2FDV at resolution of 1.65 Å for CYP2A6-Nic2b complex, 2FDU at resolution of 1.85 Å for CYP2A6-Nic2c complex,25 and 1Z11 at resolution of 2.05 Å for CYP2A6-Methoxsalen complex.24 In order to further relax each complex structure, and to sample the binding conformations in solution, MD simulations were performed by using the Sander module of Amber8 program package34 for each of the CYP2A6-inhibitor complexes. After all the ionizable residues of CYP2A6 were set to the standard protonated or deprotonated states, the hydrogen atoms were added by using the X-leap module of Amber8 program.34 The molecular mechanical force field parameters for the heme group were developed based on our first-principles electronic structure calculations. The geometry of the heme group was optimized by using the Gaussian03 program at the B3LYP/6-31G* level.35 The atomic charges for the heme group, and for all the inhibitor molecules were the restrained electrostatic potential (RESP) charges determined by fitting with the standard RESP procedure implemented in the Antechamber module of the Amber8 program.34 Bonded and nonbonded parameters for atoms of the heme group were derived from the default libraries of Amber8 program.
The procedure of MD simulations was similar to that used in our previous studies on other protein-ligand systems.27,28,31 In particular, the Amber ff03 force field36 was used for all the amino acid residues of CYP2A6 and the general Amber force field (gaff)37 was used for the heme group and inhibitors. Each of the CYP2A6-inhibitor complex structure was solvated in an orthorhombic box of TIP3P water molecules38 with a minimum solvent-wall distance of 10 Å. Chloride counter ions (Cl-) were added to neutralize the solvated system. After the whole system was set up, a series of energy minimizations were carried out by using the Sander.34 First, the atomic position of water molecules was minimized for 20,000 steps. Then, additional 20,000 steps of energy minimization on the side chains of CYP2A6 along with water molecules were performed. Finally, the entire system was energy-minimized and a convergence criterion of 0.001 kcal/(mol·Å) was achieved. The energy-minimized system was gradually heated to 298.15 K by using weak-coupling method39 and equilibrated for 400 ps. During the MD simulations, a 10.0 Å non-bonded interaction cutoff was used and the non-bonded list was updated every 25 steps. The motion for the mass center of the system was removed every 1,000 steps. The particle-mesh Ewald (PME) method40 was applied to treat long-range electrostatic interactions. The lengths of covalent bonds involving hydrogen atoms were fixed with the SHAKE algorithm,41 enabling the use of a 2-fs time step to numerically integrate the equations of motion. The production MD for each enzyme-inhibitor complex was first kept running for ~1.5 ns with a periodic boundary condition in the NTP ensemble at T = 298.15 K with Berendsen temperature coupling39 and at P = 1 atm with isotropic molecule-based scaling, and then was repeated by using different starting velocities. Finally, the total length of the MD trajectory for each enzyme-inhibitor complex reached 12.0 ns by aggregating all the short MD trajectories.
QM/MM geometry optimization
In order to further optimize each of the CYP2A6-inhibitor binding structure, QM/MM optimization was performed by using a pseudobond QM/MM method.42,43,44 The pseudobond QM/MM method was initially implemented in revised Gaussian03 and Tinker programs.42,43 In the present study, we used the modified Gaussian03 program and modified Amber8 program which were developed in our laboratory for the purpose of performing parallel computing in both the QM and MM parts of the QM/MM calculations.45,46,47,48
For each CYP2A6-inhibitor complex, after the MD simulation was finished, 10 snapshots from the last 500 ps of the MD trajectory, with one snapshot for every 50 ps were extracted and subject to the QM/MM geometry optimization. The QM subsystem contains the heme group and the inhibitor molecule. This subsystem was optimized by employing density functional theory (DFT) using Becke’s three-parameter hybrid exchange functional and the Lee-Yang-Parr correlation functional (B3LYP) with the 6-31G(d) basis set49 in Gaussian03 program,35 and the convergence criterion for geometry optimizations followed the original Gaussian03 defaults. The remaining subsystem was treated with the MM method, and was geometry-optimized by using the Sander.34 The geometry optimization convergence criterion for MM subsystem was set as the root-mean- square deviation (RMSD) of energy gradient ≤ 0.1 kcal·mol-1· Å-1, and no cutoff was used for non-bonded interactions during the QM/MM calculations. Throughout the QM/MM calculations, the boundary carbon atom (i.e. the Cβ atom of residue C439) was treated with improved pseudobond parameters,43 and the atoms within 20 Å of the ion atom at the heme group of CYP2A6 were allowed to move while all the other atoms outside this range were frozen.
Concerning the use of B3LYP functional as the QM method, B3LYP might not be the best functional because it may be not able to cover non-local electron correlation effects in the dispersion-bound non-covalent complexes.50,51 Nevertheless, one may reasonably expect that the computational errors due to this factor are systematic for the same type of protein-ligand binding systems. Thus, this factor is not expected to dramatically affect the relative values of the calculated binding free energies in the present study.
QM/MM-PBSA binding free energy calculation
Starting from the QM/MM-optimized 10 structures for each CYP2A6-inhibitor complex, the binding free energies were calculated by using the QM/MM-PBSA method. The QM/MM-PBSA method was used to accurately predict the enzyme-substrate binding free energies.33
According to the QM/MM-PBSA method,33 the free energy of each CYP2A6-inhibitor binding, ΔGbind, was calculated from the difference between the free energy of the CYP2A6-inhibitor complex (Gcomplex) and the sum of the free energies of the unbound CYP2A6 (GCYP2A6) and the free inhibitor (Ginhibitor) using the following equation:
| (1) |
Actually, the binding free energy ΔGbind was evaluated as a sum of the changes in the QM/MM gas-phase binding energy (ΔEQM/MM), solvation free energy (ΔGsolv), and the entropy contribution (−TΔS) by the following equations
| (2) |
| (3) |
| (4) |
| (5) |
In Eq.(2), ΔEbind = ΔEQM/MM + ΔGsolv. In Eq.(3), EQM/MM (complex) represents the energy of the CYP2A6-inhibitor complex, and was calculated at the B3LYP/6-31G*:Amber level. The EQM/MM (CYP2A6) represents the energy of MM subsystem and was calculated at the same level using the QM/MM method as well. The CYP2A6 structure was optimized again after the inhibitor was deleted from the optimized complex structure. All QM calculations contain the same atoms except the inhibitor atoms. For the energy calculation of the inhibitor, i.e. EQM (inhibitor), we always used the lowest-energy geometry optimized at the B3LYP/6-31G* level.
The solvation free energy (ΔGsolv) is the sum of the electrostatic solvation free energy (ΔGPB) and the nonpolar solvation energy (ΔGnp). The ΔGPB was calculated by the finite-difference solution to the PB equation implemented in the Delphi program.52,53 The MSMS program54 was used to calculate the solvent-accessible surface area (SASA) for the estimation of ΔGnp using Eq.(5) with parameters γ = 0.00542 kcal/Å2 and β = 0.92 kcal/mol.
The entropy contribution, −TΔS, to the binding free energy was calculated using a local program (a standalone program) developed in our own laboratory. 55 The computational procedure for the evaluation of −TΔS was the same as that described in our recent publications. As we described previously, the entropy contribution was divided into two parts, solvation entropy (ΔSsolv) and conformational entropy (ΔSconf):
| (6) |
The solvation entropy is gained by solvent water molecules on being displaced from the active site by the ligand during binding and was calculated by using the parameters established previously.55,56 The contribution of conformational entropy change to the binding free energy is proportional to the number (ΔNrot) of the lost rotatable bonds during the binding. Thus, we have:
| (8) |
Although all of the other parameters used in our QM/MM-PBSA calculations are the standard ones reported in literatures52,53,54 or the default ones of the Amber8 program,34 the adjustable parameter, w, was calibrated by fitting the calculated ΔGbind values to the corresponding ΔGbind values derived from experimentally measured inhibitory constant (Ki) values.24,25
The final binding free energy ΔGbind for each CYP2A6-inhibitor binding structure was taken as the average of the ΔGbind values calculated for the QM/MM-optimized 10 structures extracted from the MD trajectory.
3. Results and Discussion
Dynamics of CYP2A6-inhibitor binding
Depicted in Figure 1 are the tracked distances from MD simulations on CYP2A6-Nic2a binding structure (Figure 1A), and the QM/MM-optimized complex structure (Figure 1B) with detailed information about important intermolecular interactions (Figure 1C). Depicted in Figure S1 (see Supporting Information) are the tracked positional root-mean square deviation (RMSD) values for Cα atoms of CYP2A6-Nic2a binding structure from the starting X-ray crystal structure (PDB entry code: 2FDW), and tracked RMSD values for non-hydrogen atoms of CYP2A6-Nic2a complex from the X-ray crystal structure of CYP2A6 binding with nicotine (PDB entry code: 4EJJ) along the MD trajectory. As shown in Figure S1, the change of the RMSD values for Cα atoms of CYP2A6-Nic2A complex became very small after fluctuating for a period of 1 ns of MD trajectory, indicating that the CYP2A6-Nic2a binding structure was stabilized in the MD simulations. As shown in Figure 1 (B and C), the inhibitor Nic2a fits very well inside the narrow active-site cavity just above the heme group of CYP2A6. The pyridine ring of Nic2a packs closely with aromatic side chains of residues F107, F111, F118, F209, and F480. It also contacts closely with hydrophobic side chains of residues V117 and I300. The pyridine nitrogen atom of Nic2a formed a strong hydrogen bond with Hδ atom at the side chain of residue N297 of CYP2A6. The average distance between this nitrogen atom of Nic2a and the Nδ atom of N297 side chain is 3.19 ± 0.17 Å as tracked from the 12.0 ns MD trajectory (red curve in Figure 1A). The primary amine group of Nic2a is weakly hydrogen-bonded with the carbonyl oxygen at the backbone of residue G301 (Figure 1C). The tracked average distance between the nitrogen atom on the amine group of Nic2a and the carbonyl oxygen on the backbone of residue G301 is 3.71 ± 0.55 Å based on the MD simulations (green curve in Figure 1A). As shown in Figure 1, the nitrogen atom at the amine group of Nic2a is located directly above the heme ion atom in the axial ligation position (Figure 1B). The average coordinating distance (i.e. the distance between the Fe and N atoms) is 2.41 ± 0.22 Å (Figure 1A) as tracked from MD trajectory (black curve in Figure 1A).
Figure 1.
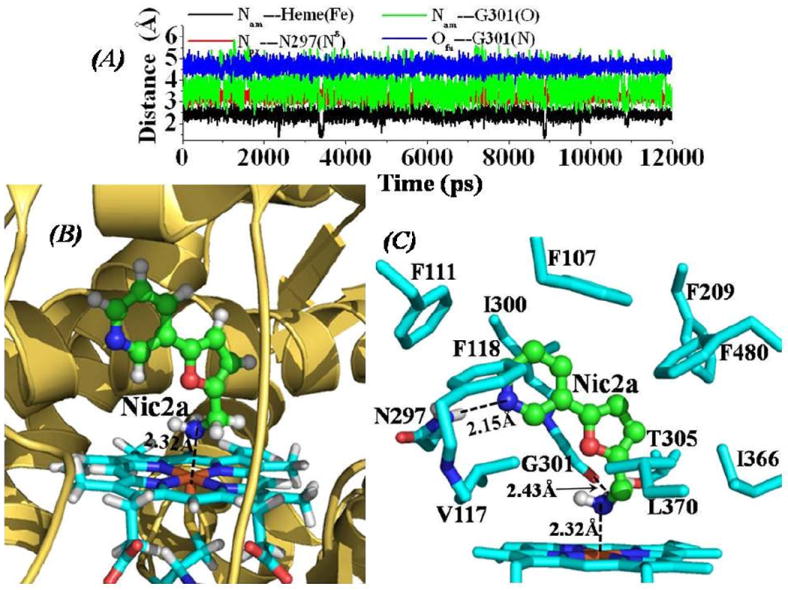
(A) Tracked distances along the MD trajectory for the CYP2A6-Nic2a binding structure. Nam---Heme(Fe) represents the distance between the nitrogen atom on the amine group of Nic2a and the heme iron atom; Npy---N297(Nδ) represents the distance between the nitrogen atom on the pyridine group of Nic2a and the Nδ atom of the N297 side chain; Nam---G301(O) is the distance between the nitrogen atom on the amine group of Nic2a and the carbonyl oxygen atom on the backbone of residue G310; and Ofu---G301(N) represents the distance between the furan oxygen atom of Nic2a and the backbone nitrogen atom of residue G301. (B) QM/MM-optimized CYP2A6-Nic2a binding structure (optimized at B3LYP/6-31G*:Amber8 level). The structure is represented as ribbon for CYP2A6, stick style for the heme group, and ball-and-stick style for Nic2a. The dashed line represents the averaged distance between the nitrogen atom on the amine group of Nic2a and the heme iron atom based on the 10 QM/MM-optimized structures. (C) Intermolecular interactions in the optimized CYP2A6-Nic2a binding structure. Residues from CYP2A6 within 5 Å of Nic2a are shown in stick style. The hydrogen-bond interaction between the nitrogen atom on the pyridine group of Nic2a and the Hδ atom of N297 side chain is represented as dashed line with labeled averaged distance from the 10 QM/MM-optimized structures, also labeled the averaged distance for the hydrogen bond between the amine group of Nic2a and the backbone carbonyl oxygen of residue G301 based on the 10 QM/MM-optimized structures.
Depicted in Figure 2 are the tracked distances and the QM/MM-optimized structure of CYP2A6-Nic2b binding, Figure 3 for the CYP2A6-Nic2c binding structure, and Figure 4 for the CYP2A6-Methoxsalen binding structure. In general, the dynamic behavior and the mode for CYP2A6 binding with these three inhibitors are quite similar to that of the CYP2A6-Nic2a binding. In a previous report of CYP82E4-nicotine binding structure obtained through homology modeling and MD simulations,17 nicotine molecule was orientated perpendicularly inside the binding cavity of CYP82E4, with one carbon atom at the pyridine ring of nicotine pointing to the iron atom of the heme group. This binding mode of nicotine with CYP82E4 is totally different from the binding mode for each inhibitor with CYP2A6 as described in the present report. As shown in Figure S1, the MD trajectory for each of the CYP2A6-inhibitor complex is quite stable as each of the tracked Cα RMSD curve is flat after the first 1 ns period of the MD simulations. Comparing the CYP2A6-Nic2a binding structure with the X-ray crystal structure of CYP2A6-nicotine complex (PDB entry code: 4EJJ), the overall conformation is very similar (left panel of Figure S2 in Supporting Information). The difference is that there is no direct hydrogen bonding between N297 side chain of CYP2A6 and the nitrogen atom of the pyridine ring of nicotine (Figure S2) in the X-ray crystal structure of CYP2A6-nicotine complex.18 Figure S3 depicts the calculated cavity at the ligand-binding site of the reported CYP2A6-nicotine complex18 and that of the CYP2A6-Nic2a binding structure (Figure 1) by using program HOLLOW.57 As shown in Figure S3, the displayed shape of cavity for CYP2A6-nicotine complex18 is smaller than that of the CYP2A6-Nic2a complex. According to the X-ray crystal structures of CYP2A6 and CYP2A13,18,24,25 there is a substrate-entry channel along Helix I of these enzymes, and residues F209, T305, and I366 (numbering in CYP2A6 as shown in Figure S3) act as the gate along the channel to the ligand-binding site. When the side chains of these residues come close to each other, e.g. the shortest distance among non-hydrogen atoms of these side chains is ≤ 5.0 Å, the gate is closed. Based on this criterion, we tracked the distances between each pair of the non-hydrogen atoms of the side chains of F209, T305, and I366 using the CYP2A6-Nic2a binding structure as an example. As shown in Figure S4, the average shortest distance between non-hydrogen atoms of F209 side chain and non-hydrogen atoms of T305 side chain is 4.74 ± 0.17 Å along the whole MD trajectory. The average shortest distance between F209 side chain and I366 side chain is 5.05 ± 0.23 Å, and it is 4.47 ± 0.21 Å between T305 side chain and I366 side chain through the whole MD trajectory. These data suggest that the gate to the inhibitor-binding cavity kept closed through the whole MD simulations on the CYP2A6-inhibitor binding structures. This is different from the observation in a previous report17 on a CYP82E4-nicotine binding model that there was an open-close process for the substrate-entry gate. As shown in Figures 2 to 4, each of these inhibitors packs tightly with aromatic residues inside the binding cavity, hydrogen-bonded with N297 side chain, and coordinated with the heme iron atom of CYP2A6.
Figure 2.
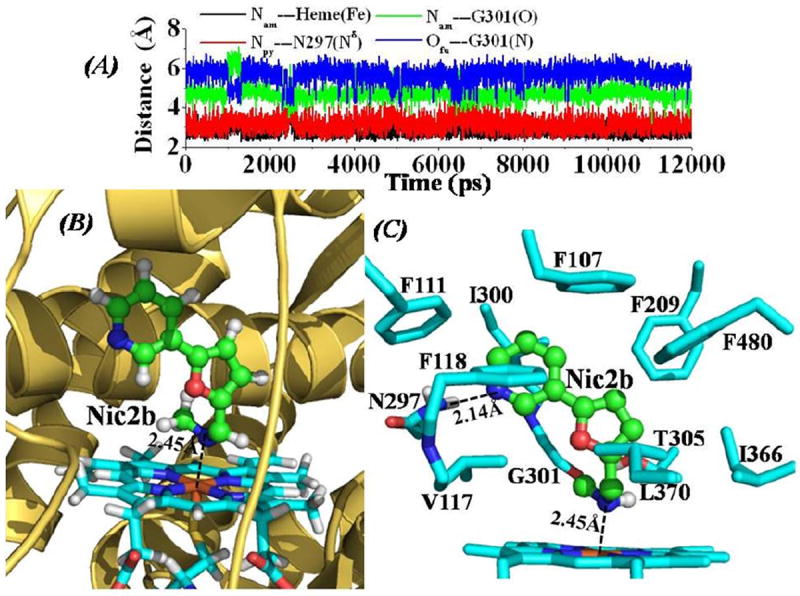
(A) Tracked distances along the MD trajectory for the CYP2A6-Nic2b binding structure. Nam---Heme(Fe) represents the distance between the nitrogen atom on the amine group of Nic2b to the heme iron atom; Npy---N297(Nδ) represents the distance between the nitrogen atom on the pyridine group of Nic2b and the Nδ atom of the N297 side chain; Nam---G301(O) is the distance between the nitrogen atom on the amine group of Nic2b and the carbonyl oxygen atom on the backbone of residue G310; and Ofu---G301(N) represents the distance between the furan oxygen atom of Nic2b and the backbone nitrogen atom of residue G301. (B) QM/MM-optimized CYP2A6-Nic2b binding structure (optimized at B3LYP/6-31G*:Amber8 level). The binding structure is represented in the same color scheme as that in Figure 1B. The dashed line represents the averaged distance between the amine nitrogen atom of Nic2b and the heme iron atom based on the 10 QM/MM optimized structures. (C) Intermolecular interactions in the optimized CYP2A6-Nic2b binding structure. Residues from CYP2A6 within 5 Å of Nic2b are shown in stick style. The hydrogen-bond interaction between the nitrogen atom on the pyridine group of Nic2b and the Hδ atom of N297 side chain is represented as dashed line with labeled averaged distance based on the 10 QM/MM-optimized structures.
Figure 3.
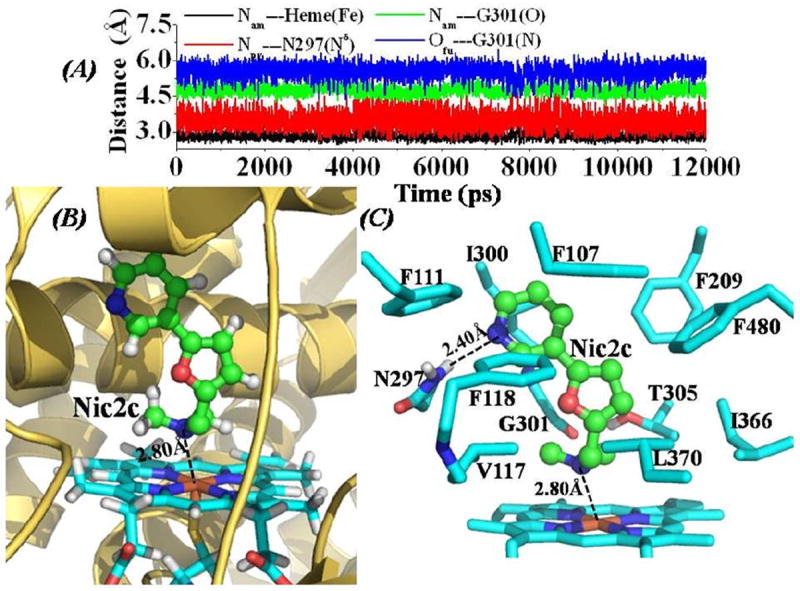
(A) Tracked distances along the MD trajectory for the CYP2A6-Nic2c binding structure. Nam---Heme(Fe) represents the distance between the nitrogen atom on the amine group of Nic2c and the heme iron atom; Npy---N297(Nδ) represents the distance between the nitrogen atom on the pyridine group of Nic2c and the Nδ atom of the N297 side chain; Nam---G301(O) is the distance between the nitrogen atom on the amine group of Nic2c and the carbonyl oxygen atom on the backbone of residue G310; and Ofu---G301(N) represents the distance between the furan oxygen atom of Nic2c and the backbone nitrogen atom of residue G301. (B) QM/MM-optimized CYP2A6-Nic2c binding structure (optimized at B3LYP/6-31G*:Amber8 level). The binding structure is represented in the same color scheme as that in Figure 1A. The dashed line represents the averaged distance between the amine nitrogen atom of Nic2c and the heme iron atom based on the 10 QM/MM optimized structures. (C) Intermolecular interactions in the optimized CYP2A6-Nic2c binding structure. Residues from CYP2A6 within 5 Å of Nic2c are shown in stick style. The averaged distance (based on the 10 QM/MM optimized structures) between the pyridine nitrogen atom of Nic2c and the Hδ atom of N297 side chain is represented as dashed line.
Figure 4.
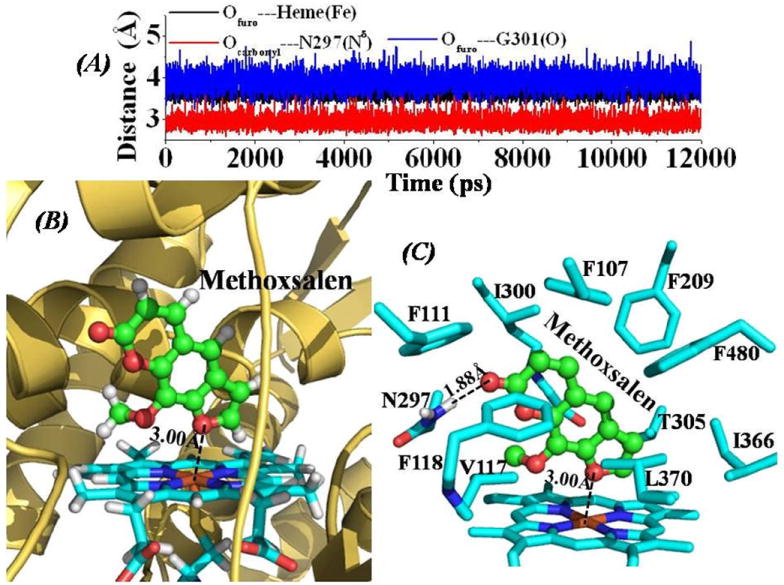
(A) Tracked distances along the MD trajectory for the CYP2A6-Methoxsalen binding structure. Ofuro---Heme(Fe) represents the distance between the oxygen atom on the furo group of Methoxsalen and the heme iron atom; Ocarbonyl---N297(Nδ) represents the distance between the carbonyl oxygen atom of Methoxsalen and the Nδ atom of the N297 side chain; Ofuro---G301(O) is the distance between the oxygen atom on the furo group of Methoxsalen and the carbonyl oxygen atom on the backbone of residue G310. (B) QM/MM-optimized CYP2A6-Methoxsalen binding structure (optimized at B3LYP/6-31G*:Amber8 level). The structure is represented as ribbon for CYP2A6, and stick style for the heme group, and Methoxsalen is displayed in ball-and-stick style. The dashed line represents the averaged distance between the furan oxygen atom and the heme iron atom based on the 10 QM/MM optimized structures. (C) Intermolecular interactions in the optimized CYP2A6-Methoxsalen binding structure. Residues from CYP2A6 within 5 Å of Methoxsalen are labeled and shown in stick style. The hydrogen-bonding interaction between the carbonyl oxygen atom of Methoxsalen and the Hδ atom of N297 side chain is represented as dashed line with labeled averaged distance based on the 10 QM/MM-optimized structures.
However, there are also some obvious differences among these four CYP2A6-inhibitor binding structures and their dynamic behaviors. The averaged distance between the pyridine nitrogen of the inhibitor and the nitrogen atom on N297 side chain of CYP2A6 (i.e. Npy---N297(Nδ)) tracked from the whole MD trajectory increases gradually from 3.19 ± 0.17 Å for CYP2A6-Nic2a binding (red curve in Figure 1A) and 3.17 ± 0.39 Å for CYP2A6-Nic2b binding (red curve in Figure 2A), to 3.46 ± 0.37 Å for CYP2A6-Nic2c binding (red curve in Figure 3A). The CYP2A6-Methoxsalen binding structure has the shortest distance of 2.94 ± 0.15 Å between the oxygen atom on the furo group of Methoxsalen and the nitrogen atom of N297 side chain as tracked from MD trajectory, indicating the strongest hydrogen bonding with residue N297 compared to the other three inhibitors. Concerning the QM/MM-optimized structures (Figures 1C, 2C, 3C, and 4C), the CYP2A6-Nic2C complex has the longest distance for the hydrogen-bonding interaction with residue N297 (Figure 3C), while the Methoxsalen has the shortest distance for the hydrogen-bonding interaction with residue N297 of CYP2A6 (Figure 4C). The averaged distance between the iron and the coordinating atom of the inhibitor in the MD-simulated complex structure is 2.41 ± 0.22 Å for the CYP2A6-Nic2a binding (black curve in Figure 1A), 2.78 ± 0.25 Å for CYP2A6-Nic2b binding (black curve in Figure 2A), 2.82 ± 0.14 Å for CYP2A6-Nic2c binding (black curve in Figure 3A), and 3.63 ± 0.12 Å (the longest) for CYP2A6-Methoxsalen binding (black curve in Figure 4A). The QM/MM-optimized complex structures (Figures 1C, 2C, 3C, and 4C) also show the same order of the iron-coordinating distances (Nic2a < Nic2b <Nic2c < Methoxsalen). Compared to the CYP2A6-Nic2b and CYP2A6-Nic2c complexes, the CYP2A6-Nic2a complex (Figure 1A and 1C) has the shortest distance between the nitrogen atom on the amine group of the inhibitor to the carbonyl oxygen on the backbone of residue G301, as tracked from the MD trajectories and the QM/MM-optimized structures. Unlike the CYP2A6-Nic2a binding structure (Figure 1A and 1C), the secondary amine group of Nic2b could not form a hydrogen bond with the carbonyl oxygen on the backbone of residue G301 (Figure 2A and 2C). All these dynamic behaviors and the changes of QM/MM-optimized structures for the binding of CYP2A6 with these nicotine analogs strongly indicate that the binding affinity should follow the order as CYP-2A6-Nic2a binding > CYP2A6-Nic2b binding > CYP2A6-Nic2c binding.
Binding free energies
Summarized in Table 1 are the calculated binding free energies by using the combined MD and QM/MM-PBSA approach described above. The detailed data are provided as supporting information. For comparison, the binding free energies derived from the experimentally measured inhibitory activities24,25 of the examined four inhibitors are also given. The adjustable parameter w was calibrated to be 0.93 in the present study. To test the reliability of the calibration using the four inhibitors, we also tested the calibration using on three of the four inhibitors by leaving one out (LOO). The obtained w was 0.92, 0.94, 0.92, and 0.92 when the LOO inhibitor was Nic2a, Nic2b, Nic2c, and Methoxsalen, respectively; the average w value was still ~0.93. It is expect that the w value can apply to CYP2A6 binding with other inhibitors when the same computational protocol is used.
Table 1.
Calculated binding free energies (kcal/mol, with standard deviations) for CYP2A6 with inhibitors in comparison with the experimentally-derived binding free energies.
| ΔEQM/MM | ΔGsolv | ΔEbind | −TΔS |
|
|
|||
|---|---|---|---|---|---|---|---|---|
| Nic2a | -54.89 | 23.06 | -31.83 | 23.18 | -8.7±0.4 | -8.5 | ||
| Nic2b | -53.89 | 25.50 | -28.39 | 22.11 | -6.3±0.5 | -7.2 | ||
| Nic2c | -50.02 | 23.98 | -26.04 | 20.43 | -5.6±0.5 | -5.5 | ||
| Methoxsalen | -54.52 | 27.22 | -27.30 | 19.44 | -7.9±0.4 | -7.8 |
The experimental binding free energies were calculated from the corresponding experimental Ki values (ref.25) via .
As listed in Table 1, the results from the combined MD simulations and QM/MM-PBSA calculations give the CYP2A6 affinity order as Nic2a > Nic2b > Nic2c. Such order of the calculated binding affinities for the three nicotine analogs agrees very well with the observations from MD simulations and the structural features of the QM/MM-optimized binding complexes as described above (Figures 1 to 3). In comparison, we were unable to obtain the same order by performing the MM-PBSA calculations (see supporting information). The agreement between the QM/MM-PBSA-calculated binding free energies and the experimentally derived ones for CYP2A6 binding with these four inhibitors (Table 1) suggests that the combined MD simulations and QM/MM-PBSA calculations are promising for predicting the enzyme-ligand binding affinity. Such type of the binding free energy calculations may also be applicable to the study of other P450 enzymes binding with substrates or inhibitors.
4. Conclusion
Molecular dynamics (MD) simulations performed in the present study have demonstrated the dynamic behaviors of CYP2A6 binding with different inhibitors. The distance of the coordination between the heme iron atom of CYP2A6 and the nitrogen atom on the amine group of the inhibitor gradually increases as the amine group of the inhibitor changes from primary amine to secondary amine, to tertiary amine, and to Methoxsalen. The hydrogen-bonding distance between the N297 side chain of CYP2A6 and the pyridine nitrogen of the inhibitor also changes in a similar way as that of the heme iron-coordinating distance, but the N297 side chain has the strongest hydrogen-bonding interaction with Methoxsalen. These two structural parameters (i.e. the N297 hydrogen-bonding distance and the iron-coordinating distance) represent the most important structural indicators affecting the CYP2A6-inhibitor binding affinity.
The combined MD simulations and QM/MM-PBSA calculations performed in this study have led to dynamic CYP2A6-inhibitor binding structures that are consistent with the observed dynamic behaviors and structural features of CYP2A6-inhibitor binding structures, and led to theoretically calculated binding free energies that are in good agreement with the experimentally-derived binding free energies. The agreement between the calculated and experimentally-derived binding free energies for CYP2A6-inhibitor binding suggests that the combined MD and QM/MM-PBSA calculations may be performed to accurately predict the CYP2A6-inhibitor binding affinity in future computational design of new, potent and selective CYP2A6 inhibitors.
Supplementary Material
Acknowledgments
This work was supported in part by the NIH (grant RC1 MH088480 to Zhan) and the NSF (grant CHE-1111761 to Zhan). The authors also acknowledge the Center for Computational Sciences (CCS) at the University of Kentucky for supercomputing time on IBM X-series Cluster with 340 modes or 1360 processors.
Footnotes
Publisher's Disclaimer: This is a PDF file of an unedited manuscript that has been accepted for publication. As a service to our customers we are providing this early version of the manuscript. The manuscript will undergo copyediting, typesetting, and review of the resulting proof before it is published in its final citable form. Please note that during the production process errors may be discovered which could affect the content, and all legal disclaimers that apply to the journal pertain.
References
- 1.WHO Report on the Global Tobacco Epidemic, 2009. World Health Organization (WHO); Switzerland: 2009. [Google Scholar]
- 2.NIDA Research Report Series. National Institute on Drug Abuse; 2009. [Google Scholar]
- 3.Tutka P, Mosiewicz J, Wielosz M. Pharmacol Rep. 2005;57(2):143. [PubMed] [Google Scholar]
- 4.Patten CJ, Smith TJ, Friesen MJ, Tynes RE, Yang CS, Murphy SE. Carcinogenesis. 1997;18(8):1623. doi: 10.1093/carcin/18.8.1623. [DOI] [PubMed] [Google Scholar]
- 5.Benowitz NL. Annu Rev Pharmacol Toxicol. 2009;49:57. doi: 10.1146/annurev.pharmtox.48.113006.094742. [DOI] [PMC free article] [PubMed] [Google Scholar]
- 6.Jorenby D. Circulation. 2001;104:e51. doi: 10.1161/hc3601.097690. [DOI] [PubMed] [Google Scholar]
- 7.Trends in tobacco use. American Lung Association Research and Program Services Epidemiology and Statistics Unit. 2011 [Google Scholar]
- 8.Yun C-H, Shimada T, Guengerich FP. Mol Pharmacol. 1991;40:679. [PubMed] [Google Scholar]
- 9.Sellers EM, Kaplan HL, Tyndale RF. Clinic Pharmacol Ther. 2000;68(1):35. doi: 10.1067/mcp.2000.107651. [DOI] [PubMed] [Google Scholar]
- 10.Dueckershoff K, Unger M, Frank A, Gillam EMJ, Guengerich FP, Warzecha H. FEBS Lett. 2005;579:2480. doi: 10.1016/j.febslet.2005.02.082. [DOI] [PubMed] [Google Scholar]
- 11.Hukkanen J, Jacob P, III, Benowitz NL. Pharmacol Rev. 2005;57:79. doi: 10.1124/pr.57.1.3. [DOI] [PubMed] [Google Scholar]
- 12.Gal AL, Dréano Y, Lucas D, Berthou F. Toxicol Lett. 2003;144:77. doi: 10.1016/s0378-4274(03)00229-7. [DOI] [PubMed] [Google Scholar]
- 13.Wang J, Pitarque M, Ingelman-Sundberg M. Biochem Biophys Res Commun. 2006;340:491. doi: 10.1016/j.bbrc.2005.12.035. [DOI] [PubMed] [Google Scholar]
- 14.Nakajima M, Fukami T, Yamanaka H, Higashi E, Sakai H, Yoshida R, Kwon J-T, Mcleod HL, Yokoi T. Clin Pharmacol Ther. 2006;80(3):282. doi: 10.1016/j.clpt.2006.05.012. [DOI] [PubMed] [Google Scholar]
- 15.Koenigs LL, Peter RM, Thompson SJ, Rettie AE, Trager WF. Drug Metab Dispos. 1997;25(12):1407. [PubMed] [Google Scholar]
- 16.Kaivosaari S, Toivonen P, Hesse LM, Koskinen M, Court MH, Finel M. Mol Pharmacol. 2007;72:761. doi: 10.1124/mol.107.037093. [DOI] [PubMed] [Google Scholar]
- 17.Wang S, Yang S, An B, Wang S, Yin Y, Lu Y, Xu Y, Hao D. PLoS ONE. 2011;6(8):e23342. doi: 10.1371/journal.pone.0023342. [DOI] [PMC free article] [PubMed] [Google Scholar]
- 18.DeVore NM, Scott EE. J Biol Chem. 2012;287(32):26576. doi: 10.1074/jbc.M112.372813. [DOI] [PMC free article] [PubMed] [Google Scholar]
- 19.Kharasch ED, Hankins DC, Taraday JK. Drug Metab Dispos. 2000;28(1):28. [PubMed] [Google Scholar]
- 20.Nakajima M, Yamanaka H, Fukami T, Tokudome S, Yamamoto Y, Yamamoto H, Yokoi T. J Clin Pharmacol. 2006;46:337. doi: 10.1177/0091270005285199. [DOI] [PubMed] [Google Scholar]
- 21.Ho MK, Mwenifumbo JC, Koudsi NA, Okuyemi KS, Ahluwalia JS, Benowitz NL, Tyndale RF. Clinic Pharmacol Ther. 2009;85(6):635. doi: 10.1038/clpt.2009.19. [DOI] [PMC free article] [PubMed] [Google Scholar]
- 22.Fujita K-I, Kamataki T. Drug Metab Dispos. 2001;29(7):983. [PubMed] [Google Scholar]
- 23.Denton TT, Zhang X, Cashman JR. J Med Chem. 2005;48:224. doi: 10.1021/jm049696n. [DOI] [PubMed] [Google Scholar]
- 24.Yano JK, Hsu M-H, Griffin KJ, Stout CD, Johnson EF. Nature Struct Mol Biol. 2005;12(9):822. doi: 10.1038/nsmb971. [DOI] [PubMed] [Google Scholar]
- 25.Yano JK, Denton TT, Cemy MA, Zhang X, Johnson EF, Cashman JR. J Med Chem. 2006;49:6987. doi: 10.1021/jm060519r. [DOI] [PubMed] [Google Scholar]
- 26.Deng Y, Roux B. J Phys Chem B. 2009;113:2234. doi: 10.1021/jp807701h. [DOI] [PMC free article] [PubMed] [Google Scholar]
- 27.Lei B, Hameed MDMA, Hamza A, Wehenkel M, Muzyka JL, Yao X-J, Kim K-B, Zhan C-G. J Phys Chem B. 2010;114:12333. doi: 10.1021/jp1058098. [DOI] [PMC free article] [PubMed] [Google Scholar]
- 28.Huang X, Pan Y, Zheng F, Zhan C-G. J Phys Chem B. 2010;114(42):13545. doi: 10.1021/jp106539w. [DOI] [PMC free article] [PubMed] [Google Scholar]
- 29.Yang B, Hamza A, Chen G, Wang Y, Zhan C-G. J Phys Chem B. 2010;114(48):16020. doi: 10.1021/jp1086416. [DOI] [PMC free article] [PubMed] [Google Scholar]
- 30.Weis A, Katebzadeh K, Söderhjelm P, Nilsson I, Ryde U. J Med Chem. 2006;49:6596. doi: 10.1021/jm0608210. [DOI] [PubMed] [Google Scholar]
- 31.Li D, Huang X, Han K, Zhan C-G. J Am Chem Soc. 2011;133(19):7416. doi: 10.1021/ja111657j. [DOI] [PMC free article] [PubMed] [Google Scholar]
- 32.Hamza A, Zhao X, Tong M, Tai H-H, Zhan C-G. Bioorg Med Chem. 2011;19(20):6077. doi: 10.1016/j.bmc.2011.08.040. [DOI] [PMC free article] [PubMed] [Google Scholar]
- 33.Lu H, Goren AC, Zhan C-G. J Phys Chem B. 2010;114:7022. doi: 10.1021/jp911527y. [DOI] [PMC free article] [PubMed] [Google Scholar]
- 34.Case DA, Darden T, Cheatham TE, III, Simmerling C, Wang J, Duke RE, Luo R, Merz KM, Wang B, Pearlman DA, Crowley M, Brozell S, Tsui V, Gohlke H, Mongan J, Hornak V, Cui G, Beroza P, Schafmeister C, Caldwell JW, Ross WS, Kollman PA. AMBER 8. University of California; San Francisco, CA: 2004. [Google Scholar]
- 35.Frisch MJ, Trucks GW, Schlegel HB, Scuseria GE, Robb MA, Cheeseman JR, Montgomery JA, Jr, Vreven T, Kudin KN, Burant JC, Millam JM, Iyengar SS, Tomasi J, Barone V, Mennucci B, Cossi M, Scalmani G, Rega N, Petersson GA, Nakatsuji H, Hada M, Ehara M, Toyota K, Fukuda R, Hasegawa J, Ishida M, Nakajima T, Honda Y, Kitao O, Nakai H, Klene M, Li X, Knox JE, Hratchian HP, Cross JB, Adamo C, Jaramillo J, Gomperts R, Stratmann RE, Yazyev O, Austin AJ, Cammi R, Pomelli C, Ochterski JW, Ayala PY, Morokuma K, Voth GA, Salvador P, Dannenberg JJ, Zakrzewski VG, Dapprich S, Daniels AD, Strain MC, Farkas O, Malick DK, Rabuck AD, Raghavachari K, Foresman JB, Ortiz JV, Cui Q, Baboul AG, Clifford S, Cioslowski J, Stefanov BB, Liu G, Liashenko A, Piskorz P, Komaromi I, Martin RL, Fox DJ, Keith T, Al-Laham MA, Peng CY, Nanayakkara A, Challacombe M, Gill PMW, Johnson B, Chen W, Wong MW, Gonzalez C, Pople JA. Gaussian 03. Gaussian, Inc.; Pittsburgh, PA: 2003. revision A.1. [Google Scholar]
- 36.Duan Y, Wu C, Chowdhury S, Lee MC, Xiong G, Zhang W, Yang R, Cieplak P, Luo R, Lee T, Caldwell J, Wang J, Kollman PA. J Comput Chem. 2003;24:1999. doi: 10.1002/jcc.10349. [DOI] [PubMed] [Google Scholar]
- 37.Wang J, Wolf RM, Caldwell JW, Kollman PA, Case DA. J Comput Chem. 2004;25:1157. doi: 10.1002/jcc.20035. [DOI] [PubMed] [Google Scholar]
- 38.Jorgensen WL, Chandrasekhar J, Madura JD, Impey RW. J Chem Phys. 1983;79:926. [Google Scholar]
- 39.Berendsen HJC, Postma JPM, van Gunsteren WF, DiNola A, Haak JR. J Chem Phys. 1984;81:3684. [Google Scholar]
- 40.Darden T, York D, Pedersen L. J Chem Phys. 1993;98:10089. [Google Scholar]
- 41.Ryckaert JP, Ciccotti G, Berendsen HJC. J Comput Phys. 1977;23:327. [Google Scholar]
- 42.Zhang YK, Lee T, Yang WA. J Chem Phys. 1999;110:46. [Google Scholar]
- 43.Zhang YK. J Chem Phys. 2005;122(2):024114. doi: 10.1063/1.1834899. [DOI] [PubMed] [Google Scholar]
- 44.Zhang YK. Theor Chem Acc. 2006;116(1-3):43. [Google Scholar]
- 45.Liu J, Hamza A, Zhan C-G. J Am Chem Soc. 2009;131(33):11964. doi: 10.1021/ja903990p. [DOI] [PMC free article] [PubMed] [Google Scholar]
- 46.Liu J, Zhang YK, Zhan C-G. J Phys Chem B. 2009;113(50):16226. doi: 10.1021/jp9055335. [DOI] [PMC free article] [PubMed] [Google Scholar]
- 47.Chen X, Fang L, Liu J, Zhan C-G. J Phys Chem B. 2011;115(5):1315. doi: 10.1021/jp110709a. [DOI] [PMC free article] [PubMed] [Google Scholar]
- 48.Liu J, Zhao X, Yang W, Zhan C-G. J Phys Chem B. 2011;115(17):5017. doi: 10.1021/jp200975v. [DOI] [PMC free article] [PubMed] [Google Scholar]
- 49.Hehre WJ, Radom L, Schleyer PR, Pople JA. Ab Initio Molecular Orbital Theory. John Wiley & Sons; New York: 1987. [Google Scholar]
- 50.Lonsdale R, Harvey JN, Mulholland AJ. J Phys Chem Lett. 2010;1:3232. doi: 10.1021/jp910127j. [DOI] [PubMed] [Google Scholar]
- 51.Lonsdale R, Harvey JN, Mulholland AJ. J Chem Theory Comput. 2012;8:4637. doi: 10.1021/ct300329h. [DOI] [PubMed] [Google Scholar]
- 52.Gilson MK, Sharp KA, Honig B. J Comput Chem. 1988;9:327. [Google Scholar]
- 53.Jayaram B, Sharp KA, Honig B. Biopolymers. 1989;28:975. doi: 10.1002/bip.360280506. [DOI] [PubMed] [Google Scholar]
- 54.Sanner MF, Olson AJ, Spehner JC. Biopolymers. 1996;38:305. doi: 10.1002/(SICI)1097-0282(199603)38:3%3C305::AID-BIP4%3E3.0.CO;2-Y. [DOI] [PubMed] [Google Scholar]
- 55.Pan Y, Gao D, Zhan C-G. J Am Chem Soc. 2008;130(15):5140. doi: 10.1021/ja077972s. [DOI] [PMC free article] [PubMed] [Google Scholar]
- 56.Raha K, Merz KM. J Med Chem. 2005;48:4558. doi: 10.1021/jm048973n. [DOI] [PubMed] [Google Scholar]
- 57.Ho BK, Gruswitz F. BMC Struct Biol. 2008;8:49. doi: 10.1186/1472-6807-8-49. [DOI] [PMC free article] [PubMed] [Google Scholar]
Associated Data
This section collects any data citations, data availability statements, or supplementary materials included in this article.