

Abstract
Background and Aims
Alcohol taxes reduce population-level excessive alcohol use and alcohol-related morbidity and mortality, yet little is known about the distribution of the effects of alcohol taxation across race/ethnicity and age subgroups. We examined the race/ethnicity- and age group-specific effects of an excise alcohol tax increase on a common and routinely collected alcohol-related morbidity indicator, sexually transmitted infections.
Methods
We used an interrupted time series design to examine the effect of a 2009 alcohol tax increase in Illinois, USA on new cases of two common sexually transmitted infections (chlamydia and gonorrhea) reported to the US National Notifiable Disease Surveillance System from January 2003 to December 2011 (n = 108 repeated monthly observations). We estimated the effects of the tax increase on infection rates in the general population and within specific race/ethnicity and age subgroups using mixed models accounting for temporal trends and median income.
Results
Following the Illinois alcohol tax increase, state-wide rates of gonorrhea decreased 21% [95% confidence Interval (CI) = −25.7, −16.7] and chlamydia decreased 11% [95% CI = −17.8, −4.4], resulting in an estimated 3506 fewer gonorrhea infections and 5844 fewer chlamydia infections annually. The null hypothesis of homogenous effects by race/ethnicity and age was rejected (P < 0.0001). Significant reductions were observed among non-Hispanic blacks: gonorrhea rates decreased 25.6% (95% CI = −30.0, −21.0) and chlamydia rates decreased 14.7% (95% CI = −20.9, −8.0). Among non-Hispanics, point estimates suggest decreases were highest among 25–29-year-olds.
Conclusions
Increased alcohol taxes appear to reduce sexually transmitted infections, especially among subpopulations with high disease burdens, such as non-Hispanic blacks.
Keywords: Alcohol, alcohol-related morbidity, excise tax, race/ethnicity, sexually transmitted infections, time series analysis
Introduction
A robust literature has demonstrated that increased alcohol prices through national and state tax policies decrease alcohol consumption 1. In turn, alcohol-related mortality and morbidities are reduced among drinkers, especially excessive drinkers 2. Alcohol tax increases also reduce harms related to social interactions involving alcohol [i.e. violent assaults, drunk-driving and sexually transmitted infections (STIs)] 2. Understanding the potential heterogeneity of effects of alcohol taxation is important for the design of optimum public policy 3, yet the proportionality of effects of alcohol taxation across population subgroups is unclear.
Several characteristics, including income, race/ethnicity and age, may influence the magnitude of the effect of alcohol taxation on alcohol use and alcohol-related morbidity and mortality 3. Increases in alcohol prices may disproportionately affect lower-income populations because they have less disposable income 4. In the United States, economic differences in the effects of alcohol policies may be reflected as racial/ethnic differences because of the striking economic disparities by race and ethnicity: in 2011, the median household income among non-Hispanic blacks ($32 000) was less than Hispanics ($38 200) and nearly half that of non-Hispanic whites ($55 014) 5. The effect size of an alcohol tax increase on alcohol-related morbidities may also differ by age because of age differences in alcoholic beverage preferences, drinking locations and price sensitivities 3. For example, among women, the proportion of alcohol consumed represented by wine varies dramatically by age (30% for 16–24-year-olds and nearly 70% for 65+-year-olds) 3.
To increase understanding of the influence of alcohol tax increases on alcohol-related morbidity within race/ethnicity and age population subgroups, we investigated race/ethnicity and age subgroup-specific effects of the September 2009 increase in alcohol excise taxes for beer, wine and spirits in the state of Illinois on a state-wide measure of alcohol morbidity, sexually transmitted infections (STIs) 6–9. We chose STIs, specifically infections with gonorrhea and chlamydia, as our measure of alcohol-related morbidity because of the presence of a high-quality measurement system due to required national reporting of new diagnoses, relatively high incidence (increasing statistical power, especially within subgroups) and generally short lag-time (2–3 weeks) between acquisition and symptoms 10,11. Consistent with reported overall effects of alcohol taxes on STI rates 12–15, reductions in alcohol consumption caused by alcohol tax increases are expected to translate to reduced alcohol consumption prior to sex, reduced sexual risk-taking (i.e. sex, unprotected sex and casual or new partners) and reduced population-level STIs 1,7,8,16,17. Understanding the relation between the Illinois alcohol tax increase and STI rates in various subpopulations can help policy makers and public health researchers predict more accurately the effects of alcohol price interventions on alcohol-related morbidities across diverse populations.
Methods
Design and sample
We used an interrupted time series quasi-experimental design to examine the effect of the 2009 Illinois alcohol excise tax increase on STIs (gonorrhea and chlamydia) reported to the US National Notifiable Disease Surveillance System (NNDSS) by state and local health departments. We analyzed available data on all new cases of gonorrhea and chlamydia reported to the NNDSS from January 2003 to December 2011 covering the 80 months prior to and 28 months following the Illinois alcohol tax increase. We accounted for temporal trends in STIs during the study period by adjusting for STIs within a comparison group of 12 states compiled to best represent the counterfactual, as there is no ideal (i.e. randomized) control group. Our comparison states were all US contiguous alcohol license states (i.e. excluding states with public monopolies on any sector in the alcohol market), with no alcohol tax changes during the study period, and not bordering Illinois (i.e. California, Arizona, Colorado, New Mexico, Texas, North Dakota, South Dakota, Oklahoma, Louisiana, Florida, Delaware and Rhode Island).
Illinois 2009 alcohol excise tax increase
Illinois imposes an excise tax upon businesses engaged in the distribution of alcoholic beverages containing one half per cent or greater alcohol by volume [235 Ill. Comp. Stat. 5/Art. VIII (2011)]. From 1 July 1999 until 31 August 2009, Illinois taxed beer at a rate of $0.185 per gallon, wine at a rate of $0.730 per gallon and distilled spirits at a rate of $4.50 per gallon [235 Ill. Comp. Stat. 5/8-1, 235 Ill. Comp. Stat. 5/1–3.02–/1–3.04 (2011)]. Effective from 1 September 2009, the excise tax increased on beer to $0.231 per gallon, on wine to $1.39 per gallon and on distilled spirits to $8.55 per gallon [235 Ill. Comp. Stat. 5/8-1, 235 Ill. Comp. Stat. 5/1–3.02–/1–3.04 (2011)]. Thus, the excise tax increased 4.6 cents per gallon of beer, 66 cents per gallon of wine and $4.05 per gallon of distilled spirits. Additionally, alcohol in Illinois has been taxed with a constant 6.25% sales tax since 1 January 1990 [Ill. Adm. Code tit. 86, § 130.101 (2011)]. In Illinois, counties and municipalities may also levy general sales taxes as well as alcohol-specific taxes, but they are rare.
STI rates
We obtained all available months of state-level STI counts from the publically available NNDSS for the period from January 2003 to December 2011 18. We also obtained STI counts specific for Cook County, Illinois from the Cook County Health Department. STI counts were available by gender, race/ethnicity (non-Hispanic white, non-Hispanic black, Hispanic, American Indian or American Native, Asian or Pacific Islander and unknown) and age (15–19, 20–24, 25–29 and ≥30 years). To control for large differences in population size across age and race/ethnicity subgroups and between Illinois and the 14-state comparison group, we calculated monthly STI rates overall and for each age and race/ethnicity subgroup with estimated population figures from the US Census Bureau 19. Among the STIs available in this data system (gonorrhea, chlamydia and syphilis), we did not analyze syphilis due to the sparseness of monthly counts within race/ethnicity and age subgroups.
Median household income
To adjust for economic changes specific to Illinois that could affect the observed relations between alcohol taxes and STI rates between 2003 and 2011, we adjusted analyses for inflation-adjusted median household income 20. Within each age and race/ethnicity stratum, inflation-adjusted income estimates were available by year. To estimate monthly income, we assumed that changes were uniform within each year, and divided the yearly change into 12 equal parts.
Statistical analysis
To account for potential correlations in STI rates within Illinois, we used a linear mixed model to assess the effect of the alcohol tax increase on STI rates. We considered gonorrhea and chlamydia as independent STIs. Thus, for each STI, we estimated regression models using the following form:
Yt represents the STI rate at month t. Taxt is an indicator for the presence of the alcohol excise tax increase in month t. Xt is the STI rate in the control group in month t. MHIt is the estimated median household income in Illinois at month t. To estimate the percentage change in STI rates, models with log-transformed STI rates as the outcome were also estimated. The β1 estimate from the log-transformed model can be used to calculate the percentage change using 100 × (eβ1–1) 21. All models were run using PROC GLIMMIX in SAS version 9.3 (SAS Institute, Inc., Cary, NC, USA). We assumed that STI counts were normally distributed because there were more than 20 cases of STIs per month within each age and race/ethnicity subgroup. To account for potential seasonality of STI rates, we used a banded Toeplitz 13 covariance structure 22.
We estimated models for the total population and within race/ethnicity and age subgroups. The statistical significance of the differences by race/ethnicity and age was assessed by an F-test assuming identical effects of the alcohol tax on the percentage change in STI rates. Analyses of racial/ethnic subgroups were limited to non-Hispanic whites, non-Hispanic blacks and Hispanics, because other racial groups were too diverse to combine and too small to analyze separately within age subgroups. For example, among Asian or Pacific Islanders, monthly chlamydia counts within age subgroups ranged from 0 to 21. Sample sizes did not permit analysis of gender-race/ethnicity and age subgroups. For example, in most months there were six or fewer gonorrhea diagnoses among ≥30-year-old Hispanic women.
Sensitivity analyses
To verify the robustness of our findings at the suggestion of one of the reviewers, we subsequently repeated analyses using the Box–Jenkins autoregressive integrated moving average (ARIMA) approach. Because tests between temporary and permanent effects are more straightforward with Box–Jenkins transfer functions, we assessed the fit of several transfer functions with ARIMA as opposed to mixed models.
In February 2010, Illinois changed STI reporting from a paper-based to an electronic system. Technical problems and the additional time required for local health departments to report STI cases potentially caused under-reporting as health departments adjusted to the electronic reporting system (D. Brikshavana, personal communication, 16 May 2013). While it is impossible to predict the level of under-reporting, the majority of the under-reporting probably occurred within local health departments in Cook County (Chicago metropolitan area) because of the large volume of cases in Cook County (D. Brikshavana, personal communication, 16 May 2013). Thus, to explore the sensitivity of our main findings to the possible effect of this reporting change, we also estimated models restricted to STIs reported by local health departments outside Cook County (60% of Illinois population) 23.
Results
In Illinois, between 2003 and 2010, gonorrhea rates were higher among non-Hispanic blacks than among non-Hispanic whites and Hispanics (Fig. 1). Monthly gonorrhea rates among non-Hispanic blacks ranged from 61 to 112 per 100 000 prior to the tax change (2003–August 2008) and from 36 to 102 per 100 000 following the tax change (September 2008–December 2011). Gonorrhea rates among non-Hispanic whites and Hispanics remained relatively stable from 2003 to 2011, ranging from two to four per 100 000 among non-Hispanic whites and two to seven per 100 000 among Hispanics.
Figure 1.
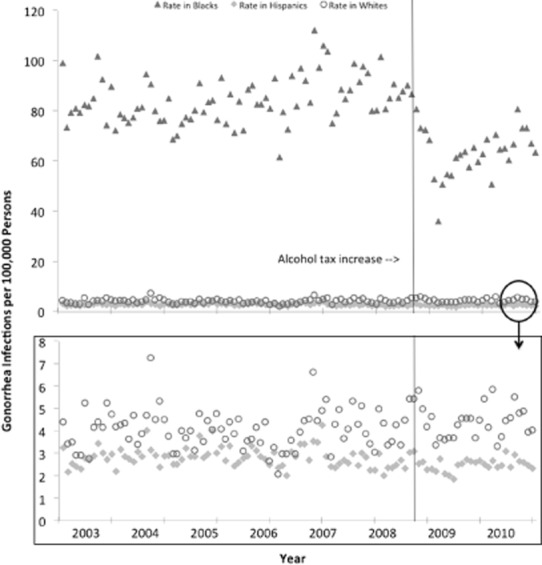
Crude monthly rates of gonorrhea (per 100 000 individuals) in Illinois
Similarly, chlamydia rates were considerably higher among non-Hispanic blacks than among non-Hispanic whites and Hispanics (Fig. 2). Within all three racial/ethnic groups, we found a trend of increasing chlamydia rates across time (P-value for linear trend test: <0.0001 for non-Hispanic blacks, non-Hispanic whites and for Hispanics). Among non-Hispanic blacks, visual observation suggests an interruption in the increasing trend at the time of the tax change. Monthly chlamydia rates among non-Hispanic blacks ranged from 128 to 225 per 100 000 prior to the tax change (2003–August 2008) and 127 to 221 per 100 000 following the tax change (September 2008–December 2011). Chlamydia rates among non-Hispanic whites range from an average of 10 per 100 000 in 2003 to an average of 16 per 100 000 in 2011. Among Hispanics, chlamydia rates range from an average of 29 per 100 000 in 2003 to an average of 43 per 100 000 in 2011.
Figure 2.
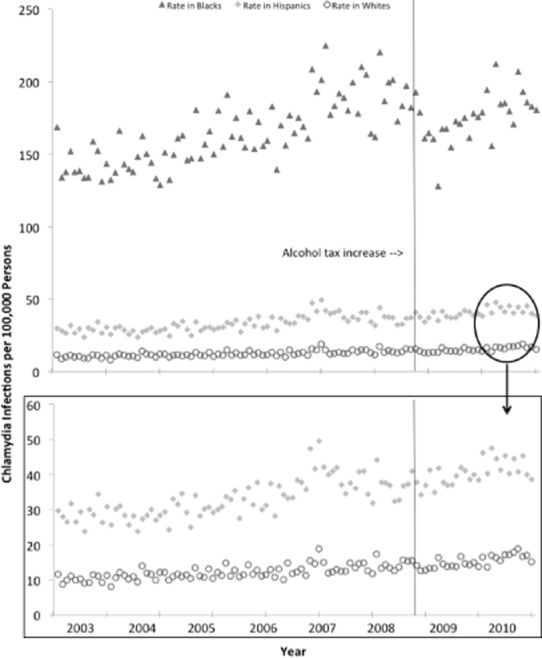
Crude monthly rates of chlamydia (per 100 000 individuals) in Illinois
Following the alcohol tax increase in Illinois, gonorrhea rates decreased 21% and chlamydia rates decreased 11%. Each month, three fewer cases of gonorrhea per 100 000 individuals and five fewer cases of chlamydia per 100 000 were reported (Table 1). Thus, each year, on average, the tax increase prevented an estimated 36 cases of gonorrhea per 100 000 individuals and 60 cases of chlamydia per 100 000 individuals. Within the 2.5 years assessed following the tax increase, an estimated 23 000 STIs were prevented.
Table 1.
Estimated effect of the state-wide Illinois alcohol excise tax increase on sexually transmitted infections (STIs): 2003–2011
| Δ Rate per 100 000 population per month (95% CI) | Percentage change (95% CI) | |
|---|---|---|
| Gonorrhea | −3.2 (−4.0, −2.4) | −21.4 (−25.7 −16.7) |
| Chlamydia | −4.8 (−7.8, −1.9) | −11.4 (−17.8, −4.4) |
Estimates are adjusted for secular trends, seasonality and median household income. Estimates include all cases of gonorrhea or chlamydia reported in Illinois regardless of race/ethnicity. Δ = Change in; CI = confidence interval.
Outside Cook County, where fewer problems were experienced when switching to electronic reporting in 2010, we found a similar decrease in gonorrhea (two per 100 000 per month): change in rate per 100 000 population per month of −1.9 (95% confidence interval −2.5 to −1.3). Compared to the state-wide estimates, we found a smaller decrease in chlamydia rates outside Cook County: −0.7 (−2.8 to 1.4).
The null hypothesis of homogeneous effects by race/ethnicity and age was strongly rejected (P < 0.0001). Alcohol tax increases reduced STI rates primarily among non-Hispanic blacks (Figs 1 and 2): gonorrhea rates decreased 25% and chlamydia rates decreased 15%. Among non-Hispanic blacks, the tax increase prevented 27 cases of chlamydia per 100 000 individuals [−26.6 (−39.1 to −14.0)] and 22 cases of gonorrhea per 100 000 individuals [−21.7 (−26.1 to −17.2)] each month. On an annual basis, the tax increase prevented an estimated 264 cases of gonorrhea per 100 000 population and 324 cases of chlamydia per 100 000 among non-Hispanic blacks.
STI rates among non-Hispanic whites and Hispanics were much lower than among non-Hispanic blacks, both before and after the alcohol tax increase (Figs 1 and 2). We did not detect a significant effect of the alcohol tax increase among non-Hispanic whites or Hispanics (Table 2). Among non-Hispanic whites, we found a trend towards decreasing gonorrhea [−0.1 per 100 000 (−0.3 to 0.2)] and chlamydia rates [−1.0 per 100 000 (−2.3 to 0.3)].
Table 2.
Estimated effects of 2009 Illinois alcohol excise tax increase on sexually transmitted infections (STIs) within race and age subpopulations
| Non-Hispanic black | Non-Hispanic white | Hispanic | ||||
|---|---|---|---|---|---|---|
| Δ Rate per 100 000 individuals per month (95% CI) | Percentage change (95% CI) | Δ Rate per 100 000 individuals per month (95% CI) | Percentage change (95% CI) | Δ Rate per 100 000 individuals per month (95% CI) | Percentage change (95% CI) | |
| Gonorrhea | ||||||
| All ages (years) | −21.7 (−26.1, −17.2)* | −25.6 (−30.0, −21.0)* | −0.1 (−0.3, 0.2) | −7.2 (−29.5, 22.1) | 0.5 (−0.1, 1.1) | 14.6 (−1.1, 32.7) |
| Ages 15–19 | −47.2 (−70.4, −24.0)* | −23.0 (−31.6, −13.2)* | −1.2 (−2.3, −0.1)* | −13.2 (−24.3, −0.4)* | 4.1 (1.7, 6.5)* | 67.7 (20.8, 135.1)* |
| Ages 20–24 | −71.1 (−96.4, −45.9)* | −28.1 (−36.2, −18.9)* | 0.4 (−0.7, 1.4) | 4.4 (−4.6, 14.2) | 1.2 (−0.4, 2.9) | 11.7 (−4.4, 30.5) |
| Ages 25–29 | −51.1 (−66.3, −35.9)* | −40.0 (−48.1, −30.6)* | −0.9 (−1.5, −0.3)* | −12.3 (−20.0, −3.8)* | 0.8 (−0.5, 2.1) | 15 (−8.9, 45.1) |
| Ages ≥ 30 | −6.7 (−8.6, −4.8)* | −34.9 (−41.3, −27.9)* | −0.1 (−0.2, 0.1) | −8.0 (−18.7, 4.1) | −0.4 (−0.7, −0.2)* | −21.4 (−34.4, −5.8)* |
| Chlamydia | ||||||
| All ages (years) | −26.6 (−39.1, −14.0)* | −14.7 (−20.9, −8.0)* | −1.0 (−2.3, 0.3) | −6.7 (−15.4, 3.0) | 0.8 (−1.9, 3.6) | 2.2 (−5.5, 10.5) |
| Ages 15–19 | −42.6 (−94.8, 9.7) | −7.6 (−15.9, 1.5) | 2.5 (−2.7, 7.8) | 6.7 (−1.6, 15.6) | 8.2 (2.7, 13.8)* | 10.6 (2.7, 19.1)* |
| Ages 20–24 | −117.9 (−174.4, −61.3)* | −18.0 (−25.5, −9.6)* | −7.2 (−14.6, 0.1) | −8.2 (−17.6, 2.1) | −7.0 (−21.3, 7.2) | −6.9 (−18.5, 6.3) |
| Ages 25–29 | −76.6 (−104.0, −49.2)* | −28.2 (−35.9, −19.5)* | −4.8 (−8.4, −1.2)* | −16.9 (−27.9, −4.2)* | −2.6 (−9.6, 4.3) | −4.1 (−16.7, 10.3) |
| Ages ≥ 30 | −5.5 (−7.4, −3.6)* | −18.4 (−24.2, −12.2)* | −0.2 (−0.4, −0.1)* | −8.7 (−20.6, −4.9)* | −0.4 (−1.3, 0.6) | −4.7 (−15.5, 7.6) |
Estimates are adjusted for temporal trends, seasonality, and median household income. Δ = Change in; CI = confidence interval.
Statistical significance.
Among non-Hispanic blacks, we found statistically significant decreases ranging from 23 to 40% for gonorrhea and from 18 to 28% for chlamydia within all eight age-STI strata, except one (chlamydia among 15–19-year-olds). Our point estimates suggest that among non-Hispanic blacks, the largest decrease following the alcohol tax increase was among 25–29-year-old non-Hispanic blacks (−40% for gonorrhea and −28% for chlamydia; Table 2). Similarly, among non-Hispanic whites, the point estimates among 25–29-year-olds were larger than other age groups (−12% for gonorrhea and 17% for chlamydia) except 15–19-year-olds for gonorrhea (−13%) rates following the alcohol tax increase. Among all 24 race/ethnicity, age and infection strata considered, only two strata suggest a potential increase in STIs: gonorrhea and chlamydia rates among 15–19-year-old Hispanics.
Results and conclusions from the mixed linear model and the ARIMA model were similar and without a clear pattern in the differences between models. ARIMA models, however, appear to have lower statistical power because they did not show statistically significant estimates for chlamydia within 20–24-year-old blacks [−69.0 (−155.3, 17.2)], 25–29-year-old whites [−3.8 (−7.9, 0.6)] and ≥30-year-old whites [−0.1 (−0.4, 0.2)]. Among the transfer functions assessed, only an unmodified step function fitted the data.
Discussion
The 2009 Illinois alcohol excise tax increase reduced alcohol-related morbidity due to STIs substantially throughout the state and differentially across population subgroups. Consistent with prior studies assessing alcohol taxes and STI rates 24,25, the Illinois alcohol tax reduced state-wide rates of gonorrhea by 21% and chlamydia by 11%, preventing 3506 gonorrhea infections and 5844 chlamydia infections per year. Compared to non-Hispanic whites and Hispanics, STI rates among non-Hispanic blacks were more affected by the alcohol tax increase. The effect of the Illinois alcohol tax on STIs further demonstrates the capacity of state-level policies to positively influence public health outcomes.
Our estimates for the effect of an alcohol tax change on gonorrhea rates are larger than prior studies 24,25. When we apply effect estimates from prior studies to the Illinois tax changes, under assumptions of interchangeability between populations, linear effects and additive effects by beverage type, prior studies suggest a decrease in gonorrhea of 9.8% overall and 11.7% among 15–19-year-olds and 10.2% among 20–24-year-olds 24,25. These comparisons are imprecise, because effects by beverage type are not additive (e.g. beer is less sensitive to price than spirits or wine 26) and neither previous study considered all three beverage types.
Our findings of larger effects of the alcohol tax on an alcohol-related morbidity (i.e. STI rates) among non-Hispanic blacks compared to non-Hispanic whites and Hispanics are novel. While the population-level data available preclude detailed analyses of the mechanism because cohorts were not followed over time, the literature suggests that alcohol tax increases decrease alcohol use before sex either through reduced alcohol use in general or in specific social situations 1,7,8,16,17. Racial/ethnic differences in reductions in alcohol use following a tax change have been observed previously and are potentially influenced by important factors, including disparities in income or differing beverage preferences 27.
Non-Hispanic blacks may have decreased their alcohol consumption more than other racial/ethnic groups because the increased cost of alcoholic beverages represented a larger share of disposable income: average household income in Illinois among non-Hispanic blacks ($36 984) is only 66% of non-Hispanic whites ($56 060) and 80% of Hispanics ($42 997) 20. Additionally, the unequal alcohol tax increase across beverage types placed a larger portion of the burden on spirits drinkers who are more likely to be non-Hispanic black 28. The Illinois tax change doubled the already much higher tax on spirits (an increase of over $4/gallon), while increasing the much lower tax on beer by only 25% (an increase of less than 5 cents/gallon). Finally, the maximum potential change for any STI intervention is larger among non-Hispanic blacks because their baseline STI rates are much higher than the other racial/ethnic groups. Therefore, it is easier to detect a statistically significant change at the population level among non-Hispanic blacks than among non-Hispanic whites or Hispanics.
Overall, our estimated reductions in STIs from increased alcohol taxes (21% for gonorrhea and 11% for chlamydia) are smaller than individual-level interventions targeting sex more directly: meta-analyses of brief behavioral interventions found a 35% STI reduction and meta-analyses of condom distribution programs found a 31% STI reduction 29,30. However, among African Americans, our effects (27% for chlamydia and 22% for gonorrhea) are similar to effects found in meta-analyses of behavioral interventions among men (21% STI reduction) and adolescent girls (19% STI reduction) 31,32. Furthermore, population-wide implementation of successful individual-level preventive interventions is difficult to achieve, because individuals must actively participate and organizations must contribute substantial resources. Finally, the reductions in STIs from alcohol taxes are obtained while generating, as opposed to spending, revenue for the state or governing body.
This study has three important limitations. First, as with any public policy evaluation, an ideal comparison group does not exist because alcohol tax increases were not assigned randomly. Thus, we constructed a comparison group consisting of the largest US sample possible without including alcohol monopoly states, states with alcohol tax changes during the study period or states that border Illinois geographically. Secondly, during the study period, three other alcohol-related sales tax changes occurred within Illinois’ largest city, Chicago, and its encompassing county, Cook (July 2005, Chicago 0.25% increase; July 2008, Cook County 1.0% increase; July 2010, Cook County 0.5% decrease). It is possible the Chicago- and Cook County-specific additional tax changes account for some of the chlamydia cases prevented, yet the Chicago and Cook County alcohol tax changes were small increases, were changes in sales taxes that might be less salient to consumers than excise tax changes 33 and occurred at least a year before or after the state-level excise tax change.
Thirdly, our outcome measures for gonorrhea and chlamydia are from the CDC's mandatory passive surveillance system and are limited to the available data. Passive surveillance systems are susceptible to a relatively consistent under-reporting for various reasons (e.g. health-care providers not reporting and cases not diagnosed) unrelated to alcohol tax changes; such under-reporting can bias results toward the null hypothesis. Five months after the alcohol tax increase, however, Illinois systematically changed STI reporting to an electronic system. The timing of the system change around the tax change could explain some of the decreased STI rates. It is believed that high volumes of STIs in Cook County may have caused under-reporting in Cook County health departments during early 2010 (D. Brikshavana, personal communication, 16 May 2013). The high prevalence of chlamydia may have exacerbated chlamydia under-reporting. We addressed this possibility with a sensitivity analysis comparing tax effects within versus outside Cook County, demonstrating similar effects for gonorrhea and attenuated effects for chlamydia. Additionally, the 2.5 years of data available following the tax change limited our ability to assess the sustainability of the effect over the long term. While visual inspection of the crude data suggests that the effect may be temporary, this conjecture cannot be verified with current data and could be due to other factors better understood in future years at long-term follow-up.
This study has four important strengths. First, the quasi-experimental research design is the strongest design possible in the absence of random assignment. The use of multiple comparison states not making similar tax changes improves causal inference and statistical power by controlling for variance over time due to many possible confounding factors, including unmeasured variables. Secondly, 9 years of continual monthly data, including 2 years following the tax increase, allowed good characterization of STI trends over time and around the time of the tax change. Thirdly, we examined joint effects of alcohol tax increases across all alcohol beverage types (beer, wine, distilled spirits) because Illinois increased taxes across all beverages simultaneously. Fourthly, we found clear effects of the alcohol tax increase on two separate STI measures.
Alcohol excise tax increases differentially affect alcohol-related morbidity, specifically STI rates, across racial and ethnic groups. The largest effects are among the subpopulation with the highest burden from STIs—non-Hispanic blacks—potentially because of their lower average household income and Illinois’ nearly 10 times greater taxation increase on spirits, this subpopulation's preferred beverage 28. This study confirms findings from previous research that alcohol tax policy has substantial effects on health outcomes, and indicates that the largest health benefits of alcohol tax increases appear to accrue among lower-income and more disadvantaged subpopulations carrying particularly high burdens of disease.
Acknowledgments
The authors wish to acknowledge and thank André C. Ourso JD for his thorough legal review of the Illinois tax changes and Danucha Brikshavana MPH for his assistance with the Cook County, Illinois STI data. This research was funded by Contract number 200-2011-40800 from the Centers for Disease Control and Prevention and NIH K01 AA018255. Its contents are solely the responsibility of the authors and do not necessarily represent the views of the Centers for Disease Control and Prevention.
Declaration of interests
None.
References
- 1.Wagenaar AC, Salois MJ, Komro KA. Effects of beverage alcohol price and tax levels on drinking: a meta-analysis of 1003 estimates from 112 studies. Addiction. 2009;104:179–190. doi: 10.1111/j.1360-0443.2008.02438.x. [DOI] [PubMed] [Google Scholar]
- 2.Wagenaar AC, Tobler AL, Komro KA. Effects of alcohol tax and price policies on morbidity and mortality: a systematic review. Am J Public Health. 2010;100:2270–2278. doi: 10.2105/AJPH.2009.186007. [DOI] [PMC free article] [PubMed] [Google Scholar]
- 3.Meier PS, Purshouse R, Brennan A. Policy options for alcohol price regulation: the importance of modelling population heterogeneity. Addiction. 2010;105:383–393. doi: 10.1111/j.1360-0443.2009.02721.x. [DOI] [PubMed] [Google Scholar]
- 4.Marmot M. Inequality, deprivation and alcohol use. Addiction. 1997;92:13–20. [PubMed] [Google Scholar]
- 5.US Census Bureau. 2012. Current Population Survey (CPS) Table Creator. Current Population Survey, Annual Social and Economic Supplement, 2012. Available at: http://www.census.gov/cps/data/cpstablecreator.html# (accessed 4 June 2013). (Archived at http://www.webcitation.org/6NUCprnHl on 18 February 2014)
- 6.Sales JM, Brown JL, Vissman AT, DiClemente RJ. The association between alcohol use and sexual behaviors among African American women across three developmental periods: a review. Curr Drug Abuse Rev. 2012;5:117–128. doi: 10.2174/1874473711205020117. [DOI] [PMC free article] [PubMed] [Google Scholar]
- 7.Baliunas D, Rehm J, Irving H, Shuper P. Alcohol consumption and risk of incident human immunodeficiency virus infection: a meta-analysis. Int J Public Health. 2010;55:159–166. doi: 10.1007/s00038-009-0095-x. [DOI] [PubMed] [Google Scholar]
- 8.Woolf-King SE, Steinmaus CM, Reingold AL, Hahn JA. An update on alcohol use and risk of HIV infection in sub-Saharan Africa: meta-analysis and future research directions. Int J Alcohol Drug Res. 2013;2:99–110. [Google Scholar]
- 9.Cook RL, Clark DB. Is there an association between alcohol consumption and sexually transmitted diseases? A systematic review. Sex Transm Dis. 2005;32:156–164. doi: 10.1097/01.olq.0000151418.03899.97. [DOI] [PubMed] [Google Scholar]
- 10.Satterwhite CL, Torrone E, Meites E, Dunne EF, Mahajan R, Ocfemia MCB, et al. Sexually transmitted infections among US women and men: prevalence and incidence estimates, 2008. Sex Transm Dis. 2013;40:187–193. doi: 10.1097/OLQ.0b013e318286bb53. [DOI] [PubMed] [Google Scholar]
- 11.Shrestha RK, Englund K. Sexually transmitted diseases. In: Carey WD, editor. Current Clinical Medicine. 2nd edn. Philadelphia, PA: Saunders; 2010. pp. 748–757. [Google Scholar]
- 12.Chesson H, Harrison P, Kassler WJ. Sex under the influence: the effect of alcohol policy on sexually transmitted disease rates in the United States. J Law Econ. 2000;43:215–238. doi: 10.1086/467453. [DOI] [PubMed] [Google Scholar]
- 13.Sen A, Luong M. Estimating the impact of beer prices on the incidence of sexually transmitted diseases: cross-province and time series evidence from Canada. Contemp Econ Policy. 2008;26:505–517. [Google Scholar]
- 14.Grossman M, Kaestner R, Markowitz S. An investigation of the effects of alcohol policies on youth STDs. Adv Health Econ Health Serv Res. 2005;16:229–256. [PubMed] [Google Scholar]
- 15.Harrison P, Kassler WJ. Alcohol policy and sexually transmitted disease rates—United States, 1981–1995. Morb Mortal Wkly Rep. 2000;49:346–349. [PubMed] [Google Scholar]
- 16.Kiene SM, Barta WD, Tennen H, Arneli S. Alcohol, helping young adults to have unprotected sex with casual partners: findings from a daily diary study of alcohol use and sexual behavior. J Adolesc Health. 2009;44:73–80. doi: 10.1016/j.jadohealth.2008.05.008. [DOI] [PMC free article] [PubMed] [Google Scholar]
- 17.Barta WD, Portnoy DB, Kiene SM, Tennen H, Abu-Hasaballah KS, Ferrer R. A daily process investigation of alcohol-involved sexual risk behavior among economically disadvantaged problem drinkers living with HIV/AIDS. AIDS Behav. 2008;12:729–740. doi: 10.1007/s10461-007-9342-4. [DOI] [PubMed] [Google Scholar]
- 18.Centers for Disease Control and Prevention (CDC) 2013. Sexually Transmitted Diseases Data and Statistics. Atlanta: CDC; Available at: http://www.cdc.gov/std/stats/ (accessed 14 February 2014). (Archived at http://www.webcitation.org/6NNvHHKJd on 14 February 2014)
- 19.Centers for Disease Control and Prevention. 2011. National Vital Statistics System: bridged-race population estimates data files and documentation. Available at: http://www.cdc.gov/nchs/nvss/bridged_race/data_documentation.htm (accessed 24 May 2013). (Archived at http://www.webcitation.org/6NNvQvEhz on 14 February 2014)
- 20.US Census Bureau. 2012. State median income: annual social and economic supplement. Available at: http://www.census.gov/hhes/www/income/data/statemedian/ (accessed 4 June 2013). (Archived at http://www.webcitation.org/6NNus7kaK on 14 February 2014)
- 21.Skrepnek GH, Olvey EL, Sahai A. Econometric approaches in evaluating costs and outcomes within pharmacoeconomic analyses. Pharm Policy Law. 2012;14:105–122. [Google Scholar]
- 22.Wagenaar AC, Maldonado-Molina MM, Erickson DJ, Ma L, Tobler AL, Komro KA. General deterrence effects of U.S. statutory DUI fine and jail penalties: long-term follow-up in 32 states. Accid Anal Prev. 2007;39:982–994. doi: 10.1016/j.aap.2007.01.003. [DOI] [PubMed] [Google Scholar]
- 23.US Census Bureau. 2012. State and county QuickFacts: Cook County, Illinois. Available at: http://quickfacts.census.gov/qfd/states/17/17031.html (accessed 4 June 2013). (Archived at http://www.webcitation.org/6NNvZPPVV on 14 February 2014)
- 24.Chesson H, Harrison P, Kassler WJ. Sex under the influence: the effect of alcohol policy on sexually transmitted disease rates in the United States. J Law Econ. 2000;39:215–238. doi: 10.1086/467453. [DOI] [PubMed] [Google Scholar]
- 25.Markowitz S, Kaestner R, Grossman M. An investigation of the effects of alcohol consumption and alcohol policies on youth risky sexual behaviors. Am Econ Rev. 2005;95:263–266. doi: 10.1257/000282805774669899. [DOI] [PubMed] [Google Scholar]
- 26.Gallet CA. The demand for alcohol: a meta-analysis of elasticities. Aust J Agric Resour Econ. 2007;51:121–135. [Google Scholar]
- 27.An R, Sturm R. Does the respnse to alcohol taxes differ across racial/ethnic grougs? Some evidence from 1984–2009 Behavioral Risk Factor Surveillance System. J Ment Health Policy Econ. 2011;14:13–23. [PMC free article] [PubMed] [Google Scholar]
- 28.National Institute on Alcohol Abuse and Alcoholism, National Institutes of Health (NIAAA, NIH) 2006. Alcohol use and alcohol use disorders in the United States: main findings from the 2001–2002 National Epidemiologic Survey on Alcohol and Related Conditions (NESARC). Bethesda, MD: NIAAA, NIH.
- 29.Eaton LA, Huedo-Medina TB, Kalichman SC, Pellowski JA, Sagherian MJ, Warren M, et al. Meta-analysis of single-session behavioral interventions to prevent sexually transmitted infections: implications for bundling prevention packages. Am J Public Health. 2012;102:e34–44. doi: 10.2105/AJPH.2012.300968. [DOI] [PMC free article] [PubMed] [Google Scholar]
- 30.Charania MR, Crepaz N, Guenther-Gray C, Henny K, Liau A, Willis LA, et al. Efficacy of structural-level condom distribution interventions: a meta-analysis of U.S. and international studies 1998–2007. AIDS Behav. 2011;15:1283–1297. doi: 10.1007/s10461-010-9812-y. [DOI] [PMC free article] [PubMed] [Google Scholar]
- 31.Crepaz N, Marshall KJ, Aupont LW, Jacobs ED, Mizuno Y, Kay LS, et al. The efficacy of HIV/STI behavioral interventions for African American females in the United States: a meta-analysis. Am J Public Health. 2009;99:2069–2078. doi: 10.2105/AJPH.2008.139519. [DOI] [PMC free article] [PubMed] [Google Scholar]
- 32.Henny K, Crepaz N, Lyles CM, Marshall KJ, Aupont LW, Jacobs ED, et al. Efficacy of HIV/STI behavioral interventions for heterosexual African American men in the United States: a meta-analysis. AIDS Behav. 2012;16:1092–1114. doi: 10.1007/s10461-011-0100-2. [DOI] [PMC free article] [PubMed] [Google Scholar]
- 33.Chetty R, Looney A, Kroft K. Salience and taxation: theory and evidence. Am Econ Rev. 2009;99:1145–1177. [Google Scholar]