

Abstract
Objective:
To test the hypotheses predicted in a hypothetical model of Alzheimer disease (AD) biomarkers that rates of β-amyloid (Aβ) accumulation on PET imaging are not related to hippocampal neurodegeneration whereas rates of neurodegenerative brain atrophy depend on the presence of both amyloid and neurodegeneration in a population-based sample.
Methods:
A total of 252 cognitively normal (CN) participants from the Mayo Clinic Study of Aging had 2 or more serial visits with both amyloid PET and MRI. Subjects were classified into 4 groups based on baseline positive/negative amyloid PET (A+ or A−) and baseline hippocampal volume (N+ or N−). We compared rates of amyloid accumulation and rates of brain atrophy among the 4 groups.
Results:
At baseline, 148 (59%) were amyloid negative and neurodegeneration negative (A−N−), 29 (12%) amyloid negative and neurodegeneration positive (A−N+), 56 (22%) amyloid positive and neurodegeneration negative (A+N−), and 19 (8%) amyloid positive and neurodegeneration positive (A+N+). High rates of Aβ accumulation were found in those with abnormal amyloid at baseline and were not influenced by hippocampal neurodegeneration at baseline. In contrast, rates of brain atrophy were greatest in A+N+.
Conclusions:
We describe a 2-feature biomarker approach to classifying elderly CN subjects that is complementary to the National Institute on Aging–Alzheimer's Association preclinical staging criteria. Our results support 2 key concepts in a model of the temporal evolution of AD biomarkers. First, the rate of Aβ accumulation is not influenced by neurodegeneration and thus may be a biologically independent process. Second, Aβ pathophysiology increases or catalyzes neurodegeneration.
Biomarkers of Alzheimer disease (AD) pathophysiology have been grouped into 2 qualitatively different categories: biomarkers of β-amyloid (Aβ) plaques and biomarkers of tau-related neurodegeneration. Recent National Institute on Aging–Alzheimer's Association (NIA-AA) criteria for AD address the use of AD biomarkers in all 3 clinical phases of the disease—preclinical, mild cognitive impairment (MCI), and AD dementia.1–3 Based on the idea that AD biomarkers become abnormal in an ordered but temporally overlapping manner,4 the preclinical phase is divided into 3 stages: stage 1, Aβ positive; stage 2, Aβ plus neurodegeneration; stage 3, Aβ plus neurodegeneration plus subtle cognitive impairment.1
In our initial study describing operationalization of the NIA-AA preclinical AD criteria,5 we found 16% of cognitively normal (CN) elderly from a population-based sample were in stage 1, 12% in stage 2, and 3% in stage 3, while 43% had no biomarker abnormalities and were designated stage 0. Notably, 23% had abnormal neurodegenerative imaging biomarkers (fluorodeoxyglucose [FDG] PET or hippocampal atrophy on MRI) but normal amyloid PET.5 We labeled this group suspected non-Alzheimer pathophysiology5 (SNAP) on the assumption that a mixture of non-AD pathophysiologies—e.g., hippocampal sclerosis, Lewy body disease, cerebrovascular disease, and medial temporal tauopathy without Aβ6–8—accounted for the neurodegenerative biomarker findings in these subjects. The SNAP group did not fit into the NIA-AA scheme, which was logical given the supposition that the neurodegeneration in SNAP was due to non-AD pathophysiologies.
The observation that such a large proportion (23%) fell into the SNAP category5 suggests a complementary way to think about biomarker classification of elderly CN subjects that parallels NIA-AA preclinical AD staging.1 If each subject is labeled positive or negative on Aβ and neurodegenerative biomarkers, then all elderly CN subjects can be divided into 4 groups: Aβ negative and neurodegeneration negative (A−N−), which corresponds to preclinical AD stage 0; amyloid negative and neurodegeneration positive (A−N+), which corresponds to SNAP; amyloid positive and neurodegeneration negative (A+N−), which corresponds to preclinical AD stage 1; and amyloid positive and neurodegeneration positive (A+N+), which corresponds to preclinical AD stages 2 and 3 (figure 1). By ignoring subtle cognitive changes and by not requiring Aβ to precede neurodegeneration in preclinical late-onset AD, this 2-feature system aligns biomarkers in preclinical AD1 with the biomarker schemes used for MCI and AD dementia in the 2011 NIA-AA criteria.1–3
Figure 1. Relating 2-feature biomarker classification to operationalized National Institute on Aging–Alzheimer's Association preclinical staging.
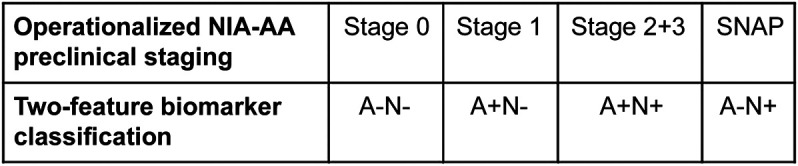
Illustration of how the operationalized National Institute on Aging–Alzheimer's Association preclinical staging criteria correspond to the 2-feature biomarker classification. SNAP = suspected non-Alzheimer pathophysiology.
In the present study, we used structural MRI alone as our biomarker for neurodegeneration, thereby avoiding the problem of how to combine up to 3 neurodegeneration biomarkers (CSF tau, atrophy, and FDG-PET hypometabolism). This also permitted us to use a single precise neurodegenerative rate of change measure—structural MRI—in our analyses. Because MRI was the only neurodegenerative biomarker in this study, the proportions of subjects in the various groups were different from those we reported in our original publication describing preclinical AD staging and SNAP,5 where both MRI and FDG-PET were used for classification of neurodegeneration.
By relating baseline imaging biomarker values to subsequent rates of change in those biomarkers, we can make inferences about possible disease mechanisms.9 Our objective was to test predictions from a hypothetical biomarker model of AD.4,10 Specifically, we tested the hypotheses that rates of Aβ accumulation are not related to hippocampal neurodegeneration whereas rates of neurodegenerative atrophy depend on the presence of both amyloid and neurodegeneration. Our approach was to compare rates of brain atrophy in an AD-signature set of regions11 (as our measure of neurodegeneration) and rates of Aβ accumulation on PET imaging among groups defined by normal or abnormal baseline Aβ and hippocampal neurodegeneration in a large sample of CN subjects from a population-based study.
METHODS
Participants.
Participants were drawn from the Mayo Clinic Study of Aging (MCSA). The MCSA is a longitudinal population-based observational study of cognitive aging that was established in Olmsted County, Minnesota, in 2004, initially enrolling subjects aged 70–90 years. Continuous replenishment results in an active cohort of about 2,000 subjects, approximately 80% of whom are classified as CN.
To be eligible for inclusion in the current study, subjects must have been classified as CN5 at the time of baseline imaging and must have had 2 or more multimodal serial imaging assessments, defined as amyloid PET and MRI obtained at the same time points. A total of 252 subjects met these criteria. The imaging studies were obtained over the period March 2006–June 2013. The median (min, max) time between first and last imaging examinations was 1.4 (1.0, 6.4) years.
Standard protocol approvals, registrations, and patient consents.
These studies were approved by the Mayo Clinic and Olmsted Medical Center Institutional Review Boards. Signed informed consent was obtained from all participants.
Amyloid PET methods.
PET images were acquired using the same PET/CT scanner. Pittsburgh compound B PET12 scans, consisting of four 5-minute dynamic frames, were acquired from 40 to 60 minutes after injection. Image analysis was done with our in-house fully automated pipeline,13 which uses MRI to guide PET region of interest (ROI) placement and to perform partial volume correction.14 An amyloid PET standardized uptake value ratio (SUVR) was formed by calculating the median uptake over voxels in the prefrontal, orbitofrontal, parietal, temporal, anterior cingulate, and posterior cingulate/precuneus ROIs and dividing the median uptake value from this meta-ROI by the median uptake over voxels in the cerebellar gray matter ROI of the atlas. Using these methods, the relative measurement error (analogous to a coefficient of variation) for serial amyloid PET is about 3%,15 indicating adequate longitudinal measurement precision. Annual change in amyloid PET was estimated by fitting a regression line using all available scans within each person. The slope of this regression line is the amyloid PET accumulation rate. Longitudinal rates in the component ROIs were each highly correlated with the rate in the meta-ROI (all p < 0.001).
MRI methods.
All subjects underwent MRI scanning at 3T with a standardized protocol that included a 3D magnetization-prepared rapid gradient echo (MPRAGE) sequence. Scans were performed on 1 of 2 scanners from the same manufacturer. Hippocampal volume at baseline was measured with FreeSurfer (v5.1) and total intracranial volume (TIV) was measured using an in-house algorithm whereby a TIV mask is propagated from template space to each subject's MPRAGE image. Each subject's raw hippocampal volume was adjusted for TIV by calculating the residual from a linear regression of hippocampal volume (y) vs TIV (x) within 278 APOE ε4-negative CN subjects (as in reference 5). Baseline subject classification for the neurodegeneration variable was based on this TIV-adjusted hippocampal volume (HVa).
Change in brain volume from the first to last scan was measured using TBMSyN16 (also see TBM-SyN Based Scores at http://www.adni-info.org). TBM-SyN is the longitudinal extension of our previously validated (through both clinical and autopsy correlation) STAND score11 method, which was developed as a single time-point measure. Within-subject change is captured by computing the log of the Jacobian determinants from a nonlinear deformation estimated using SyN,17 to align longitudinal images. The deformation is computed in both directions explicitly, and the log of the Jacobian determinants formed in each direction. These log Jacobian maps are then annualized and integrated over ROIs, and the values from the forward and reverse directions averaged together within each ROI. Atrophy rates were computed from annualized log Jacobian determinant values in our previously published AD-signature meta-ROI,11 which includes the right and left hippocampus, amygdala, entorhinal cortex, precuneus, temporal pole, ventricle, parahippocampal, fusiform, angular, superior, mid, and inferior temporal and occipital gyri. This rate was multiplied by 100 and can be interpreted as approximately the percentage change in volume for the ROIs per year; we refer to it as the AD-signature atrophy rate. This TBM-SyN method has been used to analyze approximately 4,400 Alzheimer's Disease Neuroimaging Initiative MRI examinations, which are publicly available at http://www.adni-info.org.
Both hippocampal volume and the AD-signature meta-ROI include the topography of brain atrophy that is characteristic of AD.11 We used HVa to classify subjects at baseline while the AD-signature meta-ROI, with TBM-SyN used for atrophy rate measures. Our reasoning was that hippocampal volume is a widely used and accepted biomarker in the field for classifying subjects, while there is no universal standard analogous to the AD-signature meta-ROI we employed. However, atrophy rate measures were one of the two primary outcomes in this analysis and the TBM-SyN algorithm using the AD-signature meta-ROI produces more precise rate measures than hippocampal volumes.16
Cutpoints and subject classification.
We defined the negative/positive threshold for amyloid PET scan and HVa such that 90% of an independent group of clinically diagnosed AD participants, described in our original publication describing preclinical AD staging and SNAP,5 were categorized as abnormal. Cutpoints were −0.63 HVa and 1.50 for amyloid PET SUVR. Participants were classified into 4 groups defined by the combination of abnormality for amyloid (A) and HVa (neurodegeneration, N) at baseline: A−N−, A−N+, A+N−, and A+N+.
Statistical methods.
Pairwise differences in patient characteristics among the 4 biomarker groups (A−N−, A−N+, A+N−, A+N+) were assessed using t tests and χ2 tests. We compare rates of change among the 4 groups with pairwise t tests. Since the distribution of HVa is not bimodal like amyloid PET, and consequently less suggestive of a cutpoint, we also used linear regression in a secondary analysis to assess the relationship between the baseline measures of amyloid PET and neurodegeneration (HVa) and the rates of AD-signature atrophy and amyloid PET accumulation. For each rate, we fit a linear regression model with HVa as a continuous predictor, amyloid PET as positive/negative, and the interaction between the 2 baseline measures.
RESULTS
Demographics.
A+N+ subjects were older than A−N− (p < 0.001) and A+N− subjects (p = 0.02) (table). Sex was not different among the groups. The proportion of APOE ε4 carriers was greater in A+N− compared to A−N− (p < 0.001) and A−N+ (p = 0.01) and greater in A+N+ compared to A−N− (p < 0.001) and A−N+ (p = 0.01).
Table.
Characteristics of participants

Imaging analyses.
The AD-signature atrophy rate was greater in the A+N+ group (figure 2) than the A−N− (p = 0.002), the A−N+ (p = 0.04), and the A+N− (p = 0.02) groups. There were no significant differences in AD-signature atrophy rates between the A−N−, A−N+, and A+N− groups.
Figure 2. Rates of atrophy and amyloid accumulation by 2-feature biomarker classification.

Box plots of Alzheimer disease (AD)–signature atrophy rate (A) and amyloid PET accumulation rate (B) by baseline biomarker group: amyloid negative and neurodegeneration negative (A−N−), amyloid negative and neurodegeneration positive (A−N+), amyloid positive and neurodegeneration negative (A+N−), and amyloid positive and neurodegeneration positive (A+N+). AD-signature atrophy rate is a measure of annualized log Jacobian values multiplied by 100, which can be interpreted as approximately the annualized percentage change in volume in the AD-signature regions. Amyloid PET accumulation is a measure of annual rate of change in amyloid PET in standardized uptake value ratio per year.
In contrast, the amyloid PET accumulation rate was greater in both the A+N− and A+N+ groups compared to the A−N− and A−N+ groups (p < 0.001 for all). The amyloid accumulation rate did not differ between the A−N− and A−N+ groups or between the A+N− and A+N+ groups.
In a secondary analysis, we used linear regression to assess the relationship between baseline biomarkers and rates with HVa as a continuous predictor and amyloid PET categorized as positive or negative. The results were similar to those we saw among the 4 biomarker groups. For the AD-signature atrophy rate, there was evidence (p = 0.06) of an interaction between HVa and amyloid PET such that among subjects with positive amyloid PET scans, the AD-signature atrophy rate was greater for those with more abnormal HVa levels (p = 0.002, figure 3). However, among the subjects with negative amyloid PET scans, the AD-signature atrophy rate did not differ by HVa level. For the amyloid PET accumulation rate, there was no significant interaction between baseline amyloid PET and HVa. The rate of amyloid PET accumulation was greater in those with positive amyloid PET scans compared to negative (p < 0.001) but was not different by baseline HVa (p = 0.49).
Figure 3. Rates of atrophy and amyloid accumulation by continuous total intracranial volume–adjusted hippocampal volume and amyloid PET positivity.

Scatterplots show Alzheimer disease (AD)–signature atrophy rate (A) and amyloid PET accumulation rate (B) vs baseline total intracranial volume–adjusted hippocampal volume (HVa) by amyloid PET positivity. Amyloid PET-positive subjects are represented by plus signs and amyloid PET-negative subjects by open circles. The solid line represents the mean AD-signature atrophy or amyloid PET accumulation rate by baseline HVa level for amyloid PET-positive subjects and the dashed line represents the mean rate for amyloid PET-negative subjects.
DISCUSSION
We present a way to characterize elderly CN individuals using Aβ and neurodegeneration biomarkers that is complementary to the NIA-AA preclinical staging criteria.1 Our major findings were that high rates of Aβ accumulation were found in those with abnormal Aβ at baseline and were not influenced by hippocampal neurodegeneration at baseline. In contrast, AD-signature atrophy rates increased with greater baseline neurodegenerative atrophy and were greatest when both Aβ and hippocampal neurodegeneration were present at baseline.
In relating our imaging findings to disease mechanisms, we assume that amyloid PET directly measures fibrillar Aβ deposits, which has been thoroughly documented through imaging-autopsy studies.18,19 We also assume that atrophy on MRI is a direct measure of neurodegeneration—i.e., loss of neurons or their processes.10 Multiple independent imaging-autopsy studies document that brain atrophy correlates well with both cell loss20 and tau pathology (both Braak stage and immunohistochemical measures of tau burden), but not with fibrillar Aβ deposits.21,22 However, hippocampal atrophy is not specific for AD.23 Non-AD pathologic processes common in the elderly24 also result in brain volume loss—for example, hippocampal sclerosis, ischemic cerebral vascular disease, perhaps TDP43, and medial temporal tauopathy without Aβ.23 Regarding medial temporal tauopathy, Braak and Braak6 found that 97% of autopsied subjects in their 70s have neurofibrillary tangle (NFT) stage I–II or greater. The median age in our study was 78, so we can safely assume that nearly all subjects in our study had some degree of NFT pathology at baseline. Moreover, aging in the absence of known pathologic processes may be associated with brain atrophy.25 In the absence of in vivo biomarkers of all of these etiologic processes, it is impossible to know in a given subject what proportion of hippocampal volume loss is tau-related vs due to other degenerative processes. Thus, we interpret hippocampal atrophy as a nonspecific measure that could reflect any of these age-related processes that lead to neurodegeneration, but must reflect tau-related (i.e., AD) neurodegeneration to varying degrees in all our subjects because of their age. Tau PET ligands26 will be essential to understanding the relationships between etiologically nonspecific imaging measures of neurodegeneration such as MRI and FDG-PET and the different underlying neurodegenerative processes that are common in the elderly.24
We and others have previously reported that rates of Aβ accumulation vary with an inverted U-shape when plotted against baseline amyloid level.15,27–29 This inverted U-shaped rate vs baseline amyloid plot (after integration with respect to time) gives a sigmoid shape to a plot of amyloid load vs time, as was predicted hypothetically.4 This same finding was present in the amyloid PET data in this study; however, in the present study we focus on interrelationships among amyloid accumulation and atrophy rates.
Several groups have shown that atrophy rates are higher in Aβ-positive than amyloid-negative CN subjects.30,31 This observation has been refined to show that high rates of entorhinal cortex atrophy depend on the presence of both abnormal CSF phospho-tau and CSF Aβ 42 in CN and MCI subjects.32 High hippocampal atrophy rates depend on the presence of both abnormal amyloid PET and either FDG hypometabolism or hippocampal atrophy.33 Whereas in the present study we show that atrophy rates depend on the presence of both abnormal amyloid PET and hippocampal neurodegeneration, we also compared the rates of amyloid and neurodegeneration within the same subjects, which allows for more comprehensive inferences about possible disease mechanisms. As discussed in reference 9, we assume that a baseline variable that is associated with a subsequent rate is consistent with, though does not prove, a cause and effect relationship. In contrast, lack of an association between a baseline variable and a subsequent rate is consistent with absence of a cause and effect relationship.
The amyloid cascade hypothesis34 assumes serial causal events with Aβ aggregation causing tau aggregation and hyperphosphorylation and other downstream pathologic processes that eventually lead to clinical symptoms. Variations on the amyloid cascade hypothesis for late-onset AD have been proposed that share the common theme that Aβ and tau are initiated independently but interact with pathogenic synergy.35–37
We do not know the long-term clinical or pathologic outcomes of the subjects in our study at this time; however, preclinical biomarker behavior in our subjects supports some of the key features of a biomarker model of late-onset AD described by some of us.4,10 (We specify late-onset AD here because antecedent medial temporal tauopathy without Aβ is likely not a typical feature of autosomal dominant AD nor perhaps AD in APOE ε4 homozygotes.) The pathophysiologic underpinnings of this biomarker model are summarized as follows. Brainstem and medial temporal NFT first appear (in most people by late middle age but often younger38) in individuals who do not have Aβ plaques at that time. Amyloid plaques arise later and independently from medial temporal tauopathy. Through unknown mechanisms, aggregated Aβ catalyzes the acceleration of antecedent medial temporal tauopathy leading to neocortical spread of NFT, as initially proposed in reference 7. This may occur by cell-to-cell transmission.39 The clinical phases of the disease are characterized by plateauing of Aβ accumulation40 while tau-related neurodegeneration continues to proceed. Clinical symptoms are attributable to neurodegeneration, not to a direct local toxic effect of Aβ.40 Note that this model does not contradict the amyloid cascade hypothesis in the sense that Aβ catalyzes tauopathy, not the reverse. The temporal evolution of biomarker changes in the model reflects the supposition that while clinical symptoms are attributable to tau-related neurodegeneration, Aβ is the upstream driver of this process.
Data in the present study support 2 key aspects of this late-onset AD model.4,10 First, rates of Aβ accumulation were not influenced by hippocampal neurodegeneration at baseline. Thus, to the extent that hippocampal atrophy at baseline reflects tau-related neurodegeneration, our data support the concept that the rate of Aβ accumulation is biologically independent from tau-related neurodegeneration. Second, we found that AD-signature atrophy rates were elevated only in participants with evidence of both Aβ and hippocampal atrophy at baseline. We can assume that nearly all our subjects had some medial temporal tauopathy at baseline6; therefore, to the extent that hippocampal atrophy reflects tau-related neurodegeneration, our data support the concept that Aβ pathophysiology accelerates tau-related neurodegeneration. Furthermore, our AD-signature meta-ROI included areas outside the medial temporal lobe, thus supporting the notion that Aβ may enhance spread of tau-related neurodegeneration from allocortex to association neocortex.7
Supplementary Material
GLOSSARY
- Aβ
β-amyloid
- AD
Alzheimer disease
- CN
cognitively normal
- FDG
fluorodeoxyglucose
- HVa
total intracranial volume–adjusted hippocampal volume
- MCI
mild cognitive impairment
- MCSA
Mayo Clinic Study of Aging
- MPRAGE
magnetization-prepared rapid gradient echo
- NFT
neurofibrillary tangle
- NIA-AA
National Institute on Aging–Alzheimer's Association
- ROI
region of interest
- SNAP
suspected non-Alzheimer pathophysiology
- SUVR
standardized uptake value ratio
- TIV
total intracranial volume
Footnotes
Editorial, page 1576
AUTHOR CONTRIBUTIONS
Clifford Jack: drafting/revising the manuscript, study concept or design, analysis or interpretation of data, accepts responsibility for conduct of research and final approval, contribution of vital reagents/tools/patients, acquisition of data, statistical analysis, study supervision, obtaining funding. Heather Wiste: drafting/revising the manuscript, analysis or interpretation of data, accepts responsibility for conduct of research and final approval, statistical analysis. David S. Knopman: drafting/revising the manuscript, analysis or interpretation of data, accepts responsibility for conduct of research and final approval, acquisition of data. Prashanthi Vemuri: drafting/revising the manuscript, analysis or interpretation of data, accepts responsibility for conduct of research and final approval. Michelle Mielke: drafting/revising the manuscript, analysis or interpretation of data, accepts responsibility for conduct of research and final approval. Stephen Weigand: drafting/revising the manuscript, analysis or interpretation of data, accepts responsibility for conduct of research and final approval, statistical analysis. Matthew L. Senjem: drafting/revising the manuscript, analysis or interpretation of data, accepts responsibility for conduct of research and final approval, contribution of vital reagents/tools/patients. Jeffrey L. Gunter: drafting/revising the manuscript, analysis or interpretation of data, accepts responsibility for conduct of research and final approval, statistical analysis. Val Lowe: drafting/revising the manuscript, study concept or design, analysis or interpretation of data, accepts responsibility for conduct of research and final approval, acquisition of data, study supervision, obtaining funding. Brian Gregg: analysis or interpretation of data, accepts responsibility for conduct of research and final approval. Vernon Pankratz: drafting/revising the manuscript, analysis or interpretation of data, accepts responsibility for conduct of research and final approval, statistical analysis. Ronald C. Petersen: drafting/revising the manuscript, accepts responsibility for conduct of research and final approval, obtaining funding.
STUDY FUNDING
Provided by the National Institutes on Aging (R01 AG011378, AG04185, UO1AG06786) and the Alexander family professorship in Alzheimer's disease research.
DISCLOSURE
C. Jack receives research funding from the NIH (R01-AG011378, RO1-AG037551, U01-HL096917, U01-AG032438, U01-AG024904) and the Alexander Family Alzheimer's Disease Research Professorship of the Mayo Foundation Family. H. Wiste reports no disclosures relevant to the manuscript. D. Knopman serves as Deputy Editor for Neurology®, serves on a Data Safety Monitoring Board for Lilly Pharmaceuticals, is an investigator in clinical trials sponsored by Janssen Pharmaceuticals, and receives research support from the NIH. P. Vemuri, M. Mielke, S. Weigand, M. Senjem, and J. Gunter report no disclosures relevant to the manuscript. V. Lowe serves on scientific advisory boards for Bayer Schering Pharma and GE Healthcare and receives research support from GE Healthcare, Siemens Molecular Imaging, the NIH (NIA, NCI), the MN Partnership for Biotechnology and Medical Genomics, and the Leukemia & Lymphoma Society. B. Gregg reports no disclosures relevant to the manuscript. V. Pankratz is funded by the NIH (R01AG040042, U01AG06786, Mayo Clinic Alzheimer's Disease Research Center/Core C P50AG16574/Core C, and R01AG32990). R. Petersen reports receiving consulting fees from Elan Pharmaceuticals and GE Healthcare, receiving royalties from Oxford University Press, and serving as chair of data monitoring committees for Pfizer and Janssen Alzheimer Immunotherapy, and receives research support from the NIH/NIA. Go to Neurology.org for full disclosures.
REFERENCES
- 1.Sperling RA, Aisen PS, Beckett LA, et al. Toward defining the preclinical stages of Alzheimer's disease: recommendations from the National Institute on Aging-Alzheimer's Association workgroups on diagnostic guidelines for Alzheimer's disease. Alzheimers Dement 2011;7:280–292. [DOI] [PMC free article] [PubMed] [Google Scholar]
- 2.Albert MS, DeKosky ST, Dickson D, et al. The diagnosis of mild cognitive impairment due to Alzheimer's disease: recommendations from the National Institute on Aging and Alzheimer's Association Workgroup. Alzheimers Dement 2011;7:270–279. [DOI] [PMC free article] [PubMed] [Google Scholar]
- 3.McKhann GM, Knopman DS, Chertkow H, et al. The diagnosis of dementia due to Alzheimer's disease: recommendations from the National Institute on Aging and the Alzheimer's Association Workgroup. Alzheimers Dement 2011;7:263–269. [DOI] [PMC free article] [PubMed] [Google Scholar]
- 4.Jack CR, Jr, Knopman DS, Jagust WJ, et al. Hypothetical model of dynamic biomarkers of the Alzheimer's pathological cascade. Lancet Neurol 2010;9:119–128. [DOI] [PMC free article] [PubMed] [Google Scholar]
- 5.Jack CR, Jr, Knopman DS, Weigand SD, et al. An operational approach to NIA-AA criteria for preclinical Alzheimer's disease. Ann Neurol 2012;71:765–775. [DOI] [PMC free article] [PubMed] [Google Scholar]
- 6.Braak H, Braak E. Frequency of stages of Alzheimer-related lesions in different age categories. Neurobiol Aging 1997;18:351–357. [DOI] [PubMed] [Google Scholar]
- 7.Price JL, Morris JC. Tangles and plaques in nondemented aging and “preclinical” Alzheimer's disease. Ann Neurol 1999;45:358–368. [DOI] [PubMed] [Google Scholar]
- 8.Haroutunian V, Purohit DP, Perl DP, et al. Neurofibrillary tangles in nondemented elderly subjects and mild Alzheimer disease. Arch Neurol 1999;56:713–718. [DOI] [PubMed] [Google Scholar]
- 9.Villain N, Fouquet M, Baron JC, et al. Sequential relationships between grey matter and white matter atrophy and brain metabolic abnormalities in early Alzheimer's disease. Brain 2010;133:3301–3314. [DOI] [PMC free article] [PubMed] [Google Scholar]
- 10.Jack CR, Jr, Knopman DS, Jagust WJ, et al. Tracking pathophysiological processes in Alzheimer's disease: an updated hypothetical model of dynamic biomarkers. Lancet Neurol 2013;12:207–216. [DOI] [PMC free article] [PubMed] [Google Scholar]
- 11.Vemuri P, Whitwell JL, Kantarci K, et al. Antemortem MRI based STructural Abnormality iNDex (STAND)-scores correlate with postmortem Braak neurofibrillary tangle stage. Neuroimage 2008;42:559–567. [DOI] [PMC free article] [PubMed] [Google Scholar]
- 12.Klunk WE, Engler H, Nordberg A, et al. Imaging brain amyloid in Alzheimer's disease with Pittsburgh compound-B. Ann Neurol 2004;55:306–319. [DOI] [PubMed] [Google Scholar]
- 13.Senjem ML, Gunter JL, Shiung MM, Petersen RC, Jack CR, Jr. Comparison of different methodological implementations of voxel-based morphometry in neurodegenerative disease. Neuroimage 2005;26:600–608. [DOI] [PMC free article] [PubMed] [Google Scholar]
- 14.Jack CR, Jr, Lowe VJ, Senjem ML, et al. 11C PiB and structural MRI provide complementary information in imaging of Alzheimer's disease and amnestic mild cognitive impairment. Brain 2008;131:665–680. [DOI] [PMC free article] [PubMed] [Google Scholar]
- 15.Jack CR, Jr, Wiste HJ, Lesnick TG, et al. Brain beta-amyloid load approaches a plateau. Neurology 2013;80:890–896. [DOI] [PMC free article] [PubMed] [Google Scholar]
- 16.Gunter JL, Senjem ML, Vemuri P, Jack CR. Comparison of mask-based differences, boundary shift integral and symmetric normalization Jacobian integration. Presented at MICCAI, October 5, 2012, Nice, France.
- 17.Avants BB, Epstein CL, Grossman M, Gee JC. Symmetric diffeomorphic image registration with cross-correlation: evaluating automated labeling of elderly and neurodegenerative brain. Med Image Anal 2008;12:26–41. [DOI] [PMC free article] [PubMed] [Google Scholar]
- 18.Ikonomovic MD, Klunk WE, Abrahamson EE, et al. Post-mortem correlates of in vivo PiB-PET amyloid imaging in a typical case of Alzheimer's disease. Brain 2008;131:1630–1645. [DOI] [PMC free article] [PubMed] [Google Scholar]
- 19.Sojkova J, Driscoll I, Iacono D, et al. In vivo fibrillar beta-amyloid detected using [11C] PiB positron emission tomography and neuropathologic assessment in older adults. Arch Neurol 2011;68:232–240. [DOI] [PMC free article] [PubMed] [Google Scholar]
- 20.Bobinski M, de Leon MJ, Wegiel J, et al. The histological validation of post mortem magnetic resonance imaging-determined hippocampal volume in Alzheimer's disease. Neuroscience 2000;95:721–725. [DOI] [PubMed] [Google Scholar]
- 21.Whitwell JL, Josephs KA, Murray ME, et al. MRI correlates of neurofibrillary tangle pathology at autopsy: a voxel-based morphometry study. Neurology 2008;71:743–749. [DOI] [PMC free article] [PubMed] [Google Scholar]
- 22.Josephs KA, Whitwell JL, Ahmed Z, et al. Beta-amyloid burden is not associated with rates of brain atrophy. Ann Neurol 2008;63:204–212. [DOI] [PMC free article] [PubMed] [Google Scholar]
- 23.Jack CR, Jr, Dickson DW, Parisi JE, et al. Antemortem MRI findings correlate with hippocampal neuropathology in typical aging and dementia. Neurology 2002;58:750–757. [DOI] [PMC free article] [PubMed] [Google Scholar]
- 24.Sonnen JA, Santa Cruz K, Hemmy LS, et al. Ecology of the aging human brain. Arch Neurol 2011;68:1049–1056. [DOI] [PMC free article] [PubMed] [Google Scholar]
- 25.Jagust W. Vulnerable neural systems and the borderland of brain aging and neurodegeneration. Neuron 2013;77:219–234. [DOI] [PMC free article] [PubMed] [Google Scholar]
- 26.Chien DT, Bahri S, Szardenings AK, et al. Early clinical PET imaging results with the novel PHF-tau Radioligand [F-18]-T807. J Alzheimers Dis 2013;34:457–468. [DOI] [PubMed] [Google Scholar]
- 27.Villain N, Chetelat G, Grassiot B, et al. Regional dynamics of amyloid-beta deposition in healthy elderly, mild cognitive impairment and Alzheimer's disease: a voxelwise PiB-PET longitudinal study. Brain 2012;135:2126–2139. [DOI] [PubMed] [Google Scholar]
- 28.Villemagne VL, Burnham S, Bourgeat P, et al. Amyloid beta deposition, neurodegeneration, and cognitive decline in sporadic Alzheimer's disease: a prospective cohort study. Lancet Neurol 2013;12:357–367. [DOI] [PubMed] [Google Scholar]
- 29.Jack CR, Jr, Vemuri P, Wiste HJ, et al. Shapes of the Trajectories of 5 major biomarkers of Alzheimer disease. Arch Neurol 2012;69:856–867. [DOI] [PMC free article] [PubMed] [Google Scholar]
- 30.Schott JM, Bartlett JW, Fox NC, Barnes J. Increased brain atrophy rates in cognitively normal older adults with low cerebrospinal fluid Abeta1-42. Ann Neurol 2010;68:825–834. [DOI] [PubMed] [Google Scholar]
- 31.Chetelat G, Landeau B, Eustache F, et al. Using voxel-based morphometry to map the structural changes associated with rapid conversion in MCI: a longitudinal MRI study. Neuroimage 2005;27:934–946. [DOI] [PubMed] [Google Scholar]
- 32.Desikan RS, McEvoy LK, Thompson WK, et al. Amyloid-beta associated volume loss occurs only in the presence of phospho-tau. Ann Neurol 2011;70:657–661. [DOI] [PMC free article] [PubMed] [Google Scholar]
- 33.Knopman DS, Jack CR, Jr, Wiste HJ, et al. Selective worsening of brain injury biomarker abnormalities in cognitively normal elderly persons with beta-amyloidosis. JAMA Neurol 2013;70:1030–1038. [DOI] [PMC free article] [PubMed] [Google Scholar]
- 34.Hardy J, Selkoe DJ. The amyloid hypothesis of Alzheimer's disease: progress and problems on the road to therapeutics. Science 2002;297:353–356. [DOI] [PubMed] [Google Scholar]
- 35.Small SA, Duff K. Linking Abeta and tau in late-onset Alzheimer's disease: a dual pathway hypothesis. Neuron 2008;60:534–542. [DOI] [PMC free article] [PubMed] [Google Scholar]
- 36.Chetelat G. Alzheimer disease: Abeta-independent processes-rethinking preclinical AD. Nat Rev Neurol 2013;9:123–124. [DOI] [PMC free article] [PubMed] [Google Scholar]
- 37.Knopman DS, Jack CR, Jr, Wiste HJ, et al. Brain injury biomarkers are not dependent on beta-amyloid in normal elderly. Ann Neurol 2013;73:472–480. [DOI] [PMC free article] [PubMed] [Google Scholar]
- 38.Braak H, Del Tredici K. The pathological process underlying Alzheimer's disease in individuals under thirty. Acta Neuropathol 2011;121:171–181. [DOI] [PubMed] [Google Scholar]
- 39.Liu L, Drouet V, Wu JW, et al. Trans-synaptic spread of tau pathology in vivo. PLoS One 2012;7:e31302. [DOI] [PMC free article] [PubMed] [Google Scholar]
- 40.Jack CR, Jr, Lowe VJ, Weigand SD, et al. Serial PIB and MRI in normal, mild cognitive impairment and Alzheimer's disease: implications for sequence of pathological events in Alzheimer's disease. Brain 2009;132:1355–1365. [DOI] [PMC free article] [PubMed] [Google Scholar]
Associated Data
This section collects any data citations, data availability statements, or supplementary materials included in this article.