

Abstract
Paclitaxel (PTX) has shown encouraging activity in the treatment of advanced gastric cancer (GC). However, the fact that more than half of GC patients respond poorly to PTX-based chemotherapies demonstrates the urgent need for biomarkers of PTX sensitivity in GC patients. In the present work, three GC cell lines (BGC-823, HGC-27 and NCI-N87) with different sensitivities to PTX were subjected to DNA microarray analysis. The significantly differentially expressed genes and microRNAs (miRs) were identified and pathway signatures for PTX sensitivity were proposed. Ingenuity Pathway Analysis results showed that the differentially expressed genes were mainly enriched in the ErbB signaling pathway and other pathways. Additionally, the AKT/ERK signaling pathway, which is the pathway downstream of ErbB, was predicted to be active in PTX-resistant GC cell lines. ErbB3 overexpression and AKT/ERK activation in PTX-resistant cell lines were validated, respectively, by quantitative PCR and immunoblotting. Furthermore, 10 miRs were dramatically differently expressed in the three GC cell lines, and a miR-gene network was constructed from these data. Our work uncovered a reliable signature for PTX sensitivity in GC and potential therapeutic targets for GC treatments.
Keywords: Gastric cancer, paclitaxel, DNA microarray, ErbB signaling, AKT signaling, ERK signaling, microRNA
Introduction
Gastric cancer (GC) is one of the most common human cancers and ranks second in global cancer-related mortality. The clinical outcome of patients with advanced gastric cancer (AGC) is markedly dependent on their response to chemotherapy. Paclitaxel (PTX), one of the most promising cytotoxic agents in clinical use, has shown encouraging activity in various studies as a single agent or as part of combination regimens in the treatment of advanced gastric cancer. PTX in combination with capecitabine is the first-line chemotherapy for AGC in China, although the overall response rate (ORR) is below 50% [1]. In phase 2 trials, PTX plus 5’-deoxy-5-fluorouridine (5’-DFUR) or S-1 generates an ORR of 40.5-46.3% for unresectable or recurrent GC [2,3]. When used alone as a second-line therapy for docetaxel-refractory AGC patients, PTX generates an ORR of 12.5-14.2% [4,5]. Furthermore, PTX also has antitumor activity against local AGC in adjuvant or neoadjuvant chemotherapy [6-8]. Collectively, more than half of AGC patients respond poorly to PTX-based chemotherapies, demonstrating the need for uncovering biomarkers for PTX in GC cells.
Previous studies have proposed that dozens of genes and several microRNAs (miRs) are associated with the sensitivity of GC cells to PTX. The most exceptional associated gene is Class III beta-tubulin (TUBB3) [9-12]. PI3K/AKT/mTOR signaling [13,14], NF-κB signaling [15,16], SRC [17], FGFR2 [18], VEGFR2 [19], HBEGF [20] and CHK2 [21] are also all related to PTX sensitivity. Moreover, miR-27a [22], miR-23a [23] and miR-34c-5p [24] are suggested to regulate the sensitivity of cancer cells to PTX. However, a systematic evaluation of these biomarkers in GC patients remains challenging, and it is of great interest to investigate putative biomarkers in vitro in GC cell lines.
In the present work, three GC cell lines with different sensitivities to PTX were subjected to DNA microarray analysis. The differently expressed genes and miRs were identified and pathway signatures for PTX sensitivity were proposed.
Materials and methods
Cell culture
BGC-823, HGC-27 and NCI-N87 cell lines were purchased from ATCC and maintained in DMEM or RPMI 1640 medium supplemented with 10% FBS (Hyclone), penicillin (100 IU/ml) and streptomycin (100 μg/ml) (Life Technologies). Cells in the exponential growth phase were used for all experiments.
MTS assay of cell line viability
Cells (4×10³ per well) were cultured in 100 ml DMEM or RPMI 1640 medium containing serum in a 96-well plate. After 24 h, the cells were treated with PTX (0.001, 0.0032, 0.01, 0.032, 0.10, 0.32, or 1.00 μmol/L) for 72 h. Each treatment was assayed in triplicate in the same experiment. Then, 20 μl of MTS (CellTiter 96 AQueous One Solution Reagent; Promega) was added to each well for 2 h at 37°C. After incubation, the absorbance was read at 490 nm according to the manufacturer’s protocol. The IC50 calculation was performed with GraphPad Prism 5.0 software.
Microarray analysis
Three cell lines (8×10⁴ per well) were grown in 2 ml of DMEM medium containing serum per well in a 6-well plate in duplicate. All of the samples were homogenized in 1 ml Trizol (Invitrogen, Life Technologies), and total RNAs were extracted according to the manufacturer’s instructions.
Total RNA (500 ng) was used to synthesize double-stranded cDNA, which was transcribed in vitro to cRNA. Purified cRNA (10 μg) was used to synthesize 2nd-cycle cDNA, which was then hydrolyzed with RNase H and purified. The above steps were performed with the Ambion WT Expression Kit. Second-cycle cDNA (5.5 μg) was fragmented, and the single-stranded cDNA was labeled with the GeneChip2 WT Terminal Labeling Kit and Controls Kit (Affymetrix, PN 702880). Approximately 700 ng of fragmented and labeled single-stranded cDNA was hybridized to an Affymetrix GeneChip Human Gene 1.0 ST array, which was washed and stained with the GeneChip2 Hybridization, Wash and Stain kit (Affymetrix).
Microarray data analysis was performed using the Significance Analysis of Microarrays (SAM) method, as previously described before [25]. Functional annotation of the differentially expression genes was performed with Ingenuity Pathway Analysis (IPA) online software.
Quantitative real-time PCR (qPCR)
Total RNA isolated as above was synthesized into cDNA using the PrimeScript RT reagent kit with gDNA Eraser (Takara, RR074A) for RT-PCR using a mixture of oligo-dT and random primers (9-mer). The primers used for qPCR validation are listed in Table 1. Real-time qPCR was performed with CFX-96 (Bio-lab), using hActb as the endogenous control. Gene expression was calculated relative to expression of the hActb endogenous control and was adjusted relative to expression in BGC-823 cells.
Table 1.
Primers used for qPCR validation
| GENE | Forward | Reverse |
|---|---|---|
| Actb | CACCATGTACCCTGGCATT | GTACTTGCGCTCAGGAGGAG |
| ICAM1 | CCTCCCCACCCACATACATTT | GTCCAGACATGACCGCTGAGT |
| KSR1 | GCAAGCATTGCAGGTTGAAG | CCTCCGAAGCCGAGTTAGTG |
| MMP2 | CGGCGGTCACAGCTACTTC | TTCACGCTCTTCAGACTTTGGTT |
| IL12B | ACCATCCAAGTCAAAGAGTTTGG | AGGAGCGAATGGCTTAGAACCT |
| MYC | GGCGAACACACAACGTCTTG | TGGTCACGCAGGGCAAA |
| ADCY7 | CACACTACTGCCCTTCAGCA | AAGCCTCCCATCAAAGAACC |
| TAF2 | AGAGCCCGCCAGAATGAAC | GCAGACGACCTGATGGGTTAAT |
| TGFB1 | AATTGAGGGCTTTCGCCTTAG | TGAACCCGTTGATGTCCACTT |
| PRKCH | CTGGACCCCTATCTGACGGT | TGTACGTGGGTTTGTTGGTCT |
| ERBB3 | GTCATGAGGGCGAACGAC | AGAGTCCCAGGACACACTGC |
Protein isolation and western blotting
Cell pellets were resuspended in 1× SDS loading buffer (1 mmol/L Na3VO4, 10 mmol/L NaF, 1 mmol/L PMSF) containing protease inhibitors. Lysates (20 μg each lane) were run on SDS-PAGE. Immunoblotting with antibodies specific for GAPDH (Abmart, 080922), AKT (Santa Cruz, sc-8312), p-AKT (Santa Cruz, SC-7985-R, pS473), ERK (Abclonal, A0228) and p-ERK (Cell Signaling, #9106S, pT202/204) were detected using HRP-conjugated anti-mouse (Promega) or anti-rabbit (Promega) antibodies and visualized using a chemiluminescence detection system (Millipore, WBKLS0500).
miR target prediction and miRNA target correlation
miR target prediction was performed with miRWalk online software. Comparative analysis was performed with 5 prediction programs: miRanda, miRDB, miRWalk, RNA22 and TargetScan. miR target prediction was performed on 10 miRs. Genes predicted by at least 3 programs were selected as putative downstream targets of the candidate miR. The predicted target genes of miRs with increased expression were compared to genes with decreased expression as assessed by microarray; accordingly, the predicted target genes for miRs with decreased expression were compared to genes with increased expression. The overlapping genes were used to construct miR-gene networks using Cytoscape 2.8 software.
Results
Three GC cell lines exhibit different sensitivity to PTX
The GC cell lines BGC-823, HGC-27 and NCI-N87 were treated with 7 concentrations of PTX (0.001, 0.0032, 0.01, 0.032, 0.10, 0.32, or 1.00 μmol/L) or were untreated for 72 h. Cell viability was detected using the MTS assay, and the relative IC50 was calculated (Figure 1). The IC50 doses to PTX for BGC-823, HGC-27 and NCI-N87 at 72 h were 10, 48 and 124 nmol/L, respectively. The BGC-823 cell line is relatively sensitive to PTX, whereas the HGC-27 cell line is moderately sensitive to PTX. The bottom of the survival curve for the NCI-N87 cell line was approximately 40%, indicating that the NCI-N87 cell line is resistant to PTX.
Figure 1.
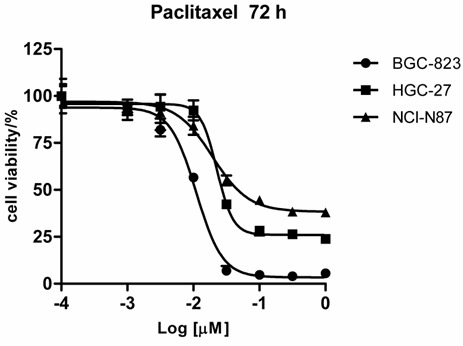
Three GC cell lines exhibited different sensitivity to PTX. BGC-823, HGC-27 and NCI-N87 cells were treated with 7 different concentrations of PTX or were untreated for 72 h. Cell viability was determined using an MTS assay, and the survival curve was plotted.
DNA microarray analysis: mRNA and miR expression profiles
The basal gene expression of the 3 GC cell lines was investigated by DNA microarray, and the differences in expression pattern were analyzed between these GC cell lines. The expression of 68 genes (e.g. MAP2K1, NRG1) increased, and the expression of 55 genes (e.g. BCL2L11, ADCY7) decreased by more than 50% in BGC-823 compared to HGC-27 and in HGC-27 compared to NCI-N87.
The 123 identified genes (68 upregulated genes and 55 downregulated genes) were examined using Ingenuity Pathway Analysis (IPA). The IPA results showed that the differently expressed genes were enriched for ErbB signaling, GNRH signaling, ErbB4 signaling and some additional pathways (Figure 2A). ErbB signaling was predicted to be activated in the PTX-resistant NCI-N87 cell line (Figure 2B), mainly based on the upregulation of MAP2K1 (MEK1) and NRG1; therefore downstream ERK and AKT/mTOR/p70S6K signaling was predicted to be activated.
Figure 2.

Ingenuity Pathway Analysis. A: The most significant canonical pathways in which differently expressed genes were enriched. The 123 genes identified as differenty expressed (expression difference >1.5-fold) were examined using Ingenuity Pathway analysis (IPA) software, and the most significant canonical pathways are shown. B: The predicted increase in ErbB signaling in the PTX-resistant GC cell line is shown. The prediction was based on the expression of associated genes assessed using the DNA microarray data. The orange circle and arrow represent “induce”, and the blue circle and arrow represent “inhibit”.
Concurrently, the miR expression between the 3 GC cell lines was investigated using miR expression chips. The expression of 10 miRs was more than 50% higher in BGC-823 compared to HGC-27 and in HGC-27 compared to NCI-N87. Among these miRs, 7 (miR-224, miR-424-3p, miR-130a, miR-224-star, miR-452, miR-181a-2-star, and miR-193b-5p) were downregulated in the PTX-resistant GC cell line, whereas the other 3 miRs (miR-3127-5p, miR-1287, and miR-4713-5p) were upregulated in the PTX-resistant GC cell line compared to the PTX-sensitive GC cell line (Table 2).
Table 2.
The top 10 expression-altered miRs between 3 GC cell lines
| miR | HGC27 vs BGC823 | NCI-N87 vs HGC27 | ||
|---|---|---|---|---|
|
| ||||
| Fold change | P value | Fold change | P value | |
| miR-224 | 0.16 | 0.001 | 0.03 | 0.001 |
| miR-424-star | 0.40 | 0.03 | 0.01 | 0.001 |
| miR-130a | 0.48 | 0.04 | 0.02 | 0.001 |
| miR-224-star | 0.18 | 0.005 | 0.04 | 0.002 |
| miR-452 | 0.18 | 0.02 | 0.07 | 0.002 |
| miR-181a-2-star | 0.21 | 0.01 | 0.28 | 0.02 |
| miR-193b-star | 0.20 | 0.02 | 0.30 | 0.03 |
| miR-3127-5p | 1.65 | 0.03 | 3.74 | 0.01 |
| miR-1287 | 2.77 | 0.01 | 2.62 | 0.03 |
| miR-4713-5p | 2.36 | 0.03 | 1.67 | 0.24 |
qPCR validation of DNA microarray data
To further analyze the differences in gene expression, qPCR was perform on 10 genes from BGC-823 and NCI-N87 to validate the DNA microarray data. The expression fold change in NCI-N87 compared to BGC-823 was log2 transformed and plotted (Figure 3). The fold change varied between qPCR and microarray data; however, the trend in the expression of most of the genes between the microarray dataset and the qPCR dataset was consistent except for 3 genes. MMP2, IL12B and MYC were downregulated in the PTX-resistant NCI-N87 cell line in microarray data, whereas the qPCR data showed that these 3 genes were upregulated in NCI-N87 cells. These results suggested that although DNA microarray data can be used to systematically screen for candidate genes, the expression changes to observed genes requires further validation when using microarray data for functional annotation.
Figure 3.
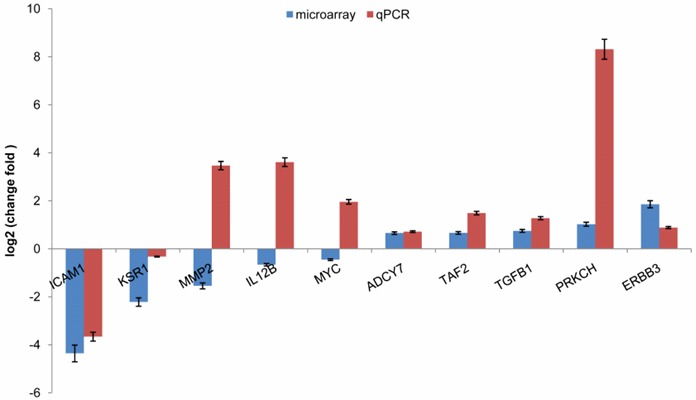
qPCR validation of microarray data. The expression fold change of genes in a PTX-resistant GC cell line (NCI-N87) was calculated relative to a PTX-sensitive cell line (BGC-823). The error bar represents the standard deviation (SD). The fold change was log2 transformed such that a gene with a value of log2 (fold change) larger than zero was highly expressed in the PTX-resistant GC cell line.
AKT/ERK signaling was active in the PTX-resistant GC cell line
Because the IPA results indicated that AKT/ERK signaling was active in the PTX-resistant GC cell line, the status of AKT/ERK signaling was examined by immunoblotting (Figure 4). BGC-823, the PTX-sensitive cell line, has decreased levels of phosphorylated AKT and ERK signaling. HGC-27, the PTX-moderately sensitive cell line, has higher levels of phosphorylated AKT but ERK signaling is not active. NCI-N87, the PTX-resistant cell line, has higher levels of phosphorylated AKT and active ERK signaling. Overall, AKT/ERK signaling was active in the PTX-resistant GC cell line, which in cancer cells might cause resistance to PTX.
Figure 4.
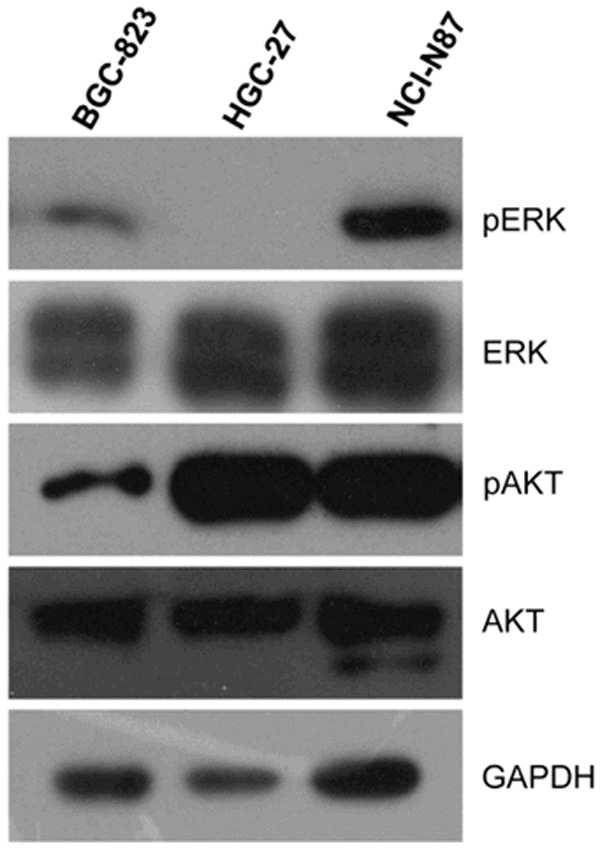
Immunoblotting of AKT/ERK for three GC cell lines. Total proteins from BGC-823, HGC-27 and NCI-N87 cells were subjected to SDS-PAGE and blotted onto a PVDF membrane. The protein expression levels of AKT, p-AKT, ERK and p-ERK were examined.
miR-gene network construction
miRs regulate gene expression transcriptionally or post-transcriptionally [26]. A large number of miRs and mRNAs were expressed differently in the GC cell lines. We speculated that the altered expression of some of the genes in the GC cell lines was caused by changes in miR expression. To address this possibility, a network between the differentially expressed miRs and mRNAs in the GC cell lines was constructed. The 10 significantly differentially expressed miRs were selected, and their downstream targets were predicted using the online software miRWalk (http://www.umm.uni-heidelberg.de/apps/zmf/mirwalk/). The predicted miR targets were compared to the differently expressed genes. Overlapping genes might be putative targets of the selected miRs. Then, a network was constructed using Cytoscape 2.8. The results showed that the network contains 6 miRs and 33 genes (Figure 5).
Figure 5.
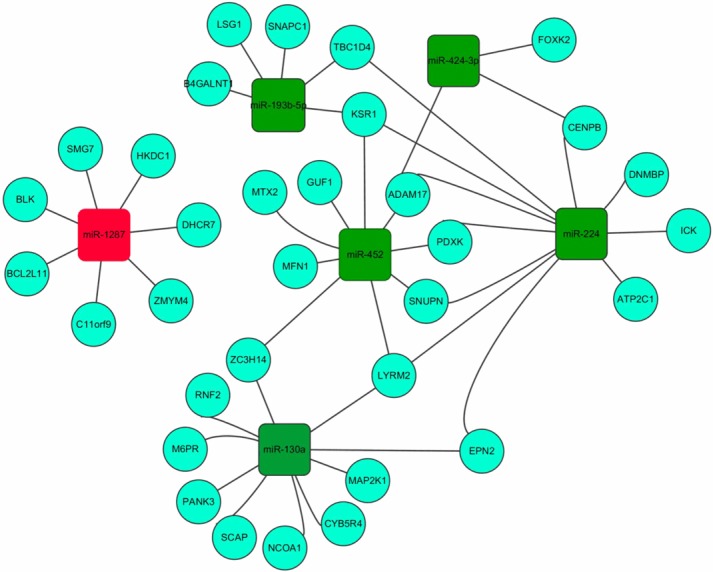
MiR-gene network. The 10 miRs with the most significantly changes in gene expression were examined with miRWalk online software to predict the downstream putative target genes. The identified targets were compared to the genes with altered expression (68 with increased expression and 55 with decreased expression in the PTX-resistant cell line) determined by microarray. The overlapping genes were considered potential downstream targets and used to construct the miR-gene network using Cytoscape 2.8 software. The red square represents the miRs with increased expression, and the green squares represent the miRs with decreased expression. The circle represents the gene; the gray line represents the regulation of the gene by miRs.
Discussion
PTX has been widely used in the clinical treatment of various cancers, including gastric cancer. However, more than half of GC patients do not respond to PTX-based chemotherapies. This demonstrates the urgent need for biomarkers of PTX sensitivity in GC patients.
In our work, three GC cell lines, BGC-823, HGC-27 and NCI-N87, display significantly different sensitivities to PTX. In theory, the different sensitivity to PTX should be caused by the different basal expression of some genes. Hence, DNA microarray analysis performed on these GC cell line, and differently expressed genes and miRs were identified based on sensitivity to PTX. The expression of 68 genes increased, and the expression of 55 genes decreased more than 50% in BGC-823 compared to HGC-27 and in HGC-27 compared to NCI-N87.
Of the 123 identified genes, IPA found that many were involved in ErbB signaling, GNRH signaling and other signaling pathways. The HER2 protein (p185, HER2/neu, ErbB-2) is a 185-kDa transmembrane tyrosine kinase (TK) receptor and a member of the epidermal growth factor receptors (EGFR) family. Recent studies propose a role for HER2 in the development of numerous types of human cancer. HER2 overexpression and/or amplification have been detected in various cancers, including gastric cancer. HER2 overexpression/amplification is observed in 5-25% of GC cases [27] and solidly correlates to the poor outcomes and a more aggressive disease in GC [28], suggesting that this gene might serve as a new prognostic factor and novel therapeutic target. In the three GC cell lines used in this work, NCI-N87 is a HER2-amplified GC cell line [29], whereas HGC-27 harbors mutations in PIK3CA and TP53, and an inactivated PTEN gene [30,31]. BGC-823 has mutations in TP53 [31]. Previous studies suggest that EGFR/ErbB3 mutation or over-expression causes cancer cell resistance to PTX [32-34]. It is known that HER2 does not bind to any known ligand but prefers to heterodimerize with other HER family members, mainly EGFR and ErbB3. In our data, HER2-amplified NCI-N87 showes high levels of ErbB3 expression, which was validated by qPCR. It has been reported that transient induction of ErbB3 expression activates AKT and inhibits paclitaxel-induced apoptosis in ErbB2-overexpressing breast cancer cells [34]. Therefore, it seems likely that activation of the ErbB signaling pathway rather than a single ErbB protein causes cancer cell resistance to chemotherapy. Furthermore, our work demonstrated that AKT and ERK signaling, which is downstream of the ErbB pathway, were active in the PTX-resistant NCI-N87 cell line, whereas the cell line moderately sensitive to PTX. HGC-27, expresses active AKT but not ERK signaling, possibly because of the synergistic effect of PIK3CA mutation and the loss of PTEN in this cell line. Several studies suggest that AKT and/or ERK (AKT/ERK) inhibition contributes to overcome PTX resistance in various types of cancer [35-39]. Furthermore, NF-κB signaling and p38MAPK signaling have been reported to be involved in resistance to PTX in some cases [35,39,40]. In general, AKT/ERK signaling activation results in the resistance to PTX, which warrants further validation in additional GC cell lines and tissues. Moreover, the activation of AKT/ERK may cause cancer cells to develop multidrug resistance, which has been suggested by previous studies [32,41]. This is another subject that deserves further investigation.
Collectively, our work suggests that ErbB/AKT/ERK signaling pathway may be potent biomarkers for PTX sensitivity and potential therapeutic targets for gastric cancer treatment.
Acknowledgements
We thank Li Zhang and Yinghui An from the 3DHTS Laboratory for their generous technical assistance. This work was supported by grants from the Committee of Science and Technology and the Commission of Health and Family Planning of Baoshan District, Shanghai.
Disclosure of conflict of interest
None.
References
- 1.Huang H, Han Y, Gao J, Feng J, Zhu L, Qu L, Shen L, Shou C. High level of serum AMBP is associated with poor response to paclitaxel-capecitabine chemotherapy in advanced gastric cancer patients. Med Oncol. 2013;30:748. doi: 10.1007/s12032-013-0748-8. [DOI] [PubMed] [Google Scholar]
- 2.Yoshino S, Furuya T, Shimizu R, Ozasa H, Nishimura T, Fukuda S, Kawaoka T, Hazama S, Oka M. Combination phase II study of weekly paclitaxel and 5’-DFUR for unresectable or recurrent gastric cancer. Anticancer Res. 2013;33:2629–2633. [PubMed] [Google Scholar]
- 3.Wang X, Wang ML, Zhou LY, Lu XY, Yang JF, Yu HG. Randomized phase II study comparing paclitaxel with S-1 vs. S-1 as first-line treatment in patients with advanced gastric cancer. Clin Transl Oncol. 2013;15:836–842. doi: 10.1007/s12094-013-1012-6. [DOI] [PubMed] [Google Scholar]
- 4.Kadokura M, Iwasa S, Honma Y, Kato K, Hamaguchi T, Yamada Y, Enomoto N, Shimada Y. Weekly paclitaxel as second-line chemotherapy in Japanese patients with advanced gastric cancer. Anticancer Res. 2013;33:4547–4552. [PubMed] [Google Scholar]
- 5.Ando T, Hosokawa A, Kajiura S, Itaya Y, Ueda A, Fujinami H, Nishikawa J, Kobayashi T, Horikawa N, Tsukioka Y, Yabushita K, Note M, Ogawa K, Sugiyama T. Efficacy of weekly paclitaxel in patients with advanced gastric cancer refractory to docetaxel-based chemotherapy. Gastric Cancer. 2012;15:427–432. doi: 10.1007/s10120-011-0135-0. [DOI] [PubMed] [Google Scholar]
- 6.Ajani JA, Winter K, Okawara GS, Donohue JH, Pisters PW, Crane CH, Greskovich JF, Anne PR, Bradley JD, Willett C, Rich TA. Phase II trial of preoperative chemoradiation in patients with localized gastric adenocarcinoma (RTOG 9904): quality of combined modality therapy and pathologic response. J. Clin. Oncol. 2006;24:3953–3958. doi: 10.1200/JCO.2006.06.4840. [DOI] [PubMed] [Google Scholar]
- 7.van Hagen P, Hulshof MC, van Lanschot JJ, Steyerberg EW, van Berge Henegouwen MI, Wijnhoven BP, Richel DJ, Nieuwenhuijzen GA, Hospers GA, Bonenkamp JJ, Cuesta MA, Blaisse RJ, Busch OR, ten Kate FJ, Creemers GJ, Punt CJ, Plukker JT, Verheul HM, Spillenaar Bilgen EJ, van Dekken H, van der Sangen MJ, Rozema T, Biermann K, Beukema JC, Piet AH, van Rij CM, Reinders JG, Tilanus HW, van der Gaast A CROSS Group. Preoperative chemoradiotherapy for esophageal or junctional cancer. N Engl J Med. 2012;366:2074–2084. doi: 10.1056/NEJMoa1112088. [DOI] [PubMed] [Google Scholar]
- 8.Smyth EC, Cunningham D. Gastric cancer in 2012: Defining treatment standards and novel insights into disease biology. Nat Rev Clin Oncol. 2013;10:73–74. doi: 10.1038/nrclinonc.2012.228. [DOI] [PubMed] [Google Scholar]
- 9.Hwang JE, Hong JY, Kim K, Kim SH, Choi WY, Kim MJ, Jung SH, Shim HJ, Bae WK, Hwang EC, Lee KH, Lee JH, Cho SH, Chung IJ. Class III beta-tubulin is a predictive marker for taxane-based chemotherapy in recurrent and metastatic gastric cancer. BMC Cancer. 2013;13:431. doi: 10.1186/1471-2407-13-431. [DOI] [PMC free article] [PubMed] [Google Scholar]
- 10.Seve P, Dumontet C. Is class III beta-tubulin a predictive factor in patients receiving tubulin-binding agents? Lancet Oncol. 2008;9:168–175. doi: 10.1016/S1470-2045(08)70029-9. [DOI] [PubMed] [Google Scholar]
- 11.Yu J, Gao J, Lu Z, Li Y, Shen L. Serum levels of TUBB3 correlate with clinical outcome in Chinese patients with advanced gastric cancer receiving first-line paclitaxel plus capecitabine. Med Oncol. 2012;29:3029–3034. doi: 10.1007/s12032-012-0292-y. [DOI] [PubMed] [Google Scholar]
- 12.Gao J, Lu M, Yu JW, Li YY, Shen L. Thymidine Phosphorylase/beta-tubulin III expressions predict the response in Chinese advanced gastric cancer patients receiving first-line capecitabine plus paclitaxel. BMC Cancer. 2011;11:177. doi: 10.1186/1471-2407-11-177. [DOI] [PMC free article] [PubMed] [Google Scholar]
- 13.Zhang C, Awasthi N, Schwarz MA, Schwarz RE. The dual PI3K/mTOR inhibitor NVP-BEZ235 enhances nab-paclitaxel antitumor response in experimental gastric cancer. Int J Oncol. 2013;43:1627–1635. doi: 10.3892/ijo.2013.2099. [DOI] [PMC free article] [PubMed] [Google Scholar]
- 14.Almhanna K, Cubitt CL, Zhang S, Kazim S, Husain K, Sullivan D, Sebti S, Malafa M. MK-2206, an Akt inhibitor, enhances carboplatinum/paclitaxel efficacy in gastric cancer cell lines. Cancer Biol Ther. 2013;14:932–936. doi: 10.4161/cbt.25939. [DOI] [PMC free article] [PubMed] [Google Scholar]
- 15.Haruki K, Shiba H, Fujiwara Y, Furukawa K, Iwase R, Uwagawa T, Misawa T, Ohashi T, Yanaga K. Inhibition of nuclear factor-kappaB enhances the antitumor effect of paclitaxel against gastric cancer with peritoneal dissemination in mice. Dig Dis Sci. 2013;58:123–131. doi: 10.1007/s10620-012-2311-4. [DOI] [PubMed] [Google Scholar]
- 16.Sohma I, Fujiwara Y, Sugita Y, Yoshioka A, Shirakawa M, Moon JH, Takiguchi S, Miyata H, Yamasaki M, Mori M, Doki Y. Parthenolide, an NF-kappaB inhibitor, suppresses tumor growth and enhances response to chemotherapy in gastric cancer. Cancer Genomics Proteomics. 2011;8:39–47. [PubMed] [Google Scholar]
- 17.Le XF, Bast RC Jr. Src family kinases and paclitaxel sensitivity. Cancer Biol Ther. 2011;12:260–269. doi: 10.4161/cbt.12.4.16430. [DOI] [PMC free article] [PubMed] [Google Scholar]
- 18.Qiu H, Yashiro M, Zhang X, Miwa A, Hirakawa K. A FGFR2 inhibitor, Ki23057, enhances the chemosensitivity of drug-resistant gastric cancer cells. Cancer Lett. 2011;307:47–52. doi: 10.1016/j.canlet.2011.03.015. [DOI] [PubMed] [Google Scholar]
- 19.Mi YJ, Liang YJ, Huang HB, Zhao HY, Wu CP, Wang F, Tao LY, Zhang CZ, Dai CL, Tiwari AK, Ma XX, To KK, Ambudkar SV, Chen ZS, Fu LW. Apatinib (YN968D1) reverses multidrug resistance by inhibiting the efflux function of multiple ATP-binding cassette transporters. Cancer Res. 2010;70:7981–7991. doi: 10.1158/0008-5472.CAN-10-0111. [DOI] [PMC free article] [PubMed] [Google Scholar]
- 20.Sanui A, Yotsumoto F, Tsujioka H, Fukami T, Horiuchi S, Shirota K, Yoshizato T, Kawarabayashi T, Kuroki M, Miyamoto S. HB-EGF inhibition in combination with various anticancer agents enhances its antitumor effects in gastric cancer. Anticancer Res. 2010;30:3143–3149. [PubMed] [Google Scholar]
- 21.Gutierrez-Gonzalez A, Belda-Iniesta C, Bargiela-Iparraguirre J, Dominguez G, Garcia Alfonso P, Perona R, Sanchez-Perez I. Targeting Chk2 improves gastric cancer chemotherapy by impairing DNA damage repair. Apoptosis. 2013;18:347–360. doi: 10.1007/s10495-012-0794-2. [DOI] [PubMed] [Google Scholar]
- 22.Huang D, Wang H, Liu R, Li H, Ge S, Bai M, Deng T, Yao G, Ba Y. miRNA27a is a biomarker for predicting chemosensitivity and prognosis in metastatic or recurrent gastric cancer patients receiving first-line chemotherapy. J Cell Biochem. 2014;115:549–56. doi: 10.1002/jcb.24689. [DOI] [PubMed] [Google Scholar]
- 23.Liu X, Ru J, Zhang J, Zhu LH, Liu M, Li X, Tang H. miR-23a targets interferon regulatory factor 1 and modulates cellular proliferation and paclitaxel-induced apoptosis in gastric adenocarcinoma cells. PLoS One. 2013;8:e64707. doi: 10.1371/journal.pone.0064707. [DOI] [PMC free article] [PubMed] [Google Scholar] [Retracted]
- 24.Wu H, Huang M, Lu M, Zhu W, Shu Y, Cao P, Liu P. Regulation of microtubule-associated protein tau (MAPT) by miR-34c-5p determines the chemosensitivity of gastric cancer to paclitaxel. Cancer Chemother Pharmacol. 2013;71:1159–1171. doi: 10.1007/s00280-013-2108-y. [DOI] [PubMed] [Google Scholar]
- 25.Tusher VG, Tibshirani R, Chu G. Significance analysis of microarrays applied to the ionizing radiation response. Proc Natl Acad Sci U S A. 2001;98:5116–5121. doi: 10.1073/pnas.091062498. [DOI] [PMC free article] [PubMed] [Google Scholar]
- 26.Huntzinger E, Izaurralde E. Gene silencing by microRNAs: contributions of translational repression and mRNA decay. Nat Rev Genet. 2011;12:99–110. doi: 10.1038/nrg2936. [DOI] [PubMed] [Google Scholar]
- 27.Kim JW, Kim HP, Im SA, Kang S, Hur HS, Yoon YK, Oh DY, Kim JH, Lee DS, Kim TY, Bang YJ. The growth inhibitory effect of lapatinib, a dual inhibitor of EGFR and HER2 tyrosine kinase, in gastric cancer cell lines. Cancer Lett. 2008;272:296–306. doi: 10.1016/j.canlet.2008.07.018. [DOI] [PubMed] [Google Scholar]
- 28.Gravalos C, Jimeno A. HER2 in gastric cancer: a new prognostic factor and a novel therapeutic target. Ann Oncol. 2008;19:1523–1529. doi: 10.1093/annonc/mdn169. [DOI] [PubMed] [Google Scholar]
- 29.Nam HJ, Ching KA, Kan J, Kim HP, Han SW, Im SA, Kim TY, Christensen JG, Oh DY, Bang YJ. Evaluation of the antitumor effects and mechanisms of PF00299804, a pan-HER inhibitor, alone or in combination with chemotherapy or targeted agents in gastric cancer. Mol Cancer Ther. 2012;11:439–451. doi: 10.1158/1535-7163.MCT-11-0494. [DOI] [PubMed] [Google Scholar]
- 30.Davies BR, Greenwood H, Dudley P, Crafter C, Yu DH, Zhang J, Li J, Gao B, Ji Q, Maynard J, Ricketts SA, Cross D, Cosulich S, Chresta CC, Page K, Yates J, Lane C, Watson R, Luke R, Ogilvie D, Pass M. Preclinical pharmacology of AZD5363, an inhibitor of AKT: pharmacodynamics, antitumor activity, and correlation of monotherapy activity with genetic background. Mol Cancer Ther. 2012;11:873–887. doi: 10.1158/1535-7163.MCT-11-0824-T. [DOI] [PubMed] [Google Scholar]
- 31.Zeng J, Wang L, Li Q, Li W, Bjorkholm M, Jia J, Xu D. FoxM1 is up-regulated in gastric cancer and its inhibition leads to cellular senescence, partially dependent on p27 kip1. J Pathol. 2009;218:419–427. doi: 10.1002/path.2530. [DOI] [PubMed] [Google Scholar]
- 32.Teixido C, Arguelaguet E, Pons B, Aracil M, Jimeno J, Somoza R, Mares R, Ramon YCS, Hernandez-Losa J. ErbB3 expression predicts sensitivity to elisidepsin treatment: in vitro synergism with cisplatin, paclitaxel and gemcitabine in lung, breast and colon cancer cell lines. Int J Oncol. 2012;41:317–324. doi: 10.3892/ijo.2012.1425. [DOI] [PubMed] [Google Scholar]
- 33.Yotsumoto F, Fukami T, Yagi H, Funakoshi A, Yoshizato T, Kuroki M, Miyamoto S. Amphiregulin regulates the activation of ERK and Akt through epidermal growth factor receptor and HER3 signals involved in the progression of pancreatic cancer. Cancer Sci. 2010;101:2351–2360. doi: 10.1111/j.1349-7006.2010.01671.x. [DOI] [PMC free article] [PubMed] [Google Scholar]
- 34.Wang S, Huang X, Lee CK, Liu B. Elevated expression of erbB3 confers paclitaxel resistance in erbB2-overexpressing breast cancer cells via upregulation of Survivin. Oncogene. 2010;29:4225–4236. doi: 10.1038/onc.2010.180. [DOI] [PubMed] [Google Scholar]
- 35.Yang YI, Lee KT, Park HJ, Kim TJ, Choi YS, Shih Ie M, Choi JH. Tectorigenin sensitizes paclitaxel-resistant human ovarian cancer cells through downregulation of the Akt and NFkappaB pathway. Carcinogenesis. 2012;33:2488–2498. doi: 10.1093/carcin/bgs302. [DOI] [PubMed] [Google Scholar]
- 36.Rong F, Li W, Chen K, Li DM, Duan WM, Feng YZ, Li F, Zhou XW, Fan SJ, Liu Y, Tao M. Knockdown of RhoGDIalpha induces apoptosis and increases lung cancer cell chemosensitivity to paclitaxel. Neoplasma. 2012;59:541–550. doi: 10.4149/neo_2012_070. [DOI] [PubMed] [Google Scholar]
- 37.Xu R, Nakano K, Iwasaki H, Kumagai M, Wakabayashi R, Yamasaki A, Suzuki H, Mibu R, Onishi H, Katano M. Dual blockade of phosphatidylinositol 3’-kinase and mitogen-activated protein kinase pathways overcomes paclitaxel-resistance in colorectal cancer. Cancer Lett. 2011;306:151–160. doi: 10.1016/j.canlet.2011.02.042. [DOI] [PubMed] [Google Scholar]
- 38.Tang MK, Zhou HY, Yam JW, Wong AS. c-Met overexpression contributes to the acquired apoptotic resistance of nonadherent ovarian cancer cells through a cross talk mediated by phosphatidylinositol 3-kinase and extracellular signal-regulated kinase 1/2. Neoplasia. 2010;12:128–138. doi: 10.1593/neo.91438. [DOI] [PMC free article] [PubMed] [Google Scholar]
- 39.Samanta AK, Huang HJ, Le XF, Mao W, Lu KH, Bast RC Jr, Liao WS. MEKK3 expression correlates with nuclear factor kappa B activity and with expression of antiapoptotic genes in serous ovarian carcinoma. Cancer. 2009;115:3897–3908. doi: 10.1002/cncr.24445. [DOI] [PMC free article] [PubMed] [Google Scholar]
- 40.Bacus SS, Gudkov AV, Lowe M, Lyass L, Yung Y, Komarov AP, Keyomarsi K, Yarden Y, Seger R. Taxol-induced apoptosis depends on MAP kinase pathways (ERK and p38) and is independent of p53. Oncogene. 2001;20:147–155. doi: 10.1038/sj.onc.1204062. [DOI] [PubMed] [Google Scholar]
- 41.Knuefermann C, Lu Y, Liu B, Jin W, Liang K, Wu L, Schmidt M, Mills GB, Mendelsohn J, Fan Z. HER2/PI-3K/Akt activation leads to a multidrug resistance in human breast adenocarcinoma cells. Oncogene. 2003;22:3205–3212. doi: 10.1038/sj.onc.1206394. [DOI] [PubMed] [Google Scholar]