

Abstract
Ag presentation to CD8+ T cells often commences immediately after infection, which facilitates their rapid expansion and control of infection. Subsequently, the primed cells undergo rapid contraction. We report that this paradigm is not followed during infection with virulent Salmonella enterica, serovar Typhimurium (ST), an intracellular bacterium that replicates within phagosomes of infected cells. Although susceptible mice die rapidly (~7 days), resistant mice (129×1SvJ) harbor a chronic infection lasting ~60–90 days. Using rOVA-expressing ST (ST-OVA), we show that T cell priming is considerably delayed in the resistant mice. CD8+ T cells that are induced during ST-OVA infection undergo delayed expansion, which peaks around day 21, and is followed by protracted contraction. Initially, ST-OVA induces a small population of cycling central phenotype (CD62LhighIL-7RαhighCD44high) CD8+ T cells. However, by day 14–21, majority of the primed CD8+ T cells display an effector phenotype (CD62LlowIL-7RαlowCD44high). Subsequently, a progressive increase in the numbers of effector memory phenotype cells (CD62LlowIL-7RαhighCD44high) occurs. This differentiation program remained unchanged after accelerated removal of the pathogen with antibiotics, as majority of the primed cells displayed an effector memory phenotype even at 6 mo postinfection. Despite the chronic infection, CD8+ T cells induced by ST-OVA were functional as they exhibited killing ability and cytokine production. Importantly, even memory CD8+ T cells failed to undergo rapid expansion in response to ST-OVA infection, suggesting a delay in T cell priming during infection with virulent ST-OVA. Thus, phagosomal lifestyle may allow escape from host CD8+ T cell recognition, conferring a survival advantage to the pathogen.
The CD8+ T cells are stimulated when peptides from endogenously derived Ags (intracellular bacteria, viruses, or tumors) are presented on MHC class I molecules (1). During viral (lymphocytic choriomeningitis virus) or intracellular bacterial (Listeria monocytogenes (LM))4 infections, Ag presentation has been shown to occur rapidly within, but not after, the first few days of infection (2–6), implying that the programming for CD8+ T cell memory development occurs early after infection. Within the first week of infection, CD8+ T cells undergo >5000-fold expansion and differentiation into effectors that mediate specific cytotoxicity (by perforin- and Fas-dependent pathways) toward infected cells (7–9). Indeed, the generation of massive clonal burst size has been shown to be necessary for generation of CD8+ T cell memory (10). The vast majority (>95%) of Ag-specific CD8+ T cells activated at the onset of the immune response die by apoptosis, and only a small portion of those T cells survives (<5%) for extended periods (11–13). These long-lived memory T cells possess the unique ability to respond rapidly and specifically to pathogens (14, 15). This paradigm of CD8+ T cell differentiation and memory has evolved mainly from intracellular pathogens that induce an acute infection, such as lymphocytic choriomeningitis virus and LM infection models (14).
Memory CD4+ and CD8+ T cells have been segregated phenotypically and functionally into effector memory and central memory populations based on the expression of CD62L and CCR7 (16–18). Tissue-homing effector memory T cells (CD62LlowCCR7−) are capable of immediate effector function, whereas the lymph node-homing central memory T cells (CD62LhighCCR7+) are devoid of effector activity in vitro (18), but proliferate profoundly in vivo and differentiate into effector cells after antigenic encounter (19). Several recent reports have confirmed the presence of distinct effector vs central memory T cell subsets (20, 21), and have shown that effector memory T cells selectively extravasate into nonlymphoid compartments (22, 23) to provide a first line of defense against pathogens. Both of the subsets of memory cells are present in the blood and spleen (14).
Salmonella enterica, serovar Typhimurium (ST), is a highly virulent pathogen that induces gastroenteritis in humans. In C57BL/6J strain of mice, ST (strain SL1344) induces a lethal infection even when used at doses as low as 102 i.v., and 100% of mice die within 7 days of infection. In contrast, ST induces a chronic, but nonlethal, infection in 129SvJ or B6.129F1 mice in which the infection is usually cleared around day 60–90. Although CD8+ T cells have been considered to play an essential role mainly during viral infection models, they also play an important role in mediating protection against intracellular bacteria such as LM (24–26), Mycobacterium tuberculosis (27), and ST (28, 29). In this study, we have kinetically evaluated the relative differentiation, fate, and function of CD8+ T cells primed during infection of mice with virulent LM and virulent ST. To measure CD8+ T cell response specifically, we generated recombinant LM and ST expressing the same Ag, OVA. Our results reveal that the programming for the timing and degree of CD8+ T cell differentiation, expansion, and contraction is flexible, which is governed to a large extent by pathogen-specific interactions with the host.
Materials and Methods
Bacterial strains
rST expressing the gene for OVA (ST-OVA) was generated by electroporating the plasmid pKK-OVA (30, 31) carrying the full-length OVA, into virulent ST SL 1344. Plasmid DNA (10–100 ng) was introduced into ST by electroporation (32). ST was grown in ML medium supplemented with 1 mg/l 2,3-dihydroxybenzoic acid and 0.5 g of glucose/L. Bacteria were washed and resuspended in Luria-Bertani (ML) medium (1/100 diluted in distilled water), and plasmid DNA was introduced (1–5 μl of TE, 10 mM Tris-HCl (pH 8), and 0.1 mM EDTA) into the bacterial suspension in a precooled electroporation cuvette (0.2 cm). Electroporation was done once at 2.5 kV in a gene pulser (Bio-Rad). Immediately after the pulse, the cells were gently resuspended in ML medium described above and allowed to grow for 1 h at 37°C before plating on ML medium agarose plates containing ampicillin (10 μg/ml). Single colonies were used to inoculate liquid cultures that were incubated at 37°C under constant shaking in brain-heart infusion (BHI) medium (Difco Laboratories). Expression of OVA by ST-OVA was confirmed by Western blot analysis using an anti-OVA mAb. At mid-log phase (OD600 = 0.8), bacteria were harvested and frozen at −80°C (in 20% glycerol). CFU were determined by performing serial dilutions in 0.9% NaCl, which were spread on BHI-streptomycin agar plates.
OVA-expressing LM (LM-OVA), as described previously (33), was grown to OD600 nm = 0.4. The bacteria were grown in BHI medium (Difco Laboratories), supplemented with 50 μg/ml streptomycin (Sigma-Aldrich). At mid-log phase (OD600 = 1.0), bacteria were harvested and frozen in 20% glycerol and stored at −80°C. CFUs were determined by performing serial dilutions in 0.9% NaCl, which were spread on BHI-streptomycin agar plates.
Enumeration of OVA expression
OVA expression was determined by ECL detection system. LM-OVA and ST-OVA were grown in BHI liquid culture. In case of LM-OVA, the supernatant corresponding to ~108 bacteria was subject to ammonium sulfate precipitation (45%) and the pellet was dissolved in the SDS-PAGE sample buffer (0.1 M Tris-HCl (pH 6.8), 6% SDS, 30% glycerol, 15% 2-ME, and 0.01% bromphenol blue) and heated in a boiling water bath for 5 min before loading on the 10% SDS-PAGE gel. In case of ST-OVA, 108 bacteria were resuspended in PBS and sonicated. The supernatant was subject to ammonium sulfate precipitation (45%), and the pellet was dissolved in SDS-PAGE sample buffer, heated in a boiling water bath for 5 min, and loaded on the SDS-PAGE gel. The gel was equilibrated with the transfer buffer (25 mM Tris, 175 mM glycine in 20% methanol) and blotted electrophoretically onto the polyvinylidene difluoride membrane at 50 V for 3 h. The blot was blocked with 1% skimmed milk in PBS for 14–16 h at 4°C. After thorough washing (0.1% Tween 20 in PBS), the blot was incubated for 1 h with the polyclonal anti-OVA Abs in PBS containing skimmed milk. After thorough washing, the blot was incubated for 1 h with the secondary anti-mouse Ab conjugated to HRP. The membrane was washed and incubated with the Lumilight substrate solution. The polyvinylidene difluoride membrane was attached to the x-ray film and exposed for 1 min.
Mice and immunizations
C57BL/6 and 129×1SvJ mice were obtained from The Jackson Laboratory. B6129F1 mice were generated in house in our experimental animal facility by mating 129×1SvJ female mice with C57BL/6 male mice. OT-1 TCR transgenic mice were obtained from The Jackson Laboratory. Mice were maintained at the Institute for Biological Sciences (National Research Council of Canada) in accordance with the guidelines of the Canadian Council on Animal Care. For immunization, frozen stocks were thawed and diluted in 0.9% NaCl. Mice were inoculated with 1 × 10³ organisms suspended in 200 μl of 0.9% NaCl, via the lateral tail vein (i.v.). In some experiments, mice were injected first with 104 OT-1 CD8+ T cells (i.v.) and challenged a few days later with LM-OVA or ST-OVA (103, i.v.).
Assessment of bacterial burden
Single-cell suspensions were obtained from the spleens of infected mice in RPMI 1640. An aliquot of the suspension was lysed with water for 30 s, and then evaluated for the numbers of viable bacteria. CFUs were determined by plating 100-μl aliquots of serial 10-fold dilutions in 0.9% saline on BHI plates, as above.
Assessment of Ag presentation
Spleen cells were obtained from donor OT-1 transgenic mice and stained with CFSE (34). Briefly, spleen cell suspensions were prepared, and RBC was removed by ammonium chloride treatment. Spleen cells were resuspended in PBS (20 × 106/ml), and an equal volume of CFSE (5 μM in PBS) was added. After 8 min at room temperature, equal volume of FBS was added for quenching. After 1–2 min at 4°C, cells were washed with HBSS. CD8+ T cells were purified, as described above, and 5 × 10⁶-purified CD8+ T cells were injected into recipient congeneic B6.129F1 mice via the lateral tail vein in 200 μl of HBSS. Recipient mice were preinjected with PBS, LM, LM-OVA, ST, and ST-OVA. At different time intervals, recipient mice received OT-1 CD8+ T cells. Spleens were removed from the recipient mice, and spleen cells were evaluated for the presence of donor CD8+ T cells (OVA tetramer+) and the reduction in CFSE intensity.
Assessment of the fate and phenotype of Ag-specific CD8+ T cells
At various time intervals after infection, aliquots (10 × 106) of spleen cells were incubated in 200 μl of PBS plus 1% BSA (PBS-BSA) with anti-CD16/32 at 4°C. After 10 min, cells were stained with PE-H-2Kb OVA257–264 tetramer and various Abs (anti-CD8, anti-CD62L, anti-IL-2Rα, anti-IL-7Rα, anti-CD69, and anti-CD44) for 30 min at room temperature. All Abs were obtained from BD Biosciences. PE-H-2Kb OVA257–264 tetramer was obtained from Beckman Coulter. Cells were washed with PBS, fixed in 0.5% formaldehyde, and acquired on BD Biosciences FACS Canto analyzer.
Assessment of intracellular IFN-γ in Ag-specific CD8+ T cells
Aliquots of spleen cells (10 × 106/ml) were stained with anti-CD8 Ab and H-2KbOVA257–264 tetramer for 30 min, as described above. Cells were then washed, reconstituted in R8 medium (RPMI 1640 plus 8% FBS), plated into 96-well plates (2 × 10⁶/well), and stimulated with OVA257–264 peptide (1 μg/ml) in the presence of GolgiStop (BD Biosciences). After 1 h, cells were harvested, washed, permeabilized, and stained for intracellular IFN-γ using the IFN-γ staining kit (obtained from BD Biosciences). Cells were acquired on a BD Biosciences FACS Canto analyzer.
Assessment of cell cycling
Cell cycling was evaluated according to the protocol of Tough and Sprent (35) using the BD Biosciences BrdU staining kit. Three days before the harvesting of spleens from infected mice, BrdU was provided (0.08%) in the drinking water every day. Spleens were harvested, single-cell suspensions were prepared, and aliquots of spleen cells (10 × 106/ml) were stained with anti-CD8 Ab and H-2KbOVA257–264 tetramer for 30 min, as described above. After staining, cells were washed, permeabilized, and incubated with DNase for 30 min at 37°C. Cells were then stained with anti-BrdU Ab on ice for 30 min, washed, fixed in 0.5% formaldehyde, and acquired on a BD Biosciences FACS Canto analyzer.
Assessment of in vivo cytolytic activity
In vivo cytolytic activity of Ag-specific CD8+ T cells was enumerated, according to the protocol of Barber et al. (36). Donor spleen cell suspensions were prepared, and RBC was lysed by ammonium chloride treatment. Cells were stained with the dye PKH26 (4 μM) and split into two aliquots. One aliquot was stained with low concentration of CFSE (0.5 μM) and incubated in R8 medium. The second aliquot was stained with 10× CFSE (5 μM) and incubated with OVA257–264 peptide (10 μg/ml) in R8 medium. After 30 min of incubation, the two aliquots were mixed 1:1 and injected (20 × 106/mouse) into recipient mice that were infected previously with LM-OVA or ST-OVA. PBS-injected recipient mice served as controls. At 24 h after the donor cell transfer, spleens were removed from recipients, and the relative numbers of peptide-pulsed vs control donor cells were enumerated, according to previously published equation (36).
Results
ST-OVA induces chronic infection
We first determined the relative rate of proliferation of virulent LM-OVA and ST-OVA by measuring the time taken by the bacteria to cause doubling of OD and CFUs in vitro (Fig. 1A). By this analysis, the doubling time for ST-OVA was ~26 min in comparison with 46 min in case of LM-OVA. Thus, ST-OVA proliferated approximately twice as rapidly as LM-OVA. Normal C57BL/6J mice succumb within 7 days even to a low dose (102) of ST given i.v. (Fig. 1B). In contrast, 129SvJ mice resist infection with low doses of ST-OVA and develop a chronic infection that lasts ~2 mo (Fig. 1B). We generated F1 mice by mating C57BL/6 males with 129SvJ female mice and used these mice (B6.129F1) for further study. This was done for two reasons: first, infection of B6.129F1 mice with low doses of ST-OVA or LM-OVA was not lethal (Fig. 1C); second, we could also follow the fate of transgenic OVA-specific OT-1 CD8+ T cells in F1 mice as OT-1 cells (of B6 origin) survived very well in these mice. Within the first few days of infection, LM-OVA-infected F1 mice exhibited increased bacterial burden in the spleen and the infection was cleared by day 5–7 (Fig. 1C). ST-OVA also grew rapidly in mice, and similar bacterial burden was noted in the spleens of LM-OVA- and ST-OVA-infected mice at day 2 (~104). Although LM-OVA burden declined subsequently, ST-OVA continued to grow profoundly (~105 CFU at day 10–14) and the infection was gradually cleared. At day 90, ST-OVA burden was undetectable in any lymphoid or nonlymphoid organs (spleens, lymph nodes, mesenteric lymph nodes, lungs, or liver) (data not shown).
FIGURE 1.

ST-OVA induces a chronic infection in resistant mice. Liquid cultures of LM-OVA and ST-OVA were set up in multiple flasks. At various time intervals, aliquots were removed for measurement of OD at 600 nm and bacterial burden (CFUs), as described in Materials and Methods (A). C57BL/6 and 129×1SvJ mice were infected i.v. with 102 ST-OVA, and the bacterial burden in the spleens was evaluated at various time intervals (B). B6129F1 mice were infected i.v. with 103 LM-OVA or ST-OVA, and the bacterial burden in the spleens was evaluated at various time intervals (C). Mean and SD of three mice per time point are indicated. The expression of OVA (D) by LM-OVA (lane 5) vs ST-OVA (lane 3) and the parental controls ST (lane 2) and LM (lane 4) was evaluated by ECL after Western blotting, as described in Materials and Methods. Figure is representative of three such independent experiments.
We also measured the relative expression of OVA by ~108 LM-OVA and ST-OVA. This was achieved using ECL-based detection system. LM-OVA expresses truncated OVA (aa 134–387), whereas ST-OVA expresses the full-length OVA. Western blot analysis revealed the expression of OVA in both LM-OVA and ST-OVA, but not in parental controls LM and ST (Fig. 1D). Furthermore, the expression of OVA in LM-OVA appeared to be lesser than that expressed by ST-OVA. OVA secreted by LM-OVA was detectable only in the culture supernatant and not within the cytoplasm of the bacteria. In case of ST-OVA, OVA was detectable only in the cytosol of the bacteria, but not in the culture supernatant (data not shown).
Delayed Ag presentation during ST-OVA infection
We evaluated the onset, duration, and extent of T cell activation during LM-OVA and ST-OVA infection models. OT-1 TCR transgenic CD8+ T cells were transferred at different time intervals after infection of recipient mice, and the proliferation of OT-1 cells was enumerated by determining the reduction in the expression of CFSE. As is evident in Fig. 2A, LM-OVA induces massive T cell proliferation during the first 4 days with nearly all the transferred cells having undergone cell division. In contrast, there was little evidence of T cell proliferation in ST-OVA-infected mice within the first 4 days. T cell proliferation in LM-OVA-infected mice was drastically curtailed after the first week of infection, whereas T cell proliferation in ST-OVA-infected mice was moderately increased during the second and third week of infection, followed by a gradual reduction thereafter (Fig. 2B). In the ST-OVA infection model, T cell proliferation increased appreciably only when the transferred donor OT-1 cells were kept in the recipient mice for >4 days (Fig. 2C).
FIGURE 2.

Delayed and reduced Ag presentation in ST-OVA-infected mice. B6129F1 mice were infected with 103 LM-OVA or ST-OVA on day 0. Groups of mice were injected with CFSE-labeled 106 OT-1 CD8+ T cells immediately, or at various time points after infection. Four days after the OT-1 transfer, spleens were removed from recipient mice, and the reduction in the expression of CFSE was evaluated in gated tetramer+ CD8+ T cells (A and B). In another set of experiments, spleens were removed from infected recipient mice in which CFSE-labeled OT-1 cells were parked for 0, 4, 8, or 15 days (C). Mean percentage of splenic CFSElow tetramer+ cells and SDs of three mice per time period is indicated.
An alternative way of evaluating Ag presentation is to determine the overall increase in the numbers of transferred OT-1 cells after transfer into the infected hosts at different time intervals. We infected mice with ST-OVA on day 0 and transferred naive OT-1 transgenic CD8+ T cells simultaneously, or at various time points thereafter. We reasoned that the expansion of OVA-specific CD8+ T cells in a host in a short interval (even if it is delayed) would reflect a clonal burst. In contrast, if a long interval is required to generate peak numbers of OVA-specific CD8+ T cells, then a clonal burst may not be occurring, and may suggest gradual accumulation. CD8+ T cells induced during ST-OVA infection required at least 2 wk between days 7 and 21 for optimal expansion, suggesting a lack of clonal burst (Fig. 3). In the absence of the donor OT-1 cells, no endogenous tetramer+ cells are detectable in the ST-OVA-infected recipients (data not shown). So, the tetramer+ cells are exclusively of the donor origin.
FIGURE 3.
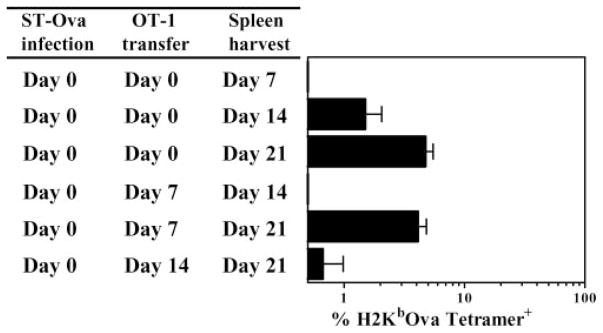
Absence of a CD8+ T cell clonal burst. B6129F1 mice were infected with 103 ST-OVA on day 0. Groups of mice were injected with 104 OT-1 CD8+ T cells immediately, or at various time points after infection. The percentage of tetramer+ CD8+ T cells was evaluated in the spleens of mice at various time intervals after ST-OVA infection. Mean numbers of splenic tetramer+ cells and SDs of three mice per time period are indicated.
Delayed and gradual priming of CD8+ T cells during infection with ST-OVA
We then evaluated the relative expansion and contraction of OVA-specific CD8+ T cell response over prolonged periods after transfer of OT-1 cells only at day 0 of infection. As is evident in Fig. 4, LM-OVA infection induced rapid priming of OVA-specific CD8+ T cells as the response peaked around day 7 of infection, which was followed by an equally rapid and massive contraction. There was a ~10-fold reduction in the numbers of OVA-specific CD8+ T cells from day 7 to day 21. In contrast, ST-OVA infection induced a delayed CD8+ T cell response, which was miniscule at day 7, peaked only at day 21, and underwent a protracted phase of contraction subsequently. From day 21 to day 60, there was only a 2-fold reduction in the numbers of OVA-specific CD8+ T cells.
FIGURE 4.
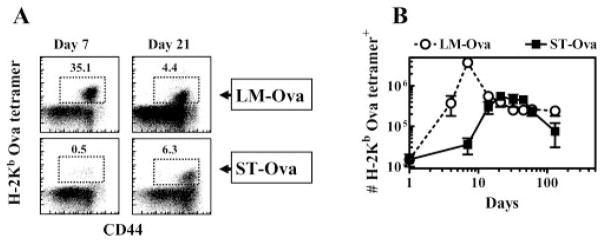
Delayed priming of CD8+ T cells. B6129F1 mice were injected with 104 OT-1 CD8+ T cells and challenged with 103 LM-OVA or ST-OVA i.v. within 3–7 days. At various time intervals, the relative numbers of H-2KbOVA tetramer+ CD8+ T cells were evaluated in the spleens of mice (A and B). Representative flow cytometric profile of CD44 vs tetramer+ cells at days 7 and 21 in LM-OVA and ST-OVA groups is indicated (A). Mean numbers of splenic tetramer+ cells and SDs of three mice per time period are indicated (B).
Unique differentiation program of CD8+ T cells during ST-OVA infection
We evaluated the differentiation of OVA-specific CD8+ T cells kinetically during LM-OVA and ST-OVA infection models by measuring the relative distribution of CD62L vs CD44 expression among OVA-specific CD8+ T cells. Similar to viral infection models, the majority of naive OVA-specific CD8+ T cells activated during LM-OVA infection differentiated early into effectors (CD62LlowCD44high). At subsequent time intervals, the relative numbers of effector phenotype cells decreased, which correlated with an increase in the numbers of central phenotype cells (CD62LhighCD44high) (Fig. 5A). In contrast, ~70% of naive OVA-specific CD8+ T cells induced during ST-OVA infection differentiated mainly into a central phenotype (CD62LhighCD44high) initially. However, after 2 wk of infection, OVA-specific CD8+ T cells displayed an overwhelming effector phenotype (CD62LlowCD44high), and the primed cells persisted in an effector state for prolonged periods (>90 days). We also evaluated the expression of various activation markers (IL-2Rα, CD69, and IL-7Rα) on OVA-specific CD8+ T cells during their differentiation. OVA-specific CD8+ T cells induced by LM-OVA expressed increased levels of IL-2Rα and CD69 before, but not after, day 7 (Fig. 5B). Correlating with activation, the expression of IL-7Rα on OVA-specific CD8+ T cells was reduced during the rapid effector phase. In contrast, ST-OVA induced a delayed up-regulation of IL-2Rα and CD69 expression, and down-regulation of IL-7Rα expression in OVA-specific CD8+ T cells, correlating with delayed CD8+ T cell activation. The OVA-specific CD8+ T cells induced by ST-OVA also remained in an activated state for a relatively longer duration. Interestingly, while the CD8+ T cells induced by ST-OVA maintained their CD62Llow status, there was a progressive increase in the numbers of cells expressing high levels of IL-7Rα, indicating their transition to the effector memory stage.
FIGURE 5.
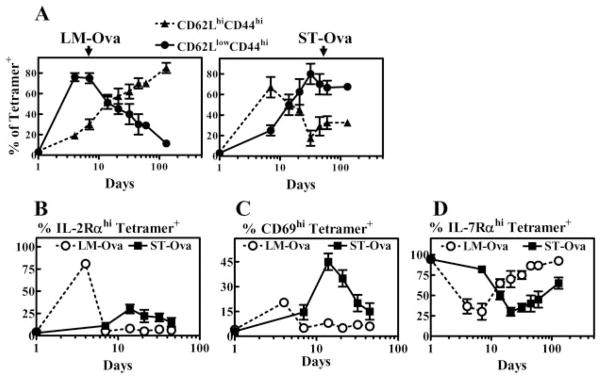
ST-OVA induces a unique CD8+ T cell differentiation program. B6129F1 mice were injected with OT-1 cells and 103 LM-OVA or ST-OVA within 3–7 days, as described in Fig. 4. At various time intervals, spleens were removed and stained with various Abs and OVA tetramers. The relative induction of central (CD62LhighCD44high) vs effector (CD62LlowCD44high) phenotype cells (A), IL-2Rαhigh cells (B), CD69high cells (C), and IL-7Rαhigh cells (D) was evaluated on gated tetramer+ CD8+ T cells. Data are derived from analysis of individual spleens (n = 3) per time point. Figure is representative of three to five such experiments conducted.
We also measured the expansion and contraction of OVA-specific CD8+ T cell response in the peripheral blood of mice. In this study, again, rapid expansion and contraction of CD8+ T cell response were noted in LM-OVA-infected mice, whereas a delayed expansion and contraction of CD8+ T cell response were noted in case of ST-OVA-infected mice (Fig. 6A). We also evaluated the distribution of central vs effector phenotype of OVA-specific CD8+ T cells in the peripheral blood of infected mice (Fig. 6B). The results were similar to what was noted for the spleen, except that the differences were more dramatic in the relative distribution of central vs effector phenotype cells induced by LM-OVA vs ST-OVA. In the long-term (day 180), the OVA-specific CD8+ T cells induced during ST-OVA infection did not show any signs of differentiation back into the central phenotype, long after clearance of ST-OVA.
FIGURE 6.

Profile of CD8+ T cells in the peripheral blood. B6129F1 mice were injected with OT-1 cells and 103 LM-OVA or ST-OVA within 3–7 days, as described in Fig. 4. At various time intervals, peripheral blood was collected and stained with anti-CD8 Ab and OVA tetramers. The percentage of tetramer+ cells within gated CD8+ T cells was evaluated (A). Cells were also stained with anti-CD62L and anti-CD44 Ab (B) and annexin V (C and D). Numbers in the figure indicate the percentages of cells within gated tetramer+ cells. Data are derived from analysis of peripheral blood (n = 3) per time point.
Considering the chronic infection induced by ST-OVA, we determined whether the OVA-specific CD8+ T cells in this infection model were undergoing apoptosis continuously. Apoptosis in CD8+ T cells was evaluated by measurement of binding of annexin V to OVA-specific CD8+ T cells. During LM-OVA infection, OVA-specific CD8+ T cells underwent a rapid phase of apoptosis, which peaked ~day 5 and was short-lived (Fig. 6, C and D). On other hand, ST-OVA induced a relatively delayed, but prolonged, phase of apoptosis.
Accelerated clearance of ST-OVA does not influence contraction or phenotype of CD8+ T cells
We reasoned that removal of ST-OVA with antibiotics after the peak response (day 30) may influence the contraction or phenotype of primed OVA-specific CD8+ T cells. To this end, we administered ciprofloxacin (1 mg/ml) into the drinking water of one group of mice from day 30 onward. Water was changed twice per week with fresh antibiotic. Antibiotic treatment resulted in accelerated clearance of the ST-OVA (Fig. 7A). At day 75 or 95, no bacterial burden was detectable even in mice not treated with antibiotic. We also evaluated burden in the lungs, liver, and mesenteric lymph nodes, and failed to detect any ST-OVA in these organs (data not shown). Even when the entire organs were plated, no CFU were detectable. The antibiotic treatment was continued regardless to eliminate as much as possible any residual bacteria. Interestingly, antibiotic treatment did not have any influence on the numbers of OVA-specific CD8+ T cells (Fig. 7B). Similarly, no effect was noticeable on the phenotype of OVA-specific CD8+ T cells (Fig. 7, C and D). In this study, again, the CD8+ T cells induced by ST-OVA differentiated progressively into an effector memory phenotype because they maintained the CD62Llow status, while the numbers of cells expressing IL-7Rα increased. Thus, treatment of mice with antibiotic continuously for 150 days (from day 30 till day 180) had no influence on the contraction or the phenotype of primed OVA-specific CD8+ T cells.
FIGURE 7.

Accelerated removal of ST-OVA does not influence the contraction or the phenotype of CD8+ T cells. B6129F1 mice were injected with OT-1 cells and 103 LM-OVA or ST-OVA within 3–7 days, as described in Fig. 4. From day 30 onward, one group of mice (n = 5) received ciprofloxacin antibiotic (1 mg/ml) in the drinking water continuously until day 180. The other control group (n = 5) received normal drinking water. Bacterial burden (A), the percentage of OVA tetramer+ CD8+ T cells (B), and the phenotype of OVA tetramer+ CD8+ T cells (C and D) were evaluated in peripheral blood by flow cytometry at various time intervals.
Cycling of CD8+ T cells during ST-OVA infection
We determined the relative proliferation of OVA-specific CD8+ T cells induced by LM-OVA vs ST-OVA by measuring the incorporation of BrdU that had been provided in the drinking water 3 days previously. OVA-specific CD8+ T cells induced by LM-OVA displayed massive proliferation at day 7 after infection with nearly all OVA-specific CD8+ T cells incorporating BrdU (Fig. 8). This massive Ag-induced burst of proliferation was over rapidly, and was followed by a low level (~5–10%) homeostatic proliferation of OVA-specific CD8+ T cells. In contrast, OVA-specific CD8+ T cells induced by ST-OVA displayed a continual phase of cycling in the first 3 wk of infection. However, beyond the third week, the proliferation of OVA-specific CD8+ T cells was not sustained at high levels despite the persistence of ST-OVA. For example, the proliferation of OVA-specific CD8+ T cells was reduced to ~30% at day 30 in comparison with ~80% at day 15. By day 60, the OVA-specific CD8+ T cells induced by ST-OVA displayed a low level of cycling (~10%), which was similar to the proliferation of OVA-specific CD8+ T cells induced by LM-OVA at later time points.
FIGURE 8.
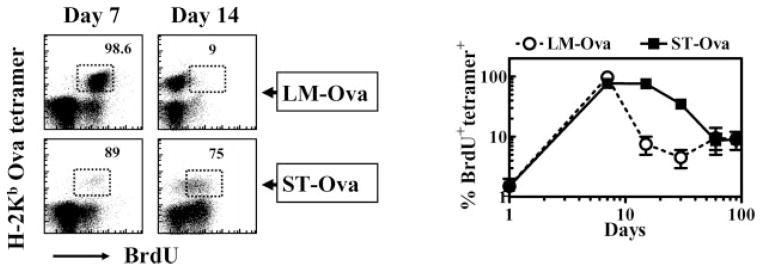
Cycling of Ag-specific CD8+ T cells. B6129F1 mice were injected with OT-1 cells and 103 LM-OVA or ST-OVA within 3–7 days, as described in Fig. 4. Three days before the harvest of spleens, BrdU (0.8 mg/ml) was incorporated into the drinking water of mice, which was changed daily. Spleen cells were stained with various Abs and OVA tetramers, followed by intracellular staining for BrdU. Numbers in the panels indicate the percentage of BrdU+ CD8+ T cells among the tetramer+ cells. Data are derived from analysis of individual spleens (n = 3) per time point.
Function of primed CD8+ T cells
We determined the expression of intracellular IFN-γ in OVA-specific CD8+ T cells induced by LM-OVA and ST-OVA. The majority of OVA-specific CD8+ T cells induced by LM-OVA expressed IFN-γ early on (Fig. 9). In case of ST-OVA, slightly reduced numbers of IFN-γ -secreting CD8+ T cells were detectable at day 7, possibly due to incomplete differentiation of cells. Subsequently, the expression of intracellular IFN-γ was similar in CD8+ T cells induced by LM-OVA or ST-OVA. At day 130, the numbers of IFN-γ -secreting OVA-specific CD8+ T cells evoked by ST-OVA were moderately reduced.
FIGURE 9.
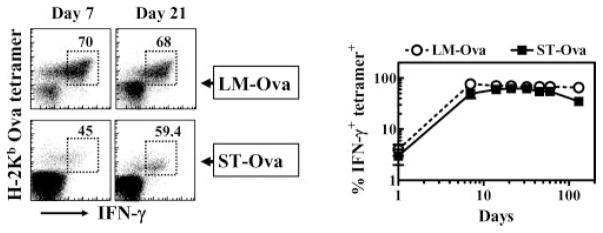
Intracellular IFN-γ expression in Ag-specific CD8+ T cells. B6129F1 mice were injected with OT-1 cells and 103 LM-OVA or ST-OVA within 3–7 days, as described in Fig. 4. At various time intervals, the numbers of IFN-γ-secreting tetramer+ CD8+ T cells were evaluated after stimulation of cells for 1 h with OVA257–264. Numbers in the panels indicate the percentage of IFN-γ-secreting CD8+ T cells among the tetramer+ cells. Data are derived from analysis of individual spleens (n = 3) per time point.
We also measured the cytolytic activity of CD8+ T cells in a physiological setting using the recently developed assay that measures in vivo killing of target cells (36, 37). On day 7 after LM-OVA infection, CD8+ T cells displayed high cytolytic activity toward specific targets, resulting in complete elimination of specific targets within 24 h (Fig. 10). The extent of this cytolytic response was reduced at subsequent time intervals as only ~30% of specific targets were eliminated within 24 h. In contrast, ST-OVA did not induce any significant cytolytic T cell response at day 7. At day 14, low-level response was detectable, which became persistently potent at subsequent time intervals.
FIGURE 10.
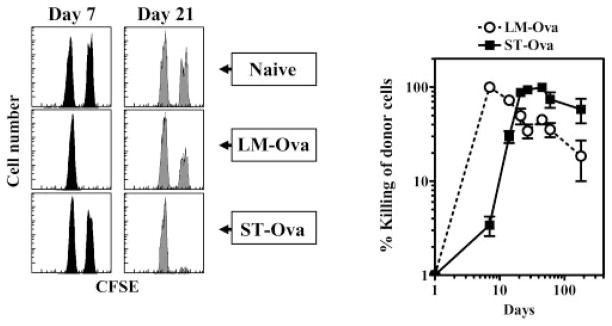
In vivo cytolytic activity of Ag-specific CD8+ T cells. The 129×1SvJ mice were injected with 103 LM-OVA or ST-OVA. At various time intervals, peptide-pulsed and PKH26- and CFSE-labeled spleen cells from naive donor mice were injected into naive and infected recipients. Spleens were removed from recipients at 24 h posttransfer, and the relative numbers of peptide-pulsed vs control cells were enumerated in individual spleens. Data are derived from analysis of individual spleens (n = 3) per time point. Experiment is representative of three such experiments conducted.
Response of memory CD8+ T cells to rechallenge
We sought to determine whether the OVA-specific memory CD8+ T cells induced by LM-OVA and ST-OVA exhibit differences in their expansion in response to antigenic stimulation in vivo. To this end, we purified CD8+ T cells on day 130 after infection of mice with LM-OVA and ST-OVA. The percentage of OVA tetramer+ cells among the purified CD8+ T cells of LM-OVA- and ST-OVA-infected mice was 3 and 1.5%, respectively. These cells were transferred into naive recipients that were then challenged with LM-OVA or ST-OVA, and the expansion of the transferred OVA-specific memory CD8+ T cells was measured at various time intervals. Memory CD8+ T cells induced by LM-OVA proliferated rapidly in response to LM-OVA challenge with ~40% of all CD8+ T cells being OVA specific at day 5 after challenge (Fig. 11A). In contrast, the same LM-OVA-generated OVA-specific memory CD8+ T cells exhibited a delayed and muted expansion in response to ST-OVA challenge. Therefore, as with naive CD8+ T cells, memory CD8+ T cells also respond to ST-OVA with delayed and protracted kinetics. Memory CD8+ T cells that were induced by ST-OVA also proliferated upon challenge with LM-OVA, with ~5% of all CD8+ T cells being OVA specific at day 5 after challenge (Fig. 11B). However, this proliferation was much weaker in comparison with the proliferation of memory CD8+ T cells induced by LM-OVA.
FIGURE 11.

Response of memory CD8+ T cells to rechallenge. B6129F1 mice were injected with OT-1 cells and 103 LM-OVA or ST-OVA within 3–7 days, as described in Fig. 4. At day 130, spleens were removed and CD8+ T cells were purified. A total of 3 and 1.5% of CD8+ T cells was tetramer+ from LM-OVA-infected (A) and ST-OVA-infected (B) spleens, respectively. Purified CD8+ T cells (5 × 10⁶/mouse) were then injected into normal B6129F1 mice that were challenged (104, i.v.) with LM-OVA or ST-OVA. At various time intervals, the percentages of tetramer+ CD8+ T cells were enumerated in the peripheral blood. Data are derived from three mice per group, and are representative of two such experiments conducted.
Discussion
The general paradigm of differentiation, expansion, and contraction of CD8+ T cells has been derived mainly from several infection models in mice (14, 19). According to this model, Ag presentation occurs within, but not after, the first few days of infection (2–4), resulting in the generation of a potent CD8+ T cell response, which peaks at ~7 days postinfection. This is followed by an equally rapid and massive attrition of the primed cells (>90%), which is complete by 2–3 wk (14). The current model of CD8+ T cell differentiation is that CD8+ T cell responses peak at day 7 after infection regardless of the nature of the pathogen. Because pathogens vary in their intracellular habitat, replication rate, virulence mechanism, type of infection caused, and the nature of inflammation induced, we surmised that some of these factors may have an impact on the differentiation program of CD8+ T cells. By cloning the gene for OVA into LM and ST, we have comparatively evaluated CD8+ T cell responses against the same protein expressed by these intracellular bacteria. Our data show that the CD8+ priming and differentiation program is highly sensitive to modulation by the pathogen life style.
Both CD4+ and CD8+ T cells are important for effective clearance of intracellular bacteria such as LM (24), ST (28, 38), and M. tuberculosis (27). The Ag presentation, CD8+ T cell differentiation, and memory following infection with virulent ST have not been addressed previously. Although both LM and ST survive within APCs, they exhibit differences in their intracellular life style (39). LM escapes from the phagosome and proliferates in the cytosol of infected cells (40). In contrast, ST replicates inside the phagosome that poses a hostile and changing environment characterized by poor nutrient content, progressive decrease of the pH, and delivery of antibacterial peptides and lysosomal enzymes (41). Such bacteria appear to have evolved impressive strategies to adapt to and eventually resist these hostile conditions, thus exhibiting a state of metabolic adaptation to the imposed stress (42, 43). The delay in CD8+ T cell priming during ST-OVA infection appears to be related to its phagosomal life style. We have reported previously that another intracellular bacterium, Mycobacterium bovis (bacillus Calmette-Guerin (BCG)), which also resides within phagosomes, induces delayed CD8+ T cell priming (33). However, with BCG the delay in CD8+ T cell priming may be attributable to the very low replication rate of the bacterium (doubling time >24 h) (44, 45). As ST replicates (doubling time 26 min) even faster than LM, the delay in CD8+ T cell priming could not be due to the replication rate of the bacterium. Furthermore, on day 2 after infection, the bacterial burden of LM-OVA- and ST-OVA-infected mice was similar. Thus, ST-OVA-infected mice fail to mount a prompt CD8+ T cell response despite the rapid increase in pathogen load. Several other mechanisms could account for the delayed and muted T cell activation during ST infection. Because clonal expansion of T cells after Ag presentation is governed to a large extent by the local cytokine milieu (46), it is possible that ST infection does not generate a cytokine milieu that is necessary for massive clonal expansion of primed T cells. ST infection has been shown to result in potent immune suppression (47, 48), which could also influence the clonal proliferation of T cells in vivo.
Both LM-OVA as well as ST-OVA express high levels of OVA; however, the expression of OVA by ST-OVA appears to be higher. Furthermore, OVA is secreted by LM-OVA, whereas in case of ST-OVA it is not secreted. It may be speculated that this may influence T cell priming; however, it has been previously reported that the timing, expansion, and contraction of CD8+ T cell response are similar for secreted and nonsecreted Ags (49). Similarly, in our previous study with BCG-OVA, delayed and muted CD8+ T cell priming was noted even when OVA was secreted. When the overall response to ST infection is assessed, based on CD62L down-regulation on all endogenous CD8 T cells, it was noted that CD8 T cell activation after ST infection occurs only beyond day 7. This suggests that Ag presentation is generally delayed to ST Ags. Because one can expect that ST would have both secreted and nonsecreted self Ags, our observations suggest that the delayed T cell response to ST-OVA is not a result of nonsecretion.
A surprising finding is that even memory CD8+ T cells (generated after LM-OVA infection) are unable to proliferate rapidly when adoptively transferred into recipient mice and challenged with ST-OVA infection. This raises an important question: how can vaccine-induced memory CD8+ T cells facilitate protection against a pathogen whose Ags are sequestered from being processed and presented in the context of MHC class I molecules? In such a scenario, irrespective of the number of memory T cells generated, they will not be able to expand into effectors rapidly. Thus, vaccine formulations against such pathogens will need to consider other strategic ways of enhancing Ag presentation.
However, despite the phagosomal residence of ST, Ag presentation, albeit delayed, does occur. Recently, many potential routes of cross-presenting phagosomal Ags on MHC class I molecules have been suggested (50, 51). Dendritic cells may pick up exogenous Ag from dying APCs and present it to CD8+ T cells (52). ST does induce rapid death of macrophages and dendritic cells (53, 54). It is, however, not clear how efficient cross-priming is in comparison with the classical Ag-processing pathway (55). Our data indicate that the primary CD8+ T cell response induced by ST-OVA is not potent in magnitude. First, the numbers of OVA-specific CD8+ T cells after ST infection never achieve the magnitude seen after an acute LM or other viral infections. Second, at day 7 after infection, the majority of the primed cells do not display an effector phenotype, suggesting a weaker stimulation. Third, the CD8+ T cell response seems to be mainly CD4+ T cell dependent (our unpublished data). Many other reports also suggest that CD8+ T cell responses are more dependent on CD4+ T cells in cases of immunization with weaker immunogens (56–59).
Although the central and effector subsets of memory CD8+ T cells do exist, the pathway that CD8+ T cells undertake to differentiate into memory cells remains controversial. According to one model, naive CD8+ T cells acquire an effector phenotype rapidly, and some of the primed effectors gradually differentiate further into central memory cells (19). The second model proposes that naive CD8+ T cells differentiate first into the central phenotype cells (18, 60). When the stimulation is stronger, the cells differentiate further into effector cells and some effectors slowly differentiate back to the central phenotype. The third model indicates that both effector and central phenotype cells are distinct lineages in a differentiation pathway, and do not interconvert (61, 62). We previously showed that CD8+ T cells primed during BCG-OVA infection (63) differentiated directly into central phenotype and that the majority of the primed cells did not differentiate into effectors. It appeared that weaker stimulation would evoke primarily a central phenotype. After ST-OVA infection, we observed a small population of cycling cells displaying central phenotype at day 7, correlating to the potentially weak stimulation evoked. However, this was followed by a gradual development of effector phenotype cells from day 14 onward. After the peak effector T cell response, a gradual and progressive increase in the numbers of cells displaying an effector memory phenotype (CD62LlowIL-7Rαhigh) was noticeable. Even after accelerated pathogen clearance with antibiotics, such effector memory phenotype cells did not appear to differentiate further into the central memory phenotype. Thus, it is plausible that the central and effector phenotype cells represent separate lineages (62). However, the CD8+ T cell differentiation pathway may be sensitive to modulation by pathogens, and the specific interplay of host cells with varied pathogens may explain the occurrence of the different differentiation models.
During ST-OVA infection, the numbers of OVA-specific CD8+ T cells peaked around the third week of infection, and their numbers did not increase further despite persistence of ST-OVA. Removal of ST-OVA after day 30 with antibiotics did not change the numbers of OVA-specific CD8+ T cells either. This was also noted with the BCG-OVA infection model (33). It is quite likely that a feedback mechanism operates to limit Ag presentation after the peak of effector T cell response (5). Primed T cells and inflammatory mediators would kill Ag-bearing cells rapidly and curtail Ag presentation. Indeed, the cycling of OVA-specific CD8+ T cells during ST-OVA infection was reduced profoundly after the third week of infection, indicating a reduction in Ag presentation thereafter. Expression of CD69 in OVA-specific CD8+ T cells declined after day 30 of ST-OVA infection.
During acute or chronic viral infection models, it has been shown that primed CD8+ T cells are programmed to contraction immediately after day 7, and this contraction proceeds irrespective of pathogen persistence (6, 64). Our results suggest that while the contraction may be programmed, the onset and intensity of contraction may be pathogen dependent. The delayed contraction during ST-OVA or BCG-OVA infection (33, 63) may be related to the reduced stimulation that naive CD8+ T cells receive due to phagosomal residence of the pathogen. In case of ST-OVA, accelerated removal of ST-OVA by antibiotic treatment at day 30 did not influence contraction. In case of BCG-OVA, contraction (albeit lesser in magnitude) occurred despite the persistence of the pathogen (33). It is thus not clear what microenvironmental factors maintain primed CD8+ T cells for a prolonged duration during a chronic infection (64).
In chronic viral infections, viral persistence induced the exhaustion of CD8+ T cells (65) or persistence of nonfunctional CD8+ T cells (66). Our results indicate that CD8+ T cells induced during chronic ST infection remain functional during the prolonged effector phase. In contrast to intracellular bacteria, viruses induce potent activation of CD8+ T cells, and chronic activation of CD8+ T cells in such infection models may readily induce nonfunctional CD8+ T cells. During ST-OVA infection, the reduced and delayed stimulation of CD8+ T cells may shield them from becoming nonfunctional rapidly.
Considering that pathogens such as ST proliferate rapidly, it is essential that the immune system mount a prompt T cell response to curtail pathogen expansion. Our study highlights that both the naive and memory CD8+ T cells do not respond rapidly to the rapidly growing ST. Considering that the susceptible mice die within 7 days of infection, a delay in T cell priming can be viewed as catastrophic. Relative to CD8+ T cells, CD4+ T cells have been shown to be intrinsically slow in responding to pathogens in general (67). We also noted a delayed down-regulation of CD62L in CD4+ T cells during ST infection (data not shown). Therefore, the immune system may have to rely solely on the innate immune compartment to curb ST burden for the first few weeks of infection. It may be envisaged that down-regulation of innate immunity by host and/or pathogen factors can have more pronounced negative outcomes against rapidly growing phagosomal pathogens.
Footnotes
This work was supported by a grant from the Canadian Institutes of Health Research.
Abbreviations used in this paper: LM, Listeria monocytogenes; BCG, bacillus Calmette-Guérin; BHI, brain-heart infusion; ML, minimal Luria-Bertani; ST, Salmonella enterica, serovar Typhimurium.
Disclosures
The authors have no financial conflict of interest.
References
- 1.Bevan MJ. Antigen presentation to cytotoxic T lymphocytes in vivo. J Exp Med. 1995;182:639–634. doi: 10.1084/jem.182.3.639. [DOI] [PMC free article] [PubMed] [Google Scholar]
- 2.Kaech SM, Ahmed R. Memory CD8+ T cell differentiation: initial antigen encounter triggers a developmental program in naive cells. Nat Immunol. 2001;2:415–422. doi: 10.1038/87720. [DOI] [PMC free article] [PubMed] [Google Scholar]
- 3.Van Stipdonk MJ, Lemmens EE, Schoenberger SP. Naive CTLs require a single brief period of antigenic stimulation for clonal expansion and differentiation. Nat Immunol. 2001;2:423–429. doi: 10.1038/87730. [DOI] [PubMed] [Google Scholar]
- 4.Mercado R, Vijh S, Allen SE, Kerksiek K, Pilip IM, Pamer EG. Early programming of T cell populations responding to bacterial infection. J Immunol. 2000;165:6833–6839. doi: 10.4049/jimmunol.165.12.6833. [DOI] [PubMed] [Google Scholar]
- 5.Wong P, Pamer EG. Feedback regulation of pathogen-specific T cell priming. Immunity. 2003;18:499–494. doi: 10.1016/s1074-7613(03)00081-5. [DOI] [PubMed] [Google Scholar]
- 6.Badovinac VP, Porter BB, Harty JT. Programmed contraction of CD8+ T cells after infection. Nat Immunol. 2002;3:619–614. doi: 10.1038/ni804. [DOI] [PubMed] [Google Scholar]
- 7.Kagi D, Vignaux F, Ledermann B, Burki K, Depraetere V, Nagata S, Hengartner H, Golstein P. Fas and perforin pathways as major mechanisms of T cell-mediated cytotoxicity. Science. 1994;265:528–530. doi: 10.1126/science.7518614. [DOI] [PubMed] [Google Scholar]
- 8.Nagata S, Golstein P. The Fas death factor. Science. 1995;267:1449–144. doi: 10.1126/science.7533326. [DOI] [PubMed] [Google Scholar]
- 9.Henkart PA. Lymphocyte-mediated cytotoxicity: two pathways and multiple effector molecules. Immunity. 1994;1:343–346. doi: 10.1016/1074-7613(94)90063-9. [DOI] [PubMed] [Google Scholar]
- 10.Hou S, Hyland L, Ryan KW, Portner A, Doherty PC. Virus-specific CD8+ T-cell memory determined by clonal burst size. Nature. 1994;369:652–654. doi: 10.1038/369652a0. [DOI] [PubMed] [Google Scholar]
- 11.Ahmed R, Gray D. Immunological memory and protective immunity: understanding their relation. Science. 1996;272:54–60. doi: 10.1126/science.272.5258.54. [DOI] [PubMed] [Google Scholar]
- 12.Sprent J, Tough DF. T cell death and memory. Science. 2001;293:245–244. doi: 10.1126/science.1062416. [DOI] [PubMed] [Google Scholar]
- 13.Wong P, Pamer EG. CD8 T cell responses to infectious pathogens. Annu Rev Immunol. 2003;21:29–24. doi: 10.1146/annurev.immunol.21.120601.141114. [DOI] [PubMed] [Google Scholar]
- 14.Kaech SM, Wherry EJ, Ahmed R. Effector and memory T-cell differentiation: implications for vaccine development. Nat Rev Immunol. 2002;2:251–262. doi: 10.1038/nri778. [DOI] [PubMed] [Google Scholar]
- 15.Dutton RW, Bradley LM, Swain SL. T cell memory. Annu Rev Immunol. 1998;16:201–204. doi: 10.1146/annurev.immunol.16.1.201. [DOI] [PubMed] [Google Scholar]
- 16.Oehen S, Brduscha RK. Differentiation of naive CTL to effector and memory CTL: correlation of effector function with phenotype and cell division. J Immunol. 1998;161:5338–5346. [PubMed] [Google Scholar]
- 17.Usherwood EJ, Hogan RJ, Crowther G, Surman SL, Hogg TL, Altman JD, Woodland DL. Functionally heterogeneous CD8+ T-cell memory is induced by Sendai virus infection of mice. J Virol. 1999;73:7278–7286. doi: 10.1128/jvi.73.9.7278-7286.1999. [DOI] [PMC free article] [PubMed] [Google Scholar]
- 18.Sallusto F, Lenig D, Forster R, Lipp M, Lanzavecchia A. Two subsets of memory T lymphocytes with distinct homing potentials and effector functions. Nature. 1999;401:708–712. doi: 10.1038/44385. [DOI] [PubMed] [Google Scholar]
- 19.Wherry EJ, Teichgraber V, Becker TC, Masopust D, Kaech SM, Antia R, von Andrian UH, Ahmed R. Lineage relationship and protective immunity of memory CD8 T cell subsets. Nat Immunol. 2003;4:225–234. doi: 10.1038/ni889. [DOI] [PubMed] [Google Scholar]
- 20.Champagne P, Ogg GS, King AS, Knabenhans C, Ellefsen K, Nobile M, Appay V, Rizzardi GP, Fleury S, Lipp M, et al. Skewed maturation of memory HIV-specific CD8 T lymphocytes. Nature. 2001;410:106–104. doi: 10.1038/35065118. [DOI] [PubMed] [Google Scholar]
- 21.Appay V, Dunbar PR, Callan M, Klenerman P, Gillespie GM, Papagno L, Ogg GS, King A, Lechner F, Spina CA, et al. Memory CD8+ T cells vary in differentiation phenotype in different persistent virus infections. Nat Med. 2002;8:379–385. doi: 10.1038/nm0402-379. [DOI] [PubMed] [Google Scholar]
- 22.Masopust D, Vezys V, Marzo AL, Lefrancois L. Preferential localization of effector memory cells in nonlymphoid tissue. Science. 2001;291:2413–2417. doi: 10.1126/science.1058867. [DOI] [PubMed] [Google Scholar]
- 23.Reinhardt RL, Khoruts A, Merica R, Zell T, Jenkins MK. Visualizing the generation of memory CD4 T cells in the whole body. Nature. 2001;410:101–104. doi: 10.1038/35065111. [DOI] [PubMed] [Google Scholar]
- 24.Harty JT, Bevan MJ. CD8+ T cells specific for a single nonamer epitope of Listeria monocytogenes are protective in vivo. J Exp Med. 1992;175:1531–1538. doi: 10.1084/jem.175.6.1531. [DOI] [PMC free article] [PubMed] [Google Scholar]
- 25.Roberts AD, Ordway DJ, Orme IM. Listeria monocytogenes infection in β2 microglobulin-deficient mice. Infect Immun. 1993;61:1113–1116. doi: 10.1128/iai.61.3.1113-1116.1993. [DOI] [PMC free article] [PubMed] [Google Scholar]
- 26.White DW, Harty JT. Perforin-deficient CD8+ T cells provide immunity to Listeria monocytogenes by a mechanism that is independent of CD95 and IFN-γ but requires TNF-α. J Immunol. 1998;160:898–905. [PubMed] [Google Scholar]
- 27.Flynn JL, Goldstein MM, Triebold KJ, Koller B, Bloom BR. Major histocompatibility complex class I-restricted T cells are required for resistance to Mycobacterium tuberculosis infection. Proc Natl Acad Sci USA. 1992;89:12013–12017. doi: 10.1073/pnas.89.24.12013. [DOI] [PMC free article] [PubMed] [Google Scholar]
- 28.Lo WF, Ong H, Metcalf ES, Soloski MJ. T cell responses to Gram-negative intracellular bacterial pathogens: a role for CD8+ T cells in immunity to Salmonella infection and the involvement of MHC class Ib molecules. J Immunol. 1999;162:5398–5406. [PubMed] [Google Scholar]
- 29.Mittrucker HW, Kaufmann SH. Immune response to infection with Salmonella typhimurium in mice. J Leukocyte Biol. 2000;67:457–463. doi: 10.1002/jlb.67.4.457. [DOI] [PubMed] [Google Scholar]
- 30.Takahashi N, Orita T, Hirose M. Production of chicken ovalbumin in Escherichia coli. Gene. 1995;161:211–214. doi: 10.1016/0378-1119(95)00234-w. [DOI] [PubMed] [Google Scholar]
- 31.Niedergang F, Sirard JC, Blanc CT, Kraehenbuhl JP. Entry and survival of Salmonella typhimurium in dendritic cells and presentation of recombinant antigens do not require macrophage-specific virulence factors. Proc Natl Acad Sci USA. 2000;97:14650–14655. doi: 10.1073/pnas.97.26.14650. [DOI] [PMC free article] [PubMed] [Google Scholar]
- 32.Schodel F, Milich DR, Will H. Hepatitis B virus nucleocapsid/pre-S2 fusion proteins expressed in attenuated Salmonella for oral vaccination. J Immunol. 1990;145:4317–4321. [PubMed] [Google Scholar]
- 33.Dudani R, Chapdelaine Y, Faassen HH, Smith DK, Shen H, Krishnan L, Sad S. Multiple mechanisms compensate to enhance tumor-protective CD8+ T cell response in the long-term despite poor CD8+ T cell priming initially: comparison between an acute versus a chronic intracellular bacterium expressing a model antigen. J Immunol. 2002;168:5737–5745. doi: 10.4049/jimmunol.168.11.5737. [DOI] [PubMed] [Google Scholar]
- 34.Lyons AB, Parish CR. Determination of lymphocyte division by flow cytometry. J Immunol Methods. 1994;171:131–134. doi: 10.1016/0022-1759(94)90236-4. [DOI] [PubMed] [Google Scholar]
- 35.Tough DF, Sprent J. Turnover of naive- and memory-phenotype T cells. J Exp Med. 1994;179:1127–114. doi: 10.1084/jem.179.4.1127. [DOI] [PMC free article] [PubMed] [Google Scholar]
- 36.Barber DL, Wherry EJ, Ahmed R. Cutting edge: rapid in vivo killing by memory CD8 T cells. J Immunol. 2003;171:27–24. doi: 10.4049/jimmunol.171.1.27. [DOI] [PubMed] [Google Scholar]
- 37.Byers AM, Kemball CC, Moser JM, Lukacher AE. Cutting edge: rapid in vivo CTL activity by polyoma virus-specific effector and memory CD8+ T cells. J Immunol. 2003;171:17–21. doi: 10.4049/jimmunol.171.1.17. [DOI] [PubMed] [Google Scholar]
- 38.Raupach B, Kaufmann SH. Bacterial virulence, proinflammatory cytokines and host immunity: how to choose the appropriate Salmonella vaccine strain? Microbes Infect. 2001;3:1261–1269. doi: 10.1016/s1286-4579(01)01486-1. [DOI] [PubMed] [Google Scholar]
- 39.Kaufmann SH, Raupach B, Finlay BB. Introduction: microbiology and immunology: lessons learned from. Salmonella Microbes Infect. 2001;3:1177–1181. doi: 10.1016/s1286-4579(01)01498-8. [DOI] [PubMed] [Google Scholar]
- 40.Portnoy DA, Jacks PS, Hinrichs DJ. Role of hemolysin for the intracellular growth of Listeria monocytogenes. J Exp Med. 1988;167:1459–1471. doi: 10.1084/jem.167.4.1459. [DOI] [PMC free article] [PubMed] [Google Scholar]
- 41.Jones BD, Falkow S. Salmonellosis: host immune responses and bacterial virulence determinants. Annu Rev Immunol. 1996;14:533–561. doi: 10.1146/annurev.immunol.14.1.533. [DOI] [PubMed] [Google Scholar]
- 42.Fields PI, Groisman EA, Heffron F. A Salmonella locus that controls resistance to microbicidal proteins from phagocytic cells. Science. 1989;243:1059–1062. doi: 10.1126/science.2646710. [DOI] [PubMed] [Google Scholar]
- 43.Steele-Mortimer O, Meresse S, Gorvel JP, Toh BH, Finlay BB. Biogenesis of Salmonella typhimurium-containing vacuoles in epithelial cells involves interactions with the early endocytic pathway. Cell Microbiol. 1999;1:33–49. doi: 10.1046/j.1462-5822.1999.00003.x. [DOI] [PubMed] [Google Scholar]
- 44.Van Faassen H, Dudani R, Krishnan L, Sad S. Prolonged antigen presentation, APC−, and CD8+ T cell turnover during mycobacterial infection: comparison with Listeria monocytogenes. J Immunol. 2004;172:3491–3500. doi: 10.4049/jimmunol.172.6.3491. [DOI] [PubMed] [Google Scholar]
- 45.North RJ, Izzo AA. Mycobacterial virulence: virulent strains of Mycobacteria tuberculosis have faster in vivo doubling times and are better equipped to resist growth-inhibiting functions of macrophages in the presence and absence of specific immunity. J Exp Med. 1993;177:1723–1733. doi: 10.1084/jem.177.6.1723. [DOI] [PMC free article] [PubMed] [Google Scholar]
- 46.Banchereau J, Steinman RM. Dendritic cells and the control of immunity. Nature. 1998;392:245–244. doi: 10.1038/32588. [DOI] [PubMed] [Google Scholar]
- 47.Al Ramadi BK, Brodkin MA, Mosser DM, Eisenstein TK. Immunosuppression induced by attenuated Salmonella: evidence for mediation by macrophage precursors. J Immunol. 1991;146:2737–2746. [PubMed] [Google Scholar]
- 48.Hassan JO, Curtiss R., III Virulent Salmonella typhimurium-induced lymphocyte depletion and immunosuppression in chickens. Infect Immun. 1994;62:2027–2036. doi: 10.1128/iai.62.5.2027-2036.1994. [DOI] [PMC free article] [PubMed] [Google Scholar]
- 49.Shen H, Miller JF, Fan X, Kolwyck D, Ahmed R, Harty JT. Compartmentalization of bacterial antigens: differential effects on priming of CD8 T cells and protective immunity. Cell. 1998;92:535–545. doi: 10.1016/s0092-8674(00)80946-0. [DOI] [PubMed] [Google Scholar]
- 50.Schaible UE, Winau F, Sieling PA, Fischer K, Collins HL, Hagens K, Modlin RL, Brinkmann V, Kaufmann SH. Apoptosis facilitates antigen presentation to T lymphocytes through MHC-I and CD1 in tuberculosis. Nat Med. 2003;9:1039–1046. doi: 10.1038/nm906. [DOI] [PubMed] [Google Scholar]
- 51.Houde M, Bertholet S, Gagnon E, Brunet S, Goyette G, Laplante A, Princiotta MF, Thibault P, Sacks D, Desjardins M. Phagosomes are competent organelles for antigen cross-presentation. Nature. 2003;425:402–404. doi: 10.1038/nature01912. [DOI] [PubMed] [Google Scholar]
- 52.Albert ML, Sauter B, Bhardwaj N. Dendritic cells acquire antigen from apoptotic cells and induce class I-restricted CTLs. Nature. 1998;392:86–89. doi: 10.1038/32183. [DOI] [PubMed] [Google Scholar]
- 53.Hersh D, Monack DM, Smith MR, Ghori N, Falkow S, Zychlinsky A. The Salmonella invasin SipB induces macrophage apoptosis by binding to caspase-1. Proc Natl Acad Sci USA. 1999;96:2396–2401. doi: 10.1073/pnas.96.5.2396. [DOI] [PMC free article] [PubMed] [Google Scholar]
- 54.Van der Velden AW, Lindgren SW, Worley MJ, Heffron F. Salmonella pathogenicity island 1-independent induction of apoptosis in infected macrophages by Salmonella enterica serotype typhimurium. Infect Immun. 2000;68:5702–5709. doi: 10.1128/iai.68.10.5702-5709.2000. [DOI] [PMC free article] [PubMed] [Google Scholar]
- 55.Freigang S, Egger D, Bienz K, Hengartner H, Zinkernagel RM. Endogenous neosynthesis vs. cross-presentation of viral antigens for cytotoxic T cell priming. Proc Natl Acad Sci USA. 2003;100:13477–13482. doi: 10.1073/pnas.1835685100. [DOI] [PMC free article] [PubMed] [Google Scholar]
- 56.Sun JC, Bevan MJ. Defective CD8 T cell memory following acute infection without CD4 T cell help. Science. 2003;300:339–342. doi: 10.1126/science.1083317. [DOI] [PMC free article] [PubMed] [Google Scholar]
- 57.Shedlock DJ, Shen H. Requirement for CD4 T cell help in generating functional CD8 T cell memory. Science. 2003;300:337–339. doi: 10.1126/science.1082305. [DOI] [PubMed] [Google Scholar]
- 58.Marzo AL, Vezys V, Klonowski KD, Lee SJ, Muralimohan G, Moore M, Tough DF, Lefrancois L. Fully functional memory CD8 T cells in the absence of CD4 T cells. J Immunol. 2004;173:969–975. doi: 10.4049/jimmunol.173.2.969. [DOI] [PubMed] [Google Scholar]
- 59.Rock KL, Clark K. Analysis of the role of MHC class II presentation in the stimulation of cytotoxic T lymphocytes by antigens targeted into the exogenous antigen-MHC class I presentation pathway. J Immunol. 1996;156:3721–3726. [PubMed] [Google Scholar]
- 60.Lanzavecchia A, Sallusto F. Progressive differentiation and selection of the fittest in the immune response. Nat Rev Immunol. 2002;2:982–987. doi: 10.1038/nri959. [DOI] [PubMed] [Google Scholar]
- 61.Baron V, Bouneaud C, Cumano A, Lim A, Arstila TP, Kourilsky P, Ferradini L, Pannetier C. The repertoires of circulating human CD8+ central and effector memory T cell subsets are largely distinct. Immunity. 2003;18:193–204. doi: 10.1016/s1074-7613(03)00020-7. [DOI] [PubMed] [Google Scholar]
- 62.Marzo AL, Klonowski KD, Le Bon A, Borrow P, Tough DF, Lefrancois L. Initial T cell frequency dictates memory CD8+ T cell lineage commitment. Nat Immunol. 2005;6:793–799. doi: 10.1038/ni1227. [DOI] [PMC free article] [PubMed] [Google Scholar]
- 63.Van Faassen H, Saldanha M, Gilbertson D, Dudani R, Krishnan L, Sad S. Reducing the stimulation of CD8+ T cells during infection with intracellular bacteria promotes differentiation primarily into a central (CD62LhighCD44high) subset. J Immunol. 2005;174:5341–5350. doi: 10.4049/jimmunol.174.9.5341. [DOI] [PubMed] [Google Scholar]
- 64.Wherry EJ, Barber DL, Kaech SM, Blattman JN, Ahmed R. Antigen-independent memory CD8 T cells do not develop during chronic viral infection. Proc Natl Acad Sci USA. 2004;101:16004–16009. doi: 10.1073/pnas.0407192101. [DOI] [PMC free article] [PubMed] [Google Scholar]
- 65.Moskophidis D, Lechner F, Pircher H, Zinkernagel RM. Virus persistence in acutely infected immunocompetent mice by exhaustion of antiviral cytotoxic effector T cells. [Published erratum appears in 1993 Nature 364: 262.] Nature. 1993;362:758–761. doi: 10.1038/362758a0. [DOI] [PubMed] [Google Scholar]
- 66.Zajac AJ, Blattman JN, Murali KK, Sourdive DJ, Suresh M, Altman JD, Ahmed R. Viral immune evasion due to persistence of activated T cells without effector function. J Exp Med. 1998;188:2205–2213. doi: 10.1084/jem.188.12.2205. [DOI] [PMC free article] [PubMed] [Google Scholar]
- 67.Foulds KE, Zenewicz LA, Shedlock DJ, Jiang J, Troy AE, Shen H. Cutting edge: CD4 and CD8 T cells are intrinsically different in their proliferative responses. J Immunol. 2002;168:1528–1532. doi: 10.4049/jimmunol.168.4.1528. [DOI] [PubMed] [Google Scholar]