

Abstract
In studies of patients with multiple myeloma (MM), gene expression profiling (GEP) of myeloma cells demonstrates substantially higher expression of MMSET, FGFR3, CCND3, CCND1, MAF, and MAFB—the partner genes of 14q32 translocations—than GEP of plasma cells from healthy individuals. Interphase fluorescent in situ hybridization (FISH) was used to discriminate between chromosomal translocations involving different regions of the immunoglobulin heavy chain (IGH) genes at 14q32. With special probes designed for the constant region (IGHC) and the variable region (IGHV), IGH translocations were shown to be definite, non-random chromosomal fusions of IGHC with the loci of FGFR3, CCND1, CCND3, MAF, and MAFB genes; and IGHV with the locus of MMSET gene. When correlated with GEP results, the IGH translocations were found to drive expression levels of the partner genes to significantly higher levels (spikes) than copy-number variations. Hence, 42% of IGH translocations were identified among newly diagnosed MM patients (448/1,060). As GEP has become essential for assessing cancer risk, this novel approach is highly consistent with the cytogenetic features of the chromosomal translocations to effectively stratify molecular subgroups of MM on the basis of gene expression profiles of the IGH translocation partner genes in myeloma cells.
Keywords: Multiple myeloma, Chromosomal translocations, Gene expression profile
Introduction
Multiple myeloma (MM) is a clonal expansion of malignant plasma cells in the bone marrow. Myeloma plasma cells are terminally differentiated B cells, but genetic mutations arise throughout disease progression (Kuehl et al., 2002). A number of different cytogenetic aberrations have been reported, some of which signify a poor prognosis for patients (Liang et al., 1979; Dewald et al., 1985; Tricot et al., 1995, 1997; Seong et al., 1998; Moreau et al., 2002; Fonseca et al., 2004). The common structural aberrations are translocations of the immunoglobulin heavy chain (IGH) region at 14q32 with a number of different partner chromosomes. The partner genes involved in these translocations are Wolf-Hirschhorn syndrome candidate 1 (WHSC1, also known as MMSET), fibroblast growth factor receptor 3 (FGFR3) on chromosome 4p16, cyclin D3 (CCND3) on 6p21, cyclin D1 (CCND1) on 11q13; V-maf musculoaponeurotic fibrosarcoma oncogene homolog (MAF) on 16q23, and MAF homolog B (MAFB) on 20q12. Translocations of 14q32 are observed in approximately 40% of patients with MM (Liang et al., 1979; Dewald et al. 1985; Gould et al. 1988; Seto et al., 1992; Bergsagel et al., 1996, 2001). Three IGH translocations are considered high-risk cytogenetic aberrations; these are t(4;14), t(14;16), and t(14;20) (Chesi et al., 1998a,b; Santra et al., 2003; Boersma-Vreugdenhil et al., 2004; Hurt et al., 2004; Ross et al., 2010; Kalff et al., 2012). Such cytogenetic aberrations affect oncogenes recombined into the IGH region and may lead to increased gene transcription and downstream networks that promote tumor cell proliferation and drug resistance (Joy Ho et al., 2002; Sawyer, 2011; Kalff et al., 2012).
Gene expression profiling (GEP) has become an efficient tool for assessing risk factors on the basis of global mRNA expression signatures in cancer cells (Simon, 2006). Spiked expression of the 14q32 translocation partner genes juxtaposed to the IGH region, presumably reflecting translocations (Kassambara et al., 2012), has been used to categorize myeloma into molecular subtypes with prognostic implications (Zhan et al., 2006). However, high expression of these genes may also reflect copy-number variations. To accurately define the gene expression thresholds that are reflective of translocation as opposed to variation in gene copy numbers, we correlated each of FISH-defined IGH translocations with the GEP signal intensities of the specific partner-gene probe sets. Our results provide a single gene-based algorithm, determined by GEP signal as a predictor of IGH translocations, for molecularly classifying MM patients.
Materials and Methods
Patient Materials
Bone marrow aspirates were obtained from healthy donors and from patients with MM at diagnosis and during follow-up visits to the Myeloma Institute for Research and Therapy at the University of Arkansas for Medical Sciences (UAMS). GEP and cytogenetic analyses were performed on the bone marrow specimens (Tricot et al., 1997; Zhan et al., 2006), and slides were also prepared for interphase fluorescent in situ hybridization (FISH) analysis. The study was approved by the Institutional Review Board of UAMS. Informed consents were obtained in accordance with the Declaration of Helsinki and are kept on record.
Preparation of DNA Probes for FISH
FISH probes were generated from specific DNA templates for IGHC, IGHV, and the six translocation partner genes (MMSET, FGFR3, CCND1, CCND3, MAF, and MAFB) that were carried by the bacterial artificial chromosome (BAC) or P1 artificial chromosome (PAC) cloning system. A small radiolabeled (32P) DNA probe was designed to screen BAC and PAC libraries (BACPAC Resources Center, Oakland, CA). The gene-specific BAC/PAC clones, ranging from 150 to 240 kb, were purchased (BACPAC Resources Center). The chromosomal locations were verified with gene-specific PCR and nucleotide sequencing methods (Table 1). The BAC/PAC DNA templates were labeled in nick-translation reactions to incorporate green or red fluorochrome-conjugated dUTP (Abbott Molecular, Des Plaines, IL) into the probes. Human placental DNA and herring sperm DNA were added to block repetitive DNA sequences. All probes were validated by FISH on normal metaphase chromosomes at the Cytogenetics Laboratory at UAMS and on healthy donor interphase plasma cells. To protect the intellectual property, all BAC/PAC clone IDs are protected by the U.S. Patent and Trademark Office under Provisional Application No. 61/726,327. Nevertheless, the fluorochrome-labeled, ready-to-use, DNA probes and probe sets are currently available upon requests, please contact the corresponding author.
Table 1. DNA probes used in FISH analyses.
| BAC/PAC Probes | Gene Cytogenetic Bands | Chromosomal Locations (Mba) | Length of Inserts (kbb) |
|---|---|---|---|
| IGHC | 14q32 | 106.08–106.32 | 240 |
| IGHV | 14q32 | 106.69–106.84 | 150 |
| MMSET | 4p16 | 1.86–2.06 | 190 |
| FGFR3 | 4p16 | 1.59–1.79 | 190 |
| CCND3 | 6p21 | 41.80–41.97 | 170 |
| CCND1 | 11q13 | 69.15–69.37 | 220 |
| MAF | 16q23 | 80.63–80.80 | 170 |
| MAFB | 20q12 | 39.19–39.34 | 155 |
Mb, mega-basepairs from the p-arm telomere.
kb, kilo-basepairs.
Interphase FISH Protocol
Density gradient centrifugation (Lymphocyte Separation Medium, density 1.077 g/mL; Mediatech Inc., Manassas, VA) was used to remove erythrocytes from bone marrow aspirates. Each spot on the slides was prepared with 105 leukocytes by centrifugation (CytoSpin; Thermo Scientific, Pittsburg, PA) and then fixed in 100% ethanol, baked at 37°C overnight, and stored at –20°C condition. Cytoplasmic immunoglobulin (cIg) light-chain restriction was determined with anti-human kappa- or lambda-chain antibody (Vector Laboratories, Burlingame, CA). Unstained bone marrow cells were permeabilized in 90% formamide/2× saline-sodium citrate (SSC) buffer prior to hybridization. Two sets of probe combinations were applied to each sample: IGHC or IGHV (green) mixed with a partner-gene probe (red). The reaction was set at a denaturing temperature of 75°C (15 minutes) and an annealing temperature of 42°C (overnight), and then continued with immunocytochemistry steps to distinguish plasma cells with cIg isotype-specific antibody labeled with 7-amino-4-methylcoumarin-3-acetic acid (AMCA, blue). IGH translocations were identified as a yellow signal that resulted from the juxtaposition of a green IGHC or IGHV probe with a red partner-gene probe (Figure 1). Fifty myeloma cells that were positive for the kappa or lambda cIg isotype were scored per FISH. A universal cutoff of 20% (mean + 2*SD; Cremer et al., 2005) was applied to identify significant cytogenetic aberrations of chromosomal translocations.
Figure 1.
Interphase FISH of a bone marrow specimen of a patient with MM demonstrates reciprocal chromosomal translocations of t(4;14) that recombined FGFR3 with IGHC (a) and MMSET with IGHV (e) in myeloma cells with a cytoplasmic immunoglobulin (cIg) light-chain restriction (lambda). Random t(4;14) was not observed (b, d). The GEP values of FGFR3 (40,928), MMSET (8,688), and MAF (3,772) were above the baseline expression levels of healthy plasma cells. FISH-elucidated t(4;14) co-existed with a gain of MAF gene copy numbers (5×) (c, f). White bars = 2 μm (100× magnification).
GEP Procedure and Data Analyses
GEP was performed as previously described (Zhan et al., 2006) with the Affymetrix U133Plus2.0 microarray (Affymetrix, Santa Clara, CA). The MAS5 algorithm was used to normalize the expression profiling data. GEP data for the patients enrolled in the Total Therapy 2 (TT2) and Total Therapy 3 (TT3) protocols can be found in the NIH GEO omnibus (accession number GSE2658) and the European Bioinformatics Institute (EBI) ArrayExpress repository (accession number E-TABM-1138).
Assessment of IGH Translocations in the Training Set
With two sets of IGHC or IGHV probes mix, the bone marrow specimens were examined with cIg-guided interphase FISH. In the training set, 268 samples of patients with newly diagnosed MM (July 2008 to April 2012) were organized in a decremental order based on GEP values of the translocation-partner genes corresponding to the specific probe sets on the Affymetrix U133Plus2.0 microarray (Table 2). The selection of probe set was based on the best match of oligo sequences on the microarrays aligning with mRNA of a partner gene. To substantiate GEP values of the partner genes associated with 14q32 translocations, groups of samples with the highest expression levels (n≥10), intermediate levels (n≥10), and the lowest levels (n≥10) were screened with FISH; all samples in the training set with GEP intensity of a partner gene above 800 were subjected to the FISH study of IGHC or IGHV fusions. If the GEP values of a specimen indicated simultaneous expression spikes of multiple partner genes over the arbitrary thresholds (Zhan et al., 2006), FISH was performed with the specific probe sets for each of the translocations. Receiver Operating Characteristic (ROC) analysis was used to select an optimal threshold of expression value that discriminates the GEP spikes correlated with the visible evidence of the chromosomal translocations from the copy-number variations. FISH was performed on additional samples with expression spikes to validate the ROC threshold of each IGH translocation. The identified thresholds of 14q32 translocation–induced expression spikes in a training set were further tested in a set of 791 baseline samples of newly diagnosed patients (March 1998 – June 2008) in TT2 and TT3.
Table 2. ROC Thresholds of FISH-defined 14q32 translocations by GEP.
| Gene Symbol (Translocation) | Affymetrix U133plus 2.0 Probe Set | GEP Data Range (min/max) | Baseline Expression Level of Healthy PCs (n=25) | Cutoff for 14q32 Translocation-induced Spikes | Predictive Accuracy | Predictive Sensitivity |
|---|---|---|---|---|---|---|
| MMSET t(4;14) | 209054_s_at | 95.5/14,076.3 | 592.2 | 2,404.6 | 0.96 | 0.92 |
| FGFR3 t(4;14) | 204379_s_at | 2.3/64,609.9 | 41.6 | 6,558.4 | 0.88 | 0.90 |
| CCND3 t(6;14) | 201700_at | 118.3/41,251.9 | 2,111.7 | 15,696.4 | 0.92 | 1.0 |
| CCND1 t(11;14) | 208711_s_at | 7.6/52,628.5 | 435.0 | 5,525.2 | 0.88 | 0.87 |
| MAF t(14;16) | 206363_at | 1.9/39,839.7 | 577.8 | 5,096.9 | 0.91 | 1.0 |
| MAFB t(14;20) | 222670_s_at | 10.3/66,016.6 | 2,277.4 | 19,850.9 | 0.86 | 0.75 |
Results
GEP Values Are Highly Predictive of 14q32 Translocations
GEP of myeloma cells showed that expression values of MMSET, FGFR3, CCND1, CCND3, MAF, and MAFB genes were as much as 1,500-fold higher than in plasma cells of healthy individuals (Table 2). FISH and GEP data were combined to investigate expression spikes (Zhan et al., 2006; Kassambara et al., 2012) induced by IGH translocations. The ROC thresholds classify GEP values that are above the optimal cutoff as IGH translocations were detected by FISH, and GEP values below the cutoff as copy-number variations or infrequent recombination by FISH. The ROC curves showed significant accuracy and sensitivity at the selected cutoff for each IGH translocation by additional FISH analyses (Table 2).
Of the patients in the training set, 113 of 268 (42.2%) had GEP values above the optimal cutoffs and also IGH translocations visible with FISH (Table 3). When the equivalent ROC cutoffs were applied to the test set, 335 of 792 TT2 and TT3 patients (42.3%) had IGH translocations according to the GEP results. The proportions of predicted chromosomal translocations were similar to those of the training set (Table 3). Collectively, 448 of 1,060 MM samples (42.3%) had significantly spiked GEP values of MMSET [representing t(4;14)], CCND1, CCND3, MAF, and MAFB above FISH-defined 14q32 translocation thresholds. Among patients at diagnosis, t(11;14), t(4;14), and t(14;16) were the most frequent chromosomal translocations in the training set and the test set of MM (Table 3).
Table 3. 14q32 Translocation events in multiple myeloma.
| Translocations | Events per Training-set Population (n=268) (%) | Events per Test-set Population (n=792) (%) |
|---|---|---|
|
IGHV–MMSET t(4;14)(p16;q32) |
40 (14.9%) | 118 (14.9%) |
|
IGHC–FGFR3 t(4;14)(p16;q32)a |
27 (10.1%) | 77 (10.0%) |
|
IGHC–CCND3 t(6;14)(p21;q32) |
9 (3.4%) | 11 (1.4%) |
|
IGHC–CCND1 t(11;14)(q13;q32) |
52 (19.4%) | 157 (19.8%) |
|
IGHC–MAF t(14;16)(q32;q23) |
9 (3.4%) | 35 (4.4%) |
|
IGHC–MAFB t(14;20)(q32;q12) |
3 (1.1%) | 14 (1.8%) |
| Total | 113 (42.2%) | 335 (42.3%) |
Chromosomal translocation events of FGFR3 with IGH were always associated with the events of MMSET with IGH in 67% of MM patients who were defined as t(4;14); in the current study, overall t(4;14) translocation events were represented by MMSET translocations alone.
14q32 Translocations Were Non-random and Mutually Exclusive Events
In FISH experiments, an IGHC or an IGHV probe was individually paired with each specific partner gene probe to examine the corresponding chromosomal translocations and copy-number variations in myeloma cells. FISH results showed that 14q32 translocations of IGHC or IGHV with their partner genes were non-random recombination events. The t(4;14) translocations were mostly balanced reciprocal fusions of IGHC with FGFR3 and IGHV with MMSET (Figure 2). In MM, IGHC–FGFR3 events were always associated with IGHV–MMSET events (Figure 2Ba-b); in contrast, 33% of IGHV–MMSET events were not associated with IGHC–FGFR3 events (Figure 2Bc-d). The translocations t(11;14), t(6;14), t(14;16), and t(14;20) were essentially the unbalanced fusions of IGHC with one of the partner genes; IGHV fusion with these partner genes was a rare event.
Figure 2.
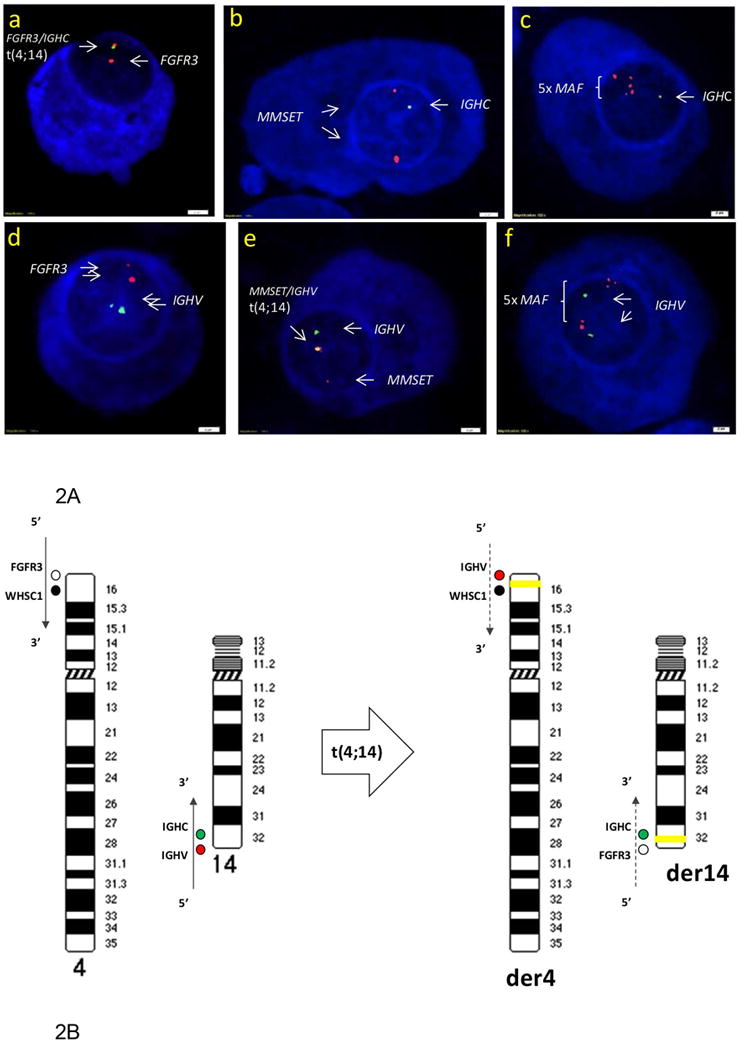
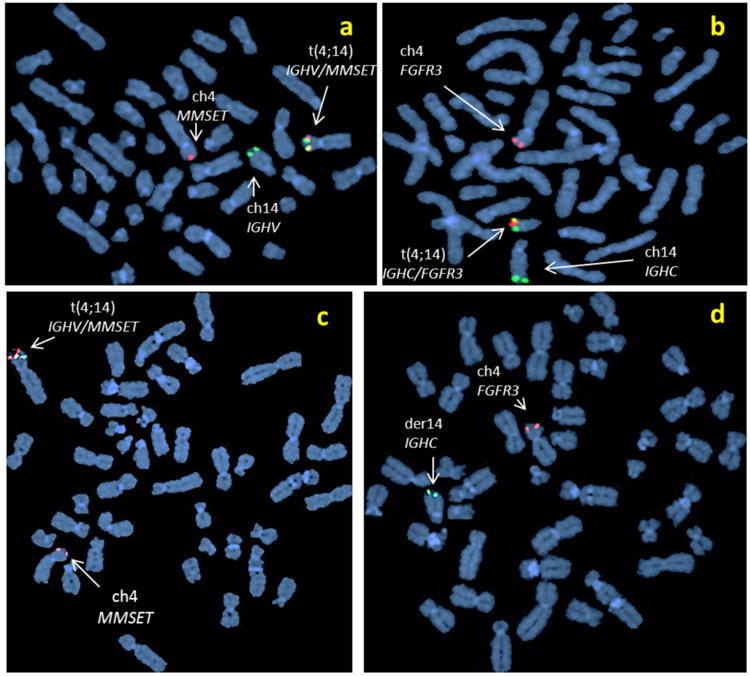
(A) diagram shows the chromosomal translocations of 4p16 and 14q32 that occur as the IGHV region (red) is juxtaposed with MMSET (black) at 4p16 (der4); the reciprocal exchange, FGFR3 (open circle) recombines with IGHC (green) at 14q32 (der14). The orientations of gene sequences (5′– 3′) are indicated by the arrows. Yellow bands represent chromosomal fusions. (B) FISH with the probe combinations for t(4;14) to examine metaphase chromosomes of a MM patients whose CD138+ PCs′ MMSET (7,113.0) and FGFR3 (17,524.2) expressions by GEP were above the threshold of IGH translocations demonstrates reciprocal fusions of IGHV/MMSET(a) and IGHC/FGFR3 (b); and FISH detected unbalanced t(4;14) in a human myeloma cell line (XG7) with IGHV/MMSET fusion (c) induced MMSET expression (3,309.2) above the threshold, but without a fusion of IGHC and FGFR3 that resulted in low FGFR3 expression at 44.7 (d) by GEP.
FISH also detected changes in gene copy numbers for IGH and partner genes (Figures 1 and 3). Expression levels of the partner genes were rarely related to somatic copy-number changes or to IGHV fusions with FGFR3, CCND1, CCND3, MAF, or MAFB genes. When GEP indicated simultaneously elevated expression of multiple partner genes, it was usually due to the co-existence of an IGH translocation-induced spike of a partner gene and copy-number variations related expression of the other partner genes whose levels were below FISH-defined thresholds of IGH translocation (Figures 1 and 3). Heterogeneous myeloma clones were present in a few cases; however, IGH translocations were mutually exclusive: one event per distinct clone.
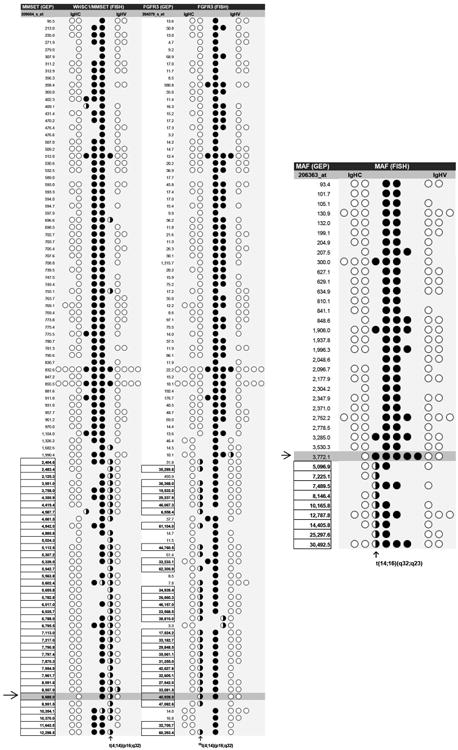
Figure 3.
In the training set of t(4;14) and t(14;16), patient samples were examined with the following FISH probe combinations: IGHC–MMSET, IGHV–MMSET, IGHC–FGFR3, IHGV–FGFR3, IGHC–MAF, and IHGV–MAF. IGHC and IGHV signals are indicated by open circles (○) in the columns to the left and right, respectively, of the columns for MMSET, FGFR3, or MAF signals, which are indicated by filled circles (●). FISH-identified chromosomal translocations between IGHV and MMMSET, IGHC and FGFR3 (§§), or IGHC/MAF are shown as half-filled circles (◑). All boxed numbers indicate FISH-confirmed IGH translocations with a partner gene whose expression also spiked above the threshold in GEP. The samples that GEP values were below the thresholds of IGH translocations were partially displayed.(→) and the highlighted rows indicate the case of reciprocal t(4;14) with both MMSET and FGFR3 expressions above the thresholds by GEP and copy number increase of MAF determined by the interphase FISH showing in Figure 1.
Discussion
Because of their design, commercially available FISH probes for 14q32 translocations are unable to resolve the precise fusions of IGHC and IGHV with their corresponding partner genes. We developed a series of probes that definitively map to IGHC, IGHV, and each of their partner genes (Table 1). Using DNA templates homologous to the target loci, we were able to unambiguously scrutinize fusions between each IGH segment (C or V) and one of the partner genes (Table 2). Our studies systematically explored all the possible genomic fusions of IGHC and IGHV with each of their partner chromosomes. We clearly demonstrated the evidence of that t(4;14) is essentially the IGHV region (from the 14q telomere) juxtaposed with MMSET at 4p16; and in the reciprocal exchange, FGFR3 (from 4p16) is recombined with the IGHC at 14q32 (Figure 1, 2). These results are in line with the hypothesis that t(4;14) results in MMSET on der(4) and FGFR3 on der(14) (Bergsagel et al., 1996; Joy Ho, 2002; Kuehl et al., 2002). Moreover, as the maximum value of the MMSET signal determined by GEP was 4.5-fold lower than that of FGFR3 (Table 2), our FISH analysis demonstrated that the orientation of the genes involved in t(4;14) is crucial to transcriptional regulation of the partner genes. The non-random chromosomal fusions of t(4;14) as reported here (Figure 2A) lend mechanistic support to the finding of bicistronic transcripts of 5′-IGHV–MMSET-3′ in primary myeloma cells and myeloma cell lines harboring t(4;14) as reported in our previous publication (Santra et al., 2003). Our current study further verified that IGHC–FGFR3 recombination aligned the genes with an orientation of downstream IGHC toward the 3′-end of FGFR3 located in tandem at the 14q telomere (Figure 2); unlike IGHV–MMSET fusion, no fused 5′-IGHC–FGFR3-3′ mRNA should be produced. IGHC translocations, rather than random genomic recombination, were also involved in the other IGH translocations, as our FISH studies revealed that almost all t(6;14), t(11;14), t(14;16) and t(14;20) occurred between IGHC and a partner gene.
The GEP values indicated that IGH translocation-induced MMSET, FGFR3, CCND3, CCND1, MAF, and MAFB spikes were substantially higher than the expression levels of these genes in healthy plasma cells (Table 2). In previous reports, arbitrary cutoffs of GEP values of these partner genes were used to assign molecular subgroups representing IGH translocation-related over-expression (Zhan et al., 2006; Kassambara et al., 2012). To determine whether IGH translocations, but not copy-number variations, drive the partner genes to distinct expression levels, we scrutinized the training set of myeloma cells using FISH with multiple sets of probes for IGHC and IGHV (on 14q32) combined with the partner genes on chromosomes 4, 6, 11, 16, and 20. Our study not only revealed the precise fusions of the constant region of IGH with the partner genes FGFR3, CCND1, CCND3, MAF, and MAFB—in contrast to the fusion of IGHV with MMSET—but also defined the thresholds that differentiate the gene expression levels of the partner genes driven by IGH translocations but not by copy-number variations suggesting the translocations are mutually exclusive: one event per distinct clone. The results also suggest that the constant region of IGH is a significantly more potent driver of expression upon genomic fusion. We believe that the enhancers in this region constitutively promote transcription of upstream genes in significantly greater quantities (Zaller et al., 1985; Cogné et al., 1994) than the promoter function of IGHV that activates downstream MMSET. In longitudinal follow-up samples, IGHC-induced expression spikes of FGFR3, CCND1, CCND3, MAF, and MAFB on GEP at diagnosis were consistently maintained at levels above the thresholds of 14q32 translocation, whereas high expression levels induced by copy-number variation were below the translocation-driven threshold, and could be transient.
The cutoff point for each translocation-induced expression spike in the training set was determined by comparing FISH and GEP analyses performed on the same specimens, and was validated in a test set of MM samples. The results showed that IGH translocations occurred with similar frequencies in both sets of patients (Table 3). Of 1,060 newly diagnosed patients, 42% had 14q32 translocation-associated overexpression of partner genes by GEP. The frequency of GEP-predicted IGH translocations is consistent with the frequency of IGH translocations in MM determined by FISH reported by other investigators (Lai et al., 1995; Taniwaki et al., 1996; Avet-Loiseau et al., 1999; Kuehl et al., 2002). This suggests that GEP is an accurate and compatible tool for cIg-guided FISH with combined probes of IGHC or IGHV and partners gene for the manual examination of bone marrow specimens for IGH translocations in MM.
Acknowledgments
This work was supported by a grant CA55819 from the National Cancer Institute. We thank the members of the Donna D. and Donald M. Lambert Laboratory of Myeloma Genetics, especially Yan Xiao, David R. Williams, Purvi Patel, and Tina A. Gomes; and Regina K. Binz at the Cytogenetics Lab of UAMS for technical support, as well as the physicians and nurses at the Myeloma Institute for Research and Therapy at the University of Arkansas for Medical Sciences (UAMS). Special thanks to our patients, without whose willingness to participate this study could not have been accomplished. We also thank the Office of Grants and Scientific Publications at UAMS for editorial assistance.
References
- Avet-Loiseau H, Brigaudeau C, Morineau N, Talmant P, Laï JL, Daviet A, Li JY, Praloran V, Rapp MJ, Harousseau JL, Facon T, Bataille R. High incidence of cryptic translocations involving the Ig heavy chain gene in multiple myeloma, as shown by fluorescence in situ hybridization. Genes Chromosomes Cancer. 1999;24:9–15. doi: 10.1002/(sici)1098-2264(199901)24:1<9::aid-gcc2>3.0.co;2-k. [DOI] [PubMed] [Google Scholar]
- Bergsagel PL, Chesi M, Nardini E, Brents LA, Kirby SL, Kuehl WM. Promiscuous translocations into immunoglobulin heavy chain switch regions in multiple myeloma. Proc Natl Acad Sci U S A. 1996;93:13931–13936. doi: 10.1073/pnas.93.24.13931. [DOI] [PMC free article] [PubMed] [Google Scholar]
- Bergsagel PL, Kuehl WM. Chromosome translocations in multiple myeloma. Oncogene. 2001;20:5611–5622. doi: 10.1038/sj.onc.1204641. [DOI] [PubMed] [Google Scholar]
- Boersma-Vreugdenhil GR, Kuipers J, Van Stralen E, Peeters T, Michaux L, Hagemeijer A, Pearson PL, Clevers HC, Bast BJ. The recurrent translocation t(14;20)(q32;q12) in multiple myeloma results in aberrant expression of MAFB: A molecular and genetic analysis of the chromosomal breakpoint. Br J Haematol. 2004;126:355–363. doi: 10.1111/j.1365-2141.2004.05050.x. [DOI] [PubMed] [Google Scholar]
- Chesi M, Bergsagel PL, Shonukan OO, Martelli ML, Brents LA, Chen T, Schröck E, Ried T, Kuehl WM. Frequent dysregulation of the c-maf proto-oncogene at 16q23 by translocation to an Ig locus in multiple myeloma. Blood. 1998;91:4457–4463. [PubMed] [Google Scholar]
- Chesi M, Nardini E, Lim RS, Smith KD, Kuehl WM, Bergsagel PL. The t(4;14) translocation in myeloma dysregulates both FGFR3 and a novel gene, MMSET, resulting in IgH/MMSET hybrid transcripts. Blood. 1998;92:3025–3034. [PubMed] [Google Scholar]
- Cogné M, Lansford R, Bottaro A, Zhang J, Gorman J, Young F, Cheng HL, Alt FW. A class switch control region at the 3′ end of the immunoglobulin heavy chain locus. Cell. 1994;77:737–747. doi: 10.1016/0092-8674(94)90057-4. [DOI] [PubMed] [Google Scholar]
- Cremer FW, Bila J, Buck I, Kartal M, Hose D, Ittrich C, et al. Delineation of distinct subgroups of multiple myeloma and a model for clonal evolution based on interphase cytogenetics. Gene Chr & Ca. 2005;44(2):194–203. doi: 10.1002/gcc.20231. [DOI] [PubMed] [Google Scholar]
- Dewald GW, Kyle RA, Hicks GA, Greipp PR. The clinical significance of cytogenetic studies in 100 patients with multiple myeloma, plasma cell leukemia, or amyloidosis. Blood. 1985;66:380–390. [PubMed] [Google Scholar]
- Fonseca R, Barlogie B, Bataille R, Bastard C, Bergsagel PL, Chesi M, Davies FE, Drach J, Greipp PR, Kirsch IR, Kuehl WM, Hernandez JM, Minvielle S, Pilarski LM, Shaughnessy JD, Jr, Stewart AK, Avet-Loiseau H. Genetics and cytogenetics of multiple myeloma: A workshop report. Cancer Res. 2004;64:1546–1558. doi: 10.1158/0008-5472.can-03-2876. [DOI] [PubMed] [Google Scholar]
- Gould J, Alexanian R, Goodacre A, Pathak S, Hecht B, Barlogie B. Plasma cell karyotype in multiple myeloma. Blood. 1988;71:453–456. [PubMed] [Google Scholar]
- Hurt EM, Wiestner A, Rosenwald A, Shaffer AL, Campo E, Grogan T, Bergsagel PL, Kuehl WM, Staudt LM. Overexpression of c-maf is a frequent oncogenic event in multiple myeloma that promotes proliferation and pathological interactions with bone marrow stroma. Cancer Cell. 2004;5:191–199. doi: 10.1016/s1535-6108(04)00019-4. [DOI] [PubMed] [Google Scholar]
- Joy Ho P Chromosomal and genetic abnormalities in myeloma. Clin Lab Haematol. 2002;24:259–269. doi: 10.1046/j.1365-2257.2002.00456.x. [DOI] [PubMed] [Google Scholar]
- Kalff A, Spencer A. The t(4;14) translocation and FGFR3 overexpression in multiple myeloma: prognostic implications and current clinical strategies. Blood Cancer J. 2012;2:e89. doi: 10.1038/bcj.2012.37. [DOI] [PMC free article] [PubMed] [Google Scholar]
- Kassambara A, Hose D, Moreaux J, Walker BA, Protopopov A, Reme T, Pellestor F, Pantesco V, Jauch A, Morgan G, Goldschmidt H, Klein B. Genes with a spike expression are clustered in chromosome (sub)bands and spike (sub)bands have a powerful prognostic value in patients with multiple myeloma. Haematologica. 2012;97:622–630. doi: 10.3324/haematol.2011.046821. [DOI] [PMC free article] [PubMed] [Google Scholar]
- Kuehl WM, Bergsagel PL. Multiple myeloma: Evolving genetic events and host interactions. Nat Rev Cancer. 2002;2:175–187. doi: 10.1038/nrc746. [DOI] [PubMed] [Google Scholar]
- Lai JL, Zandecki M, Mary JY, Bernardi F, Izydorczyk V, Flactif M, Morel P, Jouet JP, Bauters F, Facon T. Improved cytogenetics in multiple myeloma: A study of 151 patients including 117 patients at diagnosis. Blood. 1995;85:2490–2497. [PubMed] [Google Scholar]
- Liang W, Hopper JE, Rowley JD. Karyotypic abnormalities and clinical aspects of patients with multiple myeloma and related paraproteinemic disorders. Cancer. 1979;44:630–644. doi: 10.1002/1097-0142(197908)44:2<630::aid-cncr2820440233>3.0.co;2-g. [DOI] [PubMed] [Google Scholar]
- Moreau P, Facon T, Leleu X, Morineau N, Huyghe P, Harousseau JL, Bataille R, Avet-Loiseau H Intergroupe Francophone du Myélome. Recurrent 14q32 translocations determine the prognosis of multiple myeloma, especially in patients receiving intensive chemotherapy. Blood. 2002;100:1579–1583. doi: 10.1182/blood-2002-03-0749. [DOI] [PubMed] [Google Scholar]
- Ross FM, Chiecchio L, Dagrada GP, Protheroe RK, Stockley DM, Harrison CJ, Cross NC, Szubert AJ, Drayson MT, Morgan GJ UK Myeloma Forum. The t(14;20) is a poor prognostic factor in myeloma but is associated with long-term stable disease in monoclonal gammopathies of undetermined significance. Haematologica. 2010;95:1221–1225. doi: 10.3324/haematol.2009.016329. [DOI] [PMC free article] [PubMed] [Google Scholar]
- Santra M, Zhan F, Tian E, Barlogie B, Shaughnessy J., Jr A subset of multiple myeloma harboring the t(4;14)(p16;q32) translocation lacks FGFR3 expression but maintains an IGH/MMSET fusion transcript. Blood. 2003;101:2374–2376. doi: 10.1182/blood-2002-09-2801. [DOI] [PubMed] [Google Scholar]
- Sawyer JR. The prognostic significance of cytogenetics and molecular profiling in multiple myeloma. Cancer Genet. 2011;204:3–12. doi: 10.1016/j.cancergencyto.2010.11.002. [DOI] [PubMed] [Google Scholar]
- Seong C, Delasalle K, Hayes K, Weber D, Dimopoulos M, Swantkowski J, Huh Y, Glassman A, Champlin R, Alexanian R. Prognostic value of cytogenetics in multiple myeloma. Br J Haematol. 1998;101:189–194. doi: 10.1046/j.1365-2141.1998.00657.x. [DOI] [PubMed] [Google Scholar]
- Seto M, Yamamoto K, Iida S, Akao Y, Utsumi KR, Kubonishi I, Miyoshi I, Ohtsuki T, Yawata Y, Namba M, et al. Gene rearrangement and overexpression of PRAD1 in lymphoid malignancy with t(11;14)(q13;q32) translocation. Oncogene. 1992;7:1401–1406. [PubMed] [Google Scholar]
- Simon R. Development and evaluation of therapeutically relevant predictive classifiers using gene expression profiling. J Natl Cancer Inst. 2006;98:1169–1171. doi: 10.1093/jnci/djj364. [DOI] [PubMed] [Google Scholar]
- Taniwaki M, Nishida K, Ueda Y, Takashima T. Non-random chromosomal rearrangements and their implicationsin clinical features and outcome of multiple myeloma and plasma cell leukemia. Leuk Lymphoma. 1996;21:25–30. doi: 10.3109/10428199609067575. [DOI] [PubMed] [Google Scholar]
- Tricot G, Barlogie B, Jagannath S, Bracy D, Mattox S, Vesole DH, Naucke S, Sawyer JR. Poor prognosis in multiple myeloma is associated only with partial or complete deletions of chromosome 13 or abnormalities involving 11q and not with other karyotype abnormalities. Blood. 1995;86:4250–4256. [PubMed] [Google Scholar]
- Tricot G, Sawyer JR, Jagannath S, Desikan KR, Siegel D, Naucke S, Mattox S, Bracy D, Munshi N, Barlogie B. Unique role of cytogenetics in the prognosis of patients with myeloma receiving high-dose therapy and autotransplants. J Clin Oncol. 1997;7:2659–2666. doi: 10.1200/JCO.1997.15.7.2659. [DOI] [PubMed] [Google Scholar]
- Zaller DM, Eckhardt LA. Deletion of a B-cell-specific enhancer affects transfected, but not endogenous, immunoglobulin heavy-chain gene expression. Proc Natl Acad Sci U S A. 1985;82:5088–5092. doi: 10.1073/pnas.82.15.5088. [DOI] [PMC free article] [PubMed] [Google Scholar]
- Zhan F, Huang Y, Colla S, Stewart JP, Hanamura I, Gupta S, Epstein J, Yaccoby S, Sawyer J, Burington B, Anaissie E, Hollmig K, Pineda-Roman M, Tricot G, van Rhee F, Walker R, Zangari M, Crowley J, Barlogie B, Shaughnessy JD., Jr The molecular classification of multiple myeloma. Blood. 2006;108:2020–2028. doi: 10.1182/blood-2005-11-013458. [DOI] [PMC free article] [PubMed] [Google Scholar]