

Abstract
The cytoplasm of Escherichia coli is a crowded, heterogeneous environment. From single cell live imaging, we investigated the spatial kinetics and heterogeneities of synthetic RNA-protein complexes. First, although their known tendency to accumulate at the cell poles does not appear to introduce asymmetries between older and newer cell poles within a cell lifetime, these emerge with cell divisions. This suggests strong polar retention of the complexes, which we verified in their history of positions and mean escape time from the poles. Next, we show that the polar retention relies on anisotropies in the displacement distribution in the region between midcell and poles, whereas the speed is homogeneous along the major cell axis. Afterward, we establish that these regions are at the border of the nucleoid and shift outward with cell growth, due to the nucleoid’s replication. Overall, the spatiotemporal kinetics of the complexes, which is robust to suboptimal temperatures, suggests that nucleoid occlusion is a source of dynamic heterogeneities of macromolecules in E. coli that ultimately generate phenotypic differences between sister cells.
Introduction
Even single-celled organisms, such as Escherichia coli, possess a far from random internal organization. Proteins involved in chemotaxis are preferentially located at the cellular poles (1–4), whereas proteins (e.g., RNA polymerases) and transcription factors involved in gene expression mostly locate within a structure known as the nucleoid that, before its replication, is generally located in the central region of the cell (5–9).
At least some of the heterogeneities in the cytoplasm of E. coli cells influence their functioning. One example is that cells inheriting the older pole of the mother cell exhibit diminished growth rate (10), which suggests that some contents in the older pole are harmful, and exist in smaller amounts in the newer pole. Subsequent studies hypothesized that one possibly harmful component inherited with the older pole is protein aggregates (10–14).
It is well known that E. coli cells, apart from the nucleoid, lack internal organelles (15). They also lack transport mechanisms for proteins (12,15). Thus, the generation and maintenance of most heterogeneity are likely based on the physical properties of the cells, namely, the presence of the nucleoid at midcell (16) and the shape of the cell (17), and on the physical properties of the components (18).
Recently, to study the nature of the cytoplasm of E. coli, Golding and Cox (15,19) used live cell microscopy and a synthetic RNA coding for multiple binding sites for a synthetic protein MS2-GFP, based on the MS2 capsid protein (20). By tracking the MS2-GFP tagged RNA molecules, they observed that, at short timescales, their motion was subdiffusive with an exponent that is robust to physiological changes, such as the disruption of cytoskeletal elements (15). In addition, they showed that, at long timescales, these complexes tend to localize at the cell poles. It was hypothesized that this was due to hydrodynamic coupling between the complexes and the cell walls of the poles (19).
Here, using the same approach as in (15), we further investigate the behavior of these large, inert complexes within the cytoplasm of E. coli. We choose to use this complex because of its long lifetime (19) (longer than 2 h) and its robustness to photobleaching (21). Furthermore, the individual MS2-GFP proteins are known to distribute uniformly within the cell (22), whereas the motion of the complexes appears to be dominated by physical interactions (15). This provides strong evidence that there are no significant biological interactions between the MS2-GFP proteins or between the MS2-GFP-tagged RNA and other components of the cytoplasm.
From the analysis of time series images of cells expressing MS2-GFP and the target RNA, we address the following questions. Is the accumulation of these complexes at the cell poles a symmetric process? Do cell divisions introduce asymmetries in their numbers in older and newer cell poles, as in the case of unwanted protein aggregates (11)? Are they retained at the poles, and if so, for how long? What heterogeneities and anisotropies in their motion exist along the major cell axis? Does their spatial distribution change in the course of a cell’s lifetime? Finally, we investigate to what extent the nucleoid is involved in the observed behavior of these complexes.
Materials and Methods
Chemicals
Bacterial cell cultures were grown in lysogeny broth (LB) media. The chemical components of LB (Tryptone, Yeast extract, and NaCl) were purchased from LabM (Topley House, Bury, Lancashire, UK) and the antibiotics from Sigma-Aldrich (St. Louis, MO). Isopropyl β-d-1-thiogalactopyranoside (IPTG) and anhydrotetracycline (aTc) used for induction of the target genes are from Sigma-Aldrich. Agarose (Sigma-Aldrich) was used for microscope slide gel preparation for cell imaging. 4′,6-diamidino-2-phenylindole (DAPI) from Sigma-Aldrich was used to stain cell nucleoids.
Cells and plasmids
Experiments were conducted in E. coli strain DH5α-PRO, generously provided by I. Golding (Baylor College of Medicine, Houston, TX), which contains two constructs: i), PROTET-K133 carrying PLtetO-1-MS2d-GFP (19), and ii), a pIG-BAC (Plac/ara-1-mRFP1-MS2-96bs) vector, carrying a 96 MS2 binding site array under the control of Plac/ara-1 (19).
Induction of production of fluorescent complexes
The dimeric MS2 fused to green fluorescent protein (GFP) (MS2-GFP fusion protein) used as a detection tag (19) is expressed from a medium-copy vector under the control of the PLtetO-1 promoter (23), which is regulated by the tetracycline repressor. The RNA target for MS2-GFP is located on a single-copy F-based vector, and is controlled by the Plac/ara-1 promoter (23). For our measurements, precultures were diluted from the overnight culture to an OD600 of 0.1, in fresh LB media supplemented with the appropriate antibiotics and kept at 24°C or 37°C at 250 RPM in a shaker for ∼2 h at 24°C or ∼1.5 h at 37°C until they reached an OD600 ≈ 0.5. At this point, cells were induced with 50 ng/ml of aTc and 0.1% l-arabinose for 45 min, at which point the OD600 was ∼0.8. Induction of the target RNA production was then completed by adding 1 mM IPTG and cells were incubated for 5 min before preparation of the microscope slide. We note that this induction procedure is necessary for cells to have sufficient numbers of MS2-GFP to detect the target RNA and to achieve full induction of the target gene during the microscopy measurements (24,25).
Imaging
After induction of the target gene, a few microliters of culture were placed on a microscope slide between a coverslip and a 0.8% agarose gel pad set with the LB media, followed by the assembly of a thermal imaging chamber (Bioptechs, FCS2) set at the appropriate temperature. Cells were visualized by fluorescence microscopy using a Nikon Eclipse (TE2000-U, Nikon, Tokyo, Japan) inverted microscope with a C1 confocal laser scanning system using a 100× Apo TIRF (1.49 NA, oil) objective. GFP fluorescence was measured using a 488 nm laser (Melles-Griot) and a 515/30 nm detection filter. Images of cells were taken from each slide by the Nikon software EZ-C1, starting ∼10 min after induction of the target gene, 1/min, for 2 h. The pixel dwell was 1.33 μs, resulting in a line scanning time of ∼1.4 ms; this is significantly faster than the diffusion speed of the MS2-GFP-RNA particles (see (15)), and should therefore not introduce any time-averaging artifacts.
Imaging of nucleoids
DAPI stains nucleoids specifically, with little or no cytoplasmic labeling (26). Precultures were grown for ∼3 h with the same previous protocol (but without inducing the target or reporter genes). After reaching an OD600 ≈ 0.8, cells were centrifuged and suspended in phosphate buffered saline (PBS). For live cell nucleoid staining, DAPI (2 μg/ml) was added to the cells suspended in PBS and incubated for 20 min in the dark. Cells were then washed twice with PBS, and placed on a 1% agarose gel pad prepared with LB. The cells were simultaneously observed by epifluorescence microscopy, using a mercury lamp with a DAPI filter, and by phase contrast microscopy. DAPI is excited at 359 nm and emits at 461 nm. Images were acquired with Nikon software NIS-Elements. Cells in phase contrast images were segmented using the software MAMLE (27). The background of the images obtained by epifluorescence microscopy was removed by subtracting a cubic polynomial surface, fitted to the image by L1-norm minimization (i.e., minimizing the absolute difference between the surface and the image; see, e.g. (28)). The fluorescence intensities in each cell were then extracted. See Fig. 6, which shows the fluorescence intensities were projected along the major axis of the cell.
Figure 6.
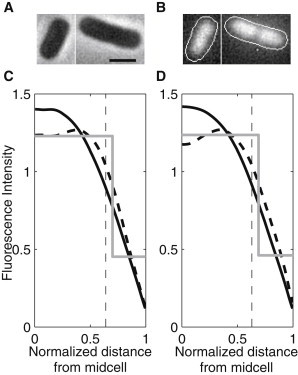
(A) Example phase contrast images of cells and (B) corresponding background-subtracted epifluorescence with the nucleoids stained by DAPI, and the detected cell contours superimposed (contrast enhanced for easier visualization in both A and B). Scale bar is 1 μm. The two bottom figures (C) and (D) show the spatial distributions of the fluorescence intensity (in arbitrary units) of the DAPI signal along the major cell axis (black line) and the fit of a piecewise constant probability density function by maximum likelihood (gray line). The vertical dashed lines represent the detected separation between midcell and poles (from Fig. 2, B and C). Also shown is the fluorescence distribution from the 10% longest cells in each condition (dashed line). Measurements are from (C) 220 cells at 37°C and (D) 143 cells at 24°C.
Detection of cells and individual complexes within from the images
Cells were detected from the images by a semiautomatic method as in (22). First, the time series images from confocal microscopy were aligned, so that the cells stayed in the same position throughout the time series. Next, a mask was manually drawn over the region that each cell occupied during the time series. When a cell divided, separate masks were drawn in the frame where the division was first observed, to represent daughter cells after division. After thresholding the fluorescence distribution within each mask to enforce a uniform fluorescence within the cell, principal component analysis was used to obtain, at each frame, the position, dimension, and orientation of the cell inside each mask.
To construct cell lineages, we automatically assigned a parent to each cell in each frame, as the cell in the previous frame with the nearest centroid. This was done after transforming the previous frame’s cell centroids by the inverse of the transform that maps a unit circle to the cell’s ellipse, to avoid incorrectly assigning adjacent cells as parents. When two cells are assigned the same parent, a division is assumed to have occurred. We verified the efficiency of this method by inspection, and found the rate of error to be negligible.
Next, we detected fluorescent MS2-GFP-RNA complexes in each cell, at each frame, as in (22). We segmented the fluorescent complexes automatically inside each mask with the kernel density estimation (KDE) method for spot detection (29). This method measures the local smoothness of the image, and determines spot locations by designating areas with low smoothness as spots. We used a Gaussian kernel as in (22). Cell background corrected complex intensities were then calculated by subtracting the mean cell background intensity multiplied by the area of the complex from the total fluorescence intensity of the complex.
For cells containing only one complex, once the complexes were detected at each time point, we obtained displacement vectors from their positions in consecutive frames. In Fig. 1, we show an example image of cells (Fig. 1 A), along with the segmented cells and detected complexes within (Fig. 1 B), and an example of the extracted displacement vectors of a complex from its positions at consecutive frames (Fig. 1 C).
Figure 1.
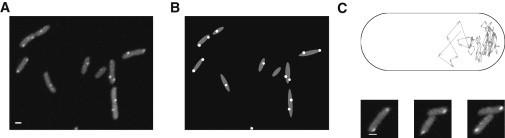
(A) Example image of cells with fluorescent MS2-GFP-RNA complexes within. (B) Segmentation and principal component analysis results of the image in (A) with cells (gray) and complexes (white). (C) One example of the extracted displacement vectors of a complex from its consecutive positions in the cell. Three images of the cell are shown below, taken at 40, 80, and 120 min (displacement vectors are from the upper cell). Scale bars are 1 μm. The contrast of these images was enhanced for easier visualization.
By inspection, we observed that the spot detection is reliable. Although we are unable to determine the precision with exactness, as it depends on many variables including noise in the image, we can estimate a conservative upper bound for the error. Assuming that the method of detection is perfect, the discrete nature of the pixels implies that the error in the estimate of the spot’s position is up to 2-1/2 pixels. If the spot detection, e.g., misidentifies pixels at the borders of spots, in the worst case scenario, it would misidentify all pixels only on one side of the spot. This could introduce a further 2-1/2 error into the estimation of the spot’s position. Given this, the error in the estimate of the spot position should have an upper bound of √2 pixels, or ∼0.17 μm. As several rare events are required to produce this error, the real expected error is considerably lower. Nevertheless, even this upper bound is much smaller than the cell length (2–4 μm), rendering this error negligible.
Models of long-term spatial distributions of large molecules in the cytoplasm of E. coli
A cell is modeled as a one-dimensional space, which is divided into N homogeneous subvolumes. The motion of the complexes is modeled by unimolecular reactions following the reaction-diffusion master equation (30). The propensities in the reaction-diffusion master equation are functions of the position of the subvolume, and are presented in the Supporting Material. Three models were implemented: one without internal heterogeneities or anisotropies, one with heterogeneities, and one with anisotropies. Also in the Supporting Material, we present the methods used to analyze the results of the models.
Results
Spatial distribution of the complexes
To study the spatial distribution of the complexes, we imaged cells for 2 h following the induction of the target RNA and tagging MS2-GFP proteins (see Methods). Images were taken once per minute, in optimal and suboptimal growth conditions (LB media, 37°C and 24°C, respectively). An example image is shown in Fig. 1 A. During this period, cells grew, divided, and produced MS2-GFP-RNA complexes, which moved within the cytoplasm of the cells and were partitioned in cell divisions.
In general, these complexes are first observed at midcell (where the F-plasmid carrying the target gene is located (31)) and then travel toward the cell extremes, where they tend to remain (19). To study whether the side to which they travel is a symmetric (i.e., unbiased) process with respect to the age of the cell halves, we observed this process in cells that initially contained no complexes and that were born during the measurement period (107 cells at 37°C and 156 cells at 24°C), so that the older half of each cell could be identified. In these cells, at each time moment, we identified the locations of fluorescent complexes along the major axis of the cell (positions are normalized by half the length of the major axis), and determined the background-corrected fluorescence intensity of each. Colocalized complexes will, approximately, exhibit a fluorescence intensity that is the sum of the intensity of its component complexes (25). For each condition, we summed the intensities of the complexes at each location along the major axis of the cell, over all time points and cells, thus obtaining the spatiotemporal distribution of the complexes. We used KDE (32) with a Gaussian kernel to perform this sum, resulting in a smooth distribution (Fig. 2 A). We note that we did not separate cells of different sizes when obtaining this distribution. Given the time length of the measurements and the fact that most cells divided during this period, the resulting distribution and all conclusions drawn from it should be considered to be the average behavior over the cell cycle.
Figure 2.
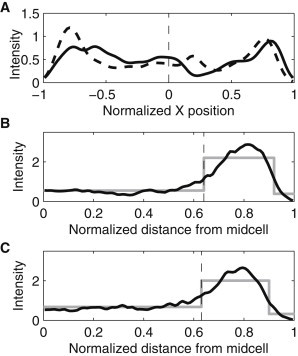
KDE of spatial distributions of the fluorescence intensity (in arbitrary units) of complexes along the major axis of the cells (bandwidths 0.05). All cells were born during the measurement period. (A) Data from all cells that inherited no complexes but produced one or more. The old pole is at +1 and the new pole is at −1. Data are from 107 cells at 37°C (solid line) and 156 cells at 24°C (dashed line). The dashed vertical line represents the cell center. (B and C) Data from all cells (black line). Complex positions were normalized by half the cell length and mirrored about the cell center. Also shown is the fit of a piecewise constant probability density function by maximum likelihood (gray line). The vertical dashed line represents the detected separation points between the midcell and poles. Measurements are from (B) 531 cells at 37°C, with separation point at 0.64 and (C) 372 cells at 24°C, with separation point at 0.61.
From the distribution for each condition, we computed the fraction of complexes in the older half. We found this fraction to be 0.46 at 37°C and 0.47 at 24°C, which are both statistically indistinguishable from the expected fraction assuming an unbiased partitioning of complexes (p-values of the binomial test with N equal to the number of observed cells were larger than 0.2, and it is usually accepted that, for p-values smaller than 0.01, the null hypothesis is rejected). We therefore find no evidence that the complexes are asymmetrically distributed between the older and newer halves of the cell before division events.
Also from Fig. 2 A, in both conditions, the complexes were preferentially located close to the cell extremes (i.e., at the polar regions) for most of the measurement period, as reported in (25). To quantify the degree of polarization of the complexes, one needs to formally define such polar regions, along the major axis of the cells. We did this from a functional perspective, i.e., based on the heterogeneities of the spatial distributions of the complexes visible in Fig. 2 A. Given the symmetry in these distributions between the old and new halves of the cells, from here onward, we folded the spatial distribution around 0, and summed the intensities from both halves. As such, it is possible to include all cells born during the measurements in this analysis. The resulting distributions of each condition are shown in Fig. 2, B and C.
To distinguish the functional regions in each condition, we fitted a piecewise constant probability density function with three pieces to each intensity distribution by maximum likelihood (gray line in Fig. 2, B and C). The separation points between the regions from the fit were found to be at 0.64 for 37°C and at 0.61 for 24°C.
Based on this separation between poles and midcell regions, we calculated the concentration of complexes at the poles and at midcell, in each condition, to assess the degree of polarization of the complexes. In this case, concentrations >1 indicate that the complexes are located in this region beyond what would be expected from a uniform distribution. This concentration was found to be 1.72 at 37°C and 1.45 at 24°C.
From this separation, we also determined whether cell divisions introduced biases in the numbers of complexes at the old and new poles in subsequent generations. In the measurements conducted at 37°C, sufficient divisions occurred in the 2 h measurement period of to assess this. From these, we selected cells that inherited one complex but produced none during their lifetime (111 cells), to ensure that the complexes analyzed are only inherited ones. During the lifetime of these cells, the old pole contained 65% of the complexes located in a pole. The p-value that this fraction arises from an unbiased binomial distribution with the number of trials equal to the number of cells is 0.004, from which we conclude there is a significant bias that favors the old pole.
As a control, similar experiments were performed in minimal media (M63) at 37°C (for details, see the Supporting Material). The results (Fig. S1 and Fig. S2) are qualitatively the same as in LB media. Specifically, the complexes accumulated at the poles, in well-defined regions. Furthermore, cell divisions introduced asymmetries between the numbers of complexes at the old and new poles of the daughter cells. These asymmetries following divisions are possible if, to some extent, the complexes are retained at the pole where they are inherited (otherwise, the bias would be rapidly lost).
Retention of complexes at the poles
To study the retention of the complexes at the poles, for each condition, we selected cells that contained at most one complex throughout their lifetime (either inherited or produced), so that they could be reliably tracked. We recorded the position along the major axis where the complex was first observed within a polar region, as previously defined, and the complex’s final position, i.e., either before division or at the end of the measurement period. This information is presented in Fig. 3. In general, a complex’s final position is within the polar region to which it first traveled to, as expected from a strong polar retention. However, in a few cases, the opposite occurs, which shows that complexes can move across the entire major cell axis (as reported in (19)). This indicates that there is a degree of leakiness, or noise, in the retention at the poles.
Figure 3.
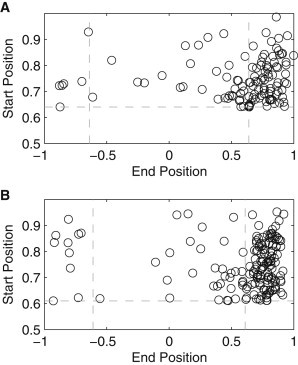
Relationship between the position along the major axis where each complex was last observed and the absolute position where it was first observed at a pole. Here, an end position of +1 indicates that the complex remained at the same pole as it was first observed, whereas −1 indicates that it traveled to the other pole. The horizontal and vertical dashed lines represent the detected separation between the midcell and poles from Fig. 2, B and C. All cells were born during the measurement period and contained only one complex during their lifetime. Measurements are from (A) 160 cells at 37°C and (B) 198 cells at 24°C.
To quantify the strength of polar retention, we measured the escape times of the complexes from the poles, in each condition (mean values in Table 1). Note that, on some (rare) occasions, the complexes appeared to leave the pole for only one time moment, and then promptly returned. We did not count these cases as escapes. Furthermore, when complexes did not leave the pole until the end of the measurement period or until a division event, we consider that they remained at the pole only until the next time moment. Thus, the measured mean escape times are underestimates of the real escape times.
Table 1.
Mean and standard deviations of escape times of complexes from the poles, in each condition
| T (°C) | No. cells | Mean division time (min) | Escape times (min) | p-value of t-test |
|---|---|---|---|---|
| 37 | 160 | 63 | 14.8 ± 19.3 | 0.062 |
| 24 | 198 | 91 | 18.0 ± 18.4 |
Also shown is the number of cells observed, their mean division time, and the p-value of the t-test with the hypothesis that the mean escape times are identical in both conditions.
From Table 1, within the range tested, we find no evidence that temperature affects the mean escape time from the poles. Furthermore, in both temperature conditions, the standard deviations of escape times were similar to the means, a characteristic of exponential distributions, which is the expected solution of, e.g., a barrier crossing problem or of a particle trying to escape from a region through small passages (33).
Spatial dynamics of complexes
To better understand how the complexes are retained at the poles, from cells containing at most one complex during their lifetime, we obtained their displacement vectors along the major cell axis between frames. These inform on the directionality of a complex between consecutive images (assessed by the sign of the displacement vector). In addition, they inform on the speed at which the complexes are able to move along the major cell axis during the intervals between consecutive images (assessed by the magnitude of the displacement vector). Cell growth between consecutive frames was accounted for by projecting the origin of each displacement vector into the cell space in the following frame, before calculating the magnitude and direction.
First, for each condition, we extracted the speeds from the displacement vectors going toward a pole and going toward the midcell, as a function of their point of origin. For this, we defined a sliding window with a width of 0.1 cell lengths and determined which displacement vectors originated within that window and their direction.
At midcell, the mean speed of complexes going toward a pole (0.13 μm/min at 37°C and 0.14 μm/min at 24°C) was statistically indistinguishable from the mean speed of those going toward midcell (0.12 μm/min at 37°C and 0.14 μm/min at 24°C) (p-values of the t-tests >0.4). At the poles, in both temperature conditions, the mean speed of complexes going toward a pole (∼0.07 μm/min) and toward midcell (∼0.11 μm/min) was distinguishable, in a statistical sense (p-values of the t-tests <0.01). This difference is visible in Fig. 4, for both conditions. The decrease in mean speed as the complexes approach the cell extremes is expected, given the proximity to the cell wall.
Figure 4.
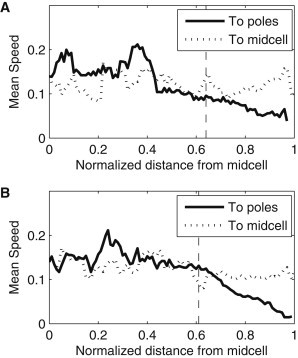
Mean speed (μm/min) of the displacement vectors directed toward the poles and toward midcell along the major cell axis. The mean speeds were calculated from the displacement vectors originating within a window extending 0.05 normalized cell lengths around that point. The dashed vertical lines represent the functional separation between midcell and poles (obtained from Fig. 2, B and C). All cells were born during the measurement period and contained one complex in their lifetime. Measurements are from (A) 49 cells at 37°C and (B) 101 cells at 24°C.
Relevantly, the mean speed of the vectors going toward the cell center of complexes at the poles and at midcell is indistinguishable in a statistical sense, in both temperature conditions (p-values of the t-tests >0.01). Given that the mean speeds at midcell of complexes traveling toward poles and toward midcell are also indistinguishable (see above), we conclude that the speed of complexes is fairly homogenous throughout the major cell axis, except for the complexes traveling toward a pole that are already near the cell extreme (which, therefore exhibit lower mean speed).
We next analyzed the directionality of the displacement vectors. Using the same sliding window as before, we counted the number of displacement vectors originated in the window, which were directed toward the midcell and toward the poles. In Fig. 5, we show the difference between these two numbers along the major cell axis. In both conditions, a characteristic spatial heterogeneity is observable. At midcell, the complexes have equal probability of moving in either direction, whereas at the poles, there are local biases in the directionality of the displacement vectors. In particular, if close to the cell extremes, the complexes tend to move inward, toward the midcell. Meanwhile, if they are close to the border between midcell and the pole (as defined from the spatial distributions of complexes shown in Fig. 2, B and C), the opposite occurs. As a result, once reaching a pole, the complexes tend to remain there.
Figure 5.
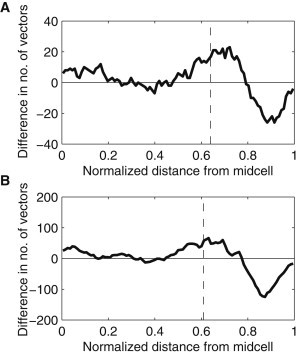
Difference between the numbers of displacement vectors that are directed toward the poles and toward the midcell along the major cell axis. The differences were calculated from the displacement vectors originating within a window extending 0.05 normalized cell lengths around that point. The dashed vertical lines represent the functional separation between midcell and poles (obtained from Fig. 2, B and C). All cells were born during the measurement period and contained one complex in their lifetime. Measurements are from (A) 49 cells at 37°C and (B) 101 cells at 24°C.
It is noted that although the anisotropic displacement distribution at the extremes of the cell is expected from the geometry of the cell wall at the poles, the source of the opposite anisotropy in the transition between midcell and poles is less clear. Its existence suggests that the motion of the complexes going from poles to midcell is, to a degree, obstructed. This effect is possible if the complexes are encountering a more dense structure that hampers their entrance into that region.
Relevantly, the location of the anisotropy, namely, 0.64 at 37°C and 0.61 at 24°C, is in agreement with previous measurements of the nucleoid size in E. coli cells grown in LB media at 37°C (e.g., its length relative to the major axis length is 0.53 ± 0.05 in wild-type DJ2599 cells (34)). We thus hypothesized that the nucleoid is involved in this phenomenon, and measured its length in the cells of the strain used here, in the same conditions as above.
Spatial distribution of nucleoids
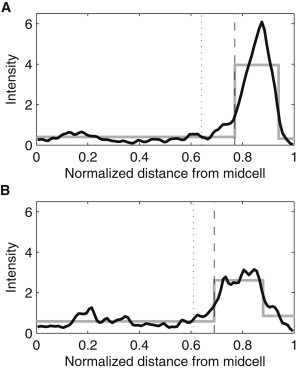
To test whether the regions of anisotropies of the displacement distributions along the major cell axis are consistent with the borders of the nucleoid, we measured the nucleoid size (see Methods) from 220 cells at 37°C and 143 cells at 24°C (see example, Fig. 6, A and B). The intensity of the DAPI signal, summed along the minor axis for each position along the major axis of the cells, and summed over all cells, is shown in Fig. 6, C and D.
To determine the edge of the nucleoid, we fitted a piecewise constant probability density function with two pieces to the intensity distribution by maximum likelihood. We found the separation point to be at 0.69 in both conditions. This is close to the measured separation points between the midcell region, which the complexes avoid, and the poles, where they accumulate (0.61 and 0.64 at 24°C and 37°C, respectively, see Fig. 2, B and C). The slightly larger size of the nucleoid may be due to DAPI being an intercalating dye (26). Note that the nucleoid size was not altered by the differences in temperature. This is in agreement with the lack of differences in the width of the polar regions where the complexes tend to accumulate in the two temperature conditions.
If the heterogeneities in the spatial distribution of the complexes depend on the positioning of the nucleoid(s), as these results suggest, the replication of the nucleoid before cell division should then affect this distribution. To determine this, we first selected the 10% longest cells detected in the DAPI measurements and searched for differences in their spatial distribution of fluorescence intensities, when compared to the total population. Results in Fig. 6, C and D, confirm the existence of differences, as the region occupied by the nucleoids along the major cell axis is relatively wider in these cells. Note also a decrease in fluorescence intensity, precisely at midcell, as expected if several of these cells contain two nucleoids.
Next, we studied the spatial distribution of the complexes in the 10% longest cells as extracted from the time series measurements of the complexes' positions and kinetics (from the same data used in Fig. 2, B and C). If the nucleoid(s) affect the spatial distribution of complexes, in these cells one can expect the complexes to accumulate relatively closer to the poles. Fig. 7 shows that this is the case both at 37°C and 24°C, thus providing supporting evidence that the nucleoid(s) influence(s) the complexes’ preferential positioning.
Figure 7.
KDE of the spatial distribution of the fluorescence intensity (in arbitrary units) of complexes along the major axis of the cells, extracted from all time points when the cells were among the 10% longest cells (black line, bandwidth 0.05). All cells were born during the measurement period. The dashed vertical line represents the detected separation point for (A) 531 cells at 37°C and (B) 372 cells at 24°C, both grown in LB media.
As a side note, we did not find evidence for cells with more than two nucleoids at any stage of their lifetime (see, e.g., that Fig. 6, C and D do not show evidence for more than two lobes). This could be due to the strain used (DH5α-PRO divides slower than wild-type E. coli (35)) along with the measurement conditions. In addition, we found no significant accumulation of complexes at the center in the longer cells (i.e., in between the two nucleoids). This is likely due to the very small number of complexes (∼1 to 3 per cell before division). Furthermore, many are created before nucleoid partitioning and thus simply remain at the poles as the nucleoid divides.
Finally, because we observed several complexes traveling from one pole to the other, it is of interest to ask whether they do so by traveling through the nucleoid or around it. To address this, we obtained the KDE of the two-dimensional distributions of complexes from all time points in both temperature conditions (Fig. S3, A and B). From the figures, it is visible that the complexes tend to avoid the nucleoid region both axially and radially, concentrating at midcell close to the cell walls (despite the greater width in the center of the bacteria, at Y = 0). From this, we conclude that the complexes tend to go around the nucleoid, when traveling through the midcell region. Relevantly, this result is in agreement with both the homogeneity in the distributions of speeds along the major axis of the cells as well as with the localized anisotropies between midcell and poles.
Models of the spatial kinetics of complexes
To test whether the localized anisotropies in directionality, given the homogeneity of the speeds, can generate the observed heterogeneity in the long-term spatial distributions of the complexes, we constructed two one-dimensional models to simulate the diffusion of the complexes within the cell. Both models contain spherical cell caps and their effects. Meanwhile, in one model, we also introduced a localized anisotropy (see Fig. 8, A and B; for a complete description of the models see the Supporting Material).
Figure 8.

(A) Propensities (gray line) of the best-fitting model without a nucleoid (B = 1). (B) Propensities (black line) and (gray line) of the best-fitting model with a nucleoid (B = 0.46, μ = 0.65, σ = 0.07, and h = 0.05). (C) Measured fraction of displacement vectors originating within a window extending 0.05 normalized cell lengths around that point which are directed toward the pole (black line), model prediction without (dashed line), and with (gray line) a nucleoid. Note that the dashed line is superimposed by the gray line in the left side of the graph. (D) Measured spatial distribution of fluorescence intensities of complexes (black line) model prediction without (dashed line) and with (gray line) a nucleoid.
Given that the mean speeds of the complexes (see Fig. 4) are sufficiently large to allow them to travel from one pole to the other within the cell’s lifetime (more than once), we assume that the initial positions of the complexes do not have a significant effect on their long-term spatial distribution, and thus this information is not included in the models. Additionally, for both models, we set N, the number of subvolumes in the cell, to 100, and D, the diffusion coefficient, to 1.43 × 10⁻² μm2/min (measured from the displacement distribution depicted in Fig. 4 B), which we normalized by half the mean cell length (∼1 μm), in agreement with previous measurements (15).
Next, for each model, we varied all parameters and, for each set of values, obtained the distribution of complex positions that would be observed at infinite time. We then selected the set of parameters whose resulting distribution best fit the measured distribution of complex positions at each time point (Fig. 2, B and C). This fitting was done to the distribution obtained from the measurements at 24°C (from which we extracted more data points), using the earth-mover’s measure of distance between distributions (36,37), which measures the amount of work required to make two distributions identical (see methods in the Supporting Material). Similar parameter values were obtained when fitting to the measurements at 37°C.
The results from the two models, each using the best-fit parameter values, are shown in Fig. 8. The propensities of the two models are shown in Fig. 8, A and B. From Fig. 8, C and D, the model without the anisotropy fails to reproduce the displacement distribution (Fig. 8 C), and the consequent heterogeneity in the spatial distribution of complexes that favors their presence at the poles (Fig. 8 D). Meanwhile, the other model captures both of these properties of the dynamics of the complexes with significant accuracy.
Discussion
We studied the kinetics and spatial distribution of biologically inert complexes, composed of RNA molecules tagged with multiple MS2-GFP proteins, in the cytoplasm of E. coli cells. The advantages of using these complexes are that their numbers can be controlled by regulating the activity of the target gene, both the target gene and the tagging MS2-GFP molecules are functional in a wide range of environmental conditions including stresses, and the complexes formed have a long lifetime (38,39). This last advantage ensures that we can observe how they are partitioned in division and thus, how they become distributed across cell lineages.
We found that their previously reported tendency to travel toward the poles (19) is a symmetric process in the conditions tested, in that equal numbers of newly produced complexes travel toward the old and the new pole of the cells. Once reaching the poles, they are robustly retained there. Because of this, cell divisions introduce asymmetries in their numbers between the old and new poles of cells of subsequent generations, and after two generations, between sister cells.
There are two possible mechanisms by which the complexes could accumulate at the cell poles, without a transport mechanism. Either their speed distribution is heterogeneous along the major cell axis (i.e., slower at the poles, see Fig. S4), or there is an excluded volume effect at midcell. We found that the retention is solely based on the latter. First, we showed that the speed distribution is homogenous, which rejects the first mechanism. Next, we showed that there is a strong anisotropy in the displacement distribution at approximately half way between the cell extremes and the center, where the motion of the complexes toward midcell is, to a great extent, obstructed. This is consistent with volume exclusion effects due to the presence of the nucleoid.
The existence of the anisotropy and the absence of heterogeneity in the speeds suggest that to go from one pole to the other, the complexes go around the nucleoid. The overall two-dimensional distributions of positions occupied by complexes throughout their lifetimes supported this hypothesis, as they showed that the complexes avoid the nucleoid, both axially and radially. Meanwhile, the escape times of these complexes from the poles were found to be approximately equal to a third of the cell’s lifetime and to follow exponential distributions. This implies that the escape from the pole is a Poisson process, which is consistent with the behavior of a particle trying to escape from a region through a small passage (33).
To further support the hypothesis that the polar retention is primarily driven by the nucleoid positioning, we tested whether there is an agreement between the location of the nucleoid and where the movement of complexes is obstructed. We found that the region where the complexes are retained agrees with the region where the nucleoid ends. In addition, we observed that in the longest cells, where the nucleoid(s) occupy a relatively wider region (due to nucleoid replication), the complexes occupy a relatively smaller region at the poles. Additional support was provided by modeling. From the models, in the absence the nucleoid’s effects, namely, in the absence of the anisotropy in the region between poles and midcell, the retention at the poles was severely hampered. Introducing anisotropy in the velocity distribution resulted in an accurate long-term spatial distribution.
The size of the region occupied by the nucleoid(s) during the cell lifetime was found to be robust for optimal and suboptimal temperatures. This explains the robustness of the width of the region where the complexes accumulated, in the range of temperatures tested here. In the future, measurements in wider temperature ranges may help to establish if the retention at the poles is affected, as the number of genes transcribed changes, altering the nucleoid size (40).
It is known that, when in exponential growth phase, some cells can contain more than two nucleoids. Although we did not observe this here (perhaps due to the strain used), if these nucleoids become widely spread across the major cell axis long enough, the regions in between the nucleoids may become regions of accumulation of complexes, until multiple cell division events separate the nucleoids. Future research may determine whether this occurs and to what extent.
Finally, by using the methodology employed here on other E. coli strains, it should be possible to determine whether our observations are representative of the behavior of wild-type E. coli. Given the physical nature of the underlying processes suggested by our results, we expect this to be the case. In this regard, it is worth noting that the long-term spatial distribution of the complexes observed here is strikingly similar to other protein complexes in E. coli. In particular, their accumulation at the poles of the cells is similar to aggregate processing chaperones (11) and ribosomes (9). Furthermore, clusters of Tsr proteins, involved in chemotaxis, are known to accumulate at the poles (4,41), although the mechanisms by which these heterogeneities are achieved remain unknown. Future research may establish if all these processes in E. coli are regulated by the same means.
Acknowledgments
This work was supported by the Finnish Funding Agency for Technology and Innovation (S.O., R.N.V., A.S.R.), the Academy of Finland (A.S.R.), the Portuguese Foundation for Science and Technology (A.S.R.), the Tampere Doctoral Programme in Information Science and Engineering (A.G.), and the TUT President’s graduate programme (J.L.P.). The funders had no role in study design, data collection and analysis, decision to publish, or preparation of the manuscript.
Footnotes
Abhishekh Gupta and Jason Lloyd-Price contributed equally to this work.
Supporting Material
References
- 1.Sourjik V., Berg H.C. Functional interactions between receptors in bacterial chemotaxis. Nature. 2004;428:437–441. doi: 10.1038/nature02406. [DOI] [PubMed] [Google Scholar]
- 2.Wadhams G.H., Armitage J.P. Making sense of it all: bacterial chemotaxis. Nat. Rev. Mol. Cell Biol. 2004;5:1024–1037. doi: 10.1038/nrm1524. [DOI] [PubMed] [Google Scholar]
- 3.Parkinson J.S., Ames P., Studdert C.A. Collaborative signaling by bacterial chemoreceptors. Curr. Opin. Microbiol. 2005;8:116–121. doi: 10.1016/j.mib.2005.02.008. [DOI] [PubMed] [Google Scholar]
- 4.Zhang P., Khursigara C.M., Subramaniam S. Direct visualization of Escherichia coli chemotaxis receptor arrays using cryo-electron microscopy. Proc. Natl. Acad. Sci. USA. 2007;104:3777–3781. doi: 10.1073/pnas.0610106104. [DOI] [PMC free article] [PubMed] [Google Scholar]
- 5.Kuhlman T.E., Cox E.C. Gene location and DNA density determine transcription factor distributions in Escherichia coli. Mol. Syst. Biol. 2012;8:610. doi: 10.1038/msb.2012.42. [DOI] [PMC free article] [PubMed] [Google Scholar]
- 6.Montero Llopis P., Jackson A.F., Jacobs-Wagner C. Spatial organization of the flow of genetic information in bacteria. Nature. 2010;466:77–81. doi: 10.1038/nature09152. [DOI] [PMC free article] [PubMed] [Google Scholar]
- 7.Jin D.J., Cagliero C., Zhou Y.N. Growth rate regulation in Escherichia coli. FEMS Microbiol. Rev. 2012;36:269–287. doi: 10.1111/j.1574-6976.2011.00279.x. [DOI] [PMC free article] [PubMed] [Google Scholar]
- 8.Bratton B.P., Mooney R.A., Weisshaar J.C. Spatial distribution and diffusive motion of RNA polymerase in live Escherichia coli. J. Bacteriol. 2011;193:5138–5146. doi: 10.1128/JB.00198-11. [DOI] [PMC free article] [PubMed] [Google Scholar]
- 9.Bakshi S., Siryaporn A., Weisshaar J.C. Superresolution imaging of ribosomes and RNA polymerase in live Escherichia coli cells. Mol. Microbiol. 2012;85:21–38. doi: 10.1111/j.1365-2958.2012.08081.x. [DOI] [PMC free article] [PubMed] [Google Scholar]
- 10.Stewart E.J., Madden R., Paul G., Taddei F. Aging and death in an organism that reproduces by morphologically symmetric division. PLoS Biol. 2005;3:0295–0300. doi: 10.1371/journal.pbio.0030045. [DOI] [PMC free article] [PubMed] [Google Scholar]
- 11.Lindner A.B., Madden R., Taddei F. Asymmetric segregation of protein aggregates is associated with cellular aging and rejuvenation. Proc. Natl. Acad. Sci. USA. 2008;105:3076–3081. doi: 10.1073/pnas.0708931105. [DOI] [PMC free article] [PubMed] [Google Scholar]
- 12.Winkler J., Seybert A., Bukau B. Quantitative and spatio-temporal features of protein aggregation in Escherichia coli and consequences on protein quality control and cellular ageing. EMBO J. 2010;29:910–923. doi: 10.1038/emboj.2009.412. [DOI] [PMC free article] [PubMed] [Google Scholar]
- 13.Ebersbach G., Briegel A., Jacobs-Wagner C. A multimeric pole-organizing protein critical for chromosome attachment, division and protein localization in Caulobacter. Cell. 2009;134:956–968. doi: 10.1016/j.cell.2008.07.016. [DOI] [PMC free article] [PubMed] [Google Scholar]
- 14.Maisonneuve E., Ezraty B., Dukan S. Protein aggregates: an aging factor involved in cell death. J. Bacteriol. 2008;190:6070–6075. doi: 10.1128/JB.00736-08. [DOI] [PMC free article] [PubMed] [Google Scholar]
- 15.Golding I., Cox E.C. Physical nature of bacterial cytoplasm. Phys. Rev. Lett. 2006;96:098102. doi: 10.1103/PhysRevLett.96.098102. [DOI] [PubMed] [Google Scholar]
- 16.Fisher J.K., Bourniquel A., Kleckner N. Four-dimensional imaging of E. coli nucleoid organization and dynamics in living cells. Cell. 2013;153:882–895. doi: 10.1016/j.cell.2013.04.006. [DOI] [PMC free article] [PubMed] [Google Scholar]
- 17.Coquel A.-S., Jacob J.-P., Berry H. Localization of protein aggregation in Escherichia coli is governed by diffusion and nucleoid macromolecular crowding effect. PLOS Comput. Biol. 2013;9:e1003038. doi: 10.1371/journal.pcbi.1003038. [DOI] [PMC free article] [PubMed] [Google Scholar]
- 18.Mondal J., Bratton B.P., Weisshaar J.C. Entropy-based mechanism of ribosome-nucleoid segregation in E. coli cells. Biophys. J. 2011;100:2605–2613. doi: 10.1016/j.bpj.2011.04.030. [DOI] [PMC free article] [PubMed] [Google Scholar]
- 19.Golding I., Cox E.C. RNA dynamics in live Escherichia coli cells. Proc. Natl. Acad. Sci. USA. 2004;101:11310–11315. doi: 10.1073/pnas.0404443101. [DOI] [PMC free article] [PubMed] [Google Scholar]
- 20.Peabody D.S. The RNA binding site of bacteriophage MS2 coat protein. EMBO J. 1993;12:595–600. doi: 10.1002/j.1460-2075.1993.tb05691.x. [DOI] [PMC free article] [PubMed] [Google Scholar]
- 21.Kandhavelu M., Häkkinen A., Ribeiro A.S. Single-molecule dynamics of transcription of the lar promoter. Phys. Biol. 2012;9:026004. doi: 10.1088/1478-3975/9/2/026004. [DOI] [PubMed] [Google Scholar]
- 22.Kandhavelu M., Lloyd-Price J., Ribeiro A.S. Regulation of mean and noise of the in vivo kinetics of transcription under the control of the lac/ara-1 promoter. FEBS Lett. 2012;586:3870–3875. doi: 10.1016/j.febslet.2012.09.014. [DOI] [PubMed] [Google Scholar]
- 23.Lutz R., Bujard H. Independent and tight regulation of transcriptional units in Escherichia coli via the LacR/O, the TetR/O and AraC/I1-I2 regulatory elements. Nucleic Acids Res. 1997;25:1203–1210. doi: 10.1093/nar/25.6.1203. [DOI] [PMC free article] [PubMed] [Google Scholar]
- 24.Mäkelä J., Kandhavelu M., Ribeiro A.S. In vivo single-molecule kinetics of activation and subsequent activity of the arabinose promoter. Nucleic Acids Res. 2013;41:6544–6552. doi: 10.1093/nar/gkt350. [DOI] [PMC free article] [PubMed] [Google Scholar]
- 25.Golding I., Paulsson J., Cox E.C. Real-time kinetics of gene activity in individual bacteria. Cell. 2005;123:1025–1036. doi: 10.1016/j.cell.2005.09.031. [DOI] [PubMed] [Google Scholar]
- 26.Kapuscinski J. DAPI: a DNA-specific fluorescent probe. Biotech. Histochem. 1995;70:220–233. doi: 10.3109/10520299509108199. [DOI] [PubMed] [Google Scholar]
- 27.Chowdhury S., Kandhavelu M., Ribeiro A.S. Cell segmentation by multi-resolution analysis and maximum likelihood estimation (MAMLE) BMC Bioinformatics. 2013;14(Suppl 10):S8. doi: 10.1186/1471-2105-14-S10-S8. [DOI] [PMC free article] [PubMed] [Google Scholar]
- 28.Portnoy S., Koenker R. The Gaussian hare and the Laplacian tortoise: computability of squared-error versus absolute-error estimators. Stat. Sci. 1997;12:279–300. [Google Scholar]
- 29.Ruusuvuori P., Aijö T., Yli-Harja O. Evaluation of methods for detection of fluorescence labeled subcellular objects in microscope images. BMC Bioinformatics. 2010;11:248. doi: 10.1186/1471-2105-11-248. [DOI] [PMC free article] [PubMed] [Google Scholar]
- 30.Gardiner C.W., McNeil K.J., Matheson I.S. Correlations in Stochastic theories of chemical reactions. J. Stat. Phys. 1976;14:307. [Google Scholar]
- 31.Gordon S., Rech J., Wright A. Kinetics of plasmid segregation in Escherichia coli. Mol. Microbiol. 2004;51:461–469. doi: 10.1046/j.1365-2958.2003.03837.x. [DOI] [PubMed] [Google Scholar]
- 32.Silverman B.W. Chapman and Hall; London, UK: 1986. Density Estimation for Statistics and Data Analysis. [Google Scholar]
- 33.Chandrasekhar S. Stochastic problems in physics and astronomy. Rev. Mod. Phys. 1943;15:1–89. [Google Scholar]
- 34.Cabrera J.E., Cagliero C., Jin D.J. Active transcription of rRNA operons condenses the nucleoid in Escherichia coli: examining the effect of transcription on nucleoid structure in the absence of transertion. J. Bacteriol. 2009;191:4180–4185. doi: 10.1128/JB.01707-08. [DOI] [PMC free article] [PubMed] [Google Scholar]
- 35.Jung S.-C., Smith C.L., Jin Y.S. Restoration of growth phenotypes of Escherichia coli DH5alpha in minimal media through reversal of a point mutation in purB. Appl. Environ. Microbiol. 2010;76:6307–6309. doi: 10.1128/AEM.01210-10. [DOI] [PMC free article] [PubMed] [Google Scholar]
- 36.Rubner Y., Tomasi C., Guibas L.J. The earth mover’s distance as a metric for image retrieval. Int. J. Comput. Vis. 2000;40:99–121. [Google Scholar]
- 37.Dobrushin R.L. Prescribing a system of random variables by conditional distributions. Theory Probab. Appl. 1970;15:458–486. [Google Scholar]
- 38.Lloyd-Price J., Lehtivaara M., Ribeiro A.S. Probabilistic RNA partitioning generates transient increases in the normalized variance of RNA numbers in synchronized populations of Escherichia coli. Mol. Biosyst. 2012;8:565–571. doi: 10.1039/c1mb05100h. [DOI] [PubMed] [Google Scholar]
- 39.Muthukrishnan A.-B., Kandhavelu M., Ribeiro A.S. Dynamics of transcription driven by the tetA promoter, one event at a time, in live Escherichia coli cells. Nucleic Acids Res. 2012;40:8472–8483. doi: 10.1093/nar/gks583. [DOI] [PMC free article] [PubMed] [Google Scholar]
- 40.Tao H., Bausch C., Conway T. Functional genomics: expression analysis of Escherichia coli growing on minimal and rich media. J. Bacteriol. 1999;181:6425–6440. doi: 10.1128/jb.181.20.6425-6440.1999. [DOI] [PMC free article] [PubMed] [Google Scholar]
- 41.Yu J., Xiao J., Xie X.S. Probing gene expression in live cells, one protein molecule at a time. Science. 2006;311:1600–1603. doi: 10.1126/science.1119623. [DOI] [PubMed] [Google Scholar]
Associated Data
This section collects any data citations, data availability statements, or supplementary materials included in this article.