



Abstract
This study integrated metagenomic and nuclear magnetic resonance (NMR) spectroscopic approaches to investigate microbial metabolic potential for organic matter decomposition and nitrogen (N) and phosphorus (P) acquisition in soils of an ombrotrophic peatland in the Marcell Experimental Forest (MEF), Minnesota, USA. This analysis revealed vertical stratification in key enzymatic pathways and taxa containing these pathways. Metagenomic analyses revealed that genes encoding laccases and dioxygenases, involved in aromatic compound degradation, declined in relative abundance with depth, while the relative abundance of genes encoding metabolism of amino sugars and all four saccharide groups increased with depth in parallel with a 50% reduction in carbohydrate content. Most Cu-oxidases were closely related to genes from Proteobacteria and Acidobacteria, and type 4 laccase-like Cu-oxidase genes were >8 times more abundant than type 3 genes, suggesting an important and overlooked role for type 4 Cu-oxidase in phenolic compound degradation. Genes associated with sulfate reduction and methanogenesis were the most abundant anaerobic respiration genes in these systems, with low levels of detection observed for genes of denitrification and Fe(III) reduction. Fermentation genes increased in relative abundance with depth and were largely affiliated with Syntrophobacter. Methylocystaceae-like small-subunit (SSU) rRNA genes, pmoA, and mmoX genes were more abundant among methanotrophs. Genes encoding N2 fixation, P uptake, and P regulons were significantly enriched in the surface peat and in comparison to other ecosystems, indicating N and P limitation. Persistence of inorganic orthophosphate throughout the peat profile in this P-limiting environment indicates that P may be bound to recalcitrant organic compounds, thus limiting P bioavailability in the subsurface. Comparative metagenomic analysis revealed a high metabolic potential for P transport and starvation, N2 fixation, and oligosaccharide degradation at MEF relative to other wetland and soil environments, consistent with the nutrient-poor and carbohydrate-rich conditions found in this Sphagnum-dominated boreal peatland.
INTRODUCTION
Boreal peatland ecosystems represent an important component of the global carbon cycle (1, 2). The function of these ecosystems as a carbon sink is attributed to suppressed organic matter decomposition constrained by a combination of low temperature, low pH, anoxia, chemically complex substrates, and potential nutrient limitation (3, 4). Global climate change is likely to alter the carbon balance of peatland ecosystems (5). However, peatlands are complex adaptive systems, and the responses of biological communities and ecosystem-level biogeochemical processes as well as potential feedbacks to climate change drivers in peats are poorly understood (6). Research that employs emerging systems biology such as -omics approaches along with advanced analytical chemistry provides new opportunities to bridge the knowledge gap across scales and to link microbial functions with biogeochemical cycles (7–10). Metagenomic studies of complex soil microbial communities have been conducted in boreal peatland and permafrost soils which contain a substantial mineral component (11–14). A metagenomic study of acidic and ombrotrophic peatlands, with extremely low mineral content, will provide novel insights into microbial specialization and functions in this unique terrestrial ecosystem that covers large areas of northern latitudes.
Ombrotrophic bogs are among the most nutrient poor of terrestrial environments, as they lack groundwater input and receive nutrients mainly from precipitation (15). The microbial N and P cycles are understudied in peatlands compared to other terrestrial ecosystems such as forest or agricultural soils (16–19). In particular, information on the role of organic P and the microbially mediated breakdown and acquisition of organic P in peatlands is rare in contrast to other wetlands and marine environments (20–22). This knowledge gap is at least partly due to methodological challenges and the specialized nature of methods used to characterize organic P in hydrated soils. Solution 31P nuclear magnetic resonance (NMR) is an advanced analytical tool to identify and quantify P functional groups and has been employed successfully in soils (23, 24). However, linking P chemical groups with microbial function has received little attention and could provide novel insight into microbial mediation of the terrestrial P cycle.
Given the global extent of boreal forests and their uncertain fate with climatic change, these environments are considered “tipping points” among global ecosystems, representing high-priority biomes for climate change research (25). Thus, a large-scale field manipulation experiment known as Spruce and Peatland Response Under Climatic and Environmental Change (SPRUCE) was initiated at the Marcell Experimental Forest (MEF), Minnesota, USA, by the U.S. Department of Energy, the U.S. Department of Agriculture (USDA) Forest Service, and Oak Ridge National Laboratory (http://mnspruce.ornl.gov/). The MEF complex has been the subject of numerous studies over the last 5 decades in the areas of C sequestration, greenhouse gas emission, geomorphology, basic hydrology, geochemistry, and vegetation (26). Prior to initiation of the climate manipulation, the objective of this study was to closely couple metagenomics with 31P NMR spectroscopy to elucidate the metabolic potential of microorganisms that catalyze carbon transformation and nutrient cycling (especially phosphorus limitation) in peatland soils.
MATERIALS AND METHODS
Study sites and sampling.
Samples were taken in February 2012 from the S1 bog and Bog Lake fen sites in the Marcell Experimental Forest (MEF) in northern Minnesota, USA. The peatland was under snow cover at the time of sampling. Sampling sites (T3M and T3F at the bog and Fen1 and Fen2 at the fen) for metagenomic studies were 4 of 11 sites subjected to intensive characterization to understand spatial and temporal dynamics in microbial community composition and biogeochemical conditions, as described in our accompanying paper (27). The bog is an acidic (pH 3.5 to 4.0) and nutrient-deficient environment that receives water inputs primarily from precipitation. In contrast, the Bog Lake fen (pH ≈4.5 to 4.8) is a poor fen, which contains a higher coverage of vascular plants along with Sphagnum. Hydrological and vegetation information is given in more detail in reference 26. Peat cores were sampled in hollows where the water level reached the surface of the Sphagnum layer. Core sections from 0- to 10-, 25- to 50-, and 75- to 100-cm depth intervals were homogenized and subsampled in sterile bags. Samples for DNA extractions were frozen at −20°C within 2 h of sampling and then transferred to a −80°C freezer at the end of the sampling day.
DNA preparation and sequencing.
Genomic DNA was extracted from triplicate peat soils using a MoBio PowerSoil DNA extraction kit (MoBio, Carlsbad, CA) according to the manufacturer's protocol and using 0.5 g of peat per extraction. Extracted DNA samples were pooled in an equimolar ratio. Libraries for metagenomic sequencing were generated using the Nextera DNA sample preparation kit (Epicentre, Madison, WI). Fragmented DNA was processed for sequencing by size selection using a PippinPrep instrument (Sage Scientific, Beverly, MA). Fragments from 400 to 800 bp were selected from each library and quantitated using a library quantification kit (KAPA Biosystems, Woburn, MA). Libraries were pooled in an equimolar ratio and sequenced using an Illumina HiSeq2000 instrument, employing paired-end reads of 100 bases in length. Recent studies have verified that there is minimal bias associated with using the Nextera kit for metagenome construction (28).
Solid-phase P analysis.
Phosphorus was extracted from each bog sample by a 2-step extraction method using an EDTA and NaOH solution. Individual phosphorus components in selected soil samples from the T3F sites were determined by 31P NMR spectroscopy after first extracting the solid samples with NaOH-EDTA according to a protocol described elsewhere (23). Total P in soils before and after the NaOH-EDTA extraction was determined by combustion of soil at 550°C in a muffle furnace for 4 h, dissolution of the ash in 6 mol liter−1 HCl, and then detection of the resulting soluble reactive P using standard molybdate colorimetry.
The mixture was then centrifuged, the precipitate was discarded, and the supernatant was collected and freeze-dried. Between 200 and 500 mg of P extract was weighed and then dissolved in 1.5 ml of D2O and 0.5 ml of 1 N NaOH, and this solution was then transferred to a 5-mm NMR tube for analysis. Solution 31P NMR spectra were obtained using a Bruker 600-MHz NMR spectrometer operating at 242.9 MHz for phosphorus. All chemical shifts are expressed in parts per million and referenced to an external standard of 85% H3PO4. An internal standard of methylene diphosphonic acid was used for quantification. Peak assignments followed those of reference 24.
Bioinformatic analysis.
FASTQ files from the metagenomic sequencing were loaded into the MG-RAST server for quality filtering and downstream analysis (29). The paired-end reads from each library were joined and then filtered with the default parameters. The average coverage (fraction of the genomes recovered in a sequencing data set) of each metagenome sample was estimated by the program Nonpareil (30). The rRNA gene sequences were annotated by RDP with a maximum E value cutoff of 10−5 and an identity cutoff of 60%. The generated biom-format file in MG-RAST was downloaded for community composition analysis. The 454 amplicon sequences of 16S rRNA genes from the same samples (27) were included to compare microbial community composition analyzed by two methods. Protein and pathway search was performed with SEED annotations (E value of 10−5) in MG-RAST. The amino acid sequences derived from the gene calling were also downloaded for searching specific functional genes associated with biogeochemical cycles and sugar metabolisms. Specifically, the Pfam-A database (PFAM release 26, http://pfam.janelia.org), containing curated seed alignments based on a small set of representative members of each protein family, was downloaded for searching phenol oxidases, formyltetrahydrofolate synthetase (FTHFS)/formate-tetrahydrofolate ligase, phosphatases, glycoside hydrolases (GH), proteins with a carbohydrate-binding motif, carbohydrate esterases, polysaccharide lyases, and other carbohydrate-active enzymes by using HMMER v3.0 tools (http://hmmer.janelia.org/).
In addition, Hidden Markov Models (HMM) for some functional genes absent in the Pfam database were created using HMM training sequences downloaded from the Functional Gene Pipeline and Repository (http://fungene.cme.msu.edu/). All HMM search hits with E values below a threshold of 10−5 were counted. For the taxonomic assignment of gene sequences, the corresponding BLASTP search outputs were uploaded for analysis in MEGAN (31). The number of sequence hits for each gene or pathway was divided by hits of a housekeeping gene, RNA polymerase ropB (Pfam HMM model PF00562.23). Since this conserved gene marker is one copy per genome, the relative abundance of each gene presumably represents the sequence counts per cell.
Metagenomes generated in this study were compared with soil metagenomes obtained from a variety of environments, including those from Minnesota farm soil (12), Puerto Rican rainforest soil (http://www.ncbi.nlm.nih.gov/sra/?term=SRR034258), Arctic permafrost (32), a tropical peat swamp (33), and an Arctic fen (11). As all of these metagenomes were sequenced using Roche 454 pyrosequencing with long reads, the downloaded sequences were cut and homogenized to 100 bp using Genometools v1.5.1 (http://genometools.org/index.html) to approximate the short Illumina reads generated in this study and to minimize count bias caused by sequence read length. The homogenized sequences were then uploaded to MG-RAST and subjected to the same analyses as those described above.
Functional similarity among the 9 metagenomes was compared using principal coordinate analysis with the Bray-Curtis similarity of gene abundance as inputs, performed in the program PRIMER v6 (Primer-E Ltd., United Kingdom). A heat map of gene and pathway counts and their clustering analysis was analyzed with the MeV program (www.tm4.org/mev.html).
RESULTS AND DISCUSSION
Chemical environment: phosphorus content and composition in solid peats.
Total P concentration in the soil declined from 36.8 mg kg−1 dry soil at the surface to 19.6 mg/kg at a 175- to 200-cm depth (Fig. 1), suggesting that a significant amount of P is recycled and retained in the surface and that this process is primarily controlled by vegetation and microorganisms (34). Figure 1 (see also Fig. S1 in the supplemental material) summarizes the distribution of phosphorus species and their spectra as a function of depth. Orthophosphate monoester is a dominant form of organic phosphorus in this peat, with the presence of smaller concentrations of orthophosphate diesters observed. The dominance of orthophosphate monoester in organic P is consistent with other studies conducted in soils of the western United States (35). Generally, orthophosphate monoesters (mainly inositol phosphates) exhibit a higher charge density and thus stronger adsorption to soils than do orthophosphate diesters, leading to less microbial degradation and to preferential stabilization and accumulation of orthophosphate monoesters in soils (35, 36). Both polyphosphate and pyrophosphate (an inorganic polyphosphate with a chain length of 2) were detectable only in the surface, suggesting rapid utilization of these inorganic phosphates. The phosphonate peaks near the mid-depth suggest a net production by microbial metabolism (37). Spectra of samples from the 75- to 100-cm and 175- to 200-cm horizons appear quite similar, reflecting a stable phosphorus pool dominated by inorganic orthophosphate, with some contribution from orthophosphate monoesters in the deep zone.
FIG 1.
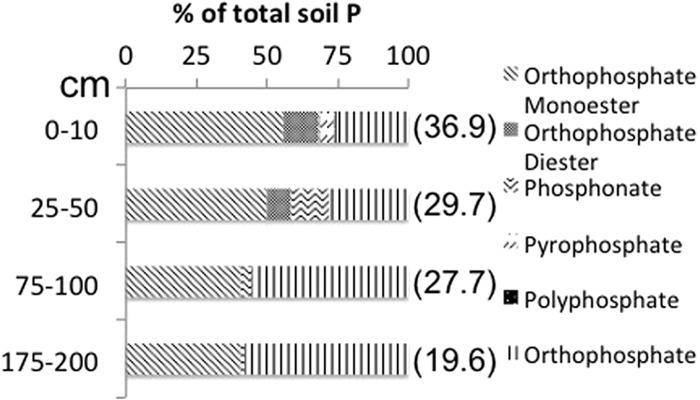
Total phosphorus content (in parentheses, mg P/kg dried soil) in bog samples and P functional groups determined by solution 31P NMR spectroscopy. See NMR spectra from each depth in Fig. S1 in the supplemental material.
Properties of metagenomes.
A total of 6 metagenomic libraries were obtained from the 3 distinct vertical zones (acrotelm, mesotelm, and catotelm; see reference 27) observed in the peat column at the Marcell Experimental Forest (MEF) and documented in companion studies (Table 1) (27, 38). The average coverage of each sequenced metagenome increased with depth and ranged from 42% to 86% (Table 1). The three zones differed in physical (e.g., bulk density) and chemical (e.g., organic matter composition) properties. A neighbor-network analysis showed that microbial community composition and functional potential had more pronounced change across depths than over space in either bog or fen sites (see Fig. S2 in the supplemental material). Thus, sequences from two surface bog metagenomes were combined into one data set for downstream analyses, and the same procedure was used for the two surface metagenomes from the fen sites. After pooling, Illumina sequencing resulted in 4.6 to 10.4 Gb per library. On average, 33% and 50% of reads were annotated to known and unknown proteins, respectively (Table 1).
TABLE 1.
Properties of 6 metagenomes constructed in this study based on the MG-RAST analysisa
| Site | Type | Depth (cm) | Total no. of reads (×107) | Coverage (%) | % failed QC | % annotated protein | % unknown protein | % GC |
|---|---|---|---|---|---|---|---|---|
| Fen1 | Fen | 0–10 | 5.93 | 52 | 9.4 | 33.9 | 48.9 | 59 |
| Fen2 | Fen | 0–9 | 4.48 | 57 | 6.7 | 26.8 | 53.2 | 55 |
| T3M | Bog | 0–6 | 4.83 | 42 | 11 | 35.2 | 47.6 | 59 |
| T3F | Bog | 0–3 | 4.61 | 65 | 9.8 | 35.4 | 47.7 | 58 |
| T3F | Bog | 25–50 | 9.07 | 67 | 8.8 | 37.1 | 47.1 | 58 |
| T3F | Bog | 75–100 | 4.63 | 86 | 5.5 | 28.8 | 53.5 | 57 |
The read length is 100 bp. The coverage indicates the fraction of the genomes recovered in a sequencing data set with the current sequencing effort. QC, quality control.
Generally, our metagenomic results were reproducible and consistent between samples from the same depth and site. For example, 76% of the total compared genes and pathways listed in Table 2 showed less than 30% variation in relative abundance in pairwise comparisons among 4 surface metagenomes, relative to, on average, 77% and 88% variation from 0-cm to 25-cm and from 0-cm to 75-cm metagenomes, respectively. High reproducibility of metagenomic data has also been reported in other studies (39, 40), ensuring that the results reported here are robust and likely to be characteristic of peatland microbial communities.
TABLE 2.
Sequence counts for genes or pathways relative to the total count of the housekeeping gene rpoBa
| Pathway or gene | Searching source | Sequence count (%) from sample |
|||
|---|---|---|---|---|---|
| Fen, 0–10 cm | Bog (cm) |
||||
| 0–10 | 25–50 | 75–100 | |||
| Oxidases | |||||
| Cu-oxidase type 3 | PF07732.10 | 3.3 | 3.8 | 0.8 | 0.3 |
| Cu-oxidase type 4 | PF02578.10 | 14.0 | 15.8 | 20.1 | 15.5 |
| Dioxygenase | PF00775.16 | 13.5 | 12.2 | 8.7 | 2.1 |
| Peroxidase | PF00141.18 | 3.1 | 3.0 | 3.8 | 3.9 |
| Carbohydrate metabolism | |||||
| Polysaccharides | SEED | 65.0 | 9.6 | 17.5 | 29.8 |
| Di- and oligosaccharides | SEED | 76.5 | 48.5 | 87.4 | 241.7 |
| Monosaccharides | SEED | 217.4 | 232.9 | 313.2 | 406.8 |
| Glycoside hydrolases | SEED | 1.2 | 1.2 | 4.2 | 5.0 |
| Amino sugars | SEED | 1.0 | 8.3 | 20.6 | 20.0 |
| Organic acids | SEED | 40.6 | 23.6 | 96.8 | 13.5 |
| Anaerobic respiration | |||||
| dsrA | Fungene | 1.1 | 1.9 | 13.9 | 12.3 |
| Sulfur oxidation (SoxB and SoxY) | SEED | 2.0 | 2.0 | 4.0 | 4.1 |
| nirK | Fungene | 0.6 | 1.5 | 1.4 | 0.9 |
| nirS | Fungene | 0.0 | 0.1 | 0.1 | 0.3 |
| nosZ | Fungene | 0.8 | 1.6 | 0.8 | 0.4 |
| Decaheme cytochrome c, MtrA | SEED | 0 | 0 | 0 | 0 |
| Fe(III) respiration outer membrane protein, MtrB | SEED | 0.0 | 0.1 | 0.0 | 0.0 |
| Fermentation and acetogenesis | |||||
| Fermentation | SEED | 45.0 | 40.0 | 134.7 | 74.3 |
| Acetoin, butanediol metabolism | SEED | 6.3 | 1.7 | 8.1 | 3.3 |
| Acetone, butanol, ethanol synthesis | SEED | 6.5 | 7.2 | 45.5 | 38.1 |
| Acetyl-CoA to butyrate | SEED | 12.4 | 9.3 | 62.6 | 18.2 |
| Butanol biosynthesis | SEED | 3.4 | 7.0 | 10.9 | 5.3 |
| Fermentations: lactate | SEED | 14.0 | 11.8 | 6.5 | 3.5 |
| Fermentations: mixed acid | SEED | 2.4 | 3.1 | 1.1 | 6.0 |
| hydA | Fungene | 9.8 | 17.1 | 28.1 | 25.6 |
| Homoacetogenesis: FTHFS | PF01268.14 | 66.9 | 63.2 | 64.6 | 66.2 |
| CH4 cycle | |||||
| mcrA | Fungene | 0.0 | 0.4 | 8.7 | 13.5 |
| pmoA | Fungene | 0.1 | 0.8 | 1.4 | 0.2 |
| mmoX | Fungene | 0.0 | 0.3 | 1.2 | 0.9 |
| N cycle | |||||
| nifD | Fungene | 12.6 | 24.5 | 23.9 | 7.1 |
| nifH | Fungene | 12.6 | 21.1 | 20.0 | 8.1 |
| ureA | Fungene | 16.8 | 15.5 | 7.4 | 1.9 |
| Aminopeptidases | SEED | 28 | 5 | 4 | 0 |
| Metallocarboxypeptidases | SEED | 3 | 3 | 2 | 0 |
| Metalloendopeptidases | SEED | 6 | 4 | 2 | 1 |
| P cycle | |||||
| Phosphate transport regulator (distant homolog of PhoU) | SEED | 68.8 | 42.9 | 2.9 | 0.1 |
| High-affinity phosphate transporter and control of PHO regulon | SEED | 5.9 | 3.9 | 2.0 | 1.3 |
| PhoR-PhoB two-component regulatory system | SEED | 1.9 | 1.5 | 2.1 | 0.2 |
| Phosphate regulon sensor protein PhoR (SphS) (EC 2.7.13.3) | SEED | 62.8 | 3.3 | 0.3 | 0.1 |
| Phosphate starvation-inducible ATPase PhoH | SEED | 0.3 | 0.8 | 0.2 | 0.0 |
| Alkylphosphonate utilization (C-P lyase complex) | SEED | 0.5 | 0.9 | 168.3 | 59.3 |
| Acid phosphatase | PF01451.16 | 4.2 | 5.4 | 7.4 | 11.2 |
| Alkaline phosphatase | PF00245.15 | 0.2 | 0.2 | 0.1 | 0.3 |
| ATP-dependent proteolysis (mainly protease La [EC 3.4.21.53]) | SEED | 8 | 12 | 16 | 107 |
Total numbers of hits of the rpoB gene are 6,365, 5,272, 5,639, and 3,558, respectively, corresponding to the samples listed in the table (in order). Searching sources indicate the three methods used: HMM search against Pfam seed database (PF), HMM search against customer-created functional gene HMM (Fungene), and SEED subsystem. PFxxxx indicates Pfam protein.
Microbial community composition in peats.
The small-subunit (SSU) rRNA gene sequences from the metagenomes were primarily derived from Bacteria (93% ± 3%, mean ± standard deviation), with similar contributions by Archaea (3% ± 3%) and eukaryotes (3% ± 3%) on average. At the phylum level, there was a general agreement in community composition between the bxmetagenomic approach and 454 amplicon sequencing of SSU rRNA genes (Fig. 2). Bacteria were codominated by Acidobacteria (32% ± 10%), Proteobacteria (18% ± 6%), and Verrucomicrobia (18% ± 6%) at all depths assessed by both methods. However, Firmicutes were on average 11% ± 5% of the total metagenomic libraries relative to <1% of the amplicon sequences. Crenarchaeota were less than 2% of the total community in all metagenomes, relative to up to 20% of total amplicon sequences at depth. The discrepancy in crenarchaeotal abundance between two sequencing approaches is likely due to overamplification of Crenarchaeota by the primers selected. Shakya et al. demonstrated that primers targeting the V4 region of the SSU rRNA gene overestimated Crenarchaeota by up to 8 times (41). Eukaryotic SSU rRNA gene sequences, which comprised up to 6% of the total community near the surface, declined to a very low relative abundance at depth. The major eukaryotic taxa were fungi (mainly Ascomycota and Basidiomycota) and land plants belonging to Streptophyta, with minor detection of protists such as Euglenida. Eukaryotic SSU rRNA sequences probably originated from undecomposed plant detritus that was degraded at depth, which has also been observed in metagenomes from permafrost soils (14).
FIG 2.
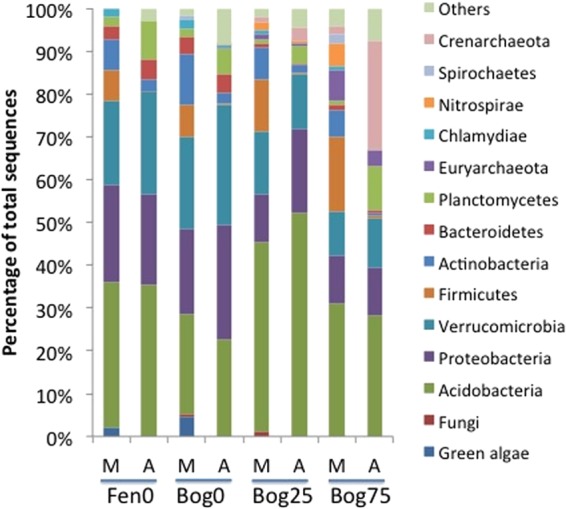
Microbial community composition across depths compared by using a metagenomic approach (M) and 454 amplicon sequencing (A). The number under each line indicates the sample depth in cm.
Key enzymes and pathways related to C, N, and P cycles. (i) Degradation of phenolic and aromatic compounds.
Aromatic compounds are a major class of organic matter in peat, originating from Sphagnum moss and accounting for 15 to 20% of total peat organic matter in our samples (27). Aromatic content increased with depth, suggesting that these compounds are recalcitrant to microbial degradation and thus accumulated in the deep peat. Three major enzyme classes responsible for aromatic compound decomposition are multicopper (Cu) oxidases (laccases or phenol oxidases), peroxidases, and dioxygenases (42). Currently, there are two types of Cu-oxidase associated with laccase-like activity: type 3 (lcc3) and type 4 (lcc4) (http://pfam.sanger.ac.uk/family/PF00394). The lcc3 enzyme and its encoding genes have been fairly well studied in microbial ecology (42, 43), while the lcc4 genes are often overlooked in soils. Furthermore, the lcc4 genes are different from and lack homology to the lcc3 genes (44). In our metagenomes, the relative abundance of sequences assigned to both the lcc3 oxidase and dioxygenases decreased 6-fold from the surface to the deeper portions of the bog (Table 2). In contrast, the relative abundance of peroxidase and the lcc4 oxidase was fairly consistent with depth, showing a relatively constant vertical distribution (Table 2). The lcc4 genes were 5 to 50 times more abundant than the lcc3 genes across all depths sampled. As known lcc4 oxidases have a 5-fold-higher enzyme affinity and a 40-fold-higher catalysis rate than do the lcc3 oxidases (44), the lcc4 oxidase dominance across all depths indicates that this enzyme could play a key role in both aerobic and anaerobic depolymerization and in the breakdown of lignin and aromatic compounds released from the peat.
(ii) Carbohydrate metabolism.
Carbohydrates dominate the organic content produced in the surface of the MEF peatland. Sequences assigned to the metabolism of all four known saccharide groups (monosaccharides, disaccharides, oligosaccharides, and polysaccharides) consistently increased with depth (Table 2), in line with an approximately 50% reduction in carbohydrate content from the surface to the deep peat (38). In addition, glycoside hydrolases that typically cleave oligo-/polysaccharides into small monosaccharides also increased with depth, suggesting that microbes in the subsurface allocate a substantial amount of energy to utilize sugar compounds prevalent at depth. A large variety of CAZy (carbohydrate-active enzyme) protein families were also detected using a PFAM search (see Fig. S3 in the supplemental material). Similar to a recent study of Arctic peat, oligosaccharide hydrolases and debranching enzymes exhibited the highest abundance among the CAZy families (11).
Genes encoding metabolism of both amino sugars (an important source of soil organic nitrogen) and organic acids showed highest representation at mid-depth in the mesotelm (Table 2), consistent with 13C NMR results showing maxima in N compound and organic acid content released from peat degradation in this zone (38). The surface samples from bog and fen showed a different potential for processing of carbohydrates, with the fen data set containing a lower gene content in amino sugar metabolism and a higher content affiliated with polysaccharide and organic acid metabolism. The difference likely resulted from differences in organic matter compositions in vegetation between sites and is consistent with data from organic matter characterization showing higher N and carbohydrate contents in the bog than in the fen at MEF (38).
(iii) Anaerobic processes: anaerobic respiration, fermentation, and methanogenesis.
Anaerobic C mineralization in peatlands is catalyzed by diverse bacterial and archaeal groups, which interact and compete for substrates and terminal electron acceptors. Among anaerobic respiration processes represented in our data set, sulfate reduction was predominant, as indicated by over 10-times-higher dissimilatory sulfite reductase alpha subunit (dsrA) gene abundance observed below a 25-cm depth than at surface depths (Table 2). Despite low sulfate concentrations detected in the pore water (27), sulfate reduction could still account for a substantial fraction of anaerobic C mineralization in many freshwater wetlands, including the MEF peatland (45–48). Consistently, the sulfur-oxidizing gene (sox) cluster (including soxB and soxY) also showed the highest relative abundance in the subsurface (Table 2). It appears that the reduced inorganic sulfur pool turns over relatively rapidly, enabling the sulfate reduction process (49). Far fewer sequences were assigned to denitrification and Fe(III) reduction pathways (Table 2). Denitrification as indicated by nitrous oxide reductase (nosZ) and nitrite reductase (nirS/nirK) genes generally declined with depth. Decaheme cytochrome c mtrA genes, essential for extracellular respiration of Fe(III) in some Fe-reducing species and used as a potential indicator of Fe reduction in other soil metagenomes (13), were not detectable in our metagenomes.
Fermentation and acetogenesis are important processes in peatland soils, and their metabolites, such as acetate and hydrogen, fuel methanogenesis and other respiration pathways (50, 51). Fermentation processes, as indicated by pathways of lactate and mixed acid fermentation as well as the terminal FeFe-hydrogenase group A (hydA) of H2-evolving fermentation, generally showed the highest relative abundance at mid-depth in the MEF (Table 2). Formyltetrahydrofolate synthetase (FTHFS) genes, encoding the key enzyme of the acetyl coenzyme A (acetyl-CoA) pathway of homoacetogenesis, were abundant at all depths, suggesting the prevalence of intermediary pathways of carbon oxidation under anaerobic conditions. A range of bacterial functional guilds present in acidic wetlands contain the FTHFS gene marker, including homoacetogens, acetogenic syntrophs, sulfate reducers, and methanogens (52). The top hit by far for FTHFS genes was affiliated with the acetogen Syntrophobacter, and thus, we hypothesize that secondary fermentation is fueling anaerobic respiration pathways such as methanogenesis through the production of acetate and hydrogen (50).
Methane dynamics are critical to the role of boreal peatlands in global carbon storage. The majority of previous work indicates that hydrogenotrophic methanogens dominate in acidic bogs, whereas acetoclastic methanogens show increased abundance in fens (51). Metagenomes constructed from permafrost soils have also revealed a prevalence of hydrogen-utilizing methanogens (14, 53). In the metagenomes from the MEF, sequences assigned to methanogenesis pathways and the methyl-coenzyme M reductase alpha subunit (mcrA) gene consistently increased with depth (Table 2), and 16 genera of methanogens were detected. Dominant genera were associated with both hydrogenotrophic (Methanocella and Methanoplanus) and acetoclastic (Methanosaeta and Methanosarcina) pathways (see Table S1 in the supplemental material). The top hits were affiliated with hydrogen-utilizing genera, Methanocella and Methanoplanus, in corroboration with permafrost studies. However, in our companion paper (27), stable isotope geochemistry and potential rates of methane production paralleled vertical changes in methanogen community composition to indicate a predominance of acetoclastic methanogenesis mediated by the Methanosarcinales in the mid-depth mesotelm, while hydrogen-utilizing methanogens predominated in the deeper catotelm. Further studies are required to definitively link the pathways of methane production to methanogen community composition.
(iv) Methane oxidation.
Aerobic methanotrophs act as an important barrier for the removal of methane produced in subsurface soils, and these organisms reside near the surface of the water table at the oxic-anoxic interface. In the MEF peatland, the distribution of methanotrophs represented by pmoA and mmoX genes, encoding particulate and soluble methane monooxygenase (MMO), respectively, showed the highest relative abundance at the mid-depth mesotelm (Table 2). Indeed, the mesotelm contains the water table and was recognized as a biogeochemical hot spot at MEF, where the most intense peat decomposition and methane production occur (38). Thus, more methane is available for methanotrophs in the mesotelm. Community composition based on 16S rRNA gene sequences (27) and phylogenetic assignments of pmoA and mmoX genes (see Table S1 in the supplemental material) both showed that members of the Methylocystaceae (type II methanotrophs) were more abundant than the Methylococcaceae (type I methanotrophs) in our samples, in corroboration with observations in other northern peatlands (54–56). This observation contrasts with the dominance of Methylococcaceae found in metagenomes from the Arctic fen and mineral soils (11). The abundance of type II methanotrophs in peatlands could be explained by the fact that the Methylocystaceae (Methylocystis) were shown to be acidophilic or acidotolerant, while no acidophilic representatives are known among type I methanotrophs (57, 58). In addition, copper limitation in nutrient-poor ombrotrophic peatlands may also favor non-copper-dependent type II methanotrophs (56). None of the pmoA gene sequences retrieved from our metagenomes were grouped with the Methylacidiphilaceae-like pmoA gene sequences (data not shown), consistent with SSU rRNA gene-based amplicon sequencing results indicating that verrucomicrobial methanotrophs have not yet been detected in acidic peatlands (27, 59).
(v) N and P nutrient limitation and metabolism.
Peat bogs are nutrient-poor environments, with N-fixing cyanobacteria, methanotrophs, and heterotrophs prevalent in the peat surface (18, 60). At MEF, nitrogen fixation genes (nifD and nifH) were most abundant above 75 cm and least abundant in the deep peat (Table 2), consistent with the availability of soluble inorganic nitrogen in the pore waters (27). In addition, sequences annotated to ureases (ureA gene) and a variety of proteases also declined with depth (Table 2), suggesting an occurrence of active organic N degradation in the surface accompanied by declining activity at depth. 13C NMR analysis showed that nitrogen is enriched in the degraded peat material and detected as N-alkyl compounds (mainly protein) (38), indicating a substantial accumulation of N (probably as microbial biomass). The loss of N during peat decomposition in this ombrotrophic environment likely limits N availability to microorganisms and plants. Moreover, an analysis of the C, N, and P acquisition enzymes indicated P limitation and microbial resource allocation to P acquisition, suggesting that P availability has a stronger influence over microbial growth and organic matter decomposition at MEF (27). Phosphorus limitation of microbial processes, especially N2 fixation, has been reported in other soil environments (61, 62). Since N fixers have greater demands for P than do nonfixers, P limitation is likely in the surface peat where N2 fixation genes are most abundant (63).
The 31P NMR analysis of solid-phase peat showed that inorganic polyphosphate/pyrophosphate and organic orthophosphate mono-/diesters declined with depth, with an increase in orthophosphate with depth (Fig. 1). This is consistent with the declining vertical distribution of phosphatase activity (27), which degrades organic P to phosphate. Despite the highest total soil P and active degradation of P from organic P in the surface, competition for P between microbes and plants could explain why P is a limiting resource (34). This is supported by our observation of a much higher sequence annotation to phosphate transport and starvation regulation systems in surface peat than in deep peat (Table 2). Phosphonate peaked at the mid-depth (Fig. 1) and is presumably produced by microorganisms that take advantage of the stable C-P bond of phosphonate in a P-limited environment (37). In addition, pathways of alkylphosphonate utilization (mainly C-P lyase complex) were also enriched at mid-depth (Table 2), suggesting that the phosphonate P is actively recycled regardless of the highly stable C-P bond of phosphonate. Furthermore, high concentrations of organic acids released from peat decomposition in the mesotelm may help dissolve P from solid peat and increase P availability (21). Phosphatase gene sequences per cell in the metagenomes increased in abundance with depth (Table 2), suggesting that the microorganisms at 75 to 100 cm allocate more resources to generate phosphatase genes and enzymes to meet their P requirement. Interestingly, we observed an increase of over an order of magnitude in genes encoding ATP-dependent proteolysis complex (mainly Lon ATP-dependent protease) from the surface to depths below 75 cm. It is well known that the Lon ATP-dependent protease degrades abnormal and regulatory proteins, which allows cells to achieve balanced growth and respond to external stress, including starvation and acidity (64, 65).
One of the most interesting features of the phosphorus speciation data is the persistence of solid-phase inorganic orthophosphate throughout the peat profile (Fig. 1). Inorganic orthophosphate is normally assumed to be the most bioavailable form of phosphorus, but its persistence here suggests otherwise. Similar trends have been observed by Hamdan et al. in other wetland soils (23). Hamdan et al. (23) used hydrofluoric acid pretreatments and concluded that such persistent inorganic orthophosphate was most likely bound to relatively recalcitrant organic compounds such as alkyl and aromatic compounds prevalent at depth, limiting P bioavailability. This effect was most pronounced in highly humified soils that are similar to the deeper solid-phase peat at the MEF site. Therefore, we hypothesize that P limitation in the surface and that in the deep peat are caused by fundamentally different mechanisms.
Taxonomic assignments of key functional genes.
Fungi are generally thought to play a more important role than bacteria in decomposition processes in peatlands, especially in the aerobic surface layer or acrotelm (66). In addition, fungi are believed to predominate over the decomposition of recalcitrant organic compounds such as polyphenolics in forest soils. This does not appear to be the case in the MEF peatland, where results indicate that prokaryotes dominate in the overall community and in the abundance of genes encoding laccase, phenol oxidase, and peroxidase. Alphaproteobacteria generally dominated the sequence annotations of almost all listed functional genes, except dsrA and mcrA, which were mainly contributed by Deltaproteobacteria and euryarchaeotal methanogens, respectively (Fig. 3). Approximately 65% of the type 3 laccase (lcc3) gene sequences were assigned to 4 subphyla of Proteobacteria, and 12% were associated with Acidobacteria. This is in contrast to the more than one-third of total bacterial laccase sequences assigned to Acidobacteria in other peat soils (43). Our observation suggests that Proteobacteria may play a more important role in generating phenol oxidases than do Acidobacteria, at least for producing lcc3. In comparison, Acidobacteria had higher representation (50%) in the lcc4 sequence data set than did Proteobacteria (37%). However, the ecological role of the lcc4 oxidase is less studied than that of the lcc3 oxidase. Fungi and Streptophyta accounted for only less than 2.5% of total Cu-oxidase sequences. Both dioxygenase and peroxidase genes were dominated by sequences affiliated with members of the Proteobacteria and Actinobacteria. Thus, our data indicate that Proteobacteria, Acidobacteria, and Actinobacteria are the three most important phyla in generating phenol oxidases at MEF.
FIG 3.

Phylum-level taxonomic assignments of key functional genes based on BLASTP search. “Phosphatase” indicates acidic phosphatase gene.
Microbial populations with N2 fixation potential as indicated by nifD and nifH genes were diverse and largely distributed among the Rhizobiales and Syntrophobacterales (see Table S1 in the supplemental material). Phosphatase-like sequences were relatively more evenly distributed among major bacterial (sub)phyla, reflecting the essential role of P acquisition in all microbes at MEF (Fig. 3). In addition, Solibacter (Acidobacteria) appeared to play a dominant role (10.5% of total phosphatase sequences) among all taxa in generating phosphatase (see Table S1 in the supplemental material).
Approximately 32% of dsrA sequences were assigned to Syntrophobacterales (mainly Syntrophobacter and Desulfobacca), followed by Firmicutes (mainly Carboxydothermus) and Euryarchaeota (mainly Archaeoglobus) (Fig. 3; see also Table S1 in the supplemental material). Fermentation and acetogenesis, respectively, were indicated by hydA and FTHFS genes from relatively diverse bacteria, with Syntrophobacter showing the most abundant sequence assignment (12%) for the FTHFS genes. All other taxa accounted for less than 4% of total sequences assigned to either hydA or the FTHFS genes.
Comparison of the peatland metagenomes with other soil metagenomes.
To provide perspective on the uniqueness of the metabolic potential of microorganisms at MEF, our data set was compared with other 5 metagenomes obtained from a variety of similar soil environments, and several key trends were revealed (Fig. 4; see also Fig. S5 in the supplemental material). The 9 metagenomes were generally grouped into three clusters based on their functional potential (Fig. 4; see also Fig. S5). It is not surprising to see the highest abundance of dsrA and mcrA genes detected in the 25-cm and 75-cm metagenomes. However, a much higher incidence of alkylphosphate utilization genes in the subsurface than in all surface metagenomes suggests that production and degradation of alkylphosphonate may mainly occur in the anoxic terrestrial subsurface.
FIG 4.

Principal coordinate analysis of the functional similarity of the 9 metagenomes (indicated by crosses). Functional vectors (light gray) representing their Pearson correlation coefficients of >0.5 with the first two principal coordinate (PCO) axes are depicted. PHO regulon, high-affinity phosphate transporter and control of PHO regulon; PhoU, phosphate transport regulator (distant homolog of PhoU); PhoR-PhoB, PhoR-PhoB two-component regulatory system; PhoR sensor, phosphate regulon sensor protein PhoR.
Relative to the surface bog and fen metagenomes of this study, other surface metagenomes contained on average >6-times-higher relative abundances of genes associated with acidic phosphatases, Cu-oxidase, and denitrification (Fig. 4; see also Fig. S5 in the supplemental material). A lower level of phosphatases and denitrification genes in our samples may reflect substrate (N and P) limitation in this nutrient-poor environment. Microorganisms in the Minnesota and tropical peatlands harbored an average of >7-times-higher nifH gene abundance than did other metagenomes (Fig. 4; see also Fig. S5), confirming N limitation and an important role for N2 fixation in peatlands, especially in the bog. Similarly, genes related to P transport and starvation regulation systems also showed the highest relative abundance in our samples (Fig. 4; see also Fig. S5), further indicating P limitation in this ombrotrophic peatland.
Our metagenomes were distinct from the others in terms of carbohydrate metabolism with a higher abundance of genes associated with degradation of oligosaccharides such as β-glucosidase (GH29 and GH38), β-galactosidase (GH35 and GH42), and fucosidase (GH39) enzyme families and less abundance of carbohydrate esterase genes such as the CE4 and CE14 genes (Fig. 4; see also Fig. S3 in the supplemental material). This can be explained by the fact that Sphagnum plants contain a higher content of carbohydrates than do other plants (67, 68). The higher fucosidase gene abundance in our bog metagenome (Fig. 4) is in line with a biomarker study showing that the high fucose content indicates a Sphagnum origin of organic matter relative to its origin from lichen and vascular plants (68). More work is needed to understand if the microbial genetic repertoire and gene expression reflect the complex composition of organic matter in peat.
Concluding remarks.
In agreement with peat decomposition as determined by the vertical distribution of plant-derived organic compounds (38), metagenomic analysis revealed diverse genes and pathways associated with the depth-dependent microbial potential for sugar and phenolic compound metabolism, fermentation, methane dynamics, and nutrient acquisition. Moreover, by closely coupling metagenomics with NMR, our results show strong evidence for depth-dependent P limitation in the peat column. Genes for P transport and P starvation regulons were most abundant in the surface and least abundant at mid-depth, in corroboration of evidence from enzyme activities that indicates P stress (27). In the mesotelm, the dissolution of solid-phase P compounds by the high concentration of organic acids released from peat decomposition and the presence of specific microbial pathways such as C-P lyase complex are hypothesized to alleviate P stress. The increased abundance of phosphatase genes indicated that more resources are allocated to P acquisition in the deep peat or acrotelm, presumably induced by the P limitation. Phosphorus limitation in the acrotelm is likely caused by (i) energy consumption by microbes responding to environmental stress, as indicated by a higher content of ATP-dependent proteolysis genes, and (ii) the lack of available P, due to the fact that a large portion is likely bound to relatively recalcitrant solid-phase inorganic and organic compounds such as alkyl and aromatic compounds prevalent at depth (23).
In general, microbial community composition and taxonomic assignments were consistent when analyzed by metagenomics or with SSU rRNA gene amplicon sequencing. However, some exceptions provided guidance for further study, as the Crenarchaeota and Firmicutes were over- and underrepresented in amplicon libraries, respectively. Consistent with the nutrient-poor and carbohydrate-rich conditions found in Sphagnum-dominated boreal peatlands, comparative metagenomics revealed a high metabolic potential for P transport and regulation, N2 fixation, and oligosaccharide degradation relative to other wetland and soil environments. Thus, our study provides a gene-level explanation for microbial functional specialization in the ombrotrophic peatland and suggests potential mechanisms controlling microbial C, N, and P cycles.
Supplementary Material
ACKNOWLEDGMENTS
We thank Randall K. Kolka, USDA Forest Service; Paul J. Hanson; Colleen Iversen; and other members of the SPRUCE project team for facilitating access to the Marcell Experimental Forest and the SPRUCE experimental facilities and for helping with sample handling and laboratory space support. We thank K. Konstantinidis for his helpful comments and discussions.
This work was supported by the Office of Biological and Environmental Research, Terrestrial Ecosystem Science Program, under U.S. DOE contract number DE-SC0007144, and the U.S. National Science Foundation (NSF-EAR-0628349).
The authors declare no conflict of interest.
Footnotes
Published ahead of print 28 March 2014
Supplemental material for this article may be found at http://dx.doi.org/10.1128/AEM.00206-14.
REFERENCES
- 1.Bridgham SD, Megonigal JP, Keller JK, Bliss NB, Trettin C. 2006. The carbon balance of North American wetlands. Wetlands 26:889–916. 10.1672/0277-5212(2006)26[889:TCBONA]2.0.CO;2 [DOI] [Google Scholar]
- 2.Limpens J, Berendse F, Blodau C, Canadell JG, Freeman C, Holden J, Roulet N, Rydin H, Schaepman-Strub G. 2008. Peatlands and the carbon cycle: from local processes to global implications—a synthesis. Biogeosciences 5:1475–1491. 10.5194/bg-5-1475-2008 [DOI] [Google Scholar]
- 3.Freeman C, Ostle N, Kang H. 2001. An enzymic ‘latch' on a global carbon store—a shortage of oxygen locks up carbon in peatlands by restraining a single enzyme. Nature 409:149. 10.1038/35051650 [DOI] [PubMed] [Google Scholar]
- 4.Moore TR, Basiliko N. 2006. Decomposition in boreal peatlands, p 125–143 In Wieder RK, Vitt DH. (ed), Ecological studies, vol 188 Boreal peatland ecosystems Springer-Verlag, Berlin, Germany [Google Scholar]
- 5.Dise NB. 2009. Peatland response to global change. Science 326:810–811. 10.1126/science.1174268 [DOI] [PubMed] [Google Scholar]
- 6.Belyea LR, Malmer N. 2004. Carbon sequestration in peatland: patterns and mechanisms of response to climate change. Global Change Biol. 10:1043–1052. 10.1111/j.1529-8817.2003.00783.x [DOI] [Google Scholar]
- 7.Jansson J. 2011. Towards “Tera-Terra”: terabase sequencing of terrestrial metagenomes. Microbe 6:309–315 [Google Scholar]
- 8.Gilbert J, Meyer F. 2012. Modeling the Earth microbiome. Microbe 7:64–69 [Google Scholar]
- 9.Jansson JK, Neufeld JD, Moran MA, Gilbert JA. 2012. Omics for understanding microbial functional dynamics. Environ. Microbiol. 14:1–3. 10.1111/j.1462-2920.2011.02518.x [DOI] [PubMed] [Google Scholar]
- 10.Falkowski PG, Fenchel T, Delong EF. 2008. The microbial engines that drive Earth's biogeochemical cycles. Science 320:1034–1039. 10.1126/science.1153213 [DOI] [PubMed] [Google Scholar]
- 11.Tveit A, Schwacke R, Svenning MM, Urich T. 2013. Organic carbon transformations in high-Arctic peat soils: key functions and microorganisms. ISME J. 7:299–311. 10.1038/ismej.2012.99 [DOI] [PMC free article] [PubMed] [Google Scholar]
- 12.Tringe SG, von Mering C, Kobayashi A, Salamov AA, Chen K, Chang HW, Podar M, Short JM, Mathur EJ, Detter JC, Bork P, Hugenholtz P, Rubin EM. 2005. Comparative metagenomics of microbial communities. Science 308:554–557. 10.1126/science.1107851 [DOI] [PubMed] [Google Scholar]
- 13.Lipson DA, Haggerty JM, Srinivas A, Raab TK, Sathe S, Dinsdale EA. 2013. Metagenomic insights into anaerobic metabolism along an Arctic peat soil profile. PLoS One 8:e64659. 10.1371/journal.pone.0064659 [DOI] [PMC free article] [PubMed] [Google Scholar]
- 14.Mackelprang R, Waldrop MP, DeAngelis KM, David MM, Chavarria KL, Blazewicz SJ, Rubin EM, Jansson JK. 2011. Metagenomic analysis of a permafrost microbial community reveals a rapid response to thaw. Nature 480:368–371. 10.1038/nature10576 [DOI] [PubMed] [Google Scholar]
- 15.Charman D. 2002. Peatlands and environmental change. John Wiley & Sons, New York, NY [Google Scholar]
- 16.Limpens J, Heijman MMPD, Berendse F. 2006. The nitrogen cycle in boreal peatlands, p 195–230 In Wieder K, Vitt DH. (ed), Ecological studies, vol 188 Boreal peatland ecosystems Springer-Verlag, Berlin, Germany [Google Scholar]
- 17.Weedon JT, Aerts R, Kowalchuk GA, van Logtestijn R, Andringa D, van Bodegom PM. 2013. Temperature sensitivity of peatland C and N cycling: does substrate supply play a role? Soil Biol. Biochem. 61:109–120. 10.1016/j.soilbio.2013.02.019 [DOI] [Google Scholar]
- 18.Bragazza L, Freeman C, Jones T, Rydin H, Limpens J, Fenner N, Ellis T, Gerdol R, Hajek M, Hajek T, Lacumin P, Kutnar L, Tahvanainen T, Toberman H. 2006. Atmospheric nitrogen deposition promotes carbon loss from peat bogs. Proc. Natl. Acad. Sci. U. S. A. 103:19386–19389. 10.1073/pnas.0606629104 [DOI] [PMC free article] [PubMed] [Google Scholar]
- 19.Walbridge MR, Navaratnam JA. 2006. Phosphorus in boreal peatlands, p 231–258 In Wieder K, Vitt DH. (ed), Ecological studies, vol 188 Boreal peatland ecosystems Springer-Verlag, Berlin, Germany [Google Scholar]
- 20.Condron LM, Turner BL, Cade-Menun BJ. 2005. The chemistry and dynamics of soil organic phosphorus, p 87–121 In Sims JT, Sharpley AN. (ed), Phosphorus: agriculture and the environment. American Society of Agronomy, Crop Science Society of America, and Soil Science Society of America, Madison, WI [Google Scholar]
- 21.Richardson AE, Simpson RJ. 2011. Soil microorganisms mediating phosphorus availability. Plant Physiol. 156:989–996. 10.1104/pp.111.175448 [DOI] [PMC free article] [PubMed] [Google Scholar]
- 22.Dyhrman ST, Ammerman JW, Van Mooy BAS. 2007. Microbes and the marine phosphorus cycle. Oceanography 20:110–116. 10.5670/oceanog.2007.54 [DOI] [Google Scholar]
- 23.Hamdan R, El-Rifai HM, Cheesman AW, Turner BL, Reddy KR, Cooper WT. 2012. Linking phosphorus sequestration to carbon humification in wetland soils by P-31 and C-13 NMR spectroscopy. Environ. Sci. Technol. 46:4775–4782. 10.1021/es204072k [DOI] [PubMed] [Google Scholar]
- 24.Turner BL. 2008. Soil organic phosphorus in tropical forests: an assessment of the NaOH-EDTA extraction procedure for quantitative analysis by solution (31)P NMR spectroscopy. Eur. J. Soil Sci. 59:453–466. 10.1111/j.1365-2389.2007.00994.x [DOI] [Google Scholar]
- 25.Lenton TM, Held H, Kriegler E, Hall JW, Lucht W, Rahmstorf S, Schellnhuber HJ. 2008. Tipping elements in the Earth's climate system. Proc. Natl. Acad. Sci. U. S. A. 105:1786–1793. 10.1073/pnas.0705414105 [DOI] [PMC free article] [PubMed] [Google Scholar]
- 26.Sebestyen SD, Dorrance C, Olson D, Verry ES, Kolka RK, Elling AE, Kyllander R. 2011. Long-term monitoring sites and trends at the Marcell Experimental Forest, p 15–71 In Kolka RK, Sebestyen SD, Verry ES, Brooks KN. (ed), Peatland biogeochemistry and watershed hydrology at the Marcell Experimental Forest. CRC Press, Boca Raton, FL [Google Scholar]
- 27.Lin X, Tfaily MM, Steinweg JM, Chanton P, Esson K, Yang ZK, Chanton JP, Cooper W, Schadt CW, Kostka JE. 2014. Microbial community stratification linked to utilization of carbohydrates and phosphorus limitation in a boreal peatland at Marcell Experimental Forest, Minnesota, USA. Appl. Environ. Microbiol. 80:3518–3530. 10.1128/AEM.00205-14 [DOI] [PMC free article] [PubMed] [Google Scholar]
- 28.Marine R, Polson SW, Ravel J, Hatfull G, Russell D, Sullivan M, Syed F, Dumas M, Wommack KE. 2011. Evaluation of a transposase protocol for rapid generation of shotgun high-throughput sequencing libraries from nanogram quantities of DNA. Appl. Environ. Microbiol. 77:8071–8079. 10.1128/AEM.05610-11 [DOI] [PMC free article] [PubMed] [Google Scholar]
- 29.Meyer F, Paarmann D, D'Souza M, Olson R, Glass EM, Kubal M, Paczian T, Rodriguez A, Stevens R, Wilke A, Wilkening J, Edwards RA. 2008. The metagenomics RAST server—a public resource for the automatic phylogenetic and functional analysis of metagenomes. BMC Bioinformatics 9:386. 10.1186/1471-2105-9-386 [DOI] [PMC free article] [PubMed] [Google Scholar]
- 30.Rodriguez-R LM, Konstantinidis KT. 2014. Nonpareil: a redundancy-based approach to assess the level of coverage in metagenomic datasets. Bioinformatics 30:629–635. 10.1093/bioinformatics/btt584 [DOI] [PubMed] [Google Scholar]
- 31.Huson DH, Mitra S, Ruscheweyh HJ, Weber N, Schuster SC. 2011. Integrative analysis of environmental sequences using MEGAN4. Genome Res. 21:1552–1560. 10.1101/gr.120618.111 [DOI] [PMC free article] [PubMed] [Google Scholar]
- 32.Yergeau E, Hogues H, Whyte LG, Greer CW. 2010. The functional potential of high Arctic permafrost revealed by metagenomic sequencing, qPCR and microarray analyses. ISME J. 4:1206–1214. 10.1038/ismej.2010.41 [DOI] [PubMed] [Google Scholar]
- 33.Kanokratana P, Uengwetwanit T, Rattanachomsri U, Bunterngsook B, Nimchua T, Tangphatsornruang S, Plengvidhya V, Champreda V, Eurwilaichitr L. 2011. Insights into the phylogeny and metabolic potential of a primary tropical peat swamp forest microbial community by metagenomic analysis. Microb. Ecol. 61:518–528. 10.1007/s00248-010-9766-7 [DOI] [PubMed] [Google Scholar]
- 34.Kellogg LE, Bridgham SD. 2003. Phosphorus retention and movement across an ombrotrophic-minerotrophic peatland gradient. Biogeochemistry 63:299–315. 10.1023/A:1023387019765 [DOI] [Google Scholar]
- 35.Turner BL, Cade-Menun BJ, Westermann DT. 2003. Organic phosphorus composition and potential bioavailability in semi-arid arable soils of the western United States. Soil Sci. Soc. Am. J. 67:1168–1179. 10.2136/sssaj2003.1168 [DOI] [Google Scholar]
- 36.Turner BL, Paphazy MJ, Haygarth PM, McKelvie ID. 2002. Inositol phosphates in the environment. Philos. Trans. R. Soc. B 357:449–469. 10.1098/rstb.2001.0837 [DOI] [PMC free article] [PubMed] [Google Scholar]
- 37.Kononova SV, Nesmeyanova MA. 2002. Phosphonates and their degradation by microorganisms. Biochemistry (Mosc.) 67:184–195. 10.1023/A:1014409929875 [DOI] [PubMed] [Google Scholar]
- 38.Tfaily MM, Cooper WT, Kostka J, Chanton PR, Schadt CW, Hanson PJ, Iversen CM, Chanton JP. 28 March 2014. Organic matter transformation in the peat column at Marcell Experimental Forest: humification and vertical stratification. J. Geophys. Res. Biogeosci. 10.1002/2013JG002492 [DOI] [Google Scholar]
- 39.Oh S, Caro-Quintero A, Tsementzi D, DeLeon-Rodriguez N, Luo CW, Poretsky R, Konstantinidis KT. 2011. Metagenomic insights into the evolution, function, and complexity of the planktonic microbial community of Lake Lanier, a temperate freshwater ecosystem. Appl. Environ. Microbiol. 77:6000–6011. 10.1128/AEM.00107-11 [DOI] [PMC free article] [PubMed] [Google Scholar]
- 40.Stewart FJ, Ottesen EA, DeLong EF. 2010. Development and quantitative analyses of a universal rRNA-subtraction protocol for microbial metatranscriptomics. ISME J. 4:896–907. 10.1038/ismej.2010.18 [DOI] [PubMed] [Google Scholar]
- 41.Shakya M, Quince C, Campbell J, Yang Z, Schadt C, Podar M. 2013. Comparative metagenomic and rRNA microbial diversity characterization using archaeal and bacterial synthetic communities. Environ. Microbiol. 15:1882–1899. 10.1111/1462-2920.12086 [DOI] [PMC free article] [PubMed] [Google Scholar]
- 42.Sinsabaugh RL. 2010. Phenol oxidase, peroxidase and organic matter dynamics of soil. Soil Biol. Biochem. 42:391–404. 10.1016/j.soilbio.2009.10.014 [DOI] [Google Scholar]
- 43.Ausec L, van Elsas JD, Mandic-Mulec I. 2011. Two- and three-domain bacterial laccase-like genes are present in drained peat soils. Soil Biol. Biochem. 43:975–983. 10.1016/j.soilbio.2011.01.013 [DOI] [Google Scholar]
- 44.Beloqui A, Pita M, Polaina J, Martinez-Arias A, Golyshina OV, Zumarraga M, Yakimov MM, Garcia-Arellano H, Alcalde M, Fernandez VM, Elborough K, Andreu JM, Ballesteros A, Plou FJ, Timmis KN, Ferrer M, Golyshin PN. 2006. Novel polyphenol oxidase mined from a metagenome expression library of bovine rumen—biochemical properties, structural analysis, and phylogenetic relationships. J. Biol. Chem. 281:22933–22942. 10.1074/jbc.M600577200 [DOI] [PubMed] [Google Scholar]
- 45.Vile MA, Bridgham SD, Wieder RK, Novak M. 2003. Atmospheric sulfur deposition alters pathways of gaseous carbon production in peatlands. Global Biogeochem. Cycles 17:1058. 10.1029/2002GB001966 [DOI] [Google Scholar]
- 46.Keller JK, Bridgham SD. 2007. Pathways of anaerobic carbon cycling across an ombrotrophic-minerotrophic peatland gradient. Limnol. Oceanogr. 52:96–107. 10.4319/lo.2007.52.1.0096 [DOI] [Google Scholar]
- 47.Roden EE, Wetzel RG. 1996. Organic carbon oxidation and suppression of methane production by microbial Fe(III) oxide reduction in vegetated and unvegetated freshwater wetland sediments. Limnol. Oceanogr. 41:1733–1748. 10.4319/lo.1996.41.8.1733 [DOI] [Google Scholar]
- 48.Pester M, Knorr K-H, Friedrich M, Wagner M, Loy A. 2012. Sulfate-reducing microorganisms in wetlands—fameless actors in carbon cycling and climate change. Front. Microbiol. 3:72. 10.3389/fmicb.2012.00072 [DOI] [PMC free article] [PubMed] [Google Scholar]
- 49.Vile MA, Bridgham SD, Wieder RK. 2003. Response of anaerobic carbon mineralization rates to sulfate amendments in a boreal peatland. Ecol. Appl. 13:720–734. 10.1890/1051-0761(2003)013[0720:ROACMR]2.0.CO;2 [DOI] [Google Scholar]
- 50.Drake HL, Horn MA, Wust PK. 2009. Intermediary ecosystem metabolism as a main driver of methanogenesis in acidic wetland soil. Environ. Microbiol. Rep. 1:307–318. 10.1111/j.1758-2229.2009.00050.x [DOI] [PubMed] [Google Scholar]
- 51.Bridgham SD, Cadillo-Quiroz H, Keller JK, Zhuang Q. 2013. Methane emissions from wetlands: biogeochemical, microbial, and modeling perspectives from local to global scales. Global Change Biol. 19:1325–1346. 10.1111/gcb.12131 [DOI] [PubMed] [Google Scholar]
- 52.Hunger S, Schmidt O, Hilgarth M, Horn MA, Kolb S, Conrad R, Drake HL. 2011. Competing formate- and carbon dioxide-utilizing prokaryotes in an anoxic methane-emitting fen soil. Appl. Environ. Microbiol. 77:3773–3785. 10.1128/AEM.00282-11 [DOI] [PMC free article] [PubMed] [Google Scholar]
- 53.Mondav R, Woodcroft BJ, Kim E-H, McCalley CK, Hodgkins SB, Crill P, Chanton J, Hurst GB, VerBerkmoes NC, Saleska SR, Hugenholtz P, Rich VI, Tyson GW. 2014. Discovery of a novel methanogen prevalent in thawing permafrost. Nat. Commun. 5:3212. 10.1038/ncomms4212 [DOI] [PubMed] [Google Scholar]
- 54.Lin X, Green S, Tfaily MM, Prakash O, Konstantinidis KT, Corbett JE, Chanton JP, Cooper WT, Kostka JE. 2012. Microbial community structure and activity linked to contrasting biogeochemical gradients in bog and fen environments of the Glacial Lake Agassiz Peatland. Appl. Environ. Microbiol. 78:7023–7031. 10.1128/AEM.01750-12 [DOI] [PMC free article] [PubMed] [Google Scholar]
- 55.Dedysh SN, Derakshani M, Liesack W. 2001. Detection and enumeration of methanotrophs in acidic Sphagnum peat by 16S rRNA fluorescence in situ hybridization, including the use of newly developed oligonucleotide probes for Methylocella palustris. Appl. Environ. Microbiol. 67:4850–4857. 10.1128/AEM.67.10.4850-4857.2001 [DOI] [PMC free article] [PubMed] [Google Scholar]
- 56.Fru EC. 2011. Copper biogeochemistry: a cornerstone in aerobic methanotrophic bacterial ecology and activity? Geomicrobiol. J. 28:601–614. 10.1080/01490451.2011.581325 [DOI] [Google Scholar]
- 57.Ho A, Kerckhof FM, Luke C, Reim A, Krause S, Boon N, Bodelier PLE. 2013. Conceptualizing functional traits and ecological characteristics of methane-oxidizing bacteria as life strategies. Environ. Microbiol. Rep. 5:335–345. 10.1111/j.1758-2229.2012.00370.x [DOI] [PubMed] [Google Scholar]
- 58.Kip N, van Winden JF, Pan Y, Bodrossy L, Reichart GJ, Smolders AJP, Jetten MSM, Damste JSS, Op den Camp HJM. 2010. Global prevalence of methane oxidation by symbiotic bacteria in peat-moss ecosystems. Nat. Geosci. 3:617–621. 10.1038/ngeo939 [DOI] [Google Scholar]
- 59.Serkebaeva YM, Kim Y, Liesack W, Dedysh SN. 2013. Pyrosequencing-based assessment of the bacteria diversity in surface and subsurface peat layers of a northern wetland, with focus on poorly studied phyla and candidate divisions. PLoS One 8:e63994. 10.1371/journal.pone.0063994 [DOI] [PMC free article] [PubMed] [Google Scholar]
- 60.Rousk K, Jones DL, DeLuca TH. 2013. Moss-cyanobacteria associations as biogenic sources of nitrogen in boreal forest ecosystems. Front. Microbiol. 4:150. 10.3389/fmicb.2013.00150 [DOI] [PMC free article] [PubMed] [Google Scholar]
- 61.Vitousek PM, Hobbie S. 2000. Heterotrophic nitrogen fixation in decomposing litter: patterns and regulation. Ecology 81:2366–2376. 10.1890/0012-9658(2000)081[2366:HNFIDL]2.0.CO;2 [DOI] [Google Scholar]
- 62.Reed SC, Cleveland CC, Townsend AR. 2013. Relationships among phosphorus, molybdenum and free-living nitrogen fixation in tropical rain forests: results from observational and experimental analyses. Biogeochemistry 114:1–13. 10.1007/s10533-013-9835-3 [DOI] [Google Scholar]
- 63.Vitousek PM, Menge DN, Reed SC, Cleveland CC. 2013. Biological nitrogen fixation: rates, patterns and ecological controls in terrestrial ecosystems. Philos. Trans. R. Soc. Lond. B Biol. Sci. 368:20130119. 10.1098/rstb.2013.0119 [DOI] [PMC free article] [PubMed] [Google Scholar]
- 64.Tsilibaris V, Maenhaut-Michel G, Van Melderen L. 2006. Biological roles of the Lon ATP-dependent protease. Res. Microbiol. 157:701–713. 10.1016/j.resmic.2006.05.004 [DOI] [PubMed] [Google Scholar]
- 65.Van Melderen L, Aertsen A. 2009. Regulation and quality control by Lon-dependent proteolysis. Res. Microbiol. 160:645–651. 10.1016/j.resmic.2009.08.021 [DOI] [PubMed] [Google Scholar]
- 66.Andersen R, Chapman SJ, Artz RRE. 2013. Microbial communities in natural and disturbed peatlands: a review. Soil Biol. Biochem. 57:979–994. 10.1016/j.soilbio.2012.10.003 [DOI] [Google Scholar]
- 67.Comont L, Laggoun-Defarge F, Disnar JR. 2006. Evolution of organic matter indicators in response to major environmental changes: the case of a formerly cut-over peat bog (Le Russey, Jura Mountains, France). Org. Geochem. 37:1736–1751. 10.1016/j.orggeochem.2006.08.005 [DOI] [Google Scholar]
- 68.Jia GD, Dungait JAJ, Bingham EM, Valiranta M, Korhola A, Evershed RP. 2008. Neutral monosaccharides as biomarker proxies for bog-forming plants for application to palaeovegetation reconstruction in ombrotrophic peat deposits. Org. Geochem. 39:1790–1799. 10.1016/j.orggeochem.2008.07.002 [DOI] [Google Scholar]
Associated Data
This section collects any data citations, data availability statements, or supplementary materials included in this article.