

Abstract
Genetically identical cells sharing an environment can display markedly different phenotypes. It is often unclear how much of this variation derives from chance, external signals, or attempts by individual cells to exert autonomous phenotypic programs. By observing thousands of cells for hundreds of consecutive generations under constant conditions, we dissect the stochastic decision between a solitary, motile state and a chained, sessile state in Bacillus subtilis. The motile state is memoryless, exhibiting no autonomous control over the time spent in the state, whereas chaining is tightly timed. Timing enforces coordination among related cells in the multicellular state. Further, we show that the three-protein regulatory circuit governing the decision is modular, as initiation and maintenance of chaining are genetically separable functions. As stimulation of the same initiating pathway triggers biofilm formation, we argue that autonomous timing allows a trial commitment to multicellularity that external signals could extend.
Cell fate decisions often result from explicit extracellular triggers1-3. It is now appreciated that internal stochastic fluctuations4-10 can also drive a cell to switch fates even in the apparent absence of external signals11-17. Neighboring cells in the developing gonad of Caenorhabditis elegans compete to become ventral uterine or anchor cells18, and subpopulations of growing Escherichia coli cells probabilistically enter a quiescent, antibiotic resistant state14, 19. But whether occurring in the body of a nematode or in shaking culture, these decisions take place against a backdrop of environmental change driven by continued growth. With rising interest in quantitative properties of gene networks20, 21, one central question is how much of a cell's behavior can be attributed to the environment and how much to the internal program, i.e., the behavior the network would implement were the environment fixed.
A prototypical situation arises in the conversion of bacteria from free-living, planktonic cells into sessile, multicellular communities known as biofilms22, 23. Like many complex fates, biofilm formation is a product not just of a cell's individual behavior, but also of reinforcement by environmental cues created by nutrient depletion, the production of matrix24, quorum sensing25, and hypoxia26. Here we use a microfluidic device to investigate the earliest stages of multicellular growth by the soil bacterium Bacillus subtilis. Our approach removes confounding environmental influences while allowing for high-throughput quantitative imaging, thereby revealing the cell's internal programs of development.
B. subtilis provides a natural model system for decision-making. During the exponential phase of growth, it exists in two states: as individual, motile cells and as long, connected chains of sessile cells27. Switching between these states has been thought of as a bet hedging strategy28-30, with motile cells acting as foragers and chains representing periodic attempts to settle down and start a colony. At the heart of the decision is a simple three-protein network between SinI (henceforth I), SinR (R), and SlrR (Slr)31, 32. Commitment to each state is controlled by a double-negative feedback loop in which R represses the Slr gene, and Slr binds to and titrates R (Figure 1a). Motility corresponds to the SlrLOW state in which R represses the gene for Slr and other chaining-associated genes. Chaining occurs during the SlrHIGH state in which Slr forms a complex with R, both titrating its activity against chaining genes and redirecting it to repress motility-associated genes 33. Though both states are present during exponential growth, the chained state is strongly reinforced during biofilm formation by further antagonism of R by I, which is produced in response to environmental signals34, 35. This three-gene network thus supports a two state process of decision-making that can be influenced by environmental signals.
Figure 1. Tracking cell fate switching in Bacillus subtilis.

a, Genetic logic governing the motile and chained states. b, Top and isometric schematics of microfluidic channels in which individual bacteria are held. Channels connect to a larger channel through which medium is continuously replaced and excess cells are washed away. c, Kymograph showing a single cell (highlighted in yellow) of strain TMN690 (Phag-gfp PtapA-mKate2 hagA233V) transitioning from motile growth (marked in green by expression of a Phag-gfp reporter for flagellin) to chained growth (marked in red by expression of a PtapA-mKate2 reporter for matrix expression). Frames taken ten minutes apart. d, Kymograph showing co-expression of matrix and slr reporters in TMN1180 cells (PtapA-cfp Pslr-mKate2 hagA233V). e, Average co-expression profiles of matrix and slr reporter expression in chains (TMN1180, 25 events).
Visualizing fate switching in real time
Microfluidic systems that allow individual cells to be imaged over time as the growth medium is replenished provide an excellent opportunity to examine autonomous developmental programs. Extracellular signaling is removed, and cells cannot accumulate and starve themselves. Building on previous studies14, 36-40, we constructed microfluidic channels from polydimethylsiloxane (PDMS, Figure 1b) that were sized to accommodate chains of B. subtilis (75 μm long and 1.6 μm wide). A unique feature of our design is the shallow side channels that surround the cells, creating a ‘bath’ of medium that enables efficient feeding over long length scales41. The channels are closed on one end, and on the other they empty into a feeding channel that supplies fresh medium (by diffusion) and washes away excess cells as they are pushed out by growth. To prevent cells from swimming out of the channels, the ability of the flagellum to generate force was disrupted through a straight flagellum mutation42.
Only motile cells expressed the flagellin genes (Supplemental Video 1) as visualized with a Phag-mKate2 reporter (colored green), and only chains expressed matrix genes as visualized with a PtapA-cfp reporter (colored red). We therefore used these reporters as proxies for the corresponding phenotypic states. B. subtilis interconverted between the motile and chained states while growing in the channels (Figure 1c and Supplemental Movie 2), leading to anticorrelated flagellin and matrix gene expression. In keeping with the premise that the chains had switched to the SlrHIGH state, imaging of slr (visualized with a Pslr-mKate2 reporter, artificially colored green) and matrix coexpression revealed that slr was expressed in chains (Figure 1d), and that matrix and slr expression were tightly correlated in time (Figure 1e).
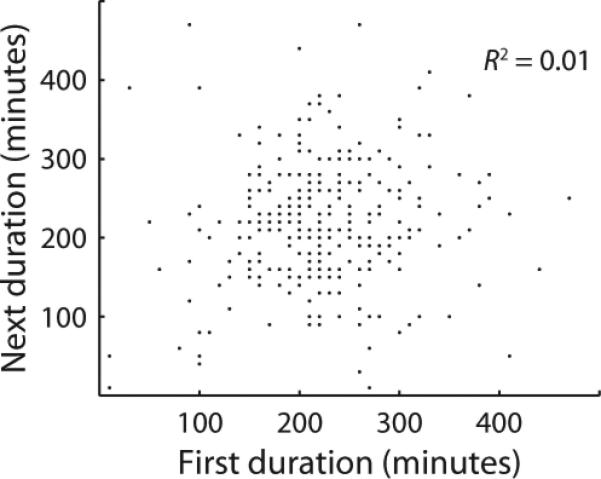
Several million cell divisions were imaged, but we only report data for the fates of the uppermost cell in each channel, since these could be monitored throughout the experiment without being washed away (Figure 2a, Supplemental Video 2). We thus tracked the histories of thousands of individual bacteria through ~300 generations of growth. To define more precisely the motile and chained states, we found thresholds on the matrix reporter that coincided with onset of matrix expression and the subsequent return of motility, but similar results were obtained for a range of thresholds (Extended Data 1). All measured properties remained constant in time and across the device: a generation time of ~27 minutes was sustained for as long as seven days (Extended Data 2), chaining occurred at a uniform rate (Extended Data 3), and within each lineage there was no correlation between the lengths of successive visits to the motile state (Figure 2b) or the chained state (Extended Data 4). The switching behavior was thus homogeneous throughout the device and experiment duration, reflecting a stochastic process at steady state. With the influence of environmental changes removed, we next set out to characterize the autonomous motility and chaining programs.
Figure 2. Dynamics of cell fate switching.

This figure examines chaining in strain TMN1157 (Phag-mKate2 PtapA-cfp hagA233V). a, The uppermost cell's fate was tracked in each channel, yielding traces of flagellin (Phag-mKate2, green curve) and matrix (PtapA-cfp, red curve) reporter expression. Five chaining events are shaded. b, Correlation between subsequent residence times in the motile state. c, Schematic of aging curves. Memoryless switching (blue dashed curve) between states gives rise to horizontal curves, while deterministic timers (red dashed curve) create curves descending with slope −1 from the average duration of the state 〈T〉. Many other mechanisms are bounded by these extremes (SI): e.g., progression through a series of discrete, exponentially distributed steps yields the grey curve. d, Distribution of motility periods (307 events). Red curve shows exponential fit. Inset shows log transformed cumulative distribution function of motility period duration (black curve) and the exponential fit (red curve). e, The aging curve for the motile state (black line) is compared to the expectation for memoryless switching adjusted for undersampling of long motility periods (blue dashed curve, SI) and that for a timer (green dashed curve). f, Distribution of chain durations (440 events). g, Aging curves for chains (blue curve) in cells wild type for slr (TMN1157) and pulses (red curve) in slr mutant cells (TMN1158, which is TMN1157 mutated for slr). All qualitative features of distributions were replicated in at least three separate experiments and quantitative parameters in at least two.
Extended Data 1. Aging behavior is independent of choice of threshold.

Initially, the duration of a chaining event was called as the time between when matrix expression was first detectable to when flagellin expression began to increase. However, in order to compare chains (in strain TMN1157) and pulses (in strain TMN1158), we examined whether it was possible to call the end point using only the matrix reporter since flagellin expression does not fall during pulses. In both methods, the beginning of a chain was called as the time when the matrix signal was first detectable above background fluctuations (~33 fluorescence units, SI). a, To call the end of a chain using only the matrix signal, various thresholds were applied. The figure plots the difference in chain duration between this single reporter method for different thresholds and the two reporter method. A threshold of 150 fluorescence units called the duration of chaining to within 20 minutes of the two reporter method and was used throughout the text to call the end of the events. b, To show that the primary conclusions are unchanged by the choice of threshold, the aging curves for the chained state are plotted for all thresholds shown in the previous panel. As the motile state is extremely long in comparison to the chained state, properties of the motile state are completely insensitive to how we called chains.
Extended Data 2. Cell growth is homogeneous in time.

Sliding window average of division time plotted as a function of time (in strain TMN1158). Each point in the curve represents the average of all division times that occurred within a 250 minute window. Grey shaded area denotes ± 1 standard deviation, while red shaded error denotes ± 1 standard error of the mean. A flat trend indicates that conditions in the device do not change in time.
Extended Data 3. Chaining incidence is constant in time.

Histogram of the number of chaining events observed in successive 330 minute windows in the experiment described in Figure 2 of the main text. As the number of observed lineages was constant throughout the experiment, these measurements reflect the average chaining rate in each window. A flat trend occurs when this average rate is constant in time, and thus that the factors controlling the switching decision have reached stationarity. Chains occurring early in the movie were excluded from subsequent analysis to avoid any transient effects associated with adapting to growth in the device (SI).
Extended Data 4. Successive visits to the chained state are uncorrelated.
Scatter plot of the durations of sequential visits to the chained state within each wild type lineage (440 events), analogous to Figure 2b for the motile state. Note that some points fall on top of each other due to the discrete nature of the measurements.
Memoryless motility and timed chaining
We monitored transitions between motile and chained states to determine if cells exercise temporal control, or if they exit states independently of their history. The latter ‘memoryless’ behavior would imply exponentially distributed residence times between events and thus a coefficient of variation (standard deviation divided by mean) in residence times of CV=100%, while other switching mechanisms could exploit history-dependence to produce narrower distributions. We further quantified history dependence by asking how each state ‘ages’, as measured by mean residual lifetime curves, i.e., the expected time left in a state given that the system is still there, as a function of time. Memorylessness produces horizontal aging curves (blue line in Figure 2c) while perfect timing produces linearly decreasing curves with a slope of −1 (green curve in Figure 2c)43.
The distribution of residence times in the motile state was almost perfectly exponential with a mean of ~81 generations (~36 hours) and CV≈100% (Figure 2d) after correcting for the length of the experiment (SI). The aging curve also conformed to the expectation for an exponential random variable (Figure 2e), and we observed no correlations between the residence times of successive events. Thus, despite the complex underlying circuit, cells decide to chain according to the simplest possible switching scheme: a motile cell does not ‘remember’ when it last chained, and the probability of chaining is the same whether the cell has been motile for one generation or hundreds of generations.
Chains displayed a radically different behavior. The residence time distribution was sharply peaked at a mean of 7.6 generations and had a 28% relative standard deviation (Figure 2f), resembling a gamma distribution with a shape parameter of 13 and with an aging curve prototypical of tight timing before eventually flattening out (Figure 2g). Thus while motile cells set long average residence times and allow widely variable commitments, chains instead orchestrate briefer, tightly-timed transitions. This difference makes teleological sense given their respective lifestyles. As motile cells grow as individuals, their properties are insensitive to how long they remain motile, leaving no obvious reason to keep track of the residence time. In contrast, any decision that depends on coordination among progeny will require some degree of memory. Chains have strong incentives to preclude both very short and very long commitments. The chained phenotype accumulates over time, where chaining for T generations produces chains of length 2T. Relatively small differences in T then translate into great differences in chain length. Memoryless exit from the chained state would in fact have extreme consequences, where many chains would break down almost instantaneously while others could contain millions of cells. The narrow time distribution guarantees a minimum chain length while preventing a high fraction of cells from effectively entering the chained state irreversibly.
Memoryless initiation from noisy antagonism
Slow and memoryless switching can arise from positive feedback loops, in which rare fluctuations allow the system to break out of the basin of attraction of each stable point 44. Indeed, one of the key features of the motility-chaining decision network is the R-Slr double negative feedback loop. As expected, mutating slr eliminated chaining: over the course of a six day experiment, we saw sustained high expression of flagellin in all cells and observed no morphological evidence of cells growing as connected groups. However, our sensitive time-lapse microscopy allowed us to detect exceedingly rare and weak expression signals, showing that an slr mutant exhibited small and infrequent bursts of matrix expression (Figure 3a, Supplemental Video 3). We refer to these events as pulses, to distinguish them from chains that pair high matrix expression with repression of flagellin. We note that they also appear in the wild type data, but fail to trigger expression of Slr (Extended Data 5). Strikingly, the residence times between subsequent initiation attempts, whether resulting in chains or pulses, followed indistinguishable exponential distributions for wild type cells and the slr mutant (Figure 3b). Removal of Slr thus abolished the chaining phenotype, but left the memoryless process of initiation perfectly intact.
Figure 3. Memoryless initiation of chaining.

a, An example trace of flagellin (Phag-mKate2, green curve) and matrix (PtapA-cfp, red curve) reporter expression from slr mutant cells (TMN1158). Seven matrix pulses are shaded. b, Log transformed cumulative distribution functions of times between subsequent initiations (of pulses or chains) in cells wild type (blue curve, TMN1157, 399 events) or mutant for slr (red curve, TMN1158, 296 events) strains. Plotted this way, exponential distributions yield straight lines. This result separately reproduced in a strain with different fluorescent reporter proteins. c, Example matrix expression traces in slr mutant cells (blue curve, TMN1158), and in slr mutant cells further deleted for the initiator I (red curve, TMN1198).
Extended Data 5. Slr is expressed strongly only in chains.

Average expression traces of slr during chains (blue curve, 25 events) and pulses (green curve, 14 events) seen in strain TMN1180 (PtapA-cfp Pslr-mKate2 hagA233V).
Having determined that initiation arose from a factor upstream of the feedback loop, we examined the I protein that antagonizes R during biofilm formation. I was sufficient to drive chaining, as cells containing an IPTG (isopropyl β-D-1-thiogalactopyranoside)-inducible I gene rapidly chained upon induction. It was also necessary: cells mutant for I did not chain, and pulses were absent in cells doubly mutant for I and Slr (red curve in Figure 3c). These results suggest that noisy antagonism of R by I drives spontaneous chaining in a way that is quantitatively independent of the Slr feedback control system, as discussed below.
To test how cells control the duration of the chained state, we briefly switched (10 min) on the inducible I gene to provide a defined initiating signal (Figure 4a, Supplemental Video 4). Strikingly, the aging behavior of the resulting chains was virtually identical to that of spontaneously occurring chains (cf. Figures 4b and 2g). Even switching on I synthesis a second time in cells that had started to revert from chaining (3 h after first pulse) or using a longer initiating signal led to no increase in the average duration of the resulting chains (Extended Data 6). The chained state is thus stereotyped: once a signal to chain is registered, the same program is executed in a way that is independent of the nature of the initiating signal or of the history of the cell. This tight timing is an intrinsic property of the R-Slr feedback loop rather than the initiating event, as the spontaneous pulses seen in slr mutant cells showed little evidence of temporal organization (red curve in Figure 2g). Furthermore, chains lasted longer than pulses under both spontaneous and induced conditions (Figures 4c,d), suggesting that the feedback loop coordinated action after the initiating signal had faded. Indeed, adding an additional copy of slr to strengthen feedback led to longer chaining events (Extended Data 7). Thus we again see network modularity45: just as the R-Slr feedback loop did not affect the initiation of chaining, the duration of the chained state was independent of the initiation process.
Figure 4. Slr executes a stereotyped chaining program.

a, Example matrix and flagellin traces from strains where chaining (top panel, TMN1195 = Phag-mKate2 PtapA-cfp hagA233V Pspank-sinI) or pulsing (bottom panel, TMN1196, which is TMN1195 mutated for slr) were inducible by addition of IPTG. b, Aging curve for induced chains is shown (177 events). Green dashed curve shows expectation for a timer. c, Average matrix expression profiles for chains arising spontaneously (blue curve, TMN1157, 198 events) and pulses arising spontaneously in slr mutant cells (red curve, TMN1158, 278 events). Shaded regions denote ± 1 standard deviation. Average profiles are scaled to reflect the average height difference between chains and pulses. d, The same analysis for chains (blue curve, TMN1195, 26 events) and pulses (red curve, TMN1196, 42 events) induced by addition of IPTG. e, Matrix expression during chaining naturally breaks down into a build-up phase (red curve), where synthesis of new proteins dominates, and a subsequent dilution phase (blue curve). Grey curve shows the calculated synthesis rate (SI) used to call the two phases. f, Long build-up phases reduce noise in matrix expression by time averaging. The plot shows the fraction of chains achieving a build-up phase of a given duration (black curve) and the variability in matrix expression of those chains (red curve). Similar results have been obtained in three replicate experiments.
Extended Data 6. Chaining program is independent of cellular state.

To test whether the initial state of the cell influenced the chaining program, cells (of strain TMN1195) were forced to chain with a burst of I expression from an IPTG-responsive I gene (created by switching to medium containing 100 μM IPTG for 10 minutes). When some cells began to return to the motile state (3 hours later), a second IPTG treatment was administered. a, Average matrix expression profiles in chains induced by single pulses of IPTG (blue curve) or two consecutive IPTG pulses (red curve). The average amount of time spent as a chain after the second IPTG treatment was similar to the time seen in the chained state following a single treatment (260 minutes vs. 280 minutes, 177 and 28 events, respectively). b, The plot scatters matrix expression level at the time of the second IPTG treatment against the duration of the ensuing chain, indicating that the state of the cell at the time of treatment had no effect on the subsequent chain duration. c, 10 minute (blue curve, 84 events) and 20 minute (red curve, 99 events) IPTG treatments were used to induce chaining, resulting in near identical distributions of chain durations. Note that the 10 minute data set contained two exceptionally long chaining events that explain the slightly higher average duration.
Extended Data 7. Strongly enhanced commitment to the chained state in strains overexpressing slr.

The figure shows an example trace of a chain made by the strain TMN1206 (PtapA-cfp Phag-mKate2 hagA233V ywrK::PslrR-slrR), which bears an additional copy of the gene for Slr under its native promoter. In this strain, most chains last long enough that they are eventually pulled out by the flow of fresh medium running through the device. Using the time to fallout as a lower bound for the average duration of the chaining state suggests that the chained state lasts at least ~420 minutes (~15.5) generations in these cells.
To dissect how cells time their exit from the chained state, we analyzed the temporal pattern of gene expression during hundreds of chaining events. Examining the rate of gene expression in these traces (SI) revealed two distinct phases: a build-up phase of matrix expression was followed by a pure dilution phase when expression was negligible and levels exponentially decreased due to growth (Figure 4e). Motility then reinitiated once levels fell below a threshold. The two phases were approximately equal in length, with the duration of the dilution phase more narrowly distributed than the build-up phase (CVbuild-up = 0.44, CVdilution = 0.23).
Expression rates in the build-up phase varied substantially between chains at any given time (Extended Data 8), but also over time in any given cell. By ensuring that each chain committed to an extended buildup phase, Slr allowed cells to effectively ‘time-average’4 over such noisy expression rates since the total amount of accumulated protein reflected the average of a long history of expression. Because the build-up phase was longer than the correlation time of the random expression process, the variability between chains in matrix gene expression decreased substantially as the build-up phase progressed (Figure 4f).
Extended Data 8. Variation in matrix expression rate over time during build-up phase.

As described in the main text, chaining events can be naturally broken down into a build-up period, when new synthesis dominates, and a subsequent dilution period where new synthesis is minimal. The rate of matrix reporter expression was calculated at each time point during the build-up period for all chaining events, producing a time-varying distribution of possible expression rates. The figure plots the coefficient of variation of this distribution, showing that expression rates show a roughly constant CV of ~0.5 over much of the build-up period. Note that most chains have ceased the build-up phase by about 250 minutes in, so the end of the graph is less informative. This figure should be compared with Figure 4f in the main text, which shows that the CV in the abundance of the matrix reporter decreases over the same period due to the time averaging principle described in the main text.
Variation in the outcome of the build-up phase meant that cells with higher expression require more time to dilute, but the mechanism of dilution naturally suppresses this heterogeneity. First, because the dilution rate is set by cell growth rather than by a noisy reaction network, dilution can potentially extend the time spent in the state without adding heterogeneity. Indeed, we found that the dilution phase proceeded largely deterministically: the reporter's intensity at the onset of dilution precisely predicted the exit time, and the trajectories were well-described by exponential decay (Extended Data 9). The threshold marking the end of dilution and entrance into the motile state thus seemed high enough that random segregation of molecules between daughter cells at low numbers10, 46 was made irrelevant. Second, the exponential nature of dilution – reducing levels two-fold every generation – further tightened control by making the timing robust to heterogeneity in the initial level of protein. Specifically, the time spent diluting then depends logarithmically rather than linearly on the initial amount. Cells that, by chance, have much more or less protein initially, will then vary marginally in the time spent diluting. Indeed, the 30% deviations in matrix abundance at the onset of dilution was reduced to a 23% deviation in the dilution time, closely following the expectation from a noise-free exponential dilution process (SI). Thus, by extending the build-up phase in chains, Slr is responsible for translating widely variable initiating signals into a precisely-timed pattern of gene expression.
Extended Data 9. Dilution phase is well-described by a deterministic model for exponential decay.
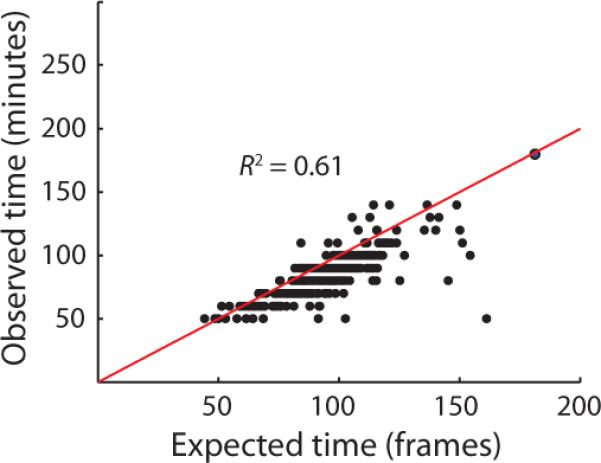
Scatter plot comparison of observed and predicted dilution phase durations in spontaneous chains. Expected dilution times were derived from a deterministic model for exponential decay of the reporter (SI). Close proximity to the line y = x (black line) indicates that the data are well-described by the model.
Memory enables multicellular cooperation
The choice between motility and multicellularity is central to the lives of many bacteria, as cells must relinquish their autonomy to benefit from living together22, 23. The chaining program may underlie the earliest steps of multicellularity: by coordinating behavior across many generations, the tight timing provided by Slr enforces cooperation among the progeny of a cell that initiates a new sessile community. The long-term commitment to chaining seen during biofilm formation could in turn rely on continued initiation or on feedback mechanisms that lock cells into the multicellular state. While we saw no evidence that Slr feedback could provide the requisite commitment, the initiator I is indeed strongly expressed both in response to desirable niches (e.g. plant polysaccharides)47 and growth related stresses (e.g. starvation or hypoxia)24, 26. Our results show that different environmental signals are channeled into the same robust chaining behavior, and cessation of the stimulus ultimately leads to coordinated exit. Maintenance is thus contingent on continued stimulation, but even small signals will suffice to renew commitment. The role of Slr feedback may thus be to provide a well-defined ‘trial period’ of multicellular growth whose continuation is periodically reevaluated.
Regulation of chaining weaves together stochastic gene expression, transcriptional feedback and post-translational regulation. Any quantitative property of the decision could therefore have been a product of several factors acting in concert. Yet observation of thousands of chaining decisions free from environmental influences revealed a modular network that separates initiation from control of the residence time; eliminating one function leaves the other intact in quantitative detail, allowing the overall behavior to be explained in terms of these two pieces. This type of excitable dynamics, in which the system is randomly kicked out of a stable state but returns after a well-defined excursion, is often explained in terms of linked feedback loops, and has been implicated in other B. subtilis decision networks16, 17. In this case, however, an exceedingly simple alternative mechanism may explain most of the behavior. R and I are known to form an inactive complex with binding constants in the nanomolar range48. Since more R is produced than I, R typically titrates out all free I molecules, thereby acting as a buffer against small fluctuations. However, a rare persistent accumulation of I levels transiently reverses the roles, leading to a buffering pool of free I instead. This mechanism can generate long periods of virtually no free I (corresponding to the motile state) followed by long stretches of I dominance which induces chaining. The memory in the chained state is in turn largely explained by the production-dilution mechanism above in which feedback could play a role in narrowing the probability distribution of time spent producing matrix proteins.
Other systems may also display memory and memorylessness for the times spent sessile and motile, respectively49, but we suspect any broader principles will follow from the sensitivity of a phenotype to the time spent in the state. Decisions that aim only to set the occupancy of a particular state14, 15, 19 do not require explicit timing, and may therefore randomize commitments with memoryless switching. In contrast, when the effectiveness of a cell fate choice is tied to population size50, timed decision making could again be used to ensure cooperation among progeny. In higher organisms, stochastic cell fate decisions are often stabilized after the fact by lateral inhibition18. Timing the adopted state could provide an initial window of commitment to give extracellular feedback time to take hold. Our approach—observing the cell's intrinsic dynamics while keeping everything else static for extended periods of time—may reveal that many complex developmental choices can be explained by surprisingly simple dynamical principles in individual cells.
Methods
Strain construction
All strains were derived from Bacillus subtilis NCIB3610 using standard molecular biology techniques. Strain genotypes, full construction details, and a list of primer sequences are provided in the SI. To prevent motile cells from swimming out of the channels, all strains bore a hagA233V straight flagellum mutation, which impairs the ability of the flagellum to generate force while leaving its construction intact42.
Microfluidic device fabrication
The master mold for the device was fabricated in four layers by UV photolithography using standard methods (for detailed protocol, see SI). For each layer, Shipley or SU-8 (Microchem) photoresist was applied to a silicon wafer by spin coating to appropriate thickness (corresponding to the channel height) and patterns were then created by exposing the uncured photoresist to UV light through custom quartz-chrome photomasks (Toppan Inc.).
Microfluidic devices were fabricated by molding channel features into a polydimethylsiloxane (PDMS) slab and then bonding that slab to a glass coverslip. To produce the slab, dimethyl siloxane monomer (Sylgard 184) was mixed in a 5:1 ratio with curing agent, poured onto the silicon wafer master, degassed under vacuum, and cured at 65°C overnight. Holes to connect the feeding channels to the external tubing used for medium perfusion were then introduced using a biopsy punch, and individual chips were cut and bonded onto KOH-cleaned cover slips using oxygen plasma treatment the day of the experiment. Bonded chips were baked at 65°C for at least an hour before use.
Cell preparation and device loading
Immediately before use, the microfluidic device was passivated with a 10 mg/mL solution of bovine serum albumin (BSA). B. subtilis cells were grown to late stationary phase in LB to decrease their size and thus increase efficiency of loading. They were then passed through a 5 μm filter (Pall Acrodisc) to remove chains, concentrated by centrifugation, and injected into the feeding channel. The chip was mounted on a custom-machined platform that could be inserted into a standard benchtop centrifuge, and cells were forced into the cell channels by centrifugation. Syringes containing LB medium with 0.1 mg/mL BSA were connected to the device using Tygon tubing (VWR), and were pumped at a flow rate of 3 μL/min using syringe pumps (New Era Pump Systems). BSA was provided as a lubricant to prevent cells (and chains in particular) from adhering to the surface of the main feeding conduit as they are pushed out of the device.
Microscopy and image acquisition
The microfludic device was mounted on a fluorescence microscope immediately after loading. We used a Nikon Eclipse Ti inverted microscope equipped with an Orca R2 (Hamamatsu) camera, a 60X Plan Apo oil objective (NA 1.4, Nikon), an automated stage (Ludl), and a Lumencor SOLA fluorescent illumination system. Image acquisition was performed using MATLAB scripts interfacing with μManager51. The microscope was encased in a custom-built incubator that maintained it at 37 °C throughout the experiment. The following filter sets were used for acquisition: GFP (Semrock GFP-1828A), mKate2 (Semrock mCherry-B), CFP (Semrock CFP-2432C), YFP (Semrock YFP-2427B). The slrR/tapA co-expression experiment was performed on an almost identically configured microscope that instead had a Lumencor SPECTRA fluorescent illumination system. Exposures were done at very low illumination intensities with 2×2 binning (CCD chip dimension of 1344 × 1024 pixels, pixel size of 6.45 μm × 6.45 μm) and typical acquisition periods of 200 - 500 msec. The Lumencor light sources produce little ultraviolet or infrared light, obviating the need for supplemental filters to block these wavelengths. Cells were allowed to equilibrate in the device for several hours before imaging, and all data prior to the first chain or pulse in each lineage was ignored in subsequent analysis. Images were acquired every ten minutes and saved as 16 bit TIFFs. Focal drift was controlled through the use of the Nikon PerfectFocus system and a custom-built, image-based autofocus that imaged a sacrificial position over many planes.
Induction of chaining with IPTG
To induce chaining, two syringes carrying either LB with 0.1 mg/mL BSA or LB with 0.1 mg/mL BSA and 100 μM IPTG (isopropyl β-D-1-thiogalactopyranoside) were connected via soft tubing to a Y-junction connector that fed into a common line connected to the device. The line that was not in use was clamped shut with a binder clip. Each syringe was loaded into an independently controlled syringe pump, and a pulse of IPTG was produced by switching to the IPTG-bearing syringe for 10 minutes.
Image processing and lineage construction
All data analysis was based on a custom MATLAB image processing pipeline described in detail in the SI. For each image, the top cell in each channel was identified as summarized in Extended Data 10. The mean fluorescence intensity within these cells was then calculated for each fluorescence channel. A simple tracking algorithm was used to follow cells as they grew and divided, producing long lineages lasting the duration of the experiment. Cell division events were identified by looking for instances where a cell's calculated area dropped to less than 60% of its previous value. If a tracked cell died spontaneously, the algorithm continued the lineage from the dead cell's closest relative.
Extended Data 10. Image processing used for image quantification.

a, Cells are identified using a constitutive YFP construct. b, Images are rotated so that channels are oriented vertically. c, Images are contrast enhanced to better identify cell boundaries. d, Cells are preliminarily identified by edge detection. e, The mask identifying cells is improved by morphological processing. f, Mother cells are identified (highlighted in white). g, Superposition of segmented cell boundaries and rotated data YFP image.
Measuring residence times in the two states
Motility and chaining durations were called by examining the trace of PtapA-cfp fluorescence within a lineage. To identify the level of background fluorescence, rough peaks were identified using a peak finding algorithm (Nathanael C. Yoder, available at http://www.mathworks.com/matlabcentral/fileexchange/25500-peakfinder) on traces smoothed with a Savitzky-Golay filter, and the average fluorescence outside these peaks was subtracted from all traces. Final peak boundaries were called where the matrix reporter signal crossed pre-defined thresholds. These thresholds chosen to correspond to phenotypic transitions: onset of matrix gene expression defines the beginning of the peak, and onset of motility gene expression defines the end (Extended Data 1). We note that the main conclusions of the paper are insensitive to the threshold values (Extended Data 1). All peaks were manually curated before calculating statistics.
With the cell fate history of each lineage in hand, we compiled statistics describing residence time in the chained state (chain/pulse periods) and residence time in the motile state (subsequent initiation times and motility periods). We define a chain or pulse period as the duration of matrix expression within a peak (identified as described above) and the motility period as the duration of uninterrupted motility gene expression between chaining events. In Figure 3b, we instead measured the time between the start times of consecutive peaks (‘subsequent initiations’), meaning either chains or pulses. Due to the long average residence time in the motile state, long motility periods are difficult to adequately sample. We account for this issue in the calculation of motility-related statistics, and include a complete discussion of the correction in the SI.
Log transformation
We define the log transformation of a cumulative distribution function F(t) as log(1-F(t)). This transformation facilitates comparisons, as exponential distributions are transformed to straight lines.
Memory (mean residual lifetime)
We measured the memory associated with each state using the mean residual lifetime, defined as m(t) = E[T − t | T > t] for a distribution of residence times, T. The mean residual lifetime at time t is the average amount of time a cell will remain in its current state given that it has already spent t time units there.
Average expression profiles
Average profiles of matrix gene expression during pulses and chains were created by normalizing all measured events' heights to 1, aligning the events' leading edges, and averaging the expression values at each time point. This procedure normalizes away variability in peak height so that variation between average traces derives primarily from differences in timing.
Identifying chain build-up and dilution phases
Each chaining event was decomposed into ‘build-up’ and ‘dilution’ phases based on rates of matrix reporter synthesis and dilution that were calculated from each trace. Briefly, traces were smoothed using a Savitsky-Golay filter, the resulting polynomial was differentiated, and the rate of expression was inferred from a kinetic model of gene expression (see SI) that assumed a time varying synthesis rate and exponential degradation of reporter. The ‘build-up’ phase was defined as the time over which the synthesis rate of reporter was at least 20% of the dilution rate, and the ‘dilution’ phase was the remaining time in which dilution dominated.
Supplementary Material
Supplemental Video 1 | Motility and chaining. Cells of strain TMN547 (bearing a Phag-gfp reporter for flagellin and a PtapA-mKate2 reporter for matrix expression) were trapped in a narrow liquid layer and imaged. The left panel shows a phase contrast movie, showing a mixture of motile cells and chains. The middle and right panels, respectively, show movies of flagellin (in green) and matrix reporter (in red) expression taken of the same field. Note that the three movies were acquired sequentially due to the need for different filters and thus do not show precisely the same cells.
Supplemental Video 2 | Spontaneous switching in microfluidic channels. Cells (of strain TMN1157) were loaded into the device. The movie shows the interconversion between the motile state (marked by expression of a Phag-gfp for flagellin expression, pseudocolored green) and the chained state (marked by expression of a PtapA-mKate2 for matrix expression, pseudocolored red).
Supplemental Video 3 | Pulsing in cells mutant for Slr. Cells mutant for Slr (strain TMN1158) were loaded into the device. The top panel, which is scaled identically to Supplemental Movie 2, shows that in these cells, motility is never interrupted, leading to sustained expression of the Phag-gfp fluorescent reporter for flagellin (pseudocolored green). There are, however, periodic pulses of expression of the PtapA-mKate2 matrix reporter (pseudocolored red). Note many pulses are weak and thus difficult to see against the strong flagellin signal. The bottom panel provides a contrast-enhanced version of the movie showing only the matrix reporter.
Supplemental Video 4 | Artificial induction of chaining and pulsing. An IPTG-inducible I construct was introduced to allow artificial induction of chaining or pulsing. The movie shows the response of cells wild type (on the left, strain TMN1195) and mutant for Slr (on the right, strain TMN1196) to a 10 minute pulse of 100 μM IPTG. The top row shows a merge between flagellin (in green) and matrix (in red) reporter expression, while the bottom row shows only matrix reporter expression.
Acknowledgements
We thank A. Lindner for sharing an early version of the microfluidic mother machine with our groups. We thank Y. Chai for helpful discussions and C. Saenz, V. Lien, S. Hickman, J. Tresback, and J. Deng for technical help with microfluidic fabrication. This work was performed in part at the Center for Nanoscale Systems (CNS), a member of the National Nanotechnology Infrastructure Network (NNIN), which is supported by the National Science Foundation under NSF award no. ECS-0335765. CNS is part of Harvard University. This work was supported by grants from the NIH to R.L. (GM18568) and J.P (GM081563).
Footnotes
Author contributions T.M.N. and N.D.L. designed and fabricated the microfluidic device, cloned strains, and collected the data. All authors were involved in conceiving the study, analyzing results, and writing the paper.
The authors have no competing financial interests.
Supplementary Information is linked to the online version of the paper at www.nature.com/nature.
References
- 1.Ferrell JE, Jr, Machleder EM. The biochemical basis of an all-or-none cell fate switch in Xenopus oocytes. Science. 1998;280:895–898. doi: 10.1126/science.280.5365.895. [DOI] [PubMed] [Google Scholar]
- 2.Wehrli M, Tomlinson A. Epithelial planar polarity in the developing Drosophila eye. Development. 1995;121:2451–2459. doi: 10.1242/dev.121.8.2451. [DOI] [PubMed] [Google Scholar]
- 3.Long T, et al. Quantifying the integration of quorum-sensing signals with single-cell resolution. PLoS Biol. 2009;7:e68. doi: 10.1371/journal.pbio.1000068. [DOI] [PMC free article] [PubMed] [Google Scholar]
- 4.Paulsson J. Summing up the noise in gene networks. Nature. 2004;427:415–418. doi: 10.1038/nature02257. [DOI] [PubMed] [Google Scholar]
- 5.Ozbudak EM, Thattai M, Kurtser I, Grossman AD, van Oudenaarden A. Regulation of noise in the expression of a single gene. Nat. Genet. 2002;31:69–73. doi: 10.1038/ng869. [DOI] [PubMed] [Google Scholar]
- 6.Newman JR, et al. Single-cell proteomic analysis of S. cerevisiae reveals the architecture of biological noise. Nature. 2006;441:840–846. doi: 10.1038/nature04785. [DOI] [PubMed] [Google Scholar]
- 7.Rosenfeld N, Young JW, Alon U, Swain PS, Elowitz MB. Gene regulation at the single-cell level. Science. 2005;307:1962–1965. doi: 10.1126/science.1106914. [DOI] [PubMed] [Google Scholar]
- 8.Bar-Even A, et al. Noise in protein expression scales with natural protein abundance. Nat. Genet. 2006;38:636–643. doi: 10.1038/ng1807. [DOI] [PubMed] [Google Scholar]
- 9.Taniguchi Y, et al. Quantifying E. coli proteome and transcriptome with single-molecule sensitivity in single cells. Science. 2010;329:533–538. doi: 10.1126/science.1188308. [DOI] [PMC free article] [PubMed] [Google Scholar]
- 10.Elowitz MB, Levine AJ, Siggia ED, Swain PS. Stochastic gene expression in a single cell. Science. 2002;297:1183–1186. doi: 10.1126/science.1070919. [DOI] [PubMed] [Google Scholar]
- 11.Eldar A, Elowitz MB. Functional roles for noise in genetic circuits. Nature. 2010;467:167–173. doi: 10.1038/nature09326. [DOI] [PMC free article] [PubMed] [Google Scholar]
- 12.Raj A, van Oudenaarden A. Nature, nurture, or chance: stochastic gene expression and its consequences. Cell. 2008;135:216–226. doi: 10.1016/j.cell.2008.09.050. [DOI] [PMC free article] [PubMed] [Google Scholar]
- 13.Acar M, Becskei A, van Oudenaarden A. Enhancement of cellular memory by reducing stochastic transitions. Nature. 2005;435:228–232. doi: 10.1038/nature03524. [DOI] [PubMed] [Google Scholar]
- 14.Balaban NQ, Merrin J, Chait R, Kowalik L, Leibler S. Bacterial persistence as a phenotypic switch. Science. 2004;305:1622–1625. doi: 10.1126/science.1099390. [DOI] [PubMed] [Google Scholar]
- 15.Huang G, et al. Bistable expression of WOR1, a master regulator of white-opaque switching in Candida albicans. Proc. Natl. Acad. Sci. U. S. A. 2006;103:12813–12818. doi: 10.1073/pnas.0605270103. [DOI] [PMC free article] [PubMed] [Google Scholar]
- 16.Suel GM, Garcia-Ojalvo J, Liberman LM, Elowitz MB. An excitable gene regulatory circuit induces transient cellular differentiation. Nature. 2006;440:545–550. doi: 10.1038/nature04588. [DOI] [PubMed] [Google Scholar]
- 17.Suel GM, Kulkarni RP, Dworkin J, Garcia-Ojalvo J, Elowitz MB. Tunability and noise dependence in differentiation dynamics. Science. 2007;315:1716–1719. doi: 10.1126/science.1137455. [DOI] [PubMed] [Google Scholar]
- 18.Greenwald I. LIN-12/Notch signaling: lessons from worms and flies. Genes Dev. 1998;12:1751–1762. doi: 10.1101/gad.12.12.1751. [DOI] [PubMed] [Google Scholar]
- 19.Lewis K. Persister cells, dormancy and infectious disease. Nat. Rev. Microbiol. 2007;5:48–56. doi: 10.1038/nrmicro1557. [DOI] [PubMed] [Google Scholar]
- 20.Pedraza JM, van Oudenaarden A. Noise propagation in gene networks. Science. 2005;307:1965–1969. doi: 10.1126/science.1109090. [DOI] [PubMed] [Google Scholar]
- 21.Blake WJ, KAErn M, Cantor CR, Collins JJ. Noise in eukaryotic gene expression. Nature. 2003;422:633–637. doi: 10.1038/nature01546. [DOI] [PubMed] [Google Scholar]
- 22.Vlamakis H, Chai Y, Beauregard P, Losick R, Kolter R. Sticking together: building a biofilm the Bacillus subtilis way. Nat. Rev. Microbiol. 2013;11:157–168. doi: 10.1038/nrmicro2960. [DOI] [PMC free article] [PubMed] [Google Scholar]
- 23.Hall-Stoodley L, Costerton JW, Stoodley P. Bacterial biofilms: from the natural environment to infectious diseases. Nat. Rev. Microbiol. 2004;2:95–108. doi: 10.1038/nrmicro821. [DOI] [PubMed] [Google Scholar]
- 24.Rubinstein SM, et al. Osmotic pressure can regulate matrix gene expression in Bacillus subtilis. Mol. Microbiol. 2012;86:426–436. doi: 10.1111/j.1365-2958.2012.08201.x. [DOI] [PMC free article] [PubMed] [Google Scholar]
- 25.Davies DG, et al. The involvement of cell-to-cell signals in the development of a bacterial biofilm. Science. 1998;280:295–298. doi: 10.1126/science.280.5361.295. [DOI] [PubMed] [Google Scholar]
- 26.Kolodkin-Gal I, et al. Respiration control of multicellularity in Bacillus subtilis by a complex of the cytochrome chain with a membrane-embedded histidine kinase. Genes Dev. 2013;27:887–899. doi: 10.1101/gad.215244.113. [DOI] [PMC free article] [PubMed] [Google Scholar]
- 27.Kearns DB, Losick R. Cell population heterogeneity during growth of Bacillus subtilis. Genes Dev. 2005;19:3083–3094. doi: 10.1101/gad.1373905. [DOI] [PMC free article] [PubMed] [Google Scholar]
- 28.Acar M, Mettetal JT, van Oudenaarden A. Stochastic switching as a survival strategy in fluctuating environments. Nat. Genet. 2008;40:471–475. doi: 10.1038/ng.110. [DOI] [PubMed] [Google Scholar]
- 29.Dubnau D, Losick R. Bistability in bacteria. Mol. Microbiol. 2006;61:564–572. doi: 10.1111/j.1365-2958.2006.05249.x. [DOI] [PubMed] [Google Scholar]
- 30.Veening JW, et al. Bet-hedging and epigenetic inheritance in bacterial cell development. Proc. Natl. Acad. Sci. U. S. A. 2008;105:4393–4398. doi: 10.1073/pnas.0700463105. [DOI] [PMC free article] [PubMed] [Google Scholar]
- 31.Chai Y, Norman T, Kolter R, Losick R. An epigenetic switch governing daughter cell separation in Bacillus subtilis. Genes Dev. 2010;24:754–765. doi: 10.1101/gad.1915010. [DOI] [PMC free article] [PubMed] [Google Scholar]
- 32.Chai Y, Kolter R, Losick R. Reversal of an epigenetic switch governing cell chaining in Bacillus subtilis by protein instability. Mol. Microbiol. 2010;78:218–229. doi: 10.1111/j.1365-2958.2010.07335.x. [DOI] [PMC free article] [PubMed] [Google Scholar]
- 33.Chen R, Guttenplan SB, Blair KM, Kearns DB. Role of the sigmaD-dependent autolysins in Bacillus subtilis population heterogeneity. J. Bacteriol. 2009;191:5775–5784. doi: 10.1128/JB.00521-09. [DOI] [PMC free article] [PubMed] [Google Scholar]
- 34.Kearns DB, Chu F, Branda SS, Kolter R, Losick R. A master regulator for biofilm formation by Bacillus subtilis. Mol. Microbiol. 2005;55:739–749. doi: 10.1111/j.1365-2958.2004.04440.x. [DOI] [PubMed] [Google Scholar]
- 35.Bai U, Mandic-Mulec I, Smith I. SinI modulates the activity of SinR, a developmental switch protein of Bacillus subtilis, by protein-protein interaction. Genes Dev. 1993;7:139–148. doi: 10.1101/gad.7.1.139. [DOI] [PubMed] [Google Scholar]
- 36.Teng SW, Mukherji S, Moffitt JR, de Buyl S, O'Shea EK. Robust circadian oscillations in growing cyanobacteria require transcriptional feedback. Science. 2013;340:737–740. doi: 10.1126/science.1230996. [DOI] [PMC free article] [PubMed] [Google Scholar]
- 37.Wang P, et al. Robust growth of Escherichia coli. Curr. Biol. 2010;20:1099–1103. doi: 10.1016/j.cub.2010.04.045. [DOI] [PMC free article] [PubMed] [Google Scholar]
- 38.Moffitt JR, Lee JB, Cluzel P. The single-cell chemostat: an agarose-based, microfluidic device for high-throughput, single-cell studies of bacteria and bacterial communities. Lab. Chip. 2012;12:1487–1494. doi: 10.1039/c2lc00009a. [DOI] [PMC free article] [PubMed] [Google Scholar]
- 39.Ullman G, et al. High-throughput gene expression analysis at the level of single proteins using a microfluidic turbidostat and automated cell tracking. Philos. Trans. R. Soc. Lond. B. Biol. Sci. 2012;368:20120025. doi: 10.1098/rstb.2012.0025. [DOI] [PMC free article] [PubMed] [Google Scholar]
- 40.Robert L, et al. Pre-dispositions and epigenetic inheritance in the Escherichia coli lactose operon bistable switch. Mol. Syst. Biol. 2010;6:357. doi: 10.1038/msb.2010.12. [DOI] [PMC free article] [PubMed] [Google Scholar]
- 41.Mather W, Mondragon-Palomino O, Danino T, Hasty J, Tsimring LS. Streaming instability in growing cell populations. Phys. Rev. Lett. 2010;104:208101. doi: 10.1103/PhysRevLett.104.208101. [DOI] [PMC free article] [PubMed] [Google Scholar]
- 42.DeLange RJ, Chang J, Shaper J, Glazer A. Amino acid sequence of flagellin of Bacillus subtilis 168. III. Tryptic peptides, N-bromosuccinimide peptides, and the complete amino acid sequence. J. Biol. Chem. 1976;251:705–711. [PubMed] [Google Scholar]
- 43.Muth EJ. Memory as a property of probability distributions. IEEE Trans. Rel. 1980;R-29:160–165. [Google Scholar]
- 44.Aldous D. Probability approximations via the poisson clumping heuristic. Springer-Verlag; New York: 1989. [Google Scholar]
- 45.Hartwell LH, Hopfield JJ, Leibler S, Murray AW. From molecular to modular cell biology. Nature. 1999;402:C47–52. doi: 10.1038/35011540. [DOI] [PubMed] [Google Scholar]
- 46.Huh D, Paulsson J. Non-genetic heterogeneity from stochastic partitioning at cell division. Nat. Genet. 2011;43:95–100. doi: 10.1038/ng.729. [DOI] [PMC free article] [PubMed] [Google Scholar]
- 47.Beauregard PB, Chai Y, Vlamakis H, Losick R, Kolter R. Bacillus subtilis biofilm induction by plant polysaccharides. Proc. Natl. Acad. Sci. U. S. A. 2013;110:E1621–30. doi: 10.1073/pnas.1218984110. [DOI] [PMC free article] [PubMed] [Google Scholar]
- 48.Newman JA, Rodrigues C, Lewis RJ. Molecular basis of the activity of SinR protein, the master regulator of biofilm formation in Bacillus subtilis. J. Biol. Chem. 2013;288:10766–10778. doi: 10.1074/jbc.M113.455592. [DOI] [PMC free article] [PubMed] [Google Scholar]
- 49.Tolkamp BJ, Haskell MJ, Langford FM, Roberts DJ, Morgan CA. Are cows more likely to lie down the longer they stand? Appl. Anim. Behav. Sci. 2010;124:1–10. [Google Scholar]
- 50.Diard M, et al. Stabilization of cooperative virulence by the expression of an avirulent phenotype. Nature. 2013;494:353–356. doi: 10.1038/nature11913. [DOI] [PubMed] [Google Scholar]
- 51.Edelstein A, Amodaj N, Hoover K, Vale R, Stuurman N. Computer control of microscopes using microManager. Curr. Protoc. Mol. Biol. 2010 doi: 10.1002/0471142727.mb1420s92. Chapter 14, Unit14.20. [DOI] [PMC free article] [PubMed] [Google Scholar]
Associated Data
This section collects any data citations, data availability statements, or supplementary materials included in this article.
Supplementary Materials
Supplemental Video 1 | Motility and chaining. Cells of strain TMN547 (bearing a Phag-gfp reporter for flagellin and a PtapA-mKate2 reporter for matrix expression) were trapped in a narrow liquid layer and imaged. The left panel shows a phase contrast movie, showing a mixture of motile cells and chains. The middle and right panels, respectively, show movies of flagellin (in green) and matrix reporter (in red) expression taken of the same field. Note that the three movies were acquired sequentially due to the need for different filters and thus do not show precisely the same cells.
Supplemental Video 2 | Spontaneous switching in microfluidic channels. Cells (of strain TMN1157) were loaded into the device. The movie shows the interconversion between the motile state (marked by expression of a Phag-gfp for flagellin expression, pseudocolored green) and the chained state (marked by expression of a PtapA-mKate2 for matrix expression, pseudocolored red).
Supplemental Video 3 | Pulsing in cells mutant for Slr. Cells mutant for Slr (strain TMN1158) were loaded into the device. The top panel, which is scaled identically to Supplemental Movie 2, shows that in these cells, motility is never interrupted, leading to sustained expression of the Phag-gfp fluorescent reporter for flagellin (pseudocolored green). There are, however, periodic pulses of expression of the PtapA-mKate2 matrix reporter (pseudocolored red). Note many pulses are weak and thus difficult to see against the strong flagellin signal. The bottom panel provides a contrast-enhanced version of the movie showing only the matrix reporter.
Supplemental Video 4 | Artificial induction of chaining and pulsing. An IPTG-inducible I construct was introduced to allow artificial induction of chaining or pulsing. The movie shows the response of cells wild type (on the left, strain TMN1195) and mutant for Slr (on the right, strain TMN1196) to a 10 minute pulse of 100 μM IPTG. The top row shows a merge between flagellin (in green) and matrix (in red) reporter expression, while the bottom row shows only matrix reporter expression.