

Abstract
This paper reports the synthesis and characterization of surface-enhanced Raman scattering (SERS) label-tagged gold nanostars, coated with a silica shell containing methylene blue photosensitizing drug for singlet oxygen generation. To our knowledge, this is the first report of nanocomposites possessing a combined capability for SERS detection and singlet oxygen generation for photodynamic therapy. The gold nanostars were tuned for maximal absorption in the near infrared (NIR) spectral region and tagged with a NIR dye for surface-enhanced resonance Raman scattering (SERRS). Silica coating was used to encapsulate the photosensitizer methylene blue in a shell around the nanoparticles. Upon 785-nm excitation, SERS from the Raman dye is observed, while excitation at 633-nm shows fluorescence from the methylene blue. Methylene blue encapsulated nanoparticles show a significant increase in singlet oxygen generation as compared to nanoparticles synthesized without methylene blue. This increased singlet oxygen generation shows a cytotoxic effect on BT549 breast cancer cells upon laser irradiation. The combination of SERS detection (diagnostic) and singlet oxygen generation (therapeutic) into a single platform provides a potential theranostic agent.
Keywords: SERS, Singlet oxygen generation, Nanostars, Silica-coated gold nanoparticle, Methylene blue, Photodynamic therapy
Introduction
Photodynamic therapy (PDT) is a promising technique for the treatment of cancer and other diseases.1 PDT requires three components: light, a photosensitizer (PS), and oxygen. Upon irradiation at the appropriate wavelength, the PS becomes excited and can transfer its energy to oxygen in the surrounding media, producing reactive oxygen species (ROS) such as singlet oxygen.2 It is commonly accepted that singlet oxygen is the predominant cytotoxic agent produced during PDT.1-3 The generated ROS can react with nearby biomolecules, leading to cell death by apoptosis or necrosis.3 Therefore, PDT efficiency is largely determined by the production efficiency of singlet oxygen, which is a product of photosensitizer efficacy, light characteristics (intensity and wavelength), and oxygen concentration.
It has recently been shown that a mesoporous silica shell can be used to encapsulate various dye molecules onto a metallic core.4 This can be advantageous for PDT since many PSs are hydrophobic and cannot be adequately administered in a biological environment.5 Methylene blue (MB) is one common photosensitizer that has been used for a variety of applications, including PDT.6 Due to its high quantum yield of singlet oxygen generation (ΦΔ ~0.5) in the therapeutic window (600–900 nm) and its relatively low toxicity, MB has been considered as a promising candidate for PDT of cancer.3 However, clinical use of MB has been limited because of the lack of activity when applied systemically. The weak pharmaceutical effect results in part from poor penetration of MB into the cellular compartment of the tumor.3 Furthermore, the photodynamic activity of MB is usually eliminated in biological environments by reduction to leukomethylene blue.6 Embedding of MB in silica has been shown to protect it from this reduction in vitro.7 The encapsulated PS can be effectively delivered to the target site either by local injection or antibody targeting.8,9 Due to the mesoporous nature of the silica, it is not necessary for release of the PS at the target; singlet oxygen that is generated within the silica matrix can diffuse out into the surrounding tissue.3 For theranostic applications a therapeutic modality such as PDT must be combined with a label (e.g., optical dye) for diagnostics. The use of Raman reporters for biolabeling applications has seen a gain in popularity in recent years.
The encapsulation of Raman-active dye molecules in a silica shell on gold nanoparticles has proven to be an effective method for the preparation of SERS tags.4,10 Such core-shell nanoparticles are more robust than ligand stabilized nanoparticles, and can help prevent loss of the Raman dye.4,11 A thin silica shell (≤ ~10 nm) not only protects the nanoparticles, but also limits the aggregation dependence of SERS (e.g., drop-casting onto a microscope slide), enhancing reproducibility.10 Potential applications of these nanoparticles include biolabeling and in vitro and in vivo imaging.12,13 The use of gold nanostars as the core particle for SERS tags provides advantages over gold nanospheres, including larger SERS enhancement due to multiple “hot spots” of electromagnetic field enhancement on each particle.14-20
In this paper, we present the synthesis of SERS-tagged gold nanostars coated with a silica shell encapsulating MB as a potential nano-construct for combined PDT and SERS imaging. The surface plasmon band of the nanostars and the absorption band of the Raman reporter fall within the NIR region. This is ideal for in vivo imaging since tissue absorption is minimal in this spectral range, increasing the penetration depth of the excitation source and the efficiency of Raman scattering collection.21 Use of an excitation source that overlaps with the absorption of the Raman reporter allows for surface-enhanced resonance Raman scattering, further enhancing the efficiency of Raman scattering by 3-5 orders of magnitude.22 The core-shell nanoparticles with encapsulated MB show a significant increase in singlet oxygen generation versus core-shell nanoparticles grown without MB. It is also observed that this increased singlet oxygen generation provides a cytotoxic effect on BT549 breast cancer cells upon laser irradiation. Optical characterization of the nanocomposites was performed by Raman spectroscopy, fluorescence, and Vis-NIR absorption.
Experimental
Materials
Gold(III) chloride trihydrate (HAuCl4·3H2O), trisodium citrate dihydrate (C6H5O7Na3·2H2O), 1N HCl, L(+)-ascorbic acid (AA), tetraethyl orthosilicate (TEOS), O-[2-(3-Mercaptopropionylamino)ethyl]-O’-methylpolyethylene glycol (mPEG-SH, MW 5k), methylene blue hydrate (MB), 3,3′-Diethylthiatricarbocyanine iodide (DTTC), fluorescein diacetate (FDA), propidium iodide (PI), and methanol were purchased from Sigma-Aldrich (St. Louis, MO, USA) at the highest purity grade available. Silver nitrate (AgNO3, 99.995%) was supplied by Alfa Aesar (Ward Hill, MA, USA). Pure-grade ethanol and NH4OH (29.5%) were obtained through VWR (Radnor, PA, USA). Ultrapure water (18 M cm−1) was used in all preparations. Singlet Oxygen Sensor Green (SOSG) reagent was procured from Invitrogen (Carlsbad, CA, USA). Hydrofluoric acid (HF, 52%) was bought from EMD Chemicals (Gibbstown, NJ, USA).
Caution: HF is highly toxic and must be handled with the proper protective equipment
SERS-tagged Nanostar Synthesis
Detailed synthesis and characterization of the nanostars will be presented elsewhere. A modified Turkevich method was used to prepare the seed solution.23,24 Nanostars were grown from the seed by simultaneous addition of 100 μL 2 mM AgNO3 and 50 μL 0.1 M AA to a solution containing 10 mL of 0.25 mM HAuCl4, 10 μL of 1N HCl, and 100 μL of the gold seed solution under vigorous stirring. After 10 seconds the solution turned from light red to a dark grey. The stock concentration of nanoparticles is approximately 0.1 nM, as determined by Nanoparticle Tracking Analysis (NTA).
Freshly synthesized nanostars (10 mL) were capped with 5 μM mPEG-SH under gentle stirring for 15 minutes. The PEGylated particles were then centrifuged (10k rcf, 15 minutes) twice at 4 °C to remove excess PEG and redispersed in water. 5 μM DTTC in methanol was added to this solution and allowed to stir overnight. The DTTC-tagged particles were centrifuged (5k rcf, 15 minutes) twice at 4 °C to remove excess DTTC and resuspended in 2.3 mL of ethanol.
Encapsulation of PDT Drug
A modified Stöber method was used for formation of the silica shell.25 Under gentle stirring, 2.25 mL of the nanostars in ethanol was added to a solution containing 2.0 mL of water and 6.8 mL ethanol. Methylene blue (final concentration 5 μM) in ethanol and 160 μL of NH4OH were added to the mixture. Silica coating was initiated by the addition of 30 μL 10% TEOS in ethanol, and the reaction was allowed to proceed for three hours. The nanoparticles were then centrifugally purified (3.5k rcf, 15 minutes) until no MB absorption could be detected from the supernatant (typically 2-3 times) and redispersed into 5 mL of water. The concentration of MB encapsulated in the sample was determined by dissolving the silica shell of the nanoparticles using a 26% HF, 50% EtOH, 24% H2O solution. After reacting for 30 minutes, the sample was centrifuged at 18k rcf and the supernatant was collected. The supernatant was diluted with an equal volume of H2O and fluorescence emission was recorded using 633-nm excitation.
Characterization
Raman spectra with 785-nm excitation (40 mW) were recorded on a HORIBA Jobin Yvon LabRAM ARAMIS system (Edison, NJ, USA) using a 1200 g mm−1 grating. Fluorescence and Raman spectra with 633-nm (8 mW) excitation were recorded on a Renishaw inVia Raman microscope (Gloucestershire, UK) using an 1800 g mm−1 grating. Transmission electron microscopy (TEM) was performed on a FEI Tecnai G2 Twin transmission electron microscope (Hillsboro, OR, USA) with an accelerating voltage of 160 kV. Vis-NIR spectra were acquired on a Shimadzu UV-3600 (Columbia, MD). Particle concentrations and size distributions were measured by NTA with a NanoSight NS500 (Amesbury, UK).
Singlet Oxygen Generation
The fluorescent probe SOSG was used to indirectly measure singlet oxygen generation from the nanoparticles. In a 96-well plate, 90 μL of the coated nanoparticles were mixed with 10 μL of ~100 μM SOSG in methanol. The sample was excited using 633-nm laser light focused into the solution with a 10× objective. The laser power was 8 mW at the sample. Fluorescence intensity was measured at different time points with a BMG LABTECH FLUOstar Omega (Durham, NC, USA) using an excitation filter at 500 ± 10 nm and an emission filter at 530 ± 10 nm.
In vitro PDT Study
The BT549 cancer cells were a gift from Dr. Victoria Seewaldt. Cells were incubated in RPMI 1640 medium (Invitrogen, Carlsbad, CA) containing 10% of fetal bovine serum, 25 mM HEPES and 0.023 U/mL of insulin, in an incubator with a humidified atmosphere (37 °C, 5% CO2). Cells in exponential growth phase were used in the experiments. The nanoparticles were concentrated to ~0.2 nM and redispersed into the RPMI media. Cells were incubated with the particle-containing media during 1 hour of irradiation from a 633-nm HeNe laser (Model 1145, JDS Uniphase, Milpitas, CA) at 37 °C. The laser was coupled to a fiber that was routed into the incubator and then focused on the sample using a 10× microscope objective. Laser power at the sample was 16 mW with a spot size of ~1.5 mm in diameter, resulting in a laser power density of approximately 700 mW cm−2. After treatment, the cells were washed twice with PBS, and incubated with fresh media overnight. Cell viability was assessed by incubating cells for 5 minutes in a solution of PBS containing 1 μg/mL FDA for live cells and 50 μg/mL PI for dead cells, and imaging on a fluorescence microscope. Images were recorded with a Canon EOS Rebel XTi (Tokyo, Japan) mounted to the front port of the microscope.
Results and Discussion
SERS-tagged Nanostar Synthesis
Nanostars were SERS-labeled by mixing the PEGylated nanoparticles with DTTC overnight. However, before silica coating, the SERS signal of the nanoparticles is overwhelmed by DTTC fluorescence at 785-nm excitation (data not shown). After silica coating, non-surface bound DTTC molecules were removed, and the SERS signal of DTTC is readily detected. It is presumed that the sulfur groups in the DTTC molecule aid in adsorption to the gold surface, although some DTTC remains within the layer of PEG. Condensation of silica onto the PEG is believed to displace any remaining DTTC that is not bound to the gold surface. Upon laser excitation at 785-nm, the silica coated, DTTC-tagged nanoparticles show little to no fluorescence signal, indicating that the dye is located at or near the gold surface, resulting in quenching. Figure 1 shows the strong SERRS signal from silica encapsulated MB DTTC-tagged nanoparticles (AuNS-DTTC@SiO2-MB), while the gold nanostars with silica encapsulated MB without DTTC (AuNS@SiO2-MB) exhibit no appreciable signal. Raman spectra of AuNS-DTTC@SiO2 nanoparticles without MB are much noisier when excited at 633-nm (Figure 2). This is likely due to the fact that the excitation source is no longer resonant with the absorption band of DTTC or the plasmon band of the nanostars.
Figure 1.
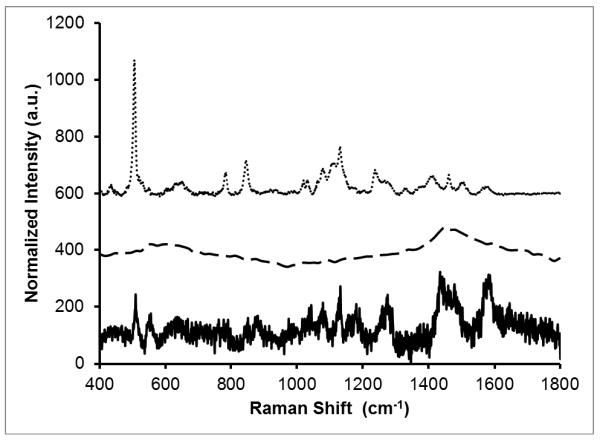
Raman spectra collected at 785-nm (dotted, dashed) and 633-nm (solid) excitation, 10 sec exposure time. Each spectrum was normalized to the laser power and to the ω4 dependence of Raman scattering. Spectra are offset for clarity and have had their backgrounds removed manually. Samples were dispersed in water. Gold nanostars tagged with DTTC and coated with MB encapsulated silica (AuNS-DTTC@SiO2-MB; dotted) show a strong SERS signal at 785-nm. Gold nanostars without DTTC, coated with MB encapsulated silica (AuNS@SiO2-MB; dashed) show little to no SERS at 785-nm. At 633-nm excitation (AuNS-DTTC@SiO2; solid), the nanostars tagged with DTTC and coated with silica without MB have weak SERS.
Figure 2.
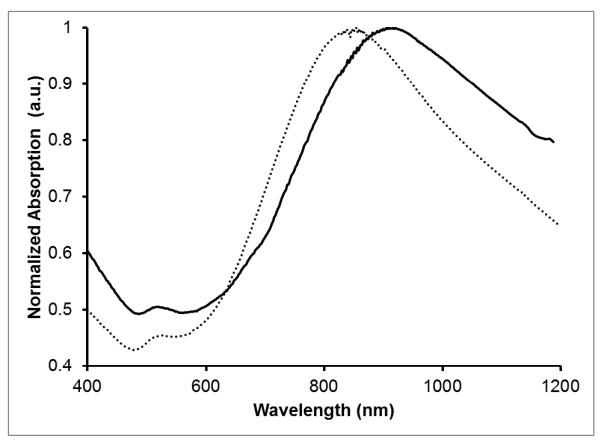
Normalized Vis-NIR spectra of DTTC-tagged AuNS in water before (dotted) and after (solid) silica coating.
Encapsulation of PDT Drug
We have utilized the method of silica coating presented by Fernández-López et al. to encapsulate MB in a mesoporous shell around gold nanostars.10 Previous work has shown that MB is loaded into the silica matrix when present in solution during silica condensation using the Stöber method.3,7,10,26 Silica coating of the AuNSs gives an expected red-shift in the Vis-NIR absorption spectrum due to an increase in the local refractive index around the nanoparticles.27 As can be seen in Figure 2, there appears to be a small shoulder around 680 nm for the silica coated nanoparticles that may be attributed to the encapsulated MB. It is believed that the cationic nature of MB drives its adsorption to the negatively charged matrix during silica condensation.10 The initial SERS-tagging and the embedding of MB do not affect the quality of the silica shell, as seen in Figure 3, showing a TEM image of the silica coated nanoparticles. Upon laser excitation at 633-nm, strong fluorescence is observed from the silica coated nanoparticles containing MB (Figure 4). This is in contrast to a previous report where only residual fluorescence was observed after encapsulating MB in silica on gold nanoparticles.10 We propose that the initial tagging of the nanoparticles with DTTC prevents any MB adsorption directly to the gold surface, preserving its fluorescence and singlet oxygen generation capability. The AuNS-DTTC@SiO2-MB have a blue shift of ~3 nm in the fluorescence spectrum compared to the AuNS-DTTC@SiO2 sample spiked with 0.5 μM MB. Previous studies have shown that caging and confinement effects of the silica matrix on an embedded dye can cause a blue shift in the fluorescence emission.28,29 It was also observed that adjustment of the amount of TEOS added or the reaction time allows for control of the silica shell thickness if so desired (data not shown).
Figure 3.

TEM micrograph of the silica coated nanostars.
Figure 4.
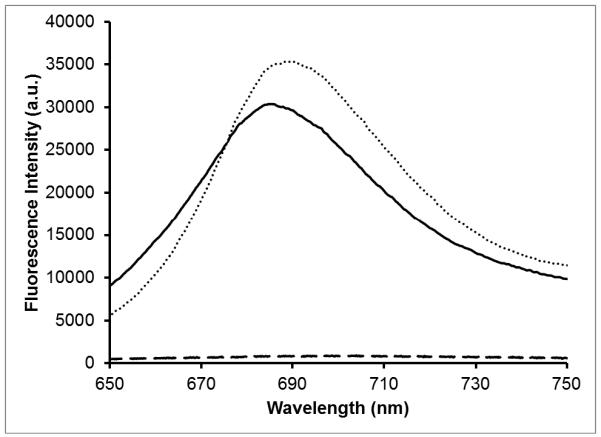
Fluorescence spectra of AuNS-DTTC@SiO2-MB (solid), MB-spiked AuNS-DTTC@SiO2 (dotted), and AuNS-DTTC@SiO2 (dashed) in water. Excitation was at 633-nm, 10 sec exposure time.
It was found that the as-prepared nanoparticles (~0.1 nM) have a MB concentration of 0.138 ± 0.001 μM. Quantification of the amount of MB encapsulated was performed by dissolving the silica shell using HF and measuring the resultant fluorescence intensity from MB. First, MB-spiked samples of AuNS-DTTC@SiO2 were dissolved in HF, pelleted, and the supernatant collected. The MB fluorescence intensity of each sample, diluted in an equal volume of water, was measured to create a standard curve (Figure 5). The same procedure was carried out on the AuNS-DTTC@SiO2-MB nanoparticles and the standard curve was used to calculate the concentration of MB.
Figure 5.
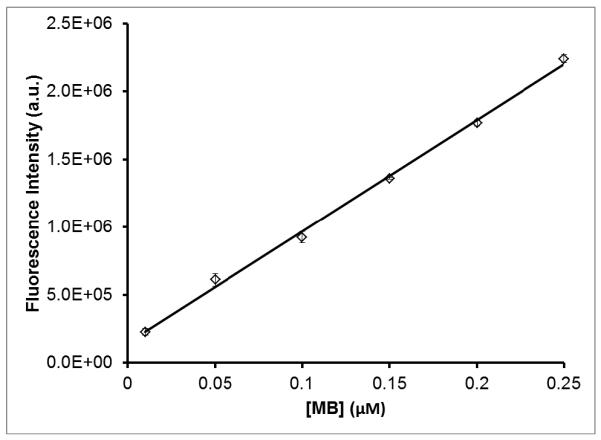
Standard curve of MB fluorescence intensity from the supernatant of MB-spiked AuNSDTTC@SiO2 samples after being dissolved in HF/EtOH/H2O solution. A linear regression was performed on the data set, obtaining a line with R2 = 0.997. Error bars are ±σ of three independent measurements.
Singlet Oxygen Generation
The MB-encapsulated silica-coated particles were found to produce significantly more singlet oxygen than silica-coated particles without embedded MB. Singlet oxygen generation from the nanoparticles was detected indirectly with the fluorescent probe, SOSG. Upon reaction with singlet oxygen, SOSG becomes fluorescent with excitation at a λmax of 504-nm and emission at a λmax of 525-nm. Singlet oxygen generation from AuNS-DTTC@SiO2-MB, 0.14 μM MB-spiked AuNSDTTC@SiO2, and AuNS-DTTC@SiO2 were compared (Figure 6). The measured fluorescence intensities at each time point were normalized to the initial fluorescence of the sample. A significant increase in the amount of singlet oxygen generation is observed from the MB-embedded and MB-spiked nanoparticles. It is interesting to note that the MB-embedded nanoparticles show higher singlet oxygen generation than the MB-spiked nanoparticles. It is possible that trapping MB within the silica matrix reduces the number of dimers and other aggregates, increasing the quantum yield of singlet oxygen.8,30 The plasmonic effect of the gold nanostars may also be contributing to the observed enhancement of singlet oxygen generation.31-33 These results indicate that such nanocomposites can effectively be used to carry the photosensitizer MB and generate singlet oxygen when excited at the appropriate wavelength.
Figure 6.
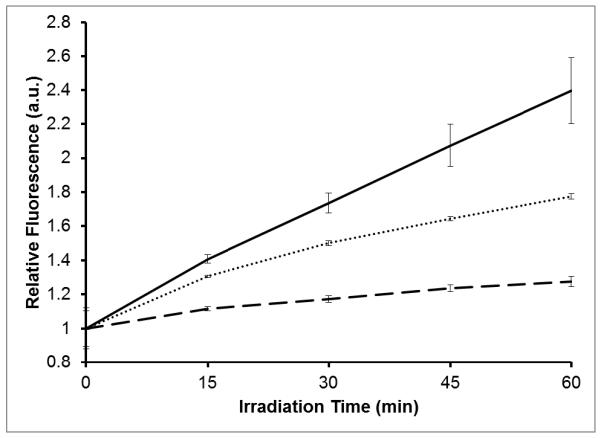
Fluorescence intensity ratio of SOSG as a function of irradiation time (633-nm, 8 mW) for AuNS-DTTC@SiO2-MB (solid), MB-spiked AuNS-DTTC@SiO2 (dotted), and AuNS-DTTC@SiO2 (dashed). Error bars are ±σ of three independent measurements.
In vitro PDT Study
A preliminary in vitro PDT test was performed to verify the efficacy of our nano-construct on cancer cells. The test was performed with BT549 human breast carcinoma cells. The treatment group was exposed to S30-DTTC@SiO2-MB with laser irradiation while the control group was exposed to S30-DTTC@SiO2 with laser irradiation. Cell viability was assessed by dual staining. The first stain was FDA, a membrane permeable dye, which is actively converted to fluorescein by living cells through hydrolytic cleavage. The second stain, PI, is membrane impermeable and only has detectable fluorescence once it has intercalated with DNA. Thus, PI is only seen in cells with damaged membranes. As can be seen in Figure 7, only the MB-embedded particles produced a cytotoxic effect after laser irradiation and furthermore, this effect is only seen within the laser irradiated area. These results confirm previous findings about the nontoxicity of silica coated particles and show that SERS-tagged, silica coated particles do not produce any cytotoxic effects upon laser irradiation unless they are embedded with MB. Due to the mechanism of the photosensitizer, particle uptake is not required as singlet oxygen can be delivered to the cells by particles in contact with the cell membrane.3 It should also be noted that no photothermal effects were observed by these constructs (Figure 7B) due to the relatively low power density (~700 mW cm−2) and use of a 633-nm excitation source that did not overlap with the surface plasmon resonance of the particles (~800 nm).
Figure 7.
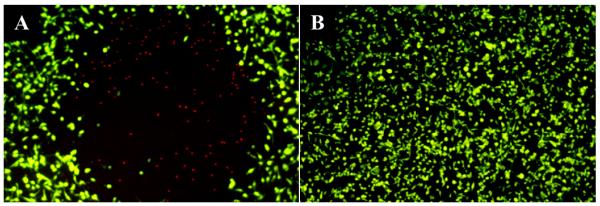
Fluorescence images of BT549 cells incubated with: (A) S30-DTTC@SiO2-MB and (B) S30-DTTC@SiO2 after 1 hr of laser irradiation, taken with a 5× objective. Cell death is only seen after treatment using MB-encapsulated particles, and is limited to the laser irradiated area. The green color is from hydrolyzed FDA, indicating live cells. The red color is from DNA intercalated PI that only enters cells with compromised membranes, indicating dead cells.
Conclusion
To our knowledge, this is the first report of SERS-tagged nanocomposites possessing a combined capability for SERS detection and singlet oxygen generation for PDT. This work has demonstrated the relatively strong SERRS signal from DTTC-tagged nanostars using 785-nm laser excitation. Encapsulation of MB photosensitizing drug into a silica shell around the nanostars shows increased singlet oxygen generation upon laser excitation at 633-nm compared to silica-coated nanostars without MB. It was demonstrated that the MB-loaded nanostars produce a cytotoxic effect on BT549 breast cancer cells upon laser irradiation that was not seen in the silica-coated nanostars without MB. These multimodal nanoprobes have potential applications in theranostics, integrating SERS imaging and PDT. Future work will further investigate the behavior of these nanoparticles in vitro and in vivo to test their efficacy as a PDT drug carrier and SERS imaging label.
ACKNOWLEDGMENT
This work was sponsored by the National Institutes of Health (Grants R01 EB006201 and R01 ES014774).
References
- (1).Dolmans DEJGJ, Fukumura D, Jain RK. Nature Rev. Cancer. 2003;3:380–387. doi: 10.1038/nrc1071. [DOI] [PubMed] [Google Scholar]
- (2).Dougherty TJ. Photochem. Photobiol. 1987;45:879–889. doi: 10.1111/j.1751-1097.1987.tb07898.x. [DOI] [PubMed] [Google Scholar]
- (3).Tang W, Xu H, Kopelman R, Philbert A, M. Photochem. Photobiol. 2005;81:242–249. doi: 10.1562/2004-05-24-RA-176.1. [DOI] [PubMed] [Google Scholar]
- (4).Doering WE, Nie S. Anal. Chem. 2003;75:6171–6176. doi: 10.1021/ac034672u. [DOI] [PubMed] [Google Scholar]
- (5).Konan YN, Gurny R, Allémann E. Photochem. Photobiol. B. 2002;66:89–106. doi: 10.1016/s1011-1344(01)00267-6. [DOI] [PubMed] [Google Scholar]
- (6).Orth K, Beck G, Genze F, Rück A. Photochem. Photobiol. B. 2000;57:186–192. doi: 10.1016/s1011-1344(00)00105-6. [DOI] [PubMed] [Google Scholar]
- (7).He X, Wu X, Wang K, Shi B, Hai L. Biomaterials. 2009;30:5601–5609. doi: 10.1016/j.biomaterials.2009.06.030. [DOI] [PubMed] [Google Scholar]
- (8).Yan F, Kopelman R. Photochem. Photobiol. 2003;78:587–591. doi: 10.1562/0031-8655(2003)078<0587:teomis>2.0.co;2. [DOI] [PubMed] [Google Scholar]
- (9).Santra S, Zhang P, Wang K, Tapec R, Tan W. Anal. Chem. 2001;73:4988–4993. doi: 10.1021/ac010406+. [DOI] [PubMed] [Google Scholar]
- (10).Fernández-López C, Mateo-Mateo C, Álvarez-Puebla RA, Pérez-Juste J, Pastoriza-Santos I, Liz-Marzán LM. Langmuir. 2009;25:13894–13899. doi: 10.1021/la9016454. [DOI] [PubMed] [Google Scholar]
- (11).Doering WE, Piotti ME, Natan MJ, Freeman RG. Adv. Mat. 2007;19:3100–3108. [Google Scholar]
- (12).Zavaleta CL, Smith BR, Walton I, Doering W, Davis G, Shojaei B, Natan MJ, Gambhir SS. Proc. Natl. Acad. Sci. USA. 2009;106:13511–13516. doi: 10.1073/pnas.0813327106. [DOI] [PMC free article] [PubMed] [Google Scholar]
- (13).Jokerst JV, Miao Z, Zavaleta C, Cheng Z, Gambhir SS. Small. 2011;7:625–633. doi: 10.1002/smll.201002291. [DOI] [PMC free article] [PubMed] [Google Scholar]
- (14).Vo-Dinh T. Trends Anal. Chem. 1998;17:557–582. [Google Scholar]
- (15).Vo-Dinh T, Dhawan A, Norton SJ, Khoury CG, Wang H-N, Misra V, Gerhold M. J. Phys. Chem C. 2010;114:7480–7488. doi: 10.1021/jp911355q. [DOI] [PMC free article] [PubMed] [Google Scholar]
- (16).Yang M, Álvarez-Puebla R, Kim H-S, Aldeanueva-Potel P, Liz-Marzán LM, Kotov NA. Nano Lett. 2010;10:4013–4019. doi: 10.1021/nl101946c. [DOI] [PMC free article] [PubMed] [Google Scholar]
- (17).Khoury CG, Vo-Dinh T. J. Phys. Chem. C. 2008;112:18849–18859. doi: 10.1021/jp8054747. [DOI] [PMC free article] [PubMed] [Google Scholar]
- (18).Hrelescu C, Sau TK, Rogach AL, Jäckel F, Feldmann J. Appl. Phys. Lett. 2009;94:153113. [Google Scholar]
- (19).Nalbant Esenturk E, Hight Walker AR. J. Raman Spectroscopy. 2009;40:86–91. [Google Scholar]
- (20).Senthil Kumar P, Pastoriza-Santos I, Rodríguez-González B, Javier García de Abajo F, Liz-Marzán LM. Nanotechnology. 2008;19:015606. doi: 10.1088/0957-4484/19/01/015606. [DOI] [PubMed] [Google Scholar]
- (21).Richards-Kortum R, Sevick-Muraca E. Annu. Rev. Phys. Chem. 1996;47:555–606. doi: 10.1146/annurev.physchem.47.1.555. [DOI] [PubMed] [Google Scholar]
- (22).Hildebrandt P, Stockburger M. J. Phys. Chem. 1984;88:5935–5944. [Google Scholar]
- (23).Ji X, Song X, Li J, Bai Y, Yang W, Peng X. J. Am. Chem. Soc. 2007;129:13939–13948. doi: 10.1021/ja074447k. [DOI] [PubMed] [Google Scholar]
- (24).Kimling J, Maier M, Okenve B, Kotaidis V, Ballot H, Plech A. J. Phys. Chem. B. 2006;110:15700–15707. doi: 10.1021/jp061667w. [DOI] [PubMed] [Google Scholar]
- (25).Stöber W, Fink A, Bohn E. J. Colloid Interface Sci. 1968;26:62–69. [Google Scholar]
- (26).Tada DB, Vono LLR, Duarte EL, Itri R, Kiyohara PK, Baptista MS, Rossi LM. Langmuir. 2007;23:8194–8199. doi: 10.1021/la700883y. [DOI] [PubMed] [Google Scholar]
- (27).Liz-Marzán LM, Giersig M, Mulvaney P. Langmuir. 1996;12:4329–4335. [Google Scholar]
- (28).Anedda A, Carbonaro CM, Clemente F, Corpino R, Grandi S, Magistris A, Mustarelli PC. J. Non-Cryst. Solids. 2005;351:1850–1854. [Google Scholar]
- (29).Cho E-B, Volkov DO, Sokolov I. Small. 2010;6:2314–2319. doi: 10.1002/smll.201001337. [DOI] [PubMed] [Google Scholar]
- (30).Severino D, Junqueira HC, Gugliotti M, Gabrielli DS, Baptista MS. Photochem. Photobiol. 2003;77:459–68. doi: 10.1562/0031-8655(2003)077<0459:ioncio>2.0.co;2. [DOI] [PubMed] [Google Scholar]
- (31).Zhang Y, Aslan K, Previte MJR, Geddes CD. J. Fluoresc. 2007;17:345–349. doi: 10.1007/s10895-007-0196-y. [DOI] [PubMed] [Google Scholar]
- (32).Zhang Y, Aslan K, Previte MJR, Geddes CD. Proc. Natl. Acad. Sci. USA. 2008;105:1798–1802. doi: 10.1073/pnas.0709501105. [DOI] [PMC free article] [PubMed] [Google Scholar]
- (33).Toftegaard R, Arnbjerg J, Cong H, Agheli H, Sutherland DS, Ogilby PR. Pure Appl. Chem. 2011;83:885–898. [Google Scholar]