Summary
Sensory systems do not work in isolation; instead they show interactions that are specifically uncovered during sensory loss. To identify and characterize these interactions, we investigated whether visual deprivation leads to functional enhancement in primary auditory cortex (A1). We compared sound-evoked responses of A1 neurons in visually-deprived animals to those from normally-reared animals. Here we show that visual deprivation leads to improved frequency selectivity as well as increased frequency and intensity discrimination performance of A1 neurons. Furthermore, we demonstrate in vitro that in adults, visual deprivation strengthens thalamocortical (TC-) synapses in A1, but not in primary visual cortex (V1). Because deafening potentiated TC-synapses in V1 but not A1, cross-modal TC-potentiation seems to be a general property of adult cortex. Our results suggest that adults retain the capability for cross-modal changes while such capability is absent within a sensory modality. Thus multimodal training paradigms might be beneficial in sensory processing disorders.
Introduction
Responses in primary auditory cortex (A1) to individual sound properties such as frequency and loudness are relevant for perception of sound characteristics such as pitch and for localization of sound sources in space (Harris, 1952; Jenkins and Merzenich, 1984; Middlebrooks and Green, 1991; Rayleigh, 1907; Wier et al., 1977; Zatorre et al., 2002). Early blindness leads to behaviorally-observed cross-modal benefits such as improved frequency discrimination performance (Gougoux et al., 2004) and sound localization abilities (Lessard et al., 1998). However, whether and how A1 neuronal responses are altered by losing vision and the underlying changes in A1 circuits are unknown. In particular, whether the cross-modal changes are manifested as changes in the thalamorecipient layer, which receives direct feed-forward sensory inputs, is also not known.
The connectivity and organization of A1, in particular at the level of thalamocortical (TC) inputs can be modified by auditory experience during an early critical period (∼P12-P15 in mice) (Barkat et al., 2011; de Villers-Sidani et al., 2007; Insanally et al., 2009; Sanes and Bao, 2009), thus within-modality (unimodal) experience has an influence only during early life. This narrow plastic window observed in TC inputs is also observed in visual cortex (V1) (for review: Hensch, 2005; Katz and Crowley, 2002) indicating that TC inputs may be less plastic later in life. However, recent evidence suggests that TC plasticity can be reactivated later in life following sensory deprivation or in response to peripheral nerve transection (Montey and Quinlan, 2011; Oberlaender et al., 2012; Yu et al., 2012).
Cross-modal plasticity was first observed at the synaptic level as a global reduction in the postsynaptic strength of excitatory synaptic transmission in layer 2/3 of A1 and barrel cortex after visual deprivation (Goel et al., 2006) and has different deprivation requirements than unimodal plasticity (He et al., 2012). The reduction in excitatory synaptic strength was in contrast to a global increase in the strength of excitatory synapses observed in deprived V1, which may indicate a homeostatic adaptation to increased activity in the spared sensory cortices (Whitt et al., 2013). Therefore, we examined whether the feed-forward TC inputs to A1 are altered cross-modally, and how this impacts A1 neuronal properties in the TC recipient layer 4 (L4). Here we report that depriving mice of vision for a short period of time changes A1 response properties to enhance sound processing, which is accompanied by a potentiation of auditory TC synapses. These cross-modal changes in A1 circuitry may play a role in the enhancement of auditory perception in blind individuals.
Results
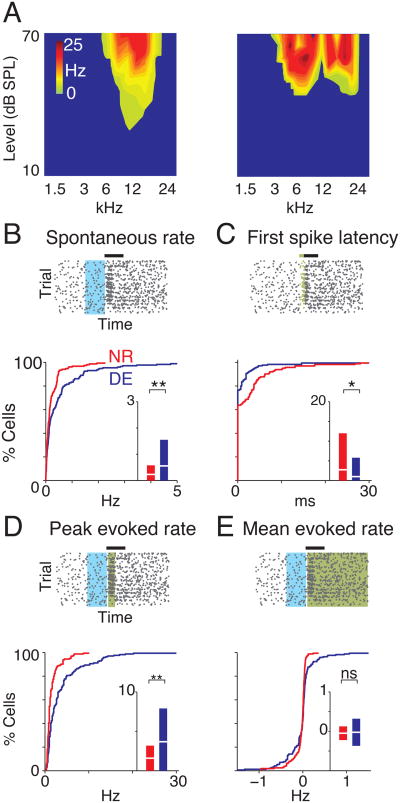
We performed visual deprivation after the thalamocortical (TC) critical period for hearing (Barkat et al., 2011; de Villers-Sidani et al., 2007; Insanally et al., 2009; Sanes and Bao, 2009) in A1 by exposing mice (C57/BL6 strain, P21-22) to darkness (DE, n=10) for 6-8 days. We then compared the sound-evoked responses of cells in the thalamorecipient cortical layer 4 (L4) of A1 with those from control animals of similar age and strain with normal visual experience (NR, n=9). We recorded single-unit responses to brief pure tone stimuli (Fig. 1, S1) and then assessed frequency selectivity by plotting the evoked firing rate (spontaneous rate subtracted) as a function of the presented sound frequency and level resulting in frequency response area functions (FRAs). For example, FRAs from about half of recorded cells (n = 89/173) were sharp-peaked indicating high frequency selectivity, while others showed broadly-tuned multi-peaked patterns (Fig. 1A). Increasing sound level generally resulted in increased firing rates (Fig. 1A). We next compared key metrics of responsiveness between cells in DE and NR. The top panels of Fig. 1B-E show representative neuronal responses plotted as a function of time for each trial in the form of spike rasters and illustrate the derivation of responsiveness metrics. Our in vivo recordings show that cells in DE animals have higher spontaneous rates (Fig. 1B), while first-spike latencies in DE cells were shorter which reflects an increase in response promptness and excitability (Fig. 1C, S2). Peak evoked rates (maximum difference in spike rates between the response and spontaneous windows) increased after DE (Fig. 1D) although the mean evoked response rates (difference in averaged spike rate between response and spontaneous windows calculated across all trials) were unchanged (Fig. 1E). The variance in firing rates was different across the two groups, (F = 3.90, P <10-5, two-sample F-test) without a significant change in mean evoked activity (Fig. 1E), indicating a greater degree of modulation of A1 responses by auditory stimuli after DE. Comparison of inter-spike intervals (ISI) also revealed that the DE units had significantly reduced ISI for responses recorded during the entire response period. The first spike latency was noted to be significantly shorter than the spontaneous ISI (Fig. S2)
Figure 1.
Response characteristics of A1 neurons change after DE. (A) Representative FRAs showing increase in firing rate as a function of intensity of sound. Occasionally a multi-peaked response pattern (right) was observed. (B-E) Characterization of response properties. The top rasters indicate measurements for an example cell. Black horizontal bar indicates duration of sound (40 ms). Spontaneous rate is measured in blue area. Significant responses were first identified using Victor's binless method (Fig. S1) for estimating the stimulus-related information in the spike trains (Victor, 2002). This algorithm searches, via a sliding window (green), for significant neuronal responses within user-set limits of a response window (600 ms following onset of stimulus) and compares the observed spike rates within that window to those seen within a chosen window deemed to contain only spontaneous activity (200 ms preceding onset of stimulus, blue), while treating the latter as a Poisson process. Here, the size of the sliding window is inversely proportional to the temporal precision of recording spike-related information. (B) First spikes in each trial are indicated in green (C). Peak and mean rates are measured within the response window (identified by the binless algorithm, green areas in (D) and (E) respectively). Lower graphs show the distributions of the response properties between NR and DE cells (n = 173 and 175 respectively). Box plots indicate mean ± 95% confidence interval. ** and * indicate P <0.001and P <0.05 respectively. See also Fig. S1 and S2.
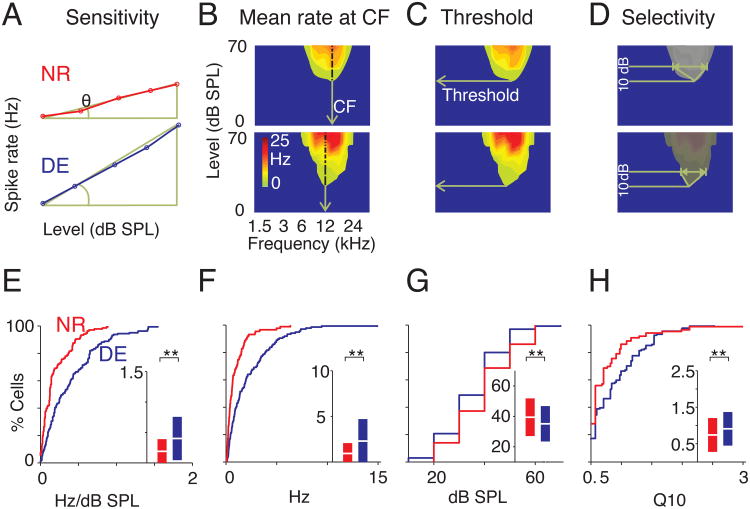
An increase in peak firing rate can indicate either a general shift of all evoked responses to higher rates, an increase in sensitivity of A1 cells to changes in sound level, or an increase in the responses to a specific subset of stimuli, e.g. a specific increase in the responses to high-level stimuli. To test if the observed increase in firing rates represented a shift in responsiveness independent of level, or an increase in sensitivity of cells to changes in sound level, we plotted the firing rate at a cell's characteristic frequency (CF) as a function of sound level (Fig. 2A, B). Linear fits to the rate-level curves indicate the sensitivity (the slope of the regression) of a cell to changes in sound level. Both sensitivity and the mean firing rate at CF increased following DE, indicating a greater sensitivity to sound level changes (Fig. 2E, F). Furthermore, cells in DE animals showed lower thresholds for firing, revealing heightened sensitivity to quieter sound stimuli (Fig. 2C, G).
Figure 2.
Tuning characteristics of A1 neurons change after DE. (A) Representative rate-level functions for NR (upper) and DE (lower) respectively. Θ represents slope. (B-D) Derivation of FRA-related statistics. (B) Mean evoked rate calculated from contours of spike rates at center frequency of the cell; (C) Thresholds calculated from lowest sound pressure level at which responses were evoked and (D) derivation of quality factor at 10 dB above (Q10) the threshold. (E-H) Summary statistics of tuned units. NR and DE are identified by red and blue cumulative distribution functions, with mean and 95% confidence intervals shown in inset. (E) Slopes of rate-level functions. (F) Comparison of mean firing rates at characteristic frequencies (CF). (G) Thresholds. (H) Q10.
We next investigated the effects of DE on the frequency selectivity of A1 neurons. After DE, neurons with well-described FRAs (cells with a single predominant peak and bandwidth <3 octaves 10 dB above the CF, see Supplemental Experimental Procedures) were more prevalent (NR = 89/173 cells, DE = 135/175, ∼26% increase, F1,347 = 25.65, P < 10-7). To characterize frequency selectivity of neurons we calculated the quality factor (Q): a measure of bandwidth (BW) respective to a cell's characteristic frequency (Q10 = CF/BW; BW measured at 10 dB above threshold, Fig. 2D). DE neurons showed higher Q10, which indicates sharper frequency tuning (i.e. narrower bandwidth) (Fig. 2H). Together these results indicate that DE changes receptive field properties and overall responsiveness of A1 neurons. In addition, our results indicate that cross-modal plasticity is present in the TC recipient layer even after the unimodal thalamocortical critical period.
Cells in L4 receive TC as well as intracortical inputs. To test the hypothesis that TC synapses could be involved in altering response properties in A1, we examined the cross-modal regulation of these synapses using optogenetics. We injected adeno-associated virus containing channelrhodopsin-2 (AAV-ChR2) into the medial geniculate body (MGB) of mice 6-8 weeks prior to experiments after which DE was initiated around postnatal age 90 days (P90) (see Supplemental Experimental Procedures), with a subset of mice returned to the normal environment for 7 days of light exposure (LE). NR controls were kept in the normal light/dark cycle.
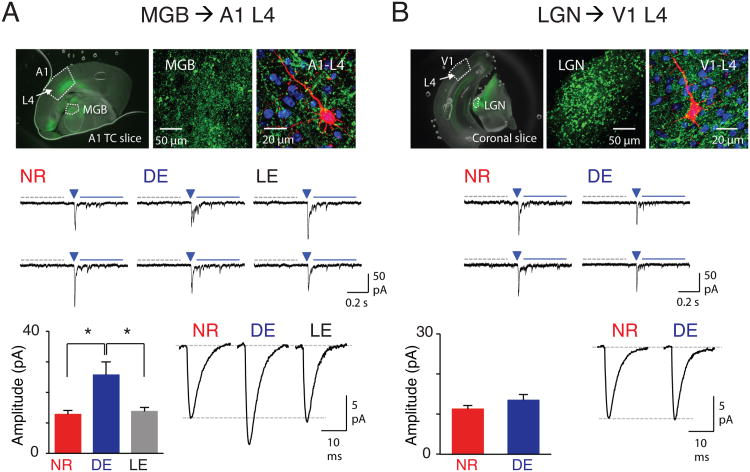
A1 slices were made from NR, DE and LE mice and L4 principal neurons of A1 were patched for whole-cell recordings. The borders of A1 were well-delineated by yellow-fluorescence protein (EYFP) expressed in the transfected TC-terminals (Fig. 3A). To quantitatively compare the strength of individual TC-synapses independent of ChR2 expression level, we replaced Ca2+ with Sr2+ in the bath. Sr2+ desynchronizes evoked release, such that individual events reflect single vesicle release which allows determination of quantal synaptic response size (Gil et al., 1999). We then measured the amplitude of light evoked strontium-desynchronized miniature excitatory postsynaptic currents (LEv-Sr2+-mEPSCs) in L4 neurons. Basal spontaneous events were mathematically subtracted to obtain the amplitude of evoked TC LEv-Sr2+-mEPSCs (see Supplemental Experimental Procedures). We found that DE significantly increased the amplitude of TC LEv-Sr2+-mEPSCs in L4 neurons compared to NR in A1, which reversed with LE (Fig. 3A). We next determined if changes occurred in TC-synapses in L4 of the primary visual cortex (V1) by injecting AAV-ChR2 into the lateral geniculate nucleus (LGN) and recording in V1 (Fig. 3B). In contrast to L4 of A1, TC-synapses in L4 of V1 were unaltered after DE (Fig. 3B, S3). This is consistent with a narrow critical period for synaptic scaling and plasticity in V1-L4 following visual deprivation (Desai et al., 2002; Jiang et al., 2007).
Figure 3.
Cross-modal potentiation of TC synapses in A1 without changes in V1. (A) Cross-modal regulation of TC-synapses in A1-L4. Top: AAV-ChR2-EYFP injection to MGB. Note expression of EYFP (green) in MGB (left and center panels). Top right: a biocytin-filled A1-L4 neuron (red) with DAPI (blue) and EYFP (green). Middle: Example traces of LEv-Sr2+-mEPSCs from NR, DE and LE group. A 5-ms duration LED light was delivered at the arrowhead to activate TC-synapses. Spontaneous events were collected during a 400-ms window (gray dotted line) before the LED, and LEv-Sr2+-mEPSCs were measured during a 400-ms window 50-ms after the LED (blue solid line). Bottom left: Average calculated LEv-Sr2+-mEPSC amplitude of thalamocortical inputs (see Supplemental Experimental Procedures). *P <0.04, ANOVA. Bottom right: Average raw LEv-Sr2+-mEPSC traces (without subtracting spontaneous events). (B) TC-synapses in V1-L4. Top: AAV-ChR2-EYFP injection to LGN. Note EYFP (green) in LGN (left and center panels). Top right: a biocytin-filled V1-L4 neuron (red) with DAPI (blue) and YFP (green). Middle: Example traces of LEv-Sr2+-mEPSCs. Marks are the same as in (A). Bottom left: Average calculated LEv-Sr2+-mEPSC amplitude of TC inputs. Bottom right: Average raw LEv-Sr2+-mEPSC traces. See Table S1 for data. See also Fig. S3.
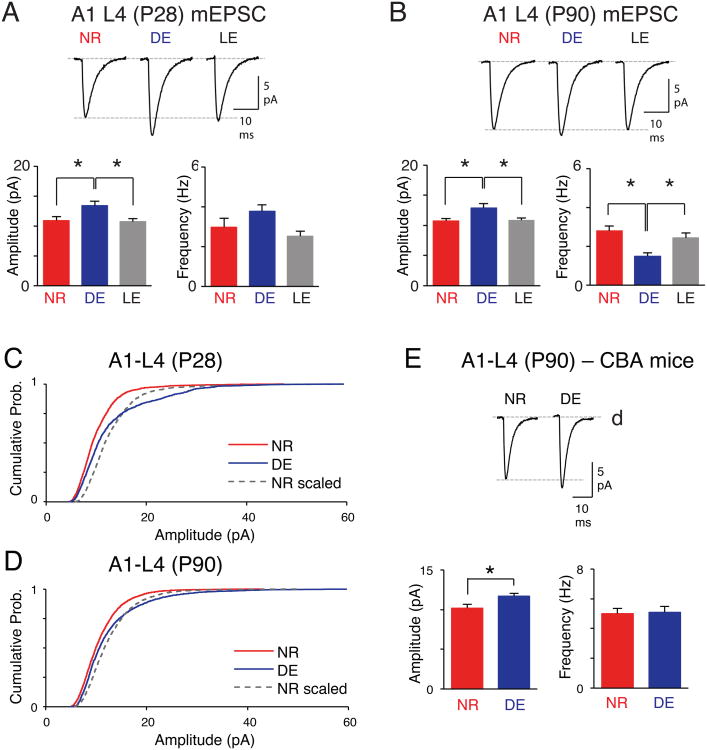
Cross-modal potentiation of TC-synapses in A1-L4 after DE was opposite in polarity to the mEPSC changes observed previously in A1-L2/3 of juvenile animals (Goel et al., 2006). We determined that the polarity of cross-modal synaptic changes is laminar-specific, because DE triggers potentiation of excitatory synapses in L4 of A1 regardless of age. In both juveniles (P28) and adults (P90), DE increased mEPSC amplitude in A1-L4, both of which recovered after LE (Fig. 4A, B). L4 changes did not occur via multiplicative scaling (Fig. 4C, D) suggesting that the change is not uniform across the sampled synapses. The most parsimonious explanation is that the change is restricted to a subset of synapses, which may include TC-synapses. The regulation of A1-L4 mEPSC amplitude by DE was not strain-specific, and was also observed in adult CBA mice (Fig. 4E). In contrast to A1, mEPSC amplitude did not change with DE in V1-L4 (Fig. S3), which is consistent with the stability of TC-synapses when within-modality sensory manipulations are performed in adults.
Figure 4.
Cross-modal potentiation of A1 L4 mEPSCs is age-independent and non-multiplicative. (A) Results from juvenile (P28) mice. DE increases the average mEPSC amplitude of A1-L4, which reverses with LE (bottom left). Top: Average mEPSC traces. Bottom right: Average mEPSC frequency. (B) Results from adult (P90) mice. In A1-L4, DE increases the mEPSC amplitude, which reverses with LE (B, bottom left). Top: Average mEPSC traces. Bottom right: Average mEPSC frequency. *P <0.05, ANOVA. See Table S2 for data. (C) DE induces a non-multiplicative increase in mEPSC amplitude of A1-L4 in young mice. The amplitudes of NR mEPSCs were multiplied by a scaling factor of 1.27 to match the average mEPSC amplitude to that of DE (Kolmogorov-Smirnov test between DE and NR scaled: P < 0.0001). (D) Non-multiplicative increase in mEPSC amplitude of A1-L4 in P90 mice with 7d-DE. Scaling factor was 1.17 (Kolmogorov-Smirnov test between DE and NR scaled: P < 0.0001). (E) DE increases the average mEPSC amplitude of A1-L4 neurons of CBA mice, which do not undergo age-related hearing loss. Left: Average mEPSC amplitude comparison. Middle: average mEPSC traces. Right: No change in the average mEPSC frequency. *P < 0.02, t-test.
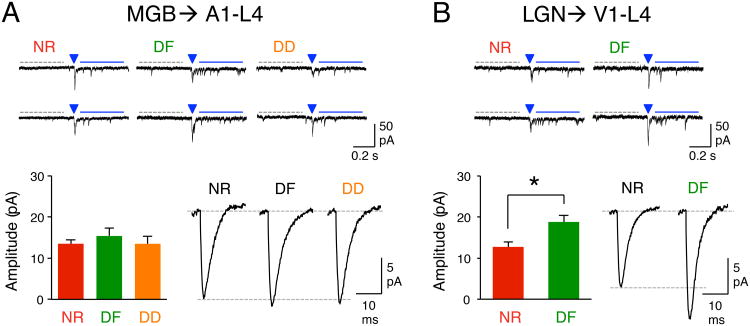
DE-induced potentiation of TC-synapses in A1-L4 without changes in V1-L4 was unexpected, because it suggests that TC-plasticity is more readily recruited across sensory modalities than within a sensory modality in adults. To determine whether the cross-modal potentiation of TC-synapses is a general feature of the adult sensory cortex, we repeated the study in mice that were deafened by ototoxic lesioning of the cochlea (see Supplemental Experimental Procedures, Fig. S4). We found that the strength of TC-synapses in L4 of A1, as measured as the amplitude of LEv-Sr2+-mEPSCs after expressing ChR2 into the MGB, did not differ between normal and deaf (DF) adult mice (Fig. 5A). In contrast, TC-synapses in L4 of V1 were significantly potentiated in adult DF mice (Fig. 5B). These results demonstrate the generality of our finding that sensory deprivation recruits TC-plasticity in other sensory cortices at an age when it does not modify TC-synapses in its respective primary sensory cortex.
Figure 5.
Cross-modal potentiation of TC-synapses is observed with deafening and is experience-dependent. (A) Regulation of TC-synapses in A1-L4. Top: Example traces of LEv-Sr2+-mEPSCs from NR, deaf (DF) and DE+DF (DD) group. A 5-ms duration LED light was delivered at the arrowhead to activate TC-synapses. Marks are the same as in Fig. 3. Bottom left: Average calculated LEv-Sr2+-mEPSC amplitude of TC-inputs (see Supplemental Experimental Procedures). Bottom right: Average raw LEv-Sr2+-mEPSC traces (without subtracting spontaneous events). (B) Cross-modal potentiation of TC-synapses in V1-L4 after deafening. Top: Example traces of LEv-Sr2+-mEPSCs. Marks are the same as in Fig. 3. Bottom left: Average calculated LEv-Sr2+-mEPSC amplitude of TC-inputs. *P < 0.008, t-test. Bottom right: Average raw LEv-Sr2+-mEPSC traces. See Table S3 for data.
We previously reported that cross-modal regulation of L2/3 synapses in barrel cortex following DE is dependent on whisker inputs without a gross change in whisking frequency (He et al., 2012). This suggests that cross-modal synaptic plasticity in L2/3 requires bottom-up sensory experience without much change in the amount of sensory drive. To determine whether cross-modal TC-potentiation is also experience-dependent, we deafened the visually deprived mice (DD). Deafening prevented the TC-potentiation associated with DE (Fig. 5A), which suggests that the cross-modal TC-potentiation requires auditory experience. However, we did not find significant difference in the auditory environment or ultrasonic vocalizations between NR and DE mice (Fig. S5), which suggests that the bottom-up sensory input is not greatly different between the two conditions.
Our results show increased responsiveness and frequency selectivity of A1 neurons due to changes at TC-synapses. These alterations may increase sound discrimination performance of neurons (Fritz et al., 2003; Kilgard et al., 2001; Polley et al., 2006). In addition to increased responsiveness, changes in the temporal pattern and reliability of responses may also improve encoding of sound features (Borst and Theunissen, 1999). Thus neuronal populations in DE animals might have increased sound discrimination performance.
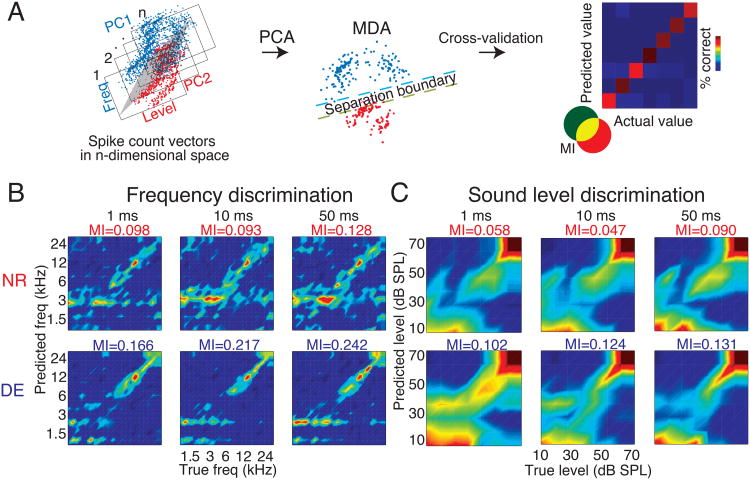
To investigate if DE improves auditory discriminability, and if temporal firing patterns contribute to these changes, we performed a multiple discriminant analysis on neurons from DE or NR animals (MDA, see Experimental Procedures) (Fig. 6A). This analysis predicts attributes of a given stimulus (in this case frequency or sound level) based on differences in the evoked spike patterns when stimulus parameters are varied (Machens et al., 2003). Separate MDA analyses were performed to test for discriminability of frequencies or sound level changes by either holding sound level or frequency constant. Given that we did not observe an increase in mean evoked firing rates, this analysis additionally tests the reliability of encoding stimulus features in the absence of an increase in responsiveness alone. The performance of this classifier was qualitatively evaluated by a confusion matrix (Fig. 6A right) that plots the known identity of the stimulus on the x–axis and the model-predicted identity of the stimulus on the y–axis, with perfect classification performance indicated by the diagonal and erroneous assignments made offset from the diagonal. We evaluated the classifier at 3 different levels of temporal precision as derived from a binless method (see Supplemental Experimental Procedures, size of sliding window = 1, 10 and 50 ms) to identify the timescale at which changes occur. DE units showed a stronger diagonal bias in the confusion matrices than NR units, indicating a qualitative increase in discrimination performance for both frequency (Fig. 6B) and sound level (Fig. 6C).
Figure 6.
Schematic of MDA approach (A) A principal components analysis was performed on the spike count vectors forming the feature space obtained for each unit at each of the frequency-level combinations for n stimulus repetitions. The red and blue data are shown here projected along the first two principal components with a separation boundary between spike count vectors that are dissimilar to each other. In this case, the MDA estimates the probability with which each element of the stimulus matrix (21 frequencies × 7 levels) was assigned to the correct value based on the similarity between the observed responses to multiple repeats of the same stimulus. The centroid of each repeat was calculated and every subsequent repeat was compared to the previous (random) repeat of the stimulus. Given that each population of spike counts from multiple sets of neuronal responses had that many degrees of freedom, we reduced the dimensionality to the first 10 principal components, which accounted for ≥50% of the variance in the samples. Adjusted spike counts were calculated by subtracting the spontaneous rates and z-scored prior to classification, to determine the reliability of responses over and above a simple increase in responsiveness alone. The performance of this classifier was evaluated by generating a confusion matrix that plots the known value of the stimulus on the x–axis and the model-predicted identity of the stimulus on the y–axis, with perfect classification performance indicated by the 45° diagonal and erroneous assignments made away from the diagonal. The mutual information (MI) between the true value of the stimulus and the predicted value was estimated to quantify how well the neurons encode different stimulus features (frequencies and levels). (B) DE increases frequency discrimination of A1 neurons. Confusion matrices for NR (upper panel) and DE (lower panel) showing model-predicted frequency for each known frequency value. Each column represents discrimination performance at 3 different temporal resolutions (1, 10 and 50 ms, shown on top of each column). Color scale indicates proportion of classifications and diagonal alignment indicates near-perfect classification performance (identical for all plots). The bias-corrected MI is indicated at the top of each figure. The most number of correct frequency assignments appeared to be made by the classifier closer to the groups' overall CFs. (C) DE increases level discrimination of A1 neurons. Confusion matrices for sound-level-based classification, for NR (upper panel) and DE (lower panel). DE increased MI uniformly for both aspects of stimuli. The discriminability approaches saturation in performance beyond 60 dB SPL.
To quantify the degree of commonality between the true and model-predicted assignments, and to provide an estimate of the reliability of stimulus encoding, we calculated the mutual information (MI) for each confusion matrix (Supplemental Experimental Procedures, Equation 2). By comparing the observed differences in MI to those obtained after randomly reassigning the stimulus labels multiple times (‘chance’ distribution; see Supplemental Experimental Procedures), we observed increases in both frequency- and level-related MI (frequency; range of MI increase with DE = 0.068 to 0.124 bits; one-tailed P values = 0.0001 to 0.003, level; 0.041 to 0.083 bits, P = 0.00001 to 0.0005). Consistent with the increased MI, we observed decreased global mean absolute classification errors for the model in DE units for both frequency and level, which could also contribute to enhanced auditory function in DE animals (frequency; range of decrease in error magnitude = 0.47 to 0.987 kHz, one-tailed P values = 0.003 to 0.01; level; 1.01 to 1.99 dB SPL, P values = 10-12 to 0.0008).
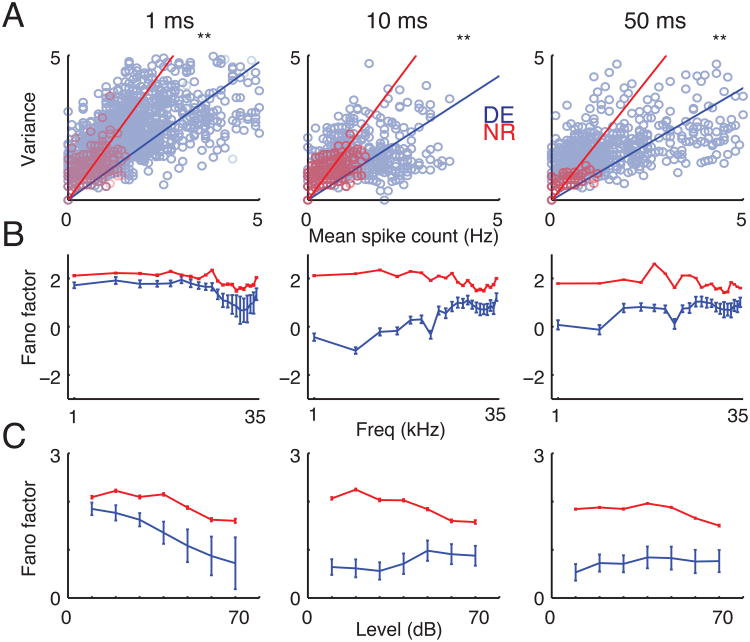
The temporal pattern of neuronal responses to stimuli is characterized by inherent variability, the reduction of which increases the efficiency of stimulus encoding (Tolhurst et al., 1983). Plotting the variance as function of spike rate revealed a reduced variance for DE neurons at temporal resolutions of 1, 10 and 50 ms (Fig. 7A). To next quantify cross-modal changes in the efficiency of neuronal encoding, we calculated the Fano Factor, which is the ratio of variance and mean spike counts. The Fano Factor was globally reduced (Fig. 7B, C), generally implying a decrease in trial-to-trial variability overall and for both aspects of stimuli, thus signifying an increase in encoding precision.
Figure 7.
(A) Variance of spike counts as function of mean spike counts at 3 different temporal resolutions. The ratio of variance and mean spike counts (Fano Factor; shown as slope of regression fit) is decreased after DE consistent with MI comparisons. (B, C) Fano Factor (ratio of variance and mean spike counts) at 3 different temporal resolutions. Consistent with MI comparisons, FF showed a significant overall decrease after DE when compared separately for frequencies (B) and sound levels (C) (P <0.05; t-test). Plotted are means ± s.d.
Discussion
Here we demonstrate that TC-inputs to A1, which do not modify with deafening, do potentiate following visual deprivation in adults. This, together with visual deprivation-induced cross-modal facilitation of LTP at L4 to L2/3 synapses in somatosensory barrel cortex (S1BF) (Jitsuki et al., 2011), suggests an enhancement of feed-forward sensory processing in the spared senses. Recent studies highlight some degree of TC-plasticity in adult cortices (Cooke and Bear, 2010; Heynen and Bear, 2001; Montey and Quinlan, 2011; Oberlaender et al., 2012; Yu et al., 2012). We propose that TC-plasticity is more effectively recruited across sensory modalities than within a sensory modality, which may serve as a substrate for sensory compensation throughout life. Furthermore, cross-modal TC-plasticity is likely universal across sensory systems, because we find that deafening also results in TC-potentiation in L4 of V1 in adult mice.
The novelty of our study is that TC-plasticity is recruited in adult primary sensory cortex across sensory modality when it is not expressed within a sensory modality. Furthermore, we suggest that the cross-modal recruitment of TC-plasticity in A1 may underlie the observed improvement in auditory processing with vision loss. It is known that experience-dependent TC-plasticity in primary sensory cortices is mainly restricted during an early developmental phase (Barkat et al., 2011; Crair and Malenka, 1995; Fox, 2002), which corresponds to the pre-critical period. Recently, studies have highlighted that there is some degree of plasticity at the TC inputs in adults within a sensory modality with manipulations such as nerve transection (Yu et al., 2012) or sensory deprivation (Montey and Quinlan, 2011; Oberlaender et al., 2012). Here we show that sensory deprivation in one modality can potentiate TC-inputs across sensory modalities, which supports the growing body of evidence that TC-plasticity can be effectively recruited in adults. Blind individuals show perceptual enhancement of hearing in aspects such as improved sound localization (Lessard et al., 1998; Voss et al., 2004), pitch discrimination (Gougoux et al., 2004), and spatial tuning characteristics (Röder et al., 1999). Our results show sharper tuning curves and lower activation thresholds in neurons at the thalamorecipient layer of A1, due to the observed strengthening of feed-forward inputs. Cross-modal potentiation of TC-inputs to A1 is experience-dependent, as it required intact hearing. Because there was no significant difference in the auditory environment and vocalizations between normal and visually deprived groups, we surmise that there might be cortical and/or subcortical adjustments that allow auditory inputs to more effectively potentiate TC synapses after losing vision. Moreover, since deafening prevented the DE induced plasticity, we have shown that auditory experience is required for this plasticity to occur. The observed potentially beneficial changes in A1 TC-inputs and auditory processing could account for enhanced auditory performance in blind individuals. Moreover, since DE was able to rapidly induce changes in TC recipient neurons in adults and improve auditory processing, multisensory training paradigms may benefit individuals with central processing deficits: e.g. auditory processing disorders. Overall our results here demonstrate rapid and robust cross-modal changes in functional attributes of primary sensory cortices following the loss of a sensory modality.
Experimental Procedures
Rearing conditions
Control mice were raised in 12-hr lit/12-hr dark cycles (NR). Experimental animals were dark-exposed for 7 days. Ambient sound and vocalizations were both measured using ultrasonic recording instruments.
Channelrhodopsin-2 (ChR2) viral transfection
At P21, mice were transcranially injected with adeno-associated virus containing channelrhodopsin-2 and yellow fluorescence protein as a marker.
Induction of deafness
After induction of anesthesia using isoflurane vapors, an endaural approach was performed following which 50 μl of kanamycin solution was instilled on the round window. Deafening was confirmed by absence of acoustic startle and histological observation of hair cell loss using phalloidin staining (Fig. S4).
In vivo recordings
After induction and maintenance of anesthesia using isoflurane, a craniotomy was performed using standard landmarks over the A1. A digitally-controlled micromanipulator was used to lower 16-channel single-shank silicon probes orthogonally to the cortical surface. Computer-generated pure-tone stimuli were presented in a pseudo-random fashion. The stimuli traversed 21 log-spaced pure tones (40 ms duration, 1-35 kHz) presented at 10 dB steps from 10-70 dB SPL. Spike sorting was carried out using standard model of unsupervised clustering. Significant neuronal responses were identified using a binless algorithm, following which the mean- and peak-evoked rates were calculated and compared between the two groups (NR and DE). In addition, we also compared spontaneous activity, the latency of first spikes, slopes of rate-level functions and frequency response area (FRA) characteristics. A multiple discriminant analysis was used to classify neural responses to individual stimuli and assign response patterns to each stimulus according to their frequency or intensity. The relationship between the predicted and predictor variables was graphically examined using confusion matrices and the mutual information calculated.
Cortical slice preparation
Brain blocks containing primary visual and auditory cortices were dissected and coronally sectioned into 300 μm thick slices using a microslicer.
Light-evoked Sr2+-mEPSCs
Slices were transferred to a submersion-type recording chamber mounted on the fixed stage of an upright microscope with oblique infrared (IR) illumination. ChR2 was activated using a 455-nm light emitting diode (LED) illuminated through a 40× objective lens, and controlled by a digital stimulator. Cells were held at -80 mV and recorded for a minimum of 10 minutes; event analysis was performed using mini analysis software. Data was acquired every 10 seconds for a duration of 1200 ms.
Recording of mEPSCs
AMPA receptor-mediated miniature excitatory postsynaptic currents were isolated pharmacologically with 1 μM tetrodotoxin (TTX), 20 μM bicuculline, and 100 μM DL-2-amino-5 phosphonopentanoic acid (DL-APV). Biocytin (1 mg/ml) was included in the internal solution to confirm morphology and location of recorded cells. Cells were held at -80mV and the recorded mEPSC data was digitized at 10 kHz by a data acquisition board and acquired through custom software. Acquired mEPSCs were analyzed with a detection threshold set at 3 times the root mean square (RMS) noise level.
Biocytin processing
300 μm thick cortical slices were fixed in 4% paraformaldehyde overnight at 4°C. Slices were then incubated in avidin-AlexaFluor 633 conjugate diluted 1:2000 in 1% Triton X-100/0.1 M PB overnight at 4°C in the dark. Slides were cover-slipped with mounting media and sealed with nail polish. Images were taken using a confocal microscope.
For complete details, please refer to Supplemental Experimental Procedures.
Supplementary Material
Highlights.
Visual deprivation improves frequency selectivity of A1 neurons
Visual deprivation improves sound discrimination performance by A1 neurons
Visual deprivation strengthens thalamocortical synapses in A1, but not in V1
Cross-modal changes are more effectively recruited than unimodal changes in the adult cortex
Acknowledgments
Supported by R21NS070645 & RO1EY022720 (P.O.K. & H.-K.L.) and F31-NS079058 (to E.P.). The authors wish to thank Drs. Daniel E. Winkowski and Paul V. Watkins for technical assistance, Nicholas Gammon, Ryan Patterson and Maximillian Lee for processing biocytin-filled neurons, Krystyna Orzechowski for vocalization recordings, and Dr. Alfredo Kirkwood for helpful discussions. P.O.K. and H.-K.L conceived and designed the study and oversaw the project. A.I., E.P., P.O.K., and H.-K.L. wrote the manuscript, A.P.J. and A.I. conducted in vivo experiments under guidance from P.O.K; A.P.J. performed spike sorting and A.I. analyzed in vivo data; E.P. performed in vitro recordings and analyzed the data with the help of H.-K.L.; E.P., H.W., and D.L. did in vivo viral injections; D.L. processed cochlear immunohistochemical staining; E.P. ran auditory startle experiments, which were analyzed “blind” by D.L.; A.I. analyzed the vocalization data. The authors declare no conflicts of interest. All experiments were approved by the Institutional Animal Care and Use Committees (IACUCs) of Johns Hopkins University and University of Maryland and followed the guidelines of the Animal Welfare Act.
Footnotes
Publisher's Disclaimer: This is a PDF file of an unedited manuscript that has been accepted for publication. As a service to our customers we are providing this early version of the manuscript. The manuscript will undergo copyediting, typesetting, and review of the resulting proof before it is published in its final citable form. Please note that during the production process errors may be discovered which could affect the content, and all legal disclaimers that apply to the journal pertain.
References
- Barkat TR, Polley DB, Hensch TK. A critical period for auditory thalamocortical connectivity. Nat Neurosci. 2011;14:1189–1194. doi: 10.1038/nn.2882. [DOI] [PMC free article] [PubMed] [Google Scholar]
- Borst A, Theunissen FE. Information theory and neural coding. Nat Neurosci. 1999;2:947–958. doi: 10.1038/14731. [DOI] [PubMed] [Google Scholar]
- Cooke SF, Bear MF. Visual experience induces long-term potentiation in the primary visual cortex. J Neurosci. 2010;30:16304–16313. doi: 10.1523/JNEUROSCI.4333-10.2010. [DOI] [PMC free article] [PubMed] [Google Scholar]
- Crair MC, Malenka RC. A critical period for long-term potentiation at thalamocortical synapses. Nature. 1995;375:325–328. doi: 10.1038/375325a0. [DOI] [PubMed] [Google Scholar]
- de Villers-Sidani E, Chang EF, Bao S, Merzenich MM. Critical period window for spectral tuning defined in the primary auditory cortex (A1) in the rat. J Neurosci. 2007;27:180–189. doi: 10.1523/JNEUROSCI.3227-06.2007. [DOI] [PMC free article] [PubMed] [Google Scholar]
- Desai NS, Cudmore RH, Nelson SB, Turrigiano GG. Critical periods for experience-dependent synaptic scaling in visual cortex. Nat Neurosci. 2002;5:783–789. doi: 10.1038/nn878. [DOI] [PubMed] [Google Scholar]
- Fox K. Anatomical pathways and molecular mechanisms for plasticity in the barrel cortex. Neuroscience. 2002;111:799–814. doi: 10.1016/s0306-4522(02)00027-1. [DOI] [PubMed] [Google Scholar]
- Fritz J, Shamma S, Elhilali M, Klein D. Rapid task-related plasticity of spectrotemporal receptive fields in primary auditory cortex. Nat Neurosci. 2003;6:1216–1223. doi: 10.1038/nn1141. [DOI] [PubMed] [Google Scholar]
- Gil Z, Connors BW, Amitai Y. Efficacy of thalamocortical and intracortical synaptic connections: quanta, innervation, and reliability. Neuron. 1999;23:385–397. doi: 10.1016/s0896-6273(00)80788-6. [DOI] [PubMed] [Google Scholar]
- Goel A, Jiang B, Xu LW, Song L, Kirkwood A, Lee HK. Cross-modal regulation of synaptic AMPA receptors in primary sensory cortices by visual experience. Nat Neurosci. 2006;9:1001–1003. doi: 10.1038/nn1725. [DOI] [PMC free article] [PubMed] [Google Scholar]
- Gougoux F, Lepore F, Lassonde M, Voss P, Zatorre RJ, Belin P. Neuropsychology: pitch discrimination in the early blind. Nature. 2004;430:309–309. doi: 10.1038/430309a. [DOI] [PubMed] [Google Scholar]
- Harris JD. Pitch discrimination. J Acoust Soc Am. 1952;24:750–755. [Google Scholar]
- He K, Petrus E, Gammon N, Lee HK. Distinct Sensory Requirements for Unimodal and Cross-Modal Homeostatic Synaptic Plasticity. J Neurosci. 2012;32:8469–8474. doi: 10.1523/JNEUROSCI.1424-12.2012. [DOI] [PMC free article] [PubMed] [Google Scholar]
- Hensch TK. Critical period plasticity in local cortical circuits. Nat Rev Neurosci. 2005;6:877–888. doi: 10.1038/nrn1787. [DOI] [PubMed] [Google Scholar]
- Heynen AJ, Bear MF. Long-term potentiation of thalamocortical transmission in the adult visual cortex in vivo. J Neurosci. 2001;21:9801–9813. doi: 10.1523/JNEUROSCI.21-24-09801.2001. [DOI] [PMC free article] [PubMed] [Google Scholar]
- Insanally MN, Köver H, Kim H, Bao S. Feature-dependent sensitive periods in the development of complex sound representation. J Neurosci. 2009;29:5456–5462. doi: 10.1523/JNEUROSCI.5311-08.2009. [DOI] [PMC free article] [PubMed] [Google Scholar]
- Jenkins WM, Merzenich MM. Role of cat primary auditory cortex for sound-localization behavior. J Neurophysiol. 1984;52:819–847. doi: 10.1152/jn.1984.52.5.819. [DOI] [PubMed] [Google Scholar]
- Jiang B, Trevino M, Kirkwood A. Sequential development of long-term potentiation and depression in different layers of the mouse visual cortex. J Neurosci. 2007;27:9648–9652. doi: 10.1523/JNEUROSCI.2655-07.2007. [DOI] [PMC free article] [PubMed] [Google Scholar]
- Jitsuki S, Takemoto K, Kawasaki T, Tada H, Takahashi A, Becamel C, Sano A, Yuzaki M, Zukin RS, Ziff EB, et al. Serotonin mediates cross-modal reorganization of cortical circuits. Neuron. 2011;69:780–792. doi: 10.1016/j.neuron.2011.01.016. [DOI] [PMC free article] [PubMed] [Google Scholar]
- Katz LC, Crowley JC. Development of cortical circuits: lessons from ocular dominance columns. Nat Rev Neurosci. 2002;3:34–42. doi: 10.1038/nrn703. [DOI] [PubMed] [Google Scholar]
- Kilgard MP, Pandya PK, Vazquez J, Gehi A, Schreiner CE, Merzenich MM. Sensory input directs spatial and temporal plasticity in primary auditory cortex. J Neurophysiol. 2001;86:326–338. doi: 10.1152/jn.2001.86.1.326. [DOI] [PubMed] [Google Scholar]
- Lessard N, Pare M, Lepore F, Lassonde M. Early-blind human subjects localize sound sources better than sighted subjects. Nature. 1998;395:278–280. doi: 10.1038/26228. [DOI] [PubMed] [Google Scholar]
- Machens CK, Schütze H, Franz A, Kolesnikova O, Stemmler MB, Ronacher B, Herz AV. Single auditory neurons rapidly discriminate conspecific communication signals. Nat Neurosci. 2003;6:341–342. doi: 10.1038/nn1036. [DOI] [PubMed] [Google Scholar]
- Middlebrooks JC, Green DM. Sound localization by human listeners. Annu Rev Psychol. 1991;42:135–159. doi: 10.1146/annurev.ps.42.020191.001031. [DOI] [PubMed] [Google Scholar]
- Montey KL, Quinlan EM. Recovery from chronic monocular deprivation following reactivation of thalamocortical plasticity by dark exposure. Nat Commun. 2011;2:317. doi: 10.1038/ncomms1312. [DOI] [PMC free article] [PubMed] [Google Scholar]
- Oberlaender M, Ramirez A, Bruno RM. Sensory experience restructures thalamocortical axons during adulthood. Neuron. 2012;74:648–655. doi: 10.1016/j.neuron.2012.03.022. [DOI] [PMC free article] [PubMed] [Google Scholar]
- Polley DB, Steinberg EE, Merzenich MM. Perceptual learning directs auditory cortical map reorganization through top-down influences. J Neurosci. 2006;26:4970–4982. doi: 10.1523/JNEUROSCI.3771-05.2006. [DOI] [PMC free article] [PubMed] [Google Scholar]
- Rayleigh L. XII. On our perception of sound direction. Philos Mag. 1907;13:214–232. [Google Scholar]
- Röder B, Teder-Sälejärvi W, Sterr A, Rösler F, Hillyard SA, Neville HJ. Improved auditory spatial tuning in blind humans. Nature. 1999;400:162–165. doi: 10.1038/22106. [DOI] [PubMed] [Google Scholar]
- Sanes DH, Bao S. Tuning up the developing auditory CNS. Curr Opin Neurobiol. 2009;19:188. doi: 10.1016/j.conb.2009.05.014. [DOI] [PMC free article] [PubMed] [Google Scholar]
- Tolhurst D, Movshon JA, Dean A. The statistical reliability of signals in single neurons in cat and monkey visual cortex. Vision Res. 1983;23:775–785. doi: 10.1016/0042-6989(83)90200-6. [DOI] [PubMed] [Google Scholar]
- Victor JD. Binless strategies for estimation of information from neural data. Phys Rev E Stat Nonlin Soft Matter Phys. 2002;66:051903. doi: 10.1103/PhysRevE.66.051903. [DOI] [PubMed] [Google Scholar]
- Voss P, Lassonde M, Gougoux F, Fortin M, Guillemot JP, Lepore F. Early-and late-onset blind individuals show supra-normal auditory abilities in far-space. Curr Biol. 2004;14:1734–1738. doi: 10.1016/j.cub.2004.09.051. [DOI] [PubMed] [Google Scholar]
- Whitt JL, Petrus E, Lee HK. Experience-dependent homeostatic synaptic plasticity in neocortex. Neuropharmacol. 2013 doi: 10.1016/j.neuropharm.2013.02.016. http://dx.doi.org/10.1016/j.neuropharm.2013.02.016. [DOI] [PMC free article] [PubMed]
- Wier CC, Jesteadt W, Green DM. Frequency discrimination as a function of frequency and sensation level. J Acoust Soc Am. 1977;61:178. doi: 10.1121/1.381251. [DOI] [PubMed] [Google Scholar]
- Yu X, Chung S, Chen DY, Wang S, Dodd SJ, Walters JR, Isaac JT, Koretsky AP. Thalamocortical inputs show post-critical-period plasticity. Neuron. 2012;74:731–742. doi: 10.1016/j.neuron.2012.04.024. [DOI] [PMC free article] [PubMed] [Google Scholar]
- Zatorre RJ, Belin P, Penhune VB. Structure and function of auditory cortex: music and speech. Trends Cogn Sci. 2002;6:37–46. doi: 10.1016/s1364-6613(00)01816-7. [DOI] [PubMed] [Google Scholar]
Associated Data
This section collects any data citations, data availability statements, or supplementary materials included in this article.


