

Abstract
The extracellular signal‐regulated kinase (ERK) signaling pathway controls cell proliferation and differentiation in metazoans. Two hallmarks of its dynamics are adaptation of ERK phosphorylation, which has been linked to negative feedback, and nucleocytoplasmic shuttling, which allows active ERK to phosphorylate protein substrates in the nucleus and cytosol. To integrate these complex features, we acquired quantitative biochemical and live‐cell microscopy data to reconcile phosphorylation, localization, and activity states of ERK. While maximal growth factor stimulation elicits transient ERK phosphorylation and nuclear translocation responses, ERK activities available to phosphorylate substrates in the cytosol and nuclei show relatively little or no adaptation. Free ERK activity in the nucleus temporally lags the peak in nuclear translocation, indicating a slow process. Additional experiments, guided by kinetic modeling, show that this process is consistent with ERK's modification of and release from nuclear substrate anchors. Thus, adaptation of whole‐cell ERK phosphorylation is a by‐product of transient protection from phosphatases. Consistent with this interpretation, predictions concerning the dose‐dependence of the pathway response and its interruption by inhibition of MEK were experimentally confirmed.
Keywords: growth factor receptors, mathematical model, mitogen‐activated protein kinases, negative feedback, nucleocytoplasmic shuttling
Introduction
Signal transduction networks mediate diverse cellular processes by modulating the cell's gene‐regulatory and cytoskeletal systems. In the signaling networks accessed by growth factor and cytokine receptors, the extracellular signal‐regulated kinase (ERK) pathway is a principal mode of controlling cell proliferation and other responses, and its aberrant activation contributes to uncontrolled proliferation in the majority of human cancers (Dhillon et al, 2007; Roberts & Der, 2007). ERK1 and ERK2 are among the mammalian mitogen‐activated protein kinases (MAPKs), which are canonically activated in a three‐tiered protein kinase cascade. Upstream of the cascade, cell surface receptors orchestrate signaling through small GTPases, which mediate phosphorylation and activation of Raf‐family kinases. In the cascade, enzymatically active Raf proteins phosphorylate and activate MEK1 and MEK2, dual specificity kinases that in turn phosphorylate ERK1 and ERK2 on threonine and tyrosine residues of their homologous TEY motif; only diphosphorylated ERK has elevated kinase activity (Anderson et al, 1990). The linear, sequential simplicity of the Raf → MEK → ERK cascade as a pathway motif belies a rich complexity in the regulation of ERK signaling, which has largely emerged from quantitative studies combining experimental measurements and kinetic modeling (Bhalla et al, 2002; Schoeberl et al, 2002; Sasagawa et al, 2005; Fujioka et al, 2006; Birtwistle et al, 2007; Chen et al, 2009; Schilling et al, 2009; Wang et al, 2009; Cirit et al, 2010; Cirit & Haugh, 2012). One important mode of regulation is adaptation of the pathway by ERK‐dependent negative feedback, which desensitizes the activity of Raf and/or other upstream components (McKay & Morrison, 2007). Thus, growth factor‐stimulated activation of the ERK pathway is typically transient. The kinetics of ERK activation and adaptation have been quantitatively characterized (Cirit et al, 2010; Sturm et al, 2010; Fritsche‐Guenther et al, 2011) and have proven to be important for proliferation and cell‐fate decisions (Marshall, 1995; von Kriegsheim et al, 2009; Chung et al, 2010; Albeck et al, 2013).
Another complex facet of ERK regulation is its subcellular compartmentalization. Active ERK phosphorylates more than 150 protein substrates, with roughly equal numbers in the cytosol and nucleus (Yoon & Seger, 2006). Thus, nucleocytoplasmic shuttling is an important determinant of ERK function. In quiescent cells, ERK is predominantly localized in the cytoplasm; once fully phosphorylated by MEK, ERK is released from cytoplasmic scaffold proteins and rapidly translocates to the nucleus (Horgan & Stork, 2003; Burack & Shaw, 2005; Costa et al, 2006; Lidke et al, 2010; Marchi et al, 2010; Zehorai et al, 2010). Both passive and energy‐dependent mechanisms of ERK nuclear translocation have been proposed, with the latter mediated by the shuttling protein Importin‐7 and nuclear Ran (Plotnikov et al, 2011). While in the nucleus, active ERK modifies substrates and is dephosphorylated and/or exported to the cytoplasm to complete the cycle; evidence suggests that nuclear ERK is exported rapidly, irrespective of its phosphorylation state (Horgan & Stork, 2003). In live‐cell fluorescence microscopy experiments, nuclear localization of ERK typically exhibits a transient peak, sustained oscillations, or damped oscillations with time (Costa et al, 2006; Sato et al, 2007; Cohen‐Saidon et al, 2009; Shankaran et al, 2009); these kinetics are cell‐ and stimulus‐specific (Shankaran et al, 2009; Weber et al, 2010) and have been linked to the aforementioned negative feedback regulation of the pathway. Yet, with a couple of notable exceptions (Fujioka et al, 2006; Shankaran et al, 2009), kinetic models describing both adaptation and compartmentalization of ERK signaling have not been considered. The implicit assumption, which if valid would obviate the need for such integration, is that nuclear localization of ERK mirrors the kinetics of ERK activation in the cytosol. Taken a step farther, the often‐unstated assumption is that whole‐cell phosphorylation and nuclear translocation of ERK mirror the kinase activity of ERK in both compartments.
In this study, we combine single‐cell ERK localization and activity measurements to demonstrate that this assumption is not justified in general. In fibroblasts stimulated with a high dose of platelet‐derived growth factor (PDGF), nuclear translocation of ERK exhibits the typical transient kinetics, whereas neither active ERK in the cytosol nor in the nucleus show dramatic adaptation during the same period of observation. Strikingly, the accumulation of free, active ERK in the nucleus temporally lags its overall nuclear translocation. These data, together with whole‐cell biochemical measurements, are reconciled by a mathematical model accounting for interactions between ERK and its substrates in the cytosol and nucleus. The interpretation is that phosphorylation of those substrates by ERK, and not feedback adaptation, accounts for the dramatic overshoot of ERK phosphorylation and nuclear localization. The model yields qualitative predictions regarding the pathway kinetics under various stimulation and inhibition conditions, which we tested and confirmed experimentally. There are ample indications in the literature that interactions with substrates can control localization of ERK (Caunt & McArdle, 2010; Lidke et al, 2010) and its available kinase activity (Tanoue et al, 2000; Bardwell et al, 2003; Kim et al, 2011a,b). This work implicates how those interactions manifest in the temporal dynamics of ERK signaling in mammalian cells, and it sheds new light on the role of negative feedback in shaping input‐output relationships when nucleocytoplasmic shuttling is involved.
Results
Growth factor‐stimulated phosphorylation and nuclear translocation of ERK show dramatic adaptation, whereas the kinase activities of ERK in the cytosol and nucleus do not
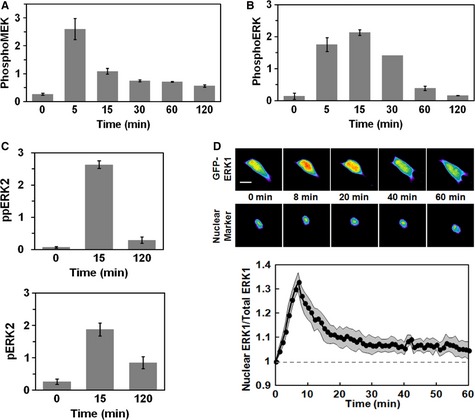
As outlined in the Introduction section, a host of published studies have reported on the kinetics of growth factor‐stimulated ERK phosphorylation and nucleocytoplasmic shuttling. The consensus finding is that these hallmarks of ERK activation exhibit adaptation within the first hour of stimulation, with a peak magnitude that is much greater than the quasi‐steady, plateau level achieved later on. Accordingly, in mouse fibroblasts stimulated with 1 nM PDGF, quantitative immunoblotting using phospho‐specific antibodies revealed MEK and ERK phosphorylation time courses with high degrees of adaptation (Fig 1A and B and Supplementary Fig S1). Even with the limited temporal resolution of these measurements, phosphorylation of MEK clearly peaks earlier than that of ERK. ERK phosphorylation decays more slowly and adapts almost completely within 1–2 h (Fig 1B). These findings were corroborated by label‐free quantitative mass spectrometry, showing near‐complete adaptation in the amount of diphosphorylated ERK2 pTEpY peptide (Fig 1C, top). By comparison, the amount of mono‐phosphorylated ERK2 pTEY peptide exhibited more subtle adaptation (Fig 1C, bottom), and the mono‐phosphorylated ERK2 TEpY peptide showed even less (Supplementary Fig S2, which also shows similar phosphorylation kinetics for ERK1 and ERK2). Consistent with the notion that the active form of ERK adapts, individual cells expressing a GFP‐ERK1 fusion construct (Shankaran et al, 2009) showed transient nuclear translocation responses to PDGF stimulation, reaching a peak value within 10 min followed by a dramatic decay (Fig 1D). At least on a qualitative basis, such data do little to challenge the aforementioned assumption that nuclear translocation of ERK tracks its phosphorylation and enzymatic activity, an interpretation supported by photobleaching measurements demonstrating rapid nucleocytoplasmic exchange of ERK (Burack & Shaw, 2005).
Figure 1. Transient phosphorylation and nuclear localization of ERK.
-
A, BNIH 3T3 cells were stimulated with 1 nM PDGF, and phosphorylation of MEK1/2 [(A); adapted from (Cirit et al, 2010)] and ERK1/2 (B) were assessed by quantitative immunoblotting along with total ERK1/2 as a loading control. Values are reported as mean ± s.e.m. in arbitrary units (n ≥ 3).
-
CLabel‐free quantitative mass spectrometry results show relative amounts of diphosphorylated ERK2 (pTEpY, top) and mono‐phosphorylated ERK2 (pTEY, bottom) in NIH 3T3 cells stimulated maximally with PDGF for the indicated times. Values are reported as mean ± s.e.m. (n = 3).
-
DNIH 3T3 cells expressing GFP‐ERK1 were monitored by epifluorescence microscopy during maximal PDGF stimulation. The pseudocolor montage shows redistribution of fluorescence in a representative cell (scale bar, 20 μm). Nuclei were labeled using a genetically encoded nuclear marker. Mean nuclear localization of ERK1, normalized by its initial value, is plotted as a function of time (solid line; n = 10); the gray region reports the 95% confidence interval.
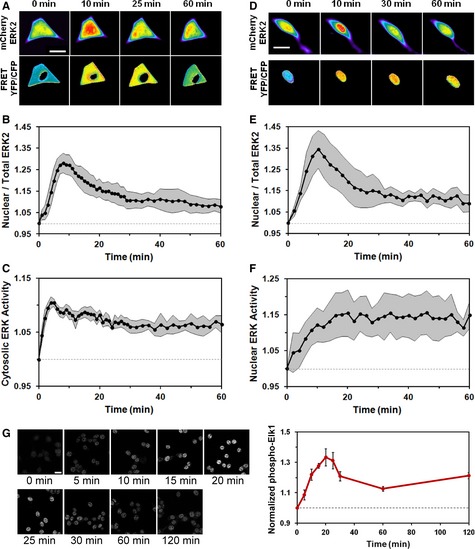
To more critically test the relationship between nuclear localization and kinase activity of ERK, we employed a live‐cell imaging strategy with cells co‐expressing a Förster resonance energy transfer (FRET)‐based ERK kinase activity reporter (EKAR) construct (Harvey et al, 2008) and an mCherry‐ERK2 fusion (Fig 2). The EKAR biosensor contains a phospho‐binding (WW) domain, a substrate sequence corresponding to Cdc25C Thr48, and a docking site for ERK FXF (DEF) motif, flanked by the FRET pair Cerulean and Venus. The specificity of this biosensor for the ERK pathway in our cells was confirmed using inhibitors of MEK (U0126) (Duncia et al, 1998) and ERK (Hancock et al, 2005), which completely blocked the response to PDGF (Supplementary Fig S3). To assess localized ERK activity we used both cytosolic and nuclear EKAR probes (Harvey et al, 2008), each in tandem with mCherry‐ERK2 in the same cells (Fig 2A–C and D–F, respectively; Supplementary Fig S4 shows quantification for the individual cells). In both cases, the kinetics of PDGF‐stimulated mCherry‐ERK2 nuclear localization showed a transient, adaptive response, consistent with the kinetics seen in cells expressing GFP‐ERK1 (Fig 2B and E; compare to Fig 1D).
Figure 2. Growth factor‐stimulated ERK kinase activities in the cytosol and nucleus are kinetically ordered and do not show dramatic adaptation.
-
A–CNIH 3T3 cells co‐expressing mCherry‐ERK2 and cytosolic ERK kinase activity reporter (EKAR) were observed by epifluorescence microscopy during maximal PDGF stimulation. The pseudocolor montage (A) shows representative image data for this experiment (scale bar = 20 μm). Mean time courses of ERK2 nuclear localization (B) and cytosolic ERK activity (C) were measured in tandem (mean ± 95% confidence interval, n = 8).
-
D–FNIH 3T3 cells co‐expressing mCherry‐ERK2 and nuclear EKAR were observed by epifluorescence microscopy during maximal PDGF stimulation. The pseudocolor montage (D) shows representative image data for this experiment (scale bar = 20 μm). Time courses of nuclear localization (E) and nuclear ERK activity (F) were measured in tandem (mean ± 95% confidence interval, n = 6).
-
GMontage of a representative cell shows immunofluorescence staining of phosphorylated Elk‐1, an endogenous substrate of ERK in the nucleus, upon maximal PDGF stimulation (scale bar = 20 m). The plot shows the time course of phosphorylated, nuclear Elk‐1 (note that the time axis is expanded relative to E&F). Values were normalized by the initial value and are reported as mean ± s.e.m. (n = 3).
In stark contrast with ERK nuclear translocation kinetics, neither the ERK activity in the cytosol nor in the nucleus showed more than modest adaptation as reported by EKAR FRET (Fig 2C and F). The average cytosolic EKAR response peaked rapidly (4–5 min after stimulation) and decayed by only about one‐third of its peak value above basal thereafter (Fig 2C). Even more distinct was the nuclear EKAR response, which showed relatively slow accumulation over a period of approximately 20 min and little or no adaptation (Fig 2F); qualitatively similar kinetics for nuclear EKAR, in relation to the nuclear translocation of ERK2, were elicited by stimulation with another growth factor, FGF‐2 (Supplementary Fig S5). To validate this approach we used immunofluorescence staining to assess PDGF‐stimulated phosphorylation of an endogenous substrate of ERK in the nucleus, Elk‐1. Consistent with the nuclear EKAR response, mean Elk‐1 phosphorylation in nuclei peaked after roughly 20 min; thereafter, there was only a subtle dip in the phosphorylation level (Fig 2G). Phosphorylation of a cytosolic ERK substrate, MEK1 Thr292 (Gardner et al, 1994; Xu et al, 1999), was also evaluated. As expected, this readout showed a rapid response and little adaptation within the first 60 min of PDGF stimulation (Supplementary Fig S6).
The rate‐controlling process affecting ERK dynamics is linked to the availability of free, active ERK in the nucleus
The apparently disparate kinetics of ERK catalytic activity as compared with ERK phosphorylation and nuclear translocation suggest the influence of a relatively slow process governing the accumulation of nuclear EKAR FRET, which occurs in concert with adaptation of ERK nuclear localization. One plausible explanation is that nuclear EKAR is dephosphorylated slowly, in which case its response would not track an earlier peak in nuclear ERK activity, if one were present. In theory, if the affinity of the intramolecular interaction enabling FRET in the phosphorylated EKAR chain were too high, such a sluggish biosensor response would be expected (Haugh, 2012).
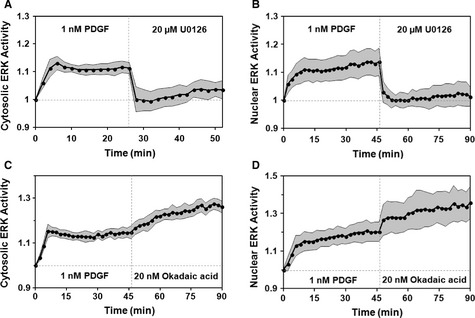
To exclude this possibility, we stimulated cells with PDGF until the response was quasi‐steady, followed by addition of the MEK inhibitor, U0126. Both cytosolic and nuclear EKAR signals decayed completely and rapidly after addition of U0126, with t1/2 values approximately 2 min (the temporal resolution of these experiments) or less (Fig 3A and B). These results are consistent with previous observations that ERK activity and nuclear localization require continuous activation of the MEK‐ERK pathway (Burack & Shaw, 2005). More importantly, the rapid decay kinetics rule out the hypothesis outlined above, indicating instead that the availability of active ERK is rate‐limiting for PDGF‐stimulated accumulation of EKAR signal; in other words, we can safely assume that the EKAR substrates rapidly equilibrate with free, diphosphorylated ERK. In other experiments we replaced U0126 with okadaic acid, an inhibitor of multiple phosphatases. Both the cytosolic and nuclear EKAR FRET readouts increased further after okadaic acid treatment (Fig 3C and D), confirming that the biosensor signal remains in the dynamic range during PDGF stimulation.
Figure 3. ERK activity measurements reliably track the availability of free, active ERK.
-
A, BMean time courses of cytosolic [(A), n = 10] and nuclear [(B), n = 9] ERK activities show responses to maximal PDGF treatment followed by addition of the MEK inhibitor, U0126.
-
C, DMean time courses of cytosolic [(C), n = 9] and nuclear [(D), n = 9] ERK activity in response to maximal PDGF stimulation followed by addition of the phosphatase inhibitor, okadaic acid. In all of the plots, the gray regions report 95% confidence intervals.
These results indicate that ERK dephosphorylation is not a rate‐controlling process in our cells; i.e. it cannot explain why the adaptation of ERK phosphorylation noticeably lags behind that of MEK phosphorylation (Fig 1A and B). Previous analyses that did not account for nucleocytoplasmic shuttling, including our own (Schoeberl et al, 2002; Sasagawa et al, 2005; Cirit et al, 2010), implicitly rely on slow ERK dephosphorylation to explain the lag.
A kinetic model including ERK interactions with cytosolic and nuclear substrates reconciles observed ERK phosphorylation, localization, and activity responses
The data presented above indicates that there is a temporal lag between nuclear translocation of ERK and its available activity in the nucleus. Hence we reasoned that competitive interactions between ERK and its many substrate proteins, which have been shown to be important during Drosophila embryogenesis (Kim et al, 2011a,b), might mechanistically account for the distinct temporal features of our data set. To evaluate this hypothesis, we formulated minimal kinetic models of ERK dynamics in the cytosol and nucleus (Supplementary Text S1). The models were judged based on their abilities to globally fit the data set using a Monte Carlo, parameter set ensemble approach (Brown & Sethna, 2003; Wang et al, 2009; Cirit et al, 2010; Hao et al, 2012).
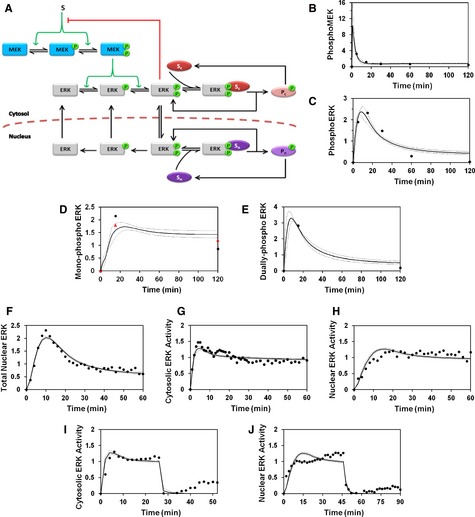
In accord with our hypothesis, a model accounting for MEK and ERK phosphorylation in the cytosol, nucleocytoplasmic shuttling of ERK, and ERK‐substrate interactions in both compartments (Fig 4A) successfully reconciled the biochemical (Fig 4B–E) and live‐cell imaging (Fig 4F–H) measurements and the fast decay kinetics seen in cells treated with PDGF followed by MEK inhibition (Fig 4I and J). A key aspect of the fit is that the total amount of diphosphorylated ERK (as measured in a cell lysate) includes both the free and substrate‐bound pools. The fit shows that the kinetics of free, diphosphorylated ERK are actually better reflected in the accumulation of mono‐phosphorylated ERK, for which the slow step is the liberation of substrate‐bound ERK followed by rapid dephosphorylation and, in the case of nuclear ERK, export to the cytosol.
Figure 4. A kinetic model reconciles observed ERK phosphorylation, localization, and activity responses.
-
ASchematic of a simple kinetic model including cytosolic and nuclear substrates that bind to and are phosphorylated by active ERK.
-
B–JMeans of calculated time courses (solid lines), representing a global ensemble fit to the data, are plotted along with the means of the corresponding experimental measurements (black circles). Broken lines report mean ± s.d. of the model output for all parameter sets in the ensemble (n = 10 000). The data fit for maximal PDGF stimulation conditions comprises MEK (B) and ERK (C) phosphorylation measured by immunoblotting, mono‐phosphorylated ERK2 [pTEY, (D)] and diphosphorylated ERK2 (E) measured by mass spectrometry, nuclear localization of ERK (F), and cytosolic (G) and nuclear (H) ERK activities. Also fit were the experiments in which cytosolic (I) and nuclear (J) ERK activities were monitored in cells maximally stimulated with PDGF followed by MEK inhibition.
A “control” model neglecting the influence of substrate interactions was tested, and it fails on a qualitative level to fit the data set (Supplementary Fig S7). With negligible substrate interactions, the whole‐cell level of diphosphorylated ERK is equal to the sum of the active ERK in the cytosol and nucleus, as read out by the EKAR measurements. The (arbitrarily weighted) sum of two time courses, each of which showing a low degree of adaptation, will exhibit the same property; therefore, the comparison of the EKAR kinetics with those of ERK diphosphorylation imposes an irreconcilable conflict for the “control” model, which is systematically constrained to generate ERK phosphorylation, nuclear translocation, and nuclear activity time courses that have approximately the same shape (Supplementary Fig S7).
An alternative “buffering” model was also evaluated. Rather than assuming that substrate interactions control the availability of active ERK in the nucleus, this model neglected substrate interactions and considered instead that diphosphorylated ERK entering the nucleus must be liberated from its interaction with the shuttling protein, Importin‐7 (Stewart, 2007; Plotnikov et al, 2011). This model variation is implemented with the hypothesis that release of Importin7‐bound ERK might be rate‐controlling for accumulation of free, active ERK in the nucleus; however, like the “control” model, it fails to fit the data (Supplementary Fig S8). This model fails because the influence of the assumed release mechanism applies to ERK entering the nucleus at any time, and thus the amount of nuclear ERK in the importin‐bound state cannot be highly transient unless the amount of free, active ERK in the cytosol (rapidly equilibrated with cytosolic EKAR) is also. For the same reason, adding the release mechanism to the successful model including substrate interactions did not demonstrably improve the quality of fit (Supplementary Fig S9).
Substrate interactions as a transient buffer of diphosphorylated ERK
The intuitive interpretation offered by the successfully fit model is as follows. ERK is phosphorylated and achieves a quasi‐steady state in the cytosol fairly rapidly, as seen in the cytosolic EKAR response, while ERK steadily accumulates in the nucleus. There, active ERK is initially buffered by interactions with nuclear substrates. The notion that those interactions are competitive means that most of the nuclear ERK is bound and also protected from dephosphorylation during this phase (Bardwell et al, 2003; Kim et al, 2011a,b). As time goes on, ERK phosphorylates those substrates, freeing up a higher fraction of the active ERK in the nucleus while also permitting its dephosphorylation and export. Thus, the adaptation of total ERK in the nucleus reflects a reduction in the fraction of diphosphorylated ERK that is substrate‐bound (and anchored in the nucleus) versus freely available.
This conceptual model implies that there is a certain high‐affinity substrate, or a subset of such substrates, that buffers the free pool of active ERK and thus affects the phosphorylation of all other ERK substrates (Rowland et al, 2012). For the buffering to be transient, the dominant substrate(s) must be phosphorylated gradually and, ultimately, with high stoichiometry (an alternate explanation, not explored here, is that the phosphorylated substrate is degraded). At the other extreme, one might expect to identify substrates with much lower affinity for ERK and relatively fast dephosphorylation kinetics (as assumed for the EKAR probes), which equilibrate rapidly with the free pool of active ERK. Consistent with this view, we find that the shape of the phosphorylation time course of Elk‐1, as quantified in Fig 2G, is intermediate between the predicted high‐ and low‐affinity extremes for the nuclear compartment (Supplementary Fig S10).
A deeper analysis of the ensemble of fit parameter sets provides additional insight. Reasoning that substrate interactions are the key aspect of the fit, we assessed the maximum buffering strength of each substrate as a parameter grouping defined as the ratio of total substrate concentration to the associated Michaelis constant, Km (Supplementary Text S1). A scatter plot of nuclear vs. cytosolic buffering strengths for each parameter set in the ensemble revealed two distinct modes by which a good fit was achieved (Fig 5). In one mode, a particular buffering ratio for nuclear substrate (~20) is sufficient to explain the data, while cytosolic substrate offers minimal buffering (or, at least, minimal cytosolic anchoring). In the other mode, cytosolic substrate has a particular buffering ratio (also ~20), while in the nucleus the buffering ratio still must be significant, but it need only exceed unity. Analysis of the model output for five selected parameter sets (indicated by the arrows in Fig 5) shows that nuclear buffering is required to explain the kinetic delay between overall nuclear translocation and availability of nuclear ERK activity, while buffering in either compartment is sufficient to explain the apparent adaptation of diphosphorylated ERK relative to availability of ERK activity on a whole‐cell basis (Fig 5).
Figure 5. The strengths of ERK‐substrate interactions in the cytosol and nucleus largely explain the model fit to the data.
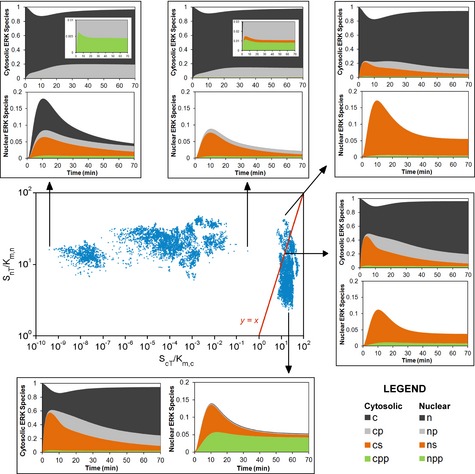
Substrate buffering strength (total substrate concentration divided by the corresponding Km) in the cytosol and in the nucleus are plotted for each of the 10,000 parameter sets in the ensemble (center). Breakdowns of ERK species in the cytosol and nucleus are shown for 5 of the parameter sets as connected by the arrows, selected based on their relative substrate buffering strengths. c/n, cytosolic/nuclear unphosphorylated ERK; cp/np, cytosolic/nuclear mono‐phosphorylated ERK; cpp/npp, cytosolic/nuclear diphosphorylated ERK; cs/ns, cytosolic/nuclear substrate‐bound ERK.
A key insight that emerges from the data and analysis described above is that the transience of ERK phosphorylation does not simply reflect a slow dephosphorylation of ERK following the rapid adaptation of MEK by negative feedback. This implies that adaptation of MEK is not necessary, and that substrate interactions are sufficient, to explain the adaptation of ERK phosphorylation. To show this, we fit to the ERK data a variant of the model in which MEK activity is held constant. Although the fit was, in certain respects, not as good as the fit shown in Fig 4 (e.g. in fitting the cytosolic EKAR data), this variation successfully captured the apparent adaptation of the ERK phosphorylation and nuclear translocation responses (Supplementary Fig S11).
Experimental confirmation of qualitative model predictions
Having established a model‐guided, mechanistic interpretation of the available data, we sought to test associated predictions. Three related predictions concerned the kinetics and steady‐state response of the system as a function of the input signal strength (Fig 6). First, we compared PDGF doses that yield maximal (1 nM) and roughly half‐maximal (30 pM) phosphorylation of ERK (Supplementary Fig S1). Both doses elicit transient, peaked ERK phosphorylation kinetics (Fig 6A). Using a single parameter set picked from the ensemble and comparing half‐maximal (S = 0.5) versus maximal (S = 1) input strengths, the model output shows qualitative agreement with these data (Fig 6B); other parameter sets yielded similar results with modest adjustment of the submaximal S value (e.g. in the range of S = 0.3–0.6, because the saturable relationship between PDGF dose and S is approximate). These results suggest that the transient buffering of phosphorylated ERK, on a whole‐cell basis, is consistent between the two stimulation conditions. Second, we measured nuclear translocation of ERK2 stimulated by the lower PDGF dose; after 30 min, the PDGF concentration was adjusted to 1 nM. In both the experiments and model output, ERK2 nuclear translocation shows a muted peak for the low dose and little or no apparent increase after the increase in PDGF concentration (Fig 6C and D; Supplementary Fig S12A shows quantification for the individual cells, and Supplementary Fig S12B presents parallel controls in which the 30 pM stimulation period was replaced by mock stimulation with buffer). The lack of dose responsiveness here cannot be attributed to adaptation of the upstream pathway; guided by a third model prediction, we confirmed that free, active ERK in the cytosol — the driving force for nuclear translocation — almost doubles after the PDGF dose is increased (Fig 6E and F).
Figure 6. Testing model predictions for half‐maximal stimulation.
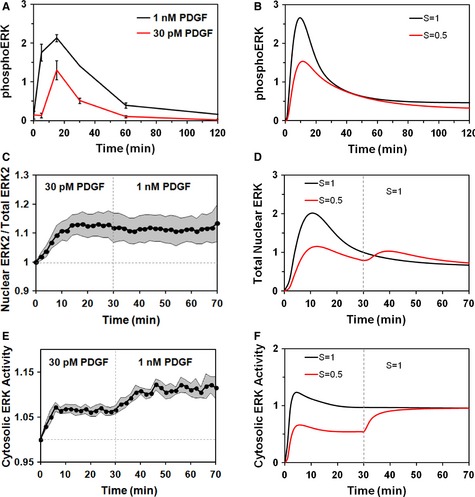
- ERK phosphorylation was assessed by quantitative immunoblotting (mean ± s.e.m., n = 3).
- Predicted ERK phosphorylation.
- Nuclear localization of mCherry ERK2 was stimulated by 30 pM PDGF followed by 1 nM PDGF (mean ± 95% confidence interval, n = 8).
- Predicted nuclear translocation of ERK.
- Cytosolic ERK activity was measured for the same stimulation protocol as in (C) (mean ± 95% confidence interval, n = 11).
- Prediction of free, active ERK in the cytosol.
In the context of the model, these results are reconciled as follows. Increasing the input strength yields greater ERK phosphorylation by active MEK in the cytosol, resulting in greater influx of ERK into the nucleus. This increased influx is approximately offset by an increase in efflux, as the dynamic equilibrium is shifted towards greater phosphorylation of ERK substrate(s) and thus less substrate to anchor ERK in the nucleus.
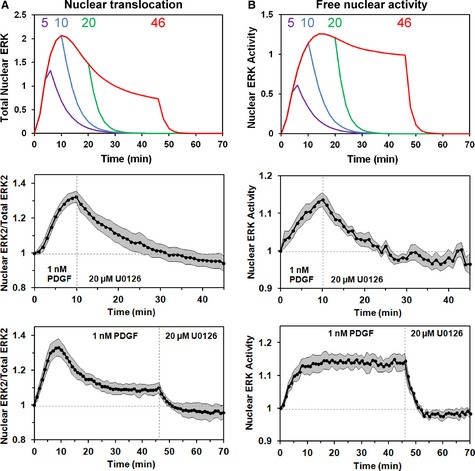
A fourth and wholly different prediction tests the concept that diphosphorylated ERK is transiently protected from phosphatase activity. We reasoned that interrupting the pathway (by inhibiting MEK) during the early, transient period of growth factor‐stimulated ERK dynamics would result in a slower decay of the system as compared with the rapid decay documented when the pathway is blocked later (Fig 3). To test this, we assessed the decay of both ERK2 nuclear translocation and free nuclear activity of ERK (Fig 7A and B, respectively) after 10 min of maximal PDGF stimulation followed by MEK inhibition. For comparison, we applied in paired experiments the previous stimulation/inhibition protocol, with addition of the MEK inhibitor at pseudo‐steady state. Consistent with model calculations, the measured decays for individual cells following the earlier addition of MEK inhibitor were noticeably slower; following MEK inhibition imposed 10 min post‐stimulation, the nuclear dynamics decayed with t1/2 values (6.5 ± 3.2 and 4.8 ± 0.5 min for nuclear localization and activity, respectively) that are approximately 3‐fold longer than when inhibition was imposed later (1.7 ± 0.5 and 1.4 ± 0.4 min, respectively) (Fig 7). Both comparisons are significant, with P < 10−3 by two‐tailed t‐test.
Figure 7. Transient buffering is reflected in decay of the system following MEK inhibition.
-
A, BNuclear translocation of ERK (A) and free, active ERK in the nucleus (B) were predicted (mean of ensemble predictions) for maximal PDGF stimulation followed by MEK inhibition imposed at different time points (5, 10, 20, and 46 min after PDGF stimulation, as indicated) (top panels). NIH 3T3 cells co‐expressing mCherry‐ERK2 and nuclear EKAR biosensor were treated with 1 nM PDGF followed by U0126 MEK inhibitor to test the predictions. The data are presented as mean ± 95% confidence interval. Middle panels: kinetics of nuclear localization [(A), n = 10] and nuclear ERK activity [(B), n = 7; of the 10 cells in (A), these had suitable EKAR expression] for MEK inhibition imposed 10 min after PDGF stimulation. Bottom panels: kinetics of nuclear localization [(A), n = 9] and nuclear ERK activity [(B), n = 9] for MEK inhibition imposed 46 min after PDGF stimulation.
Discussion
Our analysis of growth factor‐stimulated ERK dynamics encompasses negative feedback, nucleocytoplasmic shuttling, and substrate interactions, all of which are necessary to fully reconcile diverse biochemical and live‐cell microscopy data addressing phosphorylation, localization, and activity states of ERK. Surprisingly, we found that negative feedback is not necessary to explain the apparent transience of ERK phosphorylation and nuclear localization responses. Rather, considering the known competitive interactions of diphosphorylated ERK with substrates and phosphatases (Bardwell et al, 2003; Kim et al, 2011b), the interpretation is that transient ERK dynamics are a consequence of relatively rapid ERK activation and nuclear import followed by slower equilibration of ERK substrate phosphorylation/dephosphorylation (or possibly degradation of the substrate). With the availability of active ERK transiently buffered by substrate binding, the pools of free, active ERK in the cytosol and nucleus show little adaptation. This work implicates mechanisms that affect the temporal and compartmental dynamics of ERK signaling in mammalian cells.
Our measurements and model‐guided analysis illustrate that the kinetic relationships among ERK phosphorylation, localization, and activity vary with the magnitude of the input. A lower dose of growth factor still elicits a transient phosphorylation response in our cells, but the apparent peak of nuclear localization is lost. When the concentration of growth factor was subsequently increased to a maximal dose, there was little or no increase in the level of nuclear ERK. This apparent adaptation is not consistent with desensitization of ERK phosphorylation in the cytosol; rather, the data and model‐guided analysis strongly suggest that the “adaptation” is intrinsic to the nuclear dynamics, caused by a redistribution of ERK from the substrate‐anchored state to the unbound state. More generally, the analysis shows that measurable ERK dynamics are sensitive to the degree of buffering by ERK substrates (Fig 5). We note that expression of either of the EKAR substrates does not noticeably perturb ERK in our cells, as judged from the consistent nuclear translocation kinetics measured in parallel with EKAR responses or in the absence of EKAR expression. This observation underscores the conclusion that only the substrates with the highest buffering strengths affect ERK dynamics. The kinetics and extent of substrate phosphorylation, which depend on the expression of phosphatases that reverse the action of ERK, are just as important (Supplementary Fig S10). Therefore, qualitative, context‐dependent differences in observable kinetics should be expected across cell lineages and culture conditions that affect the expression levels of ERK substrates and phosphatases. Indeed, in EGF‐stimulated PC12 cells, free ERK activities in the cytosol and nucleus were found to be transient, with no apparent lag between the cytosolic and nuclear responses (Herbst et al, 2011).
This work has forced us to reevaluate how the ERK pathway responds to growth factor stimulation and the role of negative feedback in that response. In our view the true output of the pathway is not phosphorylated ERK nor even ERK kinase activity (as one would measure in a dilute cell extract or after immunocapture), but rather the amount of active ERK that is free to interact with its many substrates in cells. The data indicate that this output, as quantified for cytosolic and nuclear ERK, is highly damped relative to the transience of the classic biochemical readouts or, when the PDGF dose is saturating, of total ERK localization in the nucleus. From a process control perspective, one might conjecture that the pathway, subject as it is to strong negative feedback affecting MEK, is tuned so that mobilization of active ERK is not accompanied by dramatic overshoot. Another characteristic shown in the data is a kinetic hierarchy in which ERK phosphorylation of cytosolic substrates precedes phosphorylation of nuclear substrates. While transient buffering explains these temporal aspects, negative feedback is critical for the steady‐state properties of the system, characterized by linear sensitivity (Joslin et al, 2010; Sturm et al, 2010) and, in our cells, a dynamic range in the sub‐nanomolar regime of PDGF‐BB or FGF‐2 concentration. Thus, in certain contexts the complex regulatory structure of the ERK pathway apparently yields simple (linear, damped) outputs. This work offers a framework for understanding the basis of these properties and comparing them across different experimental contexts.
Materials and Methods
Cell culture, plasmids, and reagents
NIH 3T3 mouse fibroblasts were acquired from American Type Culture Collection (Manassas, VA) and cultured at 37°C, 5% CO2 in Dulbecco's Modified Eagle Medium supplemented with 10% fetal bovine serum, 2 mM l‐glutamine, and the antibiotics penicillin and streptomycin. All tissue culture reagents were purchased from Invitrogen (Carlsbad, CA).
Stable NIH 3T3 lines expressing GFP‐ERK1 or mCherry‐ERK2 were established by retroviral infection and puromycin selection, as described previously (Weiger et al, 2010). Retroviral plasmids encoding GFP‐ERK1 and mRFPnuc nuclear marker were kind gifts from Dr. Steven Wiley (Pacific Northwest National Laboratory) (Shankaran et al, 2009). To make the mCherry‐ERK2 plasmid, we obtain murine ERK2 cDNA (IMAGE Clone 6468233) from Thermo Scientific Open Biosystems (Waltham, MA). The ERK2 coding sequence was PCR‐amplified with flanking HindIII sites, and this product was ligated into a HindIII‐digested pBM‐IRES‐puro mCherry‐AktPH plasmid (Welf et al, 2012). Cytoplasmic and nuclear ERK kinase activity reporter (EKAR, Cerulean‐Venus) plasmids (Harvey et al, 2008) were obtained from Addgene (Cambridge, MA) and transfected into cells by lipofection.
Antibodies recognizing phospho‐MEK1/2 (pSer217/pSer221, cat. no. 9192), phospho‐ERK1/2 (pThr202/pTyr204, cat. no. 9101), total ERK1/2 (cat. no. 9107), and phospho‐Elk‐1 (pSer383, cat. no. 9181) were acquired from Cell Signaling Technology (Danvers, MA). U0126 and ERK inhibitor (CAS 1049738‐54‐6) were purchased from EMD Millipore/Calbiochem (Billerica, MA). PDGF‐BB and FGF‐2 were acquired from Peprotech (Rocky Hill, NJ). Sequencing grade trypsin was purchased from Promega (Madison, WI). Except where noted otherwise, all other reagents were obtained from Sigma Aldrich (St Louis, MO) or Fisher Scientific (Rockford, IL).
Live‐cell microscopy
Cells were detached with a brief trypsin‐EDTA treatment and suspended in imaging buffer (20 mM HEPES pH 7.4, 125 mM NaCl, 5 mM KCl, 1.5 mM MgCl2, 1.5 mM CaCl2, 10 mM glucose and 2 mg/ml fatty‐acid‐free bovine serum albumin). After centrifugation at 100 × g for 3 min, the cells were resuspended in imaging buffer and counted using a Beckman Coulter Counter. Adhesive surfaces were prepared on clean, sterile 25 × 25 mm glass cover slips (Fisher Scientific, Pittsburgh, PA), which were coated with poly‐D‐lysine (100 μg/ml) overnight at 4°C, washed with deionized, sterile water and dried. To make a chamber for the cells, a Teflon ring was attached to the cover slip, and 1 ml of cell suspension containing 3 × 10⁴ cells (roughly 100 cells/mm2) was added. Cells were allowed to spread and were serum‐starved in imaging buffer for 4 h prior to imaging. Mineral oil was layered on top of the buffer to prevent evaporation during the experiment. Growth factors and inhibitors were diluted in the same buffer before adding to the cells.
Images were acquired using epifluorescence microscopy. A 50‐W mercury arc lamp was used to excite EGFP, mCherry and Cerulean proteins with 480/20‐nm, 572/23‐nm and 436/20‐nm excitation filters, respectively. Emission peaks of EGFP, mCherry, Cerulean and Venus fluorophores were gated using 515/30‐nm, 630/60‐nm, 480/40‐nm and 540/30‐nm bandpass filters, respectively (filter sets from Chroma Technology, Bellows Falls, VT). A 40 × water immersion objective (Zeiss Achroplan, 0.8 NA) and 0.63 × camera mount were used. Digital images were acquired using a Hamamatsu ORCA ER cooled charge‐coupled device (CCD) (Hamamatsu, Bridgewater, NJ) and MetaMorph software (Universal Imaging, West Chester, PA). In each image, the intensity of an acellular region was defined as background and subtracted from the intensity of each pixel prior to further analysis. Binary masks of the nuclear and non‐nuclear regions of each cell were applied to calculate mean intensity values of GFP‐ERK1 or mCherry‐ERK2 using custom codes in MATLAB (MathWorks, Natick, MA). In the case of mCherry‐ERK2 co‐expressed with one of the EKAR probes, the nuclear region was defined by the presence (nuclear EKAR) or absence (cytosolic EKAR) of Cerulean fluorescence. The average nuclear ERK intensity is normalized by the average ERK intensity of the whole cell for each frame, which accounts for a moderate degree of photobleaching; this quantity, measured as a function of time, is normalized again by its pre‐stimulation value. For the EKAR biosensors, the ratio of average acceptor and donor (Venus/Cerulean) intensities was calculated as a relative measure of FRET signal for each image. Like the measurement of ERK nuclear translocation, EKAR FRET is normalized by its pre‐stimulation value.
The time scale associated with the decay of nuclear ERK or EKAR following MEK inhibition was defined as t1/2, the elapsed time after addition of the MEK inhibitor when the value of the measurement had decayed halfway between the value measured just prior to inhibition and that of the pre‐stimulus baseline. For each cell, the time interval between successive frames during which this event occurred was identified, and the t1/2 value was estimated by linear interpolation.
Quantitative immunoblotting, immunofluorescence, and mass spectrometry
Cells were serum‐starved for 4 h prior to stimulation. Detergent lysates were prepared for quantitative immunoblotting, and immunoblots were performed using enhanced chemiluminescence, as described previously (Park et al, 2003). The BioRad Fluor S‐Max system, which gives a linear response with respect to light output, was used, and band intensity was quantified using local background subtraction. The data were first normalized by an appropriate loading control and then further “trend” normalized to evaluate the consistency of relative kinetic trends across independent experiments, according to the procedures described in detail previously (Wang et al, 2009).
Liquid chromatography‐tandem mass spectrometry (LC/MS/MS) analysis
Cell lysates were processed and trypsin‐digested, and phosphopeptides were enriched by immobilized metal affinity chromatography (IMAC), essentially as described previously (Chien et al, 2011). Briefly, 250 μg of each peptide digest was spiked with 5 μg of β‐casein digest as an internal standard. Each sample was loaded onto 100 μl of Fe‐NTA agarose slurry and washed with 200 μl of 2% acetic acid. A more stringent wash was performed with 200 μl of 74:25:1 100 mM NaCl/acetonitrile/acetic acid (v/v/v), followed by a wash with 100 μl of H2O. Retained peptides were eluted with 200 μl of 5% NH4OH, then immediately acidified to pH 3 with formic acid. The eluted peptides were dried using vacuum centrifugation and solubilized in 0.1% formic acid.
LC/MS/MS analyses were performed for biological triplicates using an Easy nLC 1000 liquid chromatograph coupled to an LTQ Orbitrap Elite mass spectrometer (Thermo Fisher Scientific, Bremen, Germany). Samples were injected onto a PepMap C18 5 μm trapping column (Thermo‐Dionex, Sunnyvale, CA) then separated by in‐line gradient elution onto a 75 μm id × 15 cm capillary in‐house packed with 1.7 μm BEH C18 stationary phase (Waters Corp., Milford, MA). The linear gradient was carried out from 5 to 40% mobile phase B over 40 min at a 300 μl/min flow rate, where mobile phase A was 0.1% formic acid in 2% acetonitrile and mobile phase B was 0.1% formic acid in acetonitrile. The Orbitrap Elite was operated in data‐dependent mode where the seven most intense precursors at 60k resolving power (at m/z 400) were selected for subsequent collision‐induced dissociation (CID) fragmentation. The normalized collision energy was set to 35% for CID. For internal mass calibration, the ion at m/z 445.120025 was used as the lock mass. Monoisotopic precursor selection was enabled, and precursors with unassigned charge or a charge state of +1 were excluded. Fragmented precursor masses were excluded from further selection for 60 s.
The raw data files were processed using Proteome Discoverer version 1.3 (Thermo Fisher Scientific, San Jose, CA). Peak lists were searched against a forward and reverse Mus musculus UniProt database (UniprotKB release 2012_10) appended with bovine casein proteins using both Mascot (Matrix Science, UK) and Sequest (Thermo Fisher Scientific, San Jose, CA). The following parameters were selected to identify tryptic peptides for protein identification: 10 ppm precursor ion mass tolerance; 0.6 Da product ion mass tolerance; a maximum of two missed cleavages; carbamidomethylation of Cys was set as a fixed modification; oxidation of Met and phosphorylation of Ser, Thr, and Tyr were set as variable modifications. Searched results were filtered with the integrated Percolator node using an FDR < 5%. Phosphorylation site probabilities were calculated by the integrated phosphoRS node, and phosphorylation sites with a probability < 75% were discarded. Relative quantification based on precursor ion intensities of ERK2 phosphopeptides (+3 charge state only) was performed using Sieve v2.0 (Thermo Fisher Scientific, San Jose, CA) for the results shown in Fig 1; subsequent analysis shown in Supplementary Fig S2 was performed using Skyline v1.4 (Schilling et al, 2012). These data were trend‐normalized in the same manner as the immunoblotting data.
Immunofluorescence
Immunofluorescence was carried out as follows. PDGF‐stimulated cells were washed twice with phosphate‐buffered saline (PBS) before fixation and permeabilization in CSK buffer (2.5% non‐buffered formaldehyde and 0.5% Triton X‐100 in 10 mM HEPES (pH 7.0), 100 mM NaCl, 300 mM sucrose, 3 mM MgCl2, 5 mM EGTA). After washing with PBS, the cells were stained with primary and Alexa 568‐conjugated secondary antibodies, washed with PBS, and mounted on glass slides with Citifluor medium (Citifluor Ltd., London, UK). Images were acquired using a Zeiss LSM 710 laser scanning confocal microscope.
Formulation and analysis of kinetic models
Kinetic models comprised of ordinary differential equations in time were constructed based on known or plausible signaling mechanisms, as described in detail in Supplementary Text S1. The models have the following common features, which collectively constitute a core model. MEK and ERK are each activated, in sequence, by two‐site phosphorylation, and PDGF stimulation is modeled as a step increase in MEK phosphorylation rate. Activated ERK governs negative feedback through desensitization of MEK phosphorylation. These processes are assumed to occur in the cytosol, where MEK is strictly localized (Fukuda et al, 1996; Burack & Shaw, 2005), and their treatment in the model follows from previous work (Cirit et al, 2010) with judicious simplifications. To this we added nucleocytoplasmic shuttling of ERK, with translocation of diphosphorylated ERK into the nucleus. While in the nucleus, ERK is dephosphorylated by nuclear phosphatases, and it is exported back to the cytosol irrespective of its phosphorylation state (Horgan & Stork, 2003).
Building on this core model, our final model also includes interactions between diphosphorylated ERK and protein substrates in the cytosol and nucleus, which serve to anchor ERK in each compartment (Burack & Shaw, 2005; Lidke et al, 2010; Kim et al, 2011b). For simplicity we assume that one substrate (or a class of substrates with similar kinetic properties) dominates the interaction with ERK in each compartment, and the model accounts for phosphorylation of the substrate (by ERK) and its dephosphorylation. The similarities and differences between this model and that of Hirashima, who considered the combined influence of substrate interactions and nucleocytoplasmic shuttling at steady state (Hirashima, 2012), are enumerated in Supplementary Text S1.
A different model was formulated to test an alternative mechanism for kinetically decoupling nuclear translocation and nuclear activity of ERK, namely the release of ERK from the shuttling protein, Importin‐7. The transition from Importin‐bound to free, active ERK was modeled simply as a first‐order process. This modification of the model was assessed instead of, and also in combination with, the substrate‐binding model. All model variations are described in detail in Supplementary Text S1.
The approach used to fit models to kinetic data has been described in detail previously (Cirit et al, 2010; Cirit & Haugh, 2012) and is summarized in Supplementary Text S1. Briefly, it uses a Monte Carlo/simulated annealing‐based algorithm to generate a large (n = 10 000) ensemble of “good” parameter sets rather than one “best” fit. Starting with initial parameter values, the model output is computed and aligned with the data, and the quality of fit is evaluated. Next, new values are chosen according to normal distributions centered on the previous values; the width of the distribution is a parameter of the algorithm. If specified error criteria are met, the new parameter set is accepted and used as the nexus for choosing the next parameter values; otherwise, the procedure is repeated with the previous parameter set. If the starting parameter set (determined based on initial trials) is nearly optimal, then the parameter sets generated in this manner constitute an ensemble that fit the data almost equally well. After compiling the ensemble, the model output is recalculated for each parameter set, and at each time point, an ensemble mean and standard deviation may be calculated.
Author contributions
SA, KGG, LEE, MBG, and JMH designed research; SA, KGG, LEE, and AR performed research; SA, KGG, LEE, MBG, and JMH analyzed the results; MC provided valuable tools and expertise; SA and JMH wrote the paper with input from all other authors.
Conflict of interest
The authors declare that they have no conflict of interest.
Supplementary Material
Supplementary Legends
Supplementary Figure 1
Supplementary Figure 2
Supplementary Figure 3
Supplementary Figure 4
Supplementary Figure 5
Supplementary Figure 6
Supplementary Figure 7
Supplementary Figure 8
Supplementary Figure 9
Supplementary Figure 10
Supplementary Figure 11
Supplementary Figure 12
Supplementary Reference
Supplementary Table 1
Supplementary Table 2
Supplementary Text
Review Process File
Source Data
Source Data for Figure 4J1
Source Data for Figure 4B1
Source Data for Figure 4C1
Source Data for Figure 4D1
Source Data for Figure 4E1
Source Data for Figure 4F1
Source Data for Figure 4G1
Source Data for Figure 4H1
Source Data for Figure 4I1
Acknowledgements
The authors wish to thank Stanislav Shvartsman (Princeton Univ.) for helpful discussions. This work was supported by the National Institutes of Health, grant no. R01GM088987.
Mol Syst Biol. (2014) 10: 718
References
- Albeck JG, Mills GB, Brugge JS (2013) Frequency‐modulated pulses of ERK activity transmit quantitative proliferation signals. Mol Cell 49: 249–261 [DOI] [PMC free article] [PubMed] [Google Scholar]
- Anderson NG, Maller JL, Tonks NK, Sturgill TW (1990) Requirement for integration of signals from two distinct phosphorylation pathways for activation of MAP kinase. Nature 343: 651–653 [DOI] [PubMed] [Google Scholar]
- Bardwell AJ, Abdollahi M, Bardwell L (2003) Docking sites on mitogen‐activated protein kinase (MAPK) kinases, MAPK phosphatases and the Elk‐1 transcription factor compete for MAPK binding and are crucial for enzymic activity. Biochem J 370: 1077–1085 [DOI] [PMC free article] [PubMed] [Google Scholar]
- Bhalla US, Ram PT, Iyengar R (2002) MAP kinase phosphatase as a locus of flexibility in a mitogen‐activated protein kinase signaling network. Science 297: 1018–1023 [DOI] [PubMed] [Google Scholar]
- Birtwistle MR, Hatakeyama M, Yumoto N, Ogunnaike BA, Hoek JB, Kholodenko BN (2007) Ligand‐dependent responses of the ErbB signaling network: experimental and modeling analyses. Mol Syst Biol 3: article no. 144 [DOI] [PMC free article] [PubMed] [Google Scholar]
- Brown KS, Sethna JP (2003) Statistical mechanical approaches to models with many poorly known parameters. Phys Rev E 68: 021904. [DOI] [PubMed] [Google Scholar]
- Burack WR, Shaw AS (2005) Live cell imaging of ERK and MEK: simple binding equilibrium explains the regulated nucleocytoplasmic distribution of ERK. J Biol Chem 280: 3832–3837 [DOI] [PubMed] [Google Scholar]
- Caunt CJ, McArdle CA (2010) Stimulus‐induced uncoupling of extracellular signal‐regulated kinase phosphorylation from nuclear localization is dependent on docking domain interactions. J Cell Sci 123: 4310–4320 [DOI] [PMC free article] [PubMed] [Google Scholar]
- Chen WW, Schoeberl B, Jasper PJ, Niepel M, Nielsen UB, Lauffenburger DA, Sorger PK (2009) Input‐output behavior of ErbB signaling pathways as revealed by a mass action model trained against dynamic data. Mol Syst Biol 5: article no. 239 [DOI] [PMC free article] [PubMed] [Google Scholar]
- Chien K, Liu HC, Goshe MB (2011) Development and application of a phosphoproteomic method using electrostatic repulsion‐hydrophilic interaction chromatography (ERLIC), IMAC and LC‐MS/MS analysis to study Marek's disease virus infection. J Proteome Res 10: 4041–4053 [DOI] [PubMed] [Google Scholar]
- Chung J, Kubota H, Ozaki Y, Uda S, Kuroda S (2010) Timing‐dependent actions of NGF required for cell differentiation. PLoS ONE 5: e9011. [DOI] [PMC free article] [PubMed] [Google Scholar]
- Cirit M, Haugh JM (2012) Data‐driven modelling of receptor tyrosine kinase signalling networks quantifies receptor‐specific potencies of PI3K‐ and Ras‐dependent ERK activation. Biochem J 441: 77–85 [DOI] [PMC free article] [PubMed] [Google Scholar]
- Cirit M, Wang C‐C, Haugh JM (2010) Systematic quantification of negative feedback mechanisms in the extracellular signal‐regulated kinase (ERK) signaling network. J Biol Chem 285: 36736–36744 [DOI] [PMC free article] [PubMed] [Google Scholar]
- Cohen‐Saidon C, Cohen AA, Sigal A, Liron Y, Alon U (2009) Dynamics and variability of ERK2 response to EGF in individual living cells. Mol Cell 36: 885–893 [DOI] [PubMed] [Google Scholar]
- Costa M, Marchi M, Cardarelli F, Roy A, Beltram F, Maffei L, Ratto GM (2006) Dynamic regulation of ERK2 nuclear translocation and mobility in living cells. J Cell Sci 119: 4952–4963 [DOI] [PubMed] [Google Scholar]
- Dhillon AS, Hagan S, Rath O, Kolch W (2007) MAP kinase signalling pathways in cancer. Oncogene 26: 3279–3290 [DOI] [PubMed] [Google Scholar]
- Duncia JV, Santella JB III, Higley CA, Pitts WJ, Wityak J, Frietze WE, Rankin FW, Sun J‐H, Earl RA, Tabaka AC, Teleha CA, Blom KF, Favata MF, Manos EJ, Daulerio AJ, Stradley DA, Horiuchi K, Copeland RA, Scherle PA, Trzaskos JMet al (1998) MEK inhibitors: the chemistry and biological activity of U0126, its analogs, and cyclization products. Bioorg Med Chem Lett 8: 2839–2844 [DOI] [PubMed] [Google Scholar]
- Fritsche‐Guenther R, Witzel F, Sieber A, Herr R, Schmidt N, Braun S, Brummer T, Sers C, Blüthgen N (2011) Strong negative feedback from Erk to Raf confers robustness to MAPK signalling. Mol Syst Biol 7: 489. [DOI] [PMC free article] [PubMed] [Google Scholar]
- Fujioka A, Terai K, Itoh RE, Aoki K, Nakamura T, Kuroda S, Nishida E, Matsuda M (2006) Dynamics of the Ras/Erk MAPK cascade as monitored by fluorescent probes. J Biol Chem 281: 8917–8926 [DOI] [PubMed] [Google Scholar]
- Fukuda M, Gotoh I, Gotoh Y, Nishida E (1996) Cytoplasmic localization of mitogen‐activated protein kinase kinase directed by its NH2‐terminal, leucine‐rich short amino acid sequence, which acts as a nuclear export signal. J Biol Chem 271: 20024–20028 [DOI] [PubMed] [Google Scholar]
- Gardner AM, Vaillancourt RR, Lange‐Carter CA, Johnson GL (1994) MEK‐1 phosphorylation by MEK kinase, Raf, and mitogen‐activated protein kinase: analysis of phosphopeptides and regulation of activity. Mol Biol Cell 5: 193–201 [DOI] [PMC free article] [PubMed] [Google Scholar]
- Hancock CN, Macias A, Lee EK, Yu SY, Mackerell ADJ, Shapiro P (2005) Identification of novel extracellular signal‐regulated kinase docking domain inhibitors. J Med Chem 48: 4586–4595 [DOI] [PubMed] [Google Scholar]
- Hao N, Yildirim N, Nagiec MJ, Parnell SC, Errede B, Dohlman HG, Elston TC (2012) Combined computational and experimental analysis reveals mitogen‐activated protein kinase–mediated feedback phosphorylation as a mechanism for signaling specificity. Mol Biol Cell 23: 3899–3910 [DOI] [PMC free article] [PubMed] [Google Scholar]
- Harvey CD, Ehrhardt AG, Cellurale C, Zhong HL, Yasuda R, Davis RJ, Svoboda K (2008) A genetically encoded fluorescent sensor of ERK activity. Proc Natl Acad Sci USA 105: 19264–19269 [DOI] [PMC free article] [PubMed] [Google Scholar]
- Haugh JM (2012) Live‐cell fluorescence microscopy with molecular biosensors: what are we really measuring? Biophys J 102: 2003–2011 [DOI] [PMC free article] [PubMed] [Google Scholar]
- Herbst KJ, Allen MD, Zhang J (2011) Spatiotemporally regulated protein kinase A activity is a critical regulator of growth factor‐stimulated extracellular signal‐regulated kinase signaling in PC12 cells. Mol Cell Biol 31: 4063–4075 [DOI] [PMC free article] [PubMed] [Google Scholar]
- Hirashima T (2012) A kinetic model of ERK cyclic pathway on substrate control. Math Biosci 239: 207–212 [DOI] [PubMed] [Google Scholar]
- Horgan AM, Stork PJ (2003) Examining the mechanism of Erk nuclear translocation using green fluorescent protein. Exp Cell Res 285: 208–220 [DOI] [PubMed] [Google Scholar]
- Joslin EJ, Shankaran H, Opresko LK, Bollinger N, Lauffenburger DA, Wiley HS (2010) Structure of the EGF receptor transactivation circuit integrates multiple signals with cell context. Mol BioSyst 6: 1293–1306 [DOI] [PMC free article] [PubMed] [Google Scholar]
- Kim Y, Andreu MJ, Lim B, Chung K, Terayama M, Jiménez G, Berg CA, Lu H, Shvartsman SY (2011a) Gene regulation by MAPK substrate competition. Dev Cell 20: 880–887 [DOI] [PMC free article] [PubMed] [Google Scholar]
- Kim Y, Paroush Z, Nairz K, Hafen E, Jimenez G, Shvartsman SY (2011b) Substrate‐dependent control of MAPK phosphorylation in vivo. Mol Syst Biol 7: 467. [DOI] [PMC free article] [PubMed] [Google Scholar]
- von Kriegsheim A, Baiocchi D, Birtwistle M, Sumpton D, Bienvenut W, Morrice N, Yamada K, Lamond A, Kalna G, Orton R, Gilbert D, Kolch W (2009) Cell fate decisions are specified by the dynamic Erk interactome. Nat Cell Biol 11: 1458–1464 [DOI] [PMC free article] [PubMed] [Google Scholar]
- Lidke DS, Huang F, Post JN, Rieger B, Wilsbacher J, Thomas JL, Pouyssegur J, Jovin TM, Lenormand P (2010) Erk nuclear translocation is dimerization‐independent but controlled by the rate of phosphorylation. J Biol Chem 285: 3092–3102 [DOI] [PMC free article] [PubMed] [Google Scholar]
- Marchi M, Parra R, Costa M, Ratto GM (2010) Localization and trafficking of fluorescently tagged Erk1 and Erk2. Method Mol Biol 661: 287–301 [DOI] [PubMed] [Google Scholar]
- Marshall CJ (1995) Specificity of receptor tyrosine kinase signaling: transient versus sustained extracellular signal‐related kinase activation. Cell 80: 179–185 [DOI] [PubMed] [Google Scholar]
- McKay MM, Morrison DK (2007) Integrating signals from RTKs to ERK/MAPK. Oncogene 26: 3113–3121 [DOI] [PubMed] [Google Scholar]
- Park CS, Schneider IC, Haugh JM (2003) Kinetic analysis of platelet‐derived growth factor receptor/phosphoinositide 3‐kinase/Akt signaling in fibroblasts. J Biol Chem 278: 37064–37072 [DOI] [PubMed] [Google Scholar]
- Plotnikov A, Zehorai E, Procaccia S, Seger R (2011) The MAPK cascades: signaling components, nuclear roles and mechanisms of nuclear translocation. BBA Mol Cell Res 1813: 1619–1633 [DOI] [PubMed] [Google Scholar]
- Roberts PJ, Der CJ (2007) Targeting the Raf‐MEK‐ERK mitogen‐activated protein kinase cascade for the treatment of cancer. Oncogene 26: 3291–3310 [DOI] [PubMed] [Google Scholar]
- Rowland MA, Fontana W, Deeds EJ (2012) Crosstalk and competition in signaling networks. Biophys J 103: 2389–2398 [DOI] [PMC free article] [PubMed] [Google Scholar]
- Sasagawa S, Ozaki Y, Fujita K, Kuroda S (2005) Prediction and validation of the distinct dynamics of transient and sustained ERK activation. Nat Cell Biol 7: 365–373 [DOI] [PubMed] [Google Scholar]
- Sato M, Kawai Y, Umezawa Y (2007) Genetically encoded fluorescent indicators to visualize protein phosphorylation by extracellular signal‐regulated kinase in single living cells. Anal Chem 79: 2570–2575 [DOI] [PubMed] [Google Scholar]
- Schilling B, Rardin MJ, MacLean BX, Zawadzka AM, Frewen BE, Cusack MP, Sorensen DJ, Bereman MS, Jing E, Wu CC, Verdin E, Kahn CR, Maccoss MJ, Gibson BW (2012) Platform‐independent and label‐free quantitation of proteomic data using MS1 extracted ion chromatograms in skyline: application to protein acetylation and phosphorylation. Mol Cell Proteomics 11: 202–214 [DOI] [PMC free article] [PubMed] [Google Scholar]
- Schilling M, Maiwald T, Hengl S, Winter D, Kreutz C, Kolch W, Lehmann WD, Timmer J, Klingmüller U (2009) Theoretical and experimental analysis links isoform‐specific ERK signalling to cell fate decisions. Mol Syst Biol 5: 334. [DOI] [PMC free article] [PubMed] [Google Scholar]
- Schoeberl B, Eichler‐Jonsson C, Gilles ED, Muller G (2002) Computational modeling of the dynamics of the MAP kinase cascade activated by surface and internalized EGF receptors. Nat Biotechnol 20: 370–375 [DOI] [PubMed] [Google Scholar]
- Shankaran H, Ippolito DL, Chrisler WB, Resat H, Bollinger N, Opresko LK, Wiley HS (2009) Rapid and sustained nuclear–cytoplasmic ERK oscillations induced by epidermal growth factor. Mol Syst Biol 5: 332. [DOI] [PMC free article] [PubMed] [Google Scholar]
- Stewart M (2007) Molecular mechanism of the nuclear protein import cycle. Nat Rev Mol Cell Biol 8: 195–208 [DOI] [PubMed] [Google Scholar]
- Sturm OE, Orton R, Grindlay J, Birtwistle M, Vyshemirsky V, Gilbert D, Calder M, Pitt A, Kholodenko B, Kolch W (2010) The mammalian MAPK/ERK pathway exhibits properties of a negative feedback amplifier. Sci Signal 3: ra90. [DOI] [PubMed] [Google Scholar]
- Tanoue T, Adachi M, Moriguchi T, Nishida E (2000) A conserved docking motif in MAP kinases common to substrates, activators and regulators. Nat Cell Biol 2: 110–116 [DOI] [PubMed] [Google Scholar]
- Wang C‐C, Cirit M, Haugh JM (2009) PI3K‐dependent crosstalk interactions converge with Ras as quantifiable inputs integrated by Erk. Mol Syst Biol 5: 246 [DOI] [PMC free article] [PubMed] [Google Scholar]
- Weber TJ, Shankaran H, Wiley HS, Opresko LK, Chrisler WB, Quesenberry RD (2010) Basic fibroblast growth factor regulates persistent Erk oscillations in premalignant but not malignant JB6 cells. J Invest Dermatol 130: 1444–1456 [DOI] [PubMed] [Google Scholar]
- Weiger MC, Ahmed S, Welf ES, Haugh JM (2010) Directional persistence of cell migration coincides with stability of asymmetric intracellular signaling. Biophys J 98: 67–75 [DOI] [PMC free article] [PubMed] [Google Scholar]
- Welf ES, Ahmed S, Johnson HE, Melvin AT, Haugh JM (2012) Migrating fibroblasts reorient directionality by a metastable, PI3K‐dependent mechanism. J Cell Biol 197: 105–114 [DOI] [PMC free article] [PubMed] [Google Scholar]
- Xu B, Wilsbacher JL, Collisson T, Cobb MH (1999) The N‐terminal ERK‐binding site of MEK1 is required for efficient feedback phosphorylation by ERK2 in vitro and ERK activation in vivo. J Biol Chem 274: 34029–34035 [DOI] [PubMed] [Google Scholar]
- Yoon S, Seger R (2006) The extracellular signal‐regulated kinase: multiple substrates regulate diverse cellular functions. Growth Factors 24: 21–44 [DOI] [PubMed] [Google Scholar]
- Zehorai E, Yao Z, Plotnikov A, Seger R (2010) The subcellular localization of Mek and Erk: a novel nuclear translocation signal (NTS) paves a way to the nucleus. Mol Cell Endocrinol 314: 213–220 [DOI] [PubMed] [Google Scholar]
Associated Data
This section collects any data citations, data availability statements, or supplementary materials included in this article.
Supplementary Materials
Supplementary Legends
Supplementary Figure 1
Supplementary Figure 2
Supplementary Figure 3
Supplementary Figure 4
Supplementary Figure 5
Supplementary Figure 6
Supplementary Figure 7
Supplementary Figure 8
Supplementary Figure 9
Supplementary Figure 10
Supplementary Figure 11
Supplementary Figure 12
Supplementary Reference
Supplementary Table 1
Supplementary Table 2
Supplementary Text
Review Process File
Source Data
Source Data for Figure 4J1
Source Data for Figure 4B1
Source Data for Figure 4C1
Source Data for Figure 4D1
Source Data for Figure 4E1
Source Data for Figure 4F1
Source Data for Figure 4G1
Source Data for Figure 4H1
Source Data for Figure 4I1