Short abstract
Optic nerve head (ONH) deformations may be involved in the onset or further development of glaucoma, including in patients with relatively normal intraocular pressures (IOPs). Characterizing posterior scleral deformations over physiological pressures may provide a better understanding of how changes in IOP lead to changes in the mechanical environment of the ONH and possibly retinal ganglion cell death. Pressure inflation measurement test protocols are commonly used to measure deformation of the peripapillary sclera with full-field noncontact optical methods. The purpose of this work was to develop and validate a new sequential 3D digital image correlation (S-DIC) approach for quantification of posterior scleral pressure induced deformation that improves z (in-depth) resolution of the DIC measurement without losing in-plane sensitivity, while also being able to contour and map deformations of the complex-shaped ONH. Our approach combines two orthogonal axes of parallax with standard 3D DIC methods using a single high-resolution camera. The enhanced capabilities of S-DIC with respect to standard 3D DIC has been demonstrated by carrying out a complete benchmark for shape, deformation, and strain measurement on an object of known complex geometry. Our S-DIC method provided a reconstruction accuracy of 0.17% and an uncertainty in z-position measurement of 8 μm. The developed methodology has also been applied to a human posterior scleral shell, including the full peripapillary sclera and optic nerve. The relatively inexpensive S-DIC approach may provide new information on the biomechanical deformations of the optic nerve head and, thus, the death of retinal ganglion cells in primary open angle glaucoma.
Keywords: ocular biomechanics, S-DIC, stereo-DIC, sequential DIC, optic nerve head deformation, glaucoma, posterior sclera, inflation test
1. Introduction
Optic nerve head (ONH) deformations may be involved in the onset or further development of glaucoma, including in patients with relatively normal intraocular pressures (IOPs) [1–5]. Characterizing posterior scleral deformations over physiological pressures may provide a better understanding of how changes in IOP lead to changes in the mechanical environment of the ONH and possibly retinal ganglion cell death [1,3,6–10]. The biomechanics of the peripapillary sclera and ONH region may also mediate IOP-related reductions in blood flow and cellular responses associated with glaucomatous damage [1,3,8]. The sclera and ONH are nonlinear and anisotropic soft tissues that require a careful experimental approach for determining their regional mechanical properties [1,6]. Quantifying the patient variability and regional dependence of these properties may provide opportunities for improving diagnostic and therapeutic interventions for glaucoma [1,10].
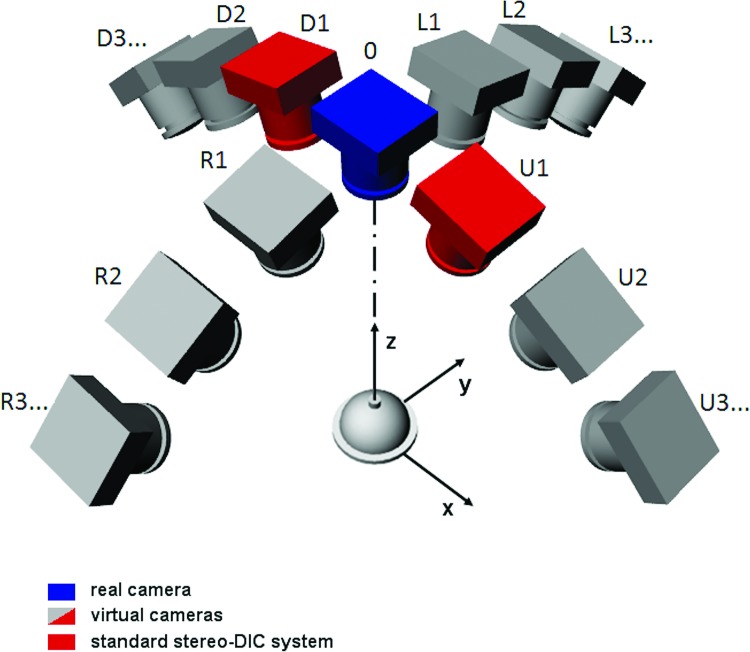
There are several experimental techniques currently being used to quantify deformation over the entire posterior scleral surface. Most if not all of the more recent protocols utilize a pressure inflation setup in which intraocular pressure is controlled at high resolution [9,11–18]. The most common full-field optical techniques used to quantify scleral deformation as a function of intraocular pressure in inflation tests are 3D digital image correlation (3D DIC) [12–14] and electronic speckle pattern interferometry (ESPI) [9,15–18]. By far, ESPI provides the highest sensitivity, capable of measuring displacements down to fractions of the wavelength of the laser source used in the experiment with a measurement uncertainty of ±16 nm [9,17]. 3D DIC systems have also been used to map posterior scleral deformations with uncertainty in out-of-plane displacement measurement of ±8 μm [12,14]. While both of these methods have been used to measure the deformation of posterior scleral shells from humans [9,12,14,17,18] as well as eyes from various other species [13,15,16], neither technique has been used to quantify displacements of the optic nerve (ON) itself or displacements in the transition region from the peripapillary sclera to the optic nerve. In this region, geometry significantly departs from a sphere [12], thus it is mandatory to contour the local shape together with the displacement distribution in order to correctly calculate the corresponding strain maps [12,19,20]. Both ESPI and standard DIC present some limitations in performing such a measurement [9,12,17,20]. ESPI makes use of oblique illumination that generates shadows close to irregularities of the geometry that may corrupt the interferogram and invalidate the subsequent data analysis [21]. Moreover, the severed optic nerve is subjected to a significant rigid body motion that typically causes decorrelation of speckles [19,22–24] and a consequent loss of information in that area. With standard stereo-DIC methods, shape and displacement maps come from two viewing angles, thus implying that complex-shaped areas with sharp slopes are unlikely fully imaged in both views and, thus, they cannot be properly matched and reconstructed. The chosen stereo angle cannot be arbitrarily changed since it either affects the in-plane (xy-plane) or out of plane (z-axis) resolution of the measurement (assuming the xz-plane contains the axes of the cameras with the camera baseline parallel to the x-direction—see Fig. 1). In other words, small stereo angles will provide excellent in-plane sensitivity at the cost of poor out-of-plane resolution, whereas large stereo angles will provide higher z-axis resolution at the cost of poor matching efficiency and, hence, in-plane resolution [25].
Fig. 1.
The sequential DIC-approach emulates a user-defined number of virtual cameras looking at the target from different angles along two orthogonal directions of parallax (axis x and y). The red cameras show a typical 3D stereo DIC setup. Only a few views have been sketched for clarity of representation.
The purpose of this work was to exploit the strengths of stereo-DIC by overcoming its inherent drawback in contouring and tracking deformation of complex-shaped areas by developing and validating a new sequential 3D DIC approach (S-DIC) that improves in-depth resolution without losing in-plane sensitivity. Our approach combines two orthogonal axes of parallax with standard 3D DIC methods using a single high-resolution camera.
The proposed methodology proved to be suited for highly accurate quantification of posterior scleral pressure inflation deformation, while also being able to contour the complex-shaped optic nerve head region and to map its deformation during an inflation test. The high-spatially resolved strain maps so obtained, together with subdomain finite element (FE) based inverse characterization methodologies [26], will allow determination of the heterogeneous and anisotropic mechanical response of the posterior/peripapillary sclera and optic nerve, which may lead to a better understanding of the onset or further development of glaucoma.
2. Materials and Methods
2.1. Sequential Digital Image Correlation.
Digital image correlation is a well-characterized technique developed in the early 1980s [27–29] and, more recently, increasingly used in biomechanics [12–14,30,31]. Its major strengths are the noncontact and full-field capabilities, the ease of use and implementation, and the possibility to be applied from micro- to macroscale objects with time-resolved measurements up to thousands of frames per second (fps). The DIC algorithm basically matches dense sets of homologous points in an image pair from the analysis of the local gray-scale distribution over a square subset of pixels around each point of interest [29]. The positions of two homologous point locations in two different views are then used to reconstruct the 3D position of the object point on the basis of stereophotogrammetry principles [32]. By tracking the position of a grid of 3D world points for a given set of interest at various deformation configurations, it is possible to map the full-field 3D deformation distribution over the object surface at the camera frame acquisition rate.
3D DIC is properly referred to as a high-resolution measurement technique [29]. As with any experimental method, however, the resolution and accuracy of the measurement strongly depends on the specific test conditions, including camera/lens characteristics and settings, lighting, patterning protocol, speckle size and distribution, stereo angle, and DIC algorithm parameters, among others. A detailed description on how these factors affect the quality of the measurement can be found in Refs. [25,29,33].
This work aimed to overcome an inherent limitation on the resolution of the DIC technique that could affect the quality of posterior scleral shell deformation measurement and in particular that of the ONH area. When performing a standard stereo-DIC measurement, the adopted stereo angle greatly impacts the in-depth resolution, with larger stereo angles providing increased resolution in the out-of-plane direction [25,29]. On the other hand, relatively small stereo angles would be desirable since the two obtained views are very similar (since they present only slight perspective distortion), and thus, a very high efficiency can be reached when matching corresponding image subsets via DIC algorithms. In standard 3D DIC, since two fixed cameras are used, a tradeoff is reached by adopting a stereo angle ranging between 10 deg to 30 deg (e.g., 15 deg has been adopted for tests on posterior scleral shells [12]). This allows the contour of smooth geometries with sufficient resolution in both in-plane (although with lower resolution along the axis perpendicular to parallax direction) and out-of-plane directions.
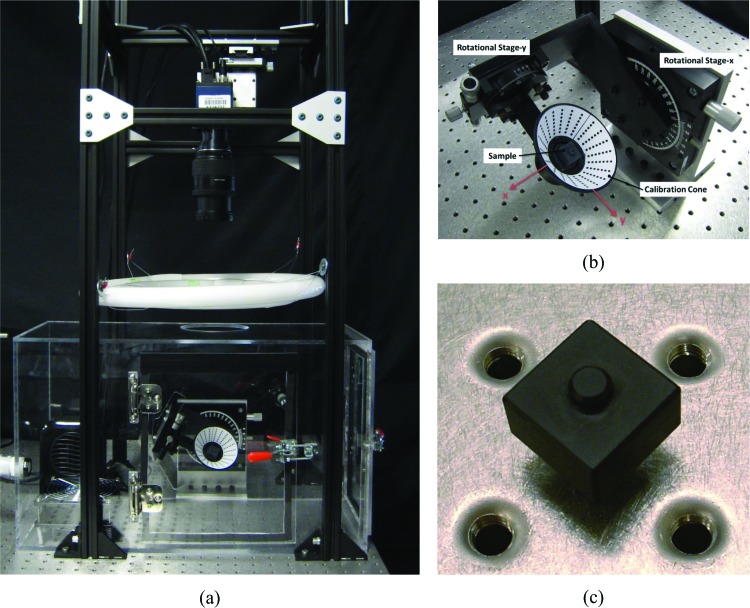
In this work, a virtual large stereo angle has been obtained by implementing a sequential DIC approach (see scheme in Fig. 1). This has been practically obtained by placing a single fixed digital camera above the sample of interest, which is mounted within a conical target containing a printed dot pattern for calibration purposes (see Figs. 2(a) and 2(b)). The sample/conical target assembly is attached to two rotational stages that allow for 90 deg-range of rotation along x and y axes (Figs. 1 and 2). If during the two rotations, two frame sequences are captured from the fixed camera, it is possible to collect two sets of multiple images, thus emulating a user-defined number of virtual cameras looking at the target from different angles along two orthogonal directions of parallax (x and y axes). This allows enhanced performance with respect to a standard 3D DIC system with two cameras placed at a fixed angle along a given direction of parallax (e.g., x axis, red cameras as in the scheme of Fig. 1). In particular, two virtual cameras of the S-DIC system looking at the sample from small-angled stereo views (e.g., using R3-R2 views in Fig. 1) provide very low matching bias between image pairs. Conversely, two virtual views at a very large stereo angle (e.g., using R3-0 views) poorly match because of the large perspective differences, however, they would provide a very high z-axis resolution if they were correctly matched. A correct matching can be obtained by using a sequential approach, i.e., going through the captured sequence of images (R3-R2-R1-0 views) by considering each image as the reference for the next one. In this way, a series of very similar images pairs can be efficiently matched via DIC but, at the end, only the corresponding point sets of the first and last images in the sequence (R3 and 0 views, respectively) are used for reconstruction, thus simulating having a large stereo angle DIC system. Remarkably, this approach has the unique feature to be able to correctly capture shape and deformation of complex-shaped and sharp-sloped areas (such as the sclera portions close to the equator and to the ONH) that would be poorly sampled or not simultaneously present in the two views of a standard stereo-DIC system. These regions have been reported to be locations with low accuracy or absent data with standard DIC measurement [12].
Fig. 2.
(a) Picture of the entire experimental setup for S-DIC measurement; (b) close up view of the sample/conical target assembly; (c) target used for evaluating the metrological performance of the S-DIC system
The entire experimental apparatus for S-DIC (Fig. 2(a)) was set up on a vibration isolation table (Newport M-VIS3036-RG2-325N) holding vertical beams (80/20 Inc.), providing the box framework for a fine x-y-z stage (Edmund Optics NT56-340), allowing mounting and centering of the camera over the target. The digital camera (DALSA Falcon2 BW CMOS sensor with 3328 × 2502 pixel2) and lens (NIKKOR 28-105 mm f/3.5-4.5D zoom) combination, held at a height of 530 mm above the target, are connected to a frame grabber (DALSA Xcelera-CL + PX8 Full) that allows for a high-speed frame rate video file to be captured (up to 90 fps). Two circline fluorescent lights (4100 K) are held above the target at a height of 270 mm with an annular shield on the top to protect the camera sensor from direct light. Using custom-made attachment plates, the two rotational stages for performing S-DIC (Edmund Optics 38-195, 55-029) are mounted perpendicular to the camera axis. Lightweight custom clamps are designed to securely hold the posterior sclera in its physiological shape without leaks (similar to Fig. 1 in Ref. [11]). The clamps have an inlet and outlet for saline pressurization of the inner sclera and have clearance holes for calibration cone attachment. The pressure is monitored using a pressure transducer (Omega PX309-002GV ±.26 mmHg) and actuated using a programmable syringe pump (New Era Pump Systems, Inc. NE-1000) that is controlled through a Labview™ script. Surrounding the sclera and rotational stages is a temperature-controlled custom acrylic humidity chamber with two access doors. The 37 °C heater (Lasko) and 95% humidifier (ETS 5462), read by a dual sensor (ETS 554), use a controller (ETS 5200-240-230) that regulates the air inside of the chamber to replicate physiological conditions. An internal fan is used to evenly disperse the environment and prevent condensation on the sclera.
To evaluate the performance of the S-DIC system, a preliminary complete benchmark of its metrological performance was run on an object of known complex geometry. Finally, the enhanced capabilities of S-DIC with respect to standard 3D DIC was demonstrated with measurement on a human posterior sclera and optic nerve.
2.2. Sequential-DIC Metrological Characterization.
To get an idea of how the metrological performances of DIC techniques cannot be generalized since they are strongly related to the specific experimental conditions, the reader can refer to the extensive benchmark work reported in Refs. [25,33]. In these papers, synthetic speckle images [33] and a flat object [25] are used to assess the metrological performance of DIC under nominally ideal conditions. However, it is a correct practice to evaluate the metrological characteristics of a given DIC-based experiment before running each test of interest and at each change of a given critical parameter value as done for example in Refs. [12,30].
According to this practice and to test and validate the enhanced performance of the newly developed S-DIC with respect to standard 3D DIC when measurement on a complex-shaped sample is entailed, a complete set of measurements (shape, displacement, and strain) was carried out on a target sample of known shape. The complex geometry of the target (a square prism with an extruded cylinder, see Fig. 2(c)) was designed to closely mimic the critical areas of measurement (scleral portions close to the equator and optic nerve) and was precisely machined from black delrin and measured to ±12.7 μm accuracy with a coordinate-measuring machine (CMM) (Tesa Micro-Hite).
In order to perform DIC matching between image pairs of the surface of the sample, a properly sized random speckle pattern with a broad range of gray-scale values is necessary and was applied using a fine-tipped air brush. The protocol for creating the optimal speckle pattern was assessed through several trials followed by sensitivity analysis according to the guidelines reported in Ref. [29]. All setup conditions (camera parameters, lighting, etc.) were optimized for a test on a typical human sclera and remained unchanged for all the experiments reported in this paper.
The calibration target was fixed to a small tip/tilt platform (Newport MM-075-HEX) centered within the calibration cone (see Figs. 2(a) and 2(b)). Two series of image sequences were then captured with the S-DIC system: a first set with the sample in a given position named “reference configuration” and a second set with the sample slightly tilted through the tip/tilt mount (“deformed configuration”). This allowed the extraction of the following information: (i) shape reconstruction, (ii) full surface deformation of the target after the rigid body rotation, and (iii) full surface strain field. In regards to the latter measurement, this is quite a standard protocol for DIC-based measurement [30,34,35] often referred as the “null strain test” and it is an effective method to quantify the error in strain calculation in a given DIC-based measurement. Strain resulting from a rigid-body motion, in fact, is equal to zero; thus, any nonnull strain component revealed through this test is representative of the measurement accuracy of the system. In this work, we chose to apply an out-of-plane rigid body rotation to the sample with a tip/tilt platform since rotations have been demonstrated to have the strongest influence on the strain error [34,35].
A typical set of images for S-DIC implementation is reported in Fig. 3. A set of ten evenly spaced images are extracted from the entire frame sequence (250 frames) corresponding to a rotation of [-θFar,-θClose] along the y axis (see D sequence in Fig. 1), and analogously another three sets of ten images each were extracted for the range [θFar, θClose] along the y axis (U), the range [−θFar,−θClose] along the x axis (R), and the range [θFar,θClose] along the x axis (L), where angles θFar and θClose depend on the sample geometry. In this work, θClose = 15 deg and θFar = 45 deg for the calibration target, and θClose = 0 deg and θFar = 30 deg for the human scleral shell.
Fig. 3.

The D set of images for S-DIC measurement on the target in Fig. 2(c)
A custom-shaped regular grid of points (five pixels pitch) was drawn on the first image of the set to fill the area of interest for the measurement. An in-house developed DIC routine coded in the Matlab™ environment [30] was then used to correlate the point grid through the ten images of each set with a 0.1 pixel resolution by using a template window of 9 × 9 pixel2 and an analysis window of 21 × 21 pixel2. With the camera/lens settings used for all the experiments in this work, a 21 mm diameter area of analysis corresponds to an area of 687 pixel diameter. At this magnification, each pixel, hence, corresponds to a real area of 0.03 × 0.03 mm2; therefore, the analysis subset size is 0.64 × 0.64 mm2.
Each image contains information for calibrating the camera in each viewing position with respect to a unique global reference system. The 45 deg concave cone always present in the image, in fact, has a laser printed regular dot pattern on adhesive waterproof paper where each dot has known x, y, z location with respect to a global reference system, having the z axis coaxial with the cone and origin in the cone vertex (see close view in Fig. 2(b)). Each image is, hence, processed in order to get the dot centroid positions, and the direct linear transformation method [30,36] is used to extract the corresponding camera calibration parameters. The first and the tenth point grids of a given set of S-DIC images (e.g., the D sequence) are used to reconstruct the 3D shape of the selected portion of the sample via triangulation [29,32]. Analogously, complementary parts of the target fully imaged in the remaining U, R, and L sets are matched and reconstructed. Having the calibration cone moving with the sample allows the four reconstructed portions to be automatically merged and reconstructed in the same reference system. If the same point grid is tracked through a series of deformed configurations of interest, the full-field 3D deformation field over the sample surface can be obtained.
To compare the metrological performance of the new proposed S-DIC method with respect to a standard stereo-DIC system, two image pairs were extracted from the same image set simulating two 3D-DIC systems with a small stereo angle (2 deg, image pairs 3_1–3_2) and with a large stereo angle (14 deg, image pairs 3_1–3_6). A 2 deg stereo angle is not the value commonly adopted in standard-DIC [12], but it was the largest angle that allowed a satisfactory reconstruction for an object of this complexity, as explained later.
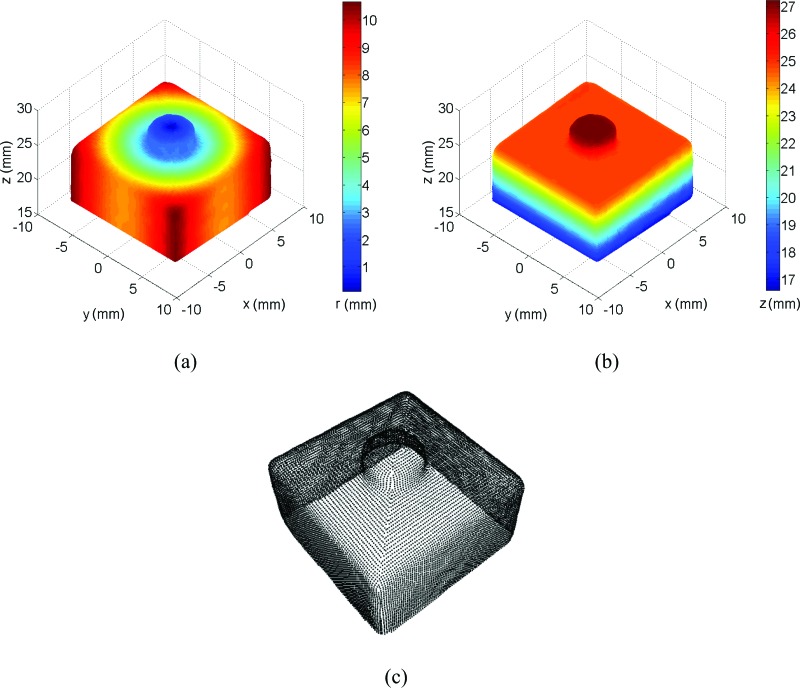
Figure 4 shows the calibration target shape reconstructed with S-DIC (14 deg, image pairs 3_1–3_6) in terms of radius r (mm) (here defined as r = (x 2 + y 2)0.5) and z coordinate (mm). All the results reported in this section are raw data, i.e., without any kind of smoothing procedure applied to the original data. The 3D plots show how the proposed method fully contoured the target shape even in critical areas with sharp slopes and corners (lateral surface and small cylinder on the top) on the whole 360 deg view.
Fig. 4.
The reconstructed calibration target: (a) radius and (b) z coordinate, (c) point cloud
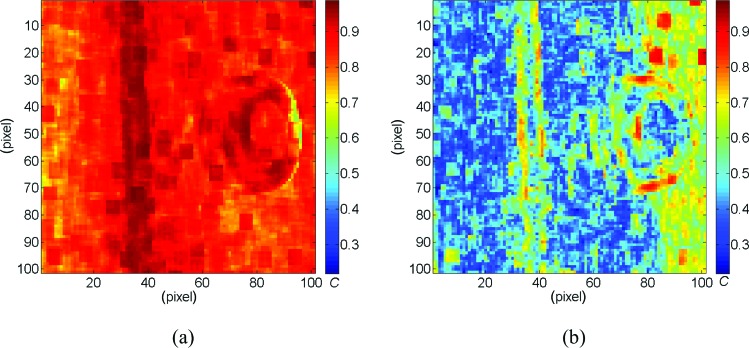
Figure 5 shows maps of the normalized cross correlation coefficient C [30] over the area of analysis for the small angle standard-DIC system (named DIC-SA in the rest of the paper, Fig. 5(a)) and the large angle standard-DIC system (DIC-LA, Fig. 5(b)). As expected, the image pairs 3_1–3_6 were too different to be correlated with sufficient accuracy (C > 0.9) and to bring to a correct reconstruction; hence, only the results related to the DIC-SA will be reported and compared to S-DIC performance.
Fig. 5.
Maps of the correlation coefficient C for the DIC-SA (a) and DIC-LA (b) systems. Values closer to 1 indicate an accurate correlation. For DIC-SA, one virtual camera was at 45 deg (3_1) and other at 43 deg (3_2). For DIC-LA, one virtual camera was at 45 deg (3_1) and other at 31 deg (3_6).
A detailed discussion about the need to reduce the stereo angle to ensure that subset matching between views is achievable can be found in Ref. [29] where a 3D standard-DIC measurement is performed on a bending specimen.
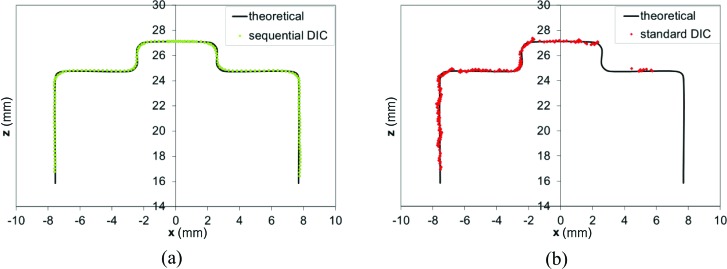
In Fig. 6, the plots of the x-z central sections of the target as reconstructed from S-DIC and DIC-SA are reported (only the left side of the target is present in both views of the DIC-SA system, see Fig. 5) superimposed over the theoretical target section. Over the entire left y-z face of the target (∼2000 points), the DIC-measured side length was calculated as the Euclidean distance between the points on the left face (at x ∼ −7.7 mm), and their projection on a best-fit plane of the points of the opposite face (at x ∼ +7.7 mm). This resulted in a value of d measured = 15.368 ± 0.017 mm. The percent error with respect to the side length of the unpainted calibration target d unpainted = 15.316 ± 0.0127 mm (from CMM measurement) is 0.34%, while it decreases to 0.17% if the side length of the painted calibration target d painted = 15.341 ± 0.004 mm (from a measurement with a micrometer (Mitutoyo 293–348) in ten evenly distributed points over the surface) is taken as reference.
Fig. 6.
Central x-z sections of the target as reconstructed by the S-DIC (a) and the DIC-SA (b) systems superimposed to the theoretical target section. For DIC-SA, one virtual camera was at 45 deg (3_1) and other at 43 deg (3_2).
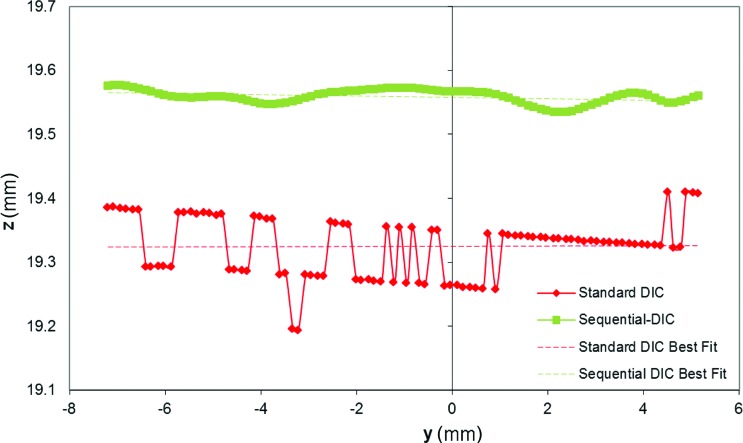
To evaluate the uncertainty in the out-of-plane position measurement, a line of control points at z ∼ 19.3 mm on the left y-z face of the target (vertical face at x ∼ 7.7 mm in Fig. 6(a) and 6(b)) was considered for comparing the two methods. As evident in Fig. 7, DIC-SA plot shows the typical stepwise trend typical of low-resolution measurement with a smallest perceivable change in the z-coordinate of 83 μm and an uncertainty of 47 μm (calculated as the standard deviation from the best-fit line). For the S-DIC plot, the uncertainty in the out-of-plane position measurement is 8 μm (the maximum deviation from the best fit line is 20 μm).
Fig. 7.
Plot of a horizontal line of control points on the left y-z vertical face of the target as reconstructed by standard-DIC and S-DIC (shifted upward for clarity of representation)
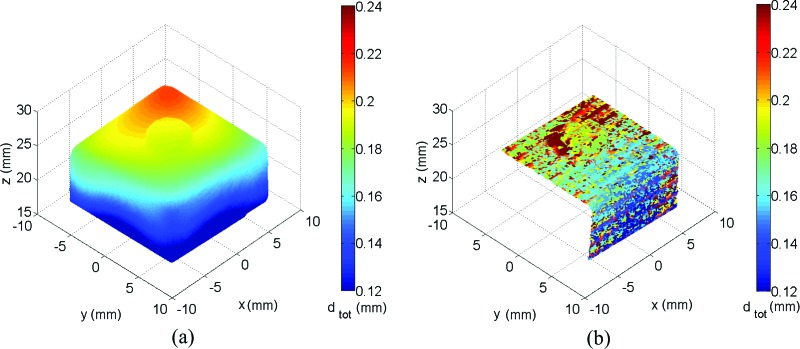
Figure 8 is a synthesis of the enhanced metrological capabilities in shape and deformation measurement of the S-DIC method with respect to a standard stereo-DIC system using the same experimental conditions (except for the stereo angle) and same data processing routines. It should be emphasized here that these enhanced performances are referred to the case of complex-shaped objects, i.e., when the adoption of a small stereo angle is mandatory for standard-DIC to achieve matching between the two views [29]. If S-DIC and standard DIC are used to contour a flat object, the data processing yields to comparable results (see supplemental material to be posted at a later date).
Fig. 8.
Magnitude of the norm of the total displacement dtot after a rigid body rotation of the calibration target plotted on the measured shape with the S-DIC (a) and the DIC-SA (b) systems
To perform the null strain test and calculate strain maps from measurement grid data, a common procedure in biomechanics has been used [28,30,37,38]. Briefly, the Green–Lagrange strain tensor E is computed for each triplet of control points via the definition E = 0.5 (F T F-I) where F is the deformation gradient tensor. Components of F were calculated for each flat triangular domain delimited by A, B, and C points by assuming the associated surface deformation to be homogeneous, i.e., , where and in the reference configurations change to vectors and in a given deformed configuration (for a detailed depiction please see Fig. 6 in Ref. [38]). If , and are expressed with respect to a local 2D basis aligned to the meridional and circumferential directions passing through the centroid of each triplet, the four components of the deformation gradient F can be determined from the following system of four equations:
| (1a) |
| (1b) |
The full-surface maps of the components of the Green–Lagrange surface strain tensor E (denoted as circumferential, meridional, and shear) so calculated have a strong local character since they are not extracted by analytically differentiating the smoothed displacement fields over a window of given extension (usually 9 × 9 points) as commonly done in DIC-based measurement [25,29]. In other words, starting from raw data point positions in the reference and deformed configurations, no data smoothing is needed to extract surface strains with the above-described procedure. This implies that the data is more susceptible to experimental noise but also that the chosen control points triangular mesh size defines the actual spatial resolution of the strain calculation. This feature is particularly relevant in the presence of large gradients of deformation and for a subsequent implementation of subdomain FE-based inverse characterization methodologies [14,26] to capture tissue heterogeneity. The sensitivity of the strain calculation to the spacing of control points in a region of fairly uniform strain, in an area having a strain concentration, and in an area having a marked gradient of strain has been studied and described in detail in Ref. [31].
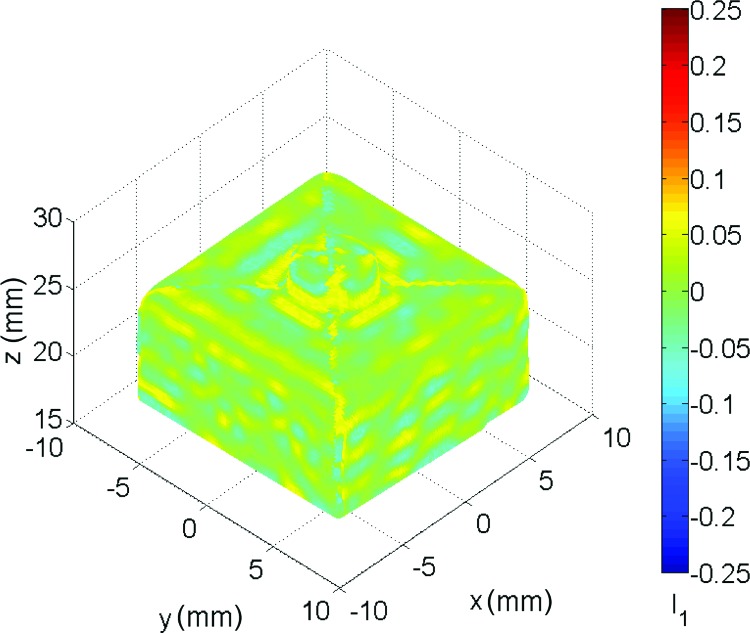
Noisy strain data can be eventually smoothed in a 3D computer-aided design environment by using nonuniform rationale B-splines (NURBS) that, with a proper control of surface span and stiffness, can easily remove outliers without altering the local fluctuation of the parameter of interest (deformation or strain) [18,30,31,39]. Given the complex shape of the calibration target, we express the results of the null strain test in terms of a coordinate-free measure, the first invariant of E defined as I 1 = tr(E) (Fig. 9). The raw strain distribution value is 4.5·10−3 ± 24·10−3 with peaks in the boundary areas between the four D, U, L, and R patches where different meshes merge (see point cloud in Fig. 4(c)) and, hence, tessellation errors occur. Smoothing the displacement data results in a strain value of 0.8·10−3 ± 11·10−3.
Fig. 9.
Distribution of the first invariant of the Green–Lagrange strain tensor as resulting from a rigid body rotation of the calibration target
Finally, the calculus of the deformation gradient tensor F allows for the calculation of the angle of rigid body rotation through [28]
| (2) |
for all the triangular domains over the measured surface. It is, hence, possible to evaluate the error for out-of-plane rigid-body-rotation measurement for the two considered methods as the standard deviation of the distribution of over the left y-z side of the target, being ±0.24 deg for S-DIC and ±18.69 deg for DIC-SA (raw data). Consistently smoothing the displacement data brings to an error value of ±0.09 deg for S-DIC and ±5.31 deg for DIC-SA.
2.3. Test on a Human Posterior Scleral Shell Under Inflation.
Once the S-DIC system was tested and validated, the developed procedure was applied to a human posterior scleral shell. The donor was a 98-year-old female of African descent. To keep the sclera as close to physiological conditions as possible, the globe is stored in cooled saline after enucleation. During dissection procedures, the sclera is kept hydrated throughout as the globe is first cut into a hemisphere with the ONH centered. The retina, choroid, and vitreous humor are removed from the inside of the posterior shell as well to isolate the sclera during pressurization. Any excess sclera that does not fit into the clamps is removed and a 3D printed mold was made to ensure similar cuts for every ocular sample.
To make the ON easier to image with the DIC system, the ONH was placed in the direct center of the clamps with the superior region orientation known. The optic nerve was cut straight with approximately 2 mm left. This amount prevented large macrodisplacements of the ON during testing and allowed for the ON to always be vertical with respect to the posterior shell.
To create the speckle pattern, black and white Indian ink (Dr. Ph. Martin's Bombay India Ink), applied through a fine spray gun, is used since it has been proven to not significantly affect the mechanical properties of biological tissues through biaxial testing [31]. The sclera is sprayed with an initial white speckle, allowed time to dry slightly, and then sprayed with the sparser black speckle. The sclera is then moved into the humidity chamber that is already at 37 °C and 95% humidity and left for 30 min for the Indian ink to settle properly.
Once the clamps are attached to the rotary stages and calibration cone, the automated pressure regulation system is attached. An electronic pressure transducer and manual pressure gauge are placed at the same height as the scleral sample. Preconditioning is applied to the sample where the pressure fluctuates ten times between 5 mmHg and 45 mmHg at a rate of 5 mmHg/s [9,15,17]. The sample is held at 5 mmHg for 10 min to eliminate any viscoelastic effects [40], and the pressure infuse rate is set to.05 mmHg/s to keep within ±.26 mmHg worth of pressure fluctuation. A zero mmHg pressure state could not be considered as the reference state since a minimum of 5 mmHg pressure was needed to recover the scleral shell from its collapsed shape.
Four pressure steps were considered: 5–15–30–45 mmHg, however, in this paper only the results related to the deformed state at 15 mmHg are reported to illustrate the capability of the system to capture very small deformation. Image data was acquired and processed according to the procedure described in Sec. 2.2.
3. Results
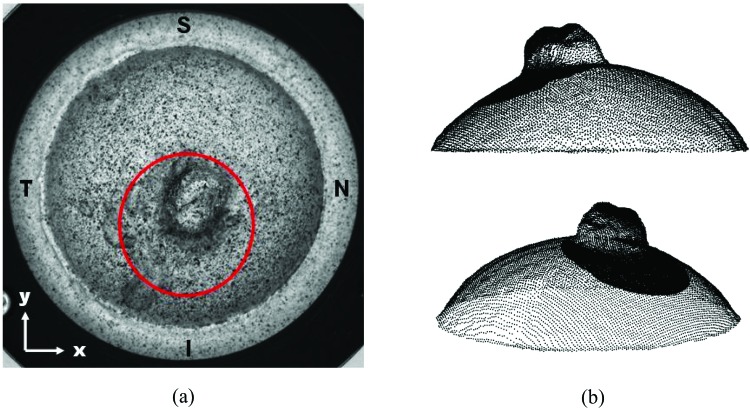
Figure 10 shows the human posterior scleral sample tested in this work mounted in the inflation test rig and its complete 3D reconstruction (raw data) at 5 mmHg obtained with the sequential-DIC approach. Two control point grids are considered for the analysis: a five pixel pitch grid for the entire scleral surface and a finer grid (two pixel pitch) for the ONH and part of the peripapillary sclera in the inferior region (this region will be referred as the “ONH” in the rest of the paper).
Fig. 10.
The human posterior scleral sample tested in this work: S stands for superior, T for temporal, N for nasal, and I for inferior. Circled with red is the area at higher spatial resolution considered for the ONH measurement (a). Two views of the reconstructed scleral shell point cloud at 5 mmHg (b) with superimposed the more dense data points of the ONH area.
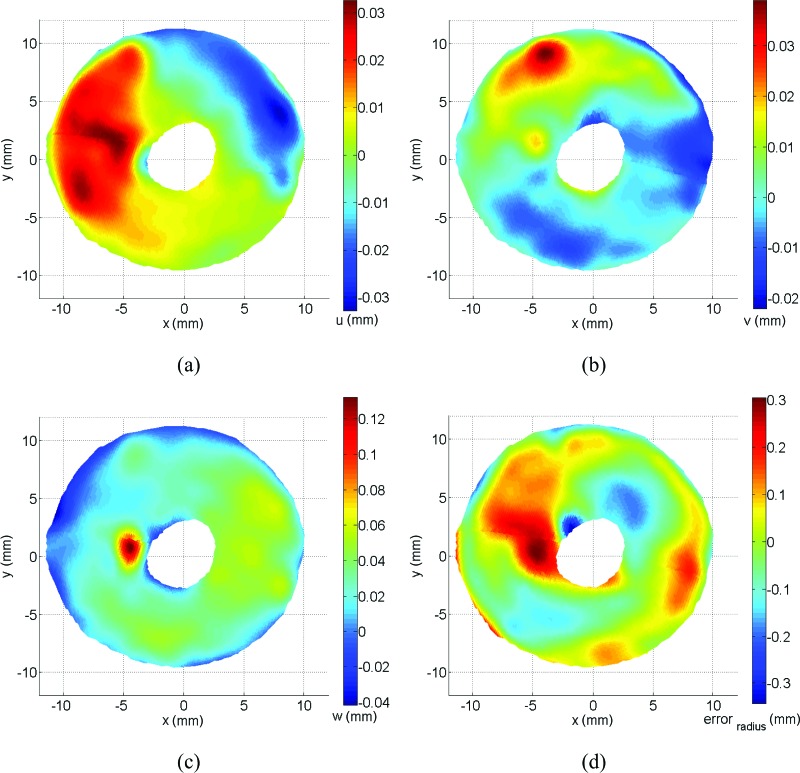
Figure 11 illustrates the full-surface displacement fields (top view) between pressure steps of 5 mmHg and 15 mmHg, most evident in the z direction, with the optic nerve head region not reported here for display purposes. No anatomical distinction in the optic nerve head region is trying to be established for the arbitrary cut seen in these figures. All displacements and strains are continuous between these boundaries and only shown this way for clarity of illustration. The 3D contour plots in Fig. 11 show the general aspect of the displacement maps typical of a circular inflated membrane except for a particular localized region of large displacement in the z direction in the temporal region (see Fig. 11(c)). In the online supplementary material, there is an image sequence (undeformed/deformed) where the displacement in this region can be seen distinctly. In Fig. 11(d), the error in radius for the scleral shell with respect to the best-fitting sphere is shown to highlight the deviation from an idealized spherical shape, which is very large close to the ONH as also observed in Coudrillier et al. [12].
Fig. 11.
Top view of the scleral displacement fields between 5 and 15 mmHg. Displacements in x, y, z directions are labeled as u (a), v (b), w (c), respectively, and error in radius with the best-fitting sphere is shown in (d).
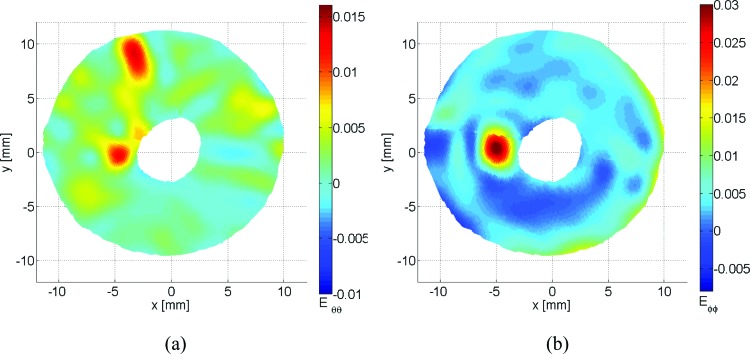
In order to obtain scleral strain maps, the Green strain tensor was calculated following the protocol described earlier. In Fig. 12, the sclera experienced higher meridional strains than circumferential, with a mean strain of 4.09·10−3 ± 4.07·10−3 standard deviation in the meridional direction and 1.82·10−3 ± 2.94·10−3 in the circumferential direction. The maximum strain experienced in the circumferential direction was 18.23·10−3 with a minimum of −15.37·10−3 compared to 40.85·10−3 and −11.27·10−3 in the meridional direction.
Fig. 12.
Circumferential strain Eθθ (a) and meridional stain Eφφ (b) for the posterior scleral shell
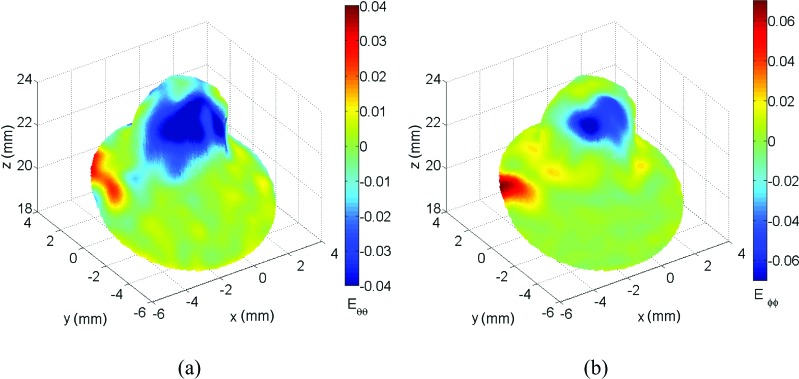
Finally, Fig. 13 shows the unique capability of S-DIC to capture the ONH complex shape and track its deformation. In these figures, it can be seen how the ON experiences large meridional compressive strain while the ONH region is expanding out at the peripapillary sclera/ON boundary. In the circumferential direction, a similar compression is occurring but continuing further down the ON than in the meridional direction. This interesting behavior is clearly visible in the image sequence available as supplemental material to be linked here April 2014.
Fig. 13.
Circumferential strain Eθθ (a) and meridional strain Eφφ (b) for the ONH (region circled in red in Fig. 10(a))
4. Discussion
This study developed a new sequential 3D DIC approach for quantifying the displacements and strains in pressure inflated posterior ocular poles. This technique uses a single fixed camera and has the ability to map the deformations of the entire sclera, including the complex-shaped optic nerve head region by imaging the posterior sclera at multiple angles in two orthogonal axes of parallax.
The main advantage of S-DIC is the increased out-of-plane resolution and ability to reconstruct the entire scleral surface, even where shape discontinuities and sharp slopes are present. In particular, we demonstrated the unique capability of this approach in contouring complex 3D shapes with an accuracy of 0.17%, as well as highlighting the improved performance of the S-DIC with an analogous (since the same images have been used) standard-DIC system. Moreover, our analysis distinguished the results from the dramatic effects of commonly adopted smoothing schemes by showing the results in terms of raw data.
It is well known that ESPI is an inherently sensitive technique with a deformation measurement resolution down to fractions of the wavelength of the laser light and an uncertainty of ±16 nm [9,17]. However, we agree with the generally acknowledged rationale that a comparison of the relative merits in terms of functional performance of ESPI and S-DIC can only be done after carrying out a complete benchmarking under the same experimental conditions [20,23,25–27]. In particular, Patterson et al. [23] specified that although a calibration procedure provides a precise indication of the accuracy and uncertainty that can be expected when using a given technique, special attention should be paid when going from a “standard test” to the actual test, especially in the presence of complex strain fields.
To the best of our knowledge, there have been no previous studies that map ONH deformations (including the optic nerve) between pressure steps. This technique may lead to the identification of important variables as it pertains to ONH deformations and eventually glaucomatous damage. On average, meridional strains are higher than circumferential strains in the sclera, which is expected due to previous findings in collagen microstructure alignment [6,14,16,18,41,42]. The distributions of circumferential and meridional strain reported here are also similar to those patterns shown in Refs. [12,14,17]. In the temporal region, among other locations, there is an area of significantly higher strain [14].
It is unknown how the ONH strains reported here will correlate with lamina cribrosa (LC) deformation, however it can be assumed that such measurements may eventually provide further information on the mechanical environment of the optic nerve as it exits the posterior ocular globe, which may be related to retinal ganglion cell death [1,3,6,8–10,43–48]. While the results reported here regarding ONH strain values do not take into account ON physiological tension or cerebral spinal fluid pressure [49,50], these strains could be an important factor in understanding the mechanisms of how the LC deforms under pressure and its relationship with the peripapillary sclera. With the midposterior sclera having identical strains between glaucoma and normal specimens [12], it is of critical importance to get accurate displacement values in the peripapillary region with minimal error. Quantifying displacements between normal and glaucomatous eyes in the peripapillary-ON transition region may provide more information on LC/scleral canal deformation and perhaps the pathology of glaucoma.
Sigal et al. [5] suggests that the pia is the third-most influential material input factor in ocular material models, depending on geometry. The S-DIC method could provide specific displacements for the pia that would be most important around the interface with the peripapillary sclera. In monkey experimental glaucoma, it has been seen that the lamina cribrosa migrates further into the sclera and occasionally into the pial sheath [51]. It could, therefore, be important to further study the pial sheath and other connective tissues in order to determine how the biomechanical properties of these tissues influence ONH biomechanics.
There are some important limitations of the S-DIC technique worth mentioning. With the time-consuming nature of this method, it is not possible to measure the viscoelastic properties over the entire sclera [12]. Before the imaging process, the sclera was allowed 10 min [40] to reach steady-state conditions before any measurements began. In the next step, imaging at each pressure state required 30 min for the manual rotation of the two rotational stages and for acquiring the image sequences (40 min total per pressure). Similar to other pressure inflation testing, the entire range of physiological ocular pressure was explored in this testing since dynamic loading could not be performed with a continuous displacement measurement. Ongoing work in our laboratory is aimed at addressing this limitation of S-DIC.
The implementation of this technique will lead to more accurate displacements of the ONH region, including the entire posterior sclera, which could lead to more accurate finite element modeling of this region. Combined with techniques to measure tissue thickness, such as ultrasound [12,14], individual eye-specific geometry and entire outer surface displacements at multiple pressure steps could provide more information on how the ONH is involved in glaucomatous damage. Combinations of findings with microstructural data, taken from small angle light scattering (SALS) [6,42] or wide angle x-ray scattering (WAXS) [14,41], may also lead to more accurate material properties/models in this region after being analyzed with inverse finite element analysis (FEA). Researchers with DIC equipment can inexpensively modify systems to incorporate this technique into measurements as long as proper care is taken to measure the accuracy of the individual system. This technique can also be used as a means to measure outer surface geometry or deformation of different objects and is not restricted to ocular tissue. The highly dense set of data available for the entire surface of the sample makes this technique particularly suitable for implementing hybrid experimental-computational methods to characterize regionally varying properties of tissue or organ [26,52–54].
In summary, S-DIC can improve upon the existing 3D DIC steady-state techniques for measuring posterior ocular deformation. This technique can capture the complex geometry of the ONH surface and peripapillary sclera to a high spatial resolution, which is comparable to previous studies and in the appropriate resolution range for the physiological pressures/strains being applied. In conjunction with inverse FEA, S-DIC will provide accurate strain data for the entire exterior surface of the posterior sclera that can be used to quantify regional, nonlinear, and heterogeneous material properties of human ocular tissue.
Acknowledgment
Funding for this work was provided by NIH grant 1R01EY020890 to JPVG. The authors would like to acknowledge the support of the Alabama Eye Bank and Dr. Christopher Girkin and Dr. Christine Curcio for their help in obtaining the human donor tissue.
Contributor Information
Jeffrey D. Pyne, Department of Aerospace and, Mechanical Engineering, BIO5 Institute, University of Arizona, Tucson, AZ 85721.
Katia Genovese, School of Engineering, University of Basilicata, Potenza 85100, Italy.
Luciana Casaletto, School of Engineering, University of Basilicata, Potenza 85100, Italy.
Jonathan P. Vande Geest, Associate Professor, Department of Aerospace and, Mechanical Engineering, Biomedical Engineering Graduate, Interdisciplinary Program, Department of Biomedical Engineering, BIO5 Institute, University of Arizona, Tucson, AZ 85721, e-mail: jpv1@email.arizona.edu.
References
- [1]. Downs, J. C. , Roberts, M. D. , and Burgoyne, C. F. , 2008, “Mechanical Environment of the Optic Nerve Head in Glaucoma,” Optom. Vision Sci., 85(6), pp. 425–435. 10.1097/OPX.0b013e31817841cb [DOI] [PMC free article] [PubMed] [Google Scholar]
- [2]. Sigal, I. A. , Flanagan, J. G. , Tertinegg, I. , and Ethier, C. R. , 2009, “Modeling Individual-Specific Human Optic Nerve Head Biomechanics. Part I: IOP-Induced Deformations and Influence of Geometry,” Biomech. Model Mechanobiol., 8(2), pp. 85–98. 10.1007/s10237-008-0120-7 [DOI] [PubMed] [Google Scholar]
- [3]. Burgoyne, C. F. , Downs, J. C. , Bellezza, A. J. , Suh, J. K. , and Hart, R. T. , 2005, “The Optic Nerve Head as a Biomechanical Structure: A New Paradigm for Understanding the Role of IOP-Related Stress and Strain in the Pathophysiology of Glaucomatous Optic Nerve Head Damage,” Prog. Retin. Eye Res., 24(1), pp. 39–73. 10.1016/j.preteyeres.2004.06.001 [DOI] [PubMed] [Google Scholar]
- [4]. Bellezza, A. J. , Hart, R. T. , and Burgoyne, C. F. , 2000, “The Optic Nerve Head as a Biomechanical Structure: Initial Finite Element Modeling,” Invest. Ophthalmol. Vis. Sci., 41(10), pp. 2991–3000. [PubMed] [Google Scholar]
- [5]. Sigal, I. A. , Flanagan, J. G. , Tertinegg, I. , and Ethier, C. R. , 2009, “Modeling Individual-Specific Human Optic Nerve Head Biomechanics. Part II: Influence of Material Properties,” Biomech. Model Mechanobiol., 8(2), pp. 99–109. 10.1007/s10237-008-0119-0 [DOI] [PubMed] [Google Scholar]
- [6]. Yan, D. , McPheeters, S. , Johnson, G. , Utzinger, U. , and Vande Geest, J. P. , 2011, “Microstructural Differences in the Human Posterior Sclera as a Function of Age and Race,” Invest. Ophthalmol. Vis. Sci., 52(2), pp. 821–829. 10.1167/iovs.09-4651 [DOI] [PMC free article] [PubMed] [Google Scholar]
- [7]. Sigal, I. A. , Flanagan, J. G. , and Ethier, C. R. , 2005, “Factors Influencing Optic Nerve Head Biomechanics,” Invest. Ophthalmol. Vis. Sci., 46(11), pp. 4189–4199. 10.1167/iovs.05-0541 [DOI] [PubMed] [Google Scholar]
- [8]. Sander, E. A. , Downs, J. C. , Hart, R. T. , Burgoyne, C. F. , and Nauman, E. A. , 2006, “A Cellular Solid Model of the Lamina Cribrosa: Mechanical Dependence on Morphology,” ASME J. Biomech. Eng., 128(6), pp. 879–889. 10.1115/1.2354199 [DOI] [PubMed] [Google Scholar]
- [9]. Fazio, M. A. , Grytz, R. , Bruno, L. , Girard, M. J. , Gardiner, S. , Girkin, C. A. , and Downs, J. C. , 2012, “Regional Variations in Mechanical Strain in the Posterior Human Sclera,” Invest. Ophthalmol. Vis. Sci., 53(9), pp. 5326–5333. 10.1167/iovs.12-9668 [DOI] [PMC free article] [PubMed] [Google Scholar]
- [10]. Quigley, H. A. and Cone, F. E. , 2013, “Development of Diagnostic and Treatment Strategies for Glaucoma Through Understanding and Modification of Scleral and Lamina Cribrosa Connective Tissue,” Cell Tissue Res, 353(2), pp. 231–244. 10.1007/s00441-013-1603-0 [DOI] [PMC free article] [PubMed] [Google Scholar]
- [11]. Keyes, J. T. , Yan, D. , Rader, J. H. , Utzinger, U. , and Vande Geest, J. P. , 2011, “A Gimbal-Mounted Pressurization Chamber for Macroscopic and Microscopic Assessment of Ocular Tissues,” ASME J. Biomech. Eng., 133(9), p. 095001. 10.1115/1.4004921 [DOI] [PMC free article] [PubMed] [Google Scholar]
- [12]. Coudrillier, B. , Tian, J. , Alexander, S. , Myers, K. M. , Quigley, H. A. , and Nguyen, T. D. , 2012, “Biomechanics of the Human Posterior Sclera: Age- and Glaucoma-Related Changes Measured Using Inflation Testing,” Invest. Ophthalmol. Vis. Sci., 53(4), pp. 1714–1728. 10.1167/iovs.11-8009 [DOI] [PMC free article] [PubMed] [Google Scholar]
- [13]. Boyce, B. L. , Grazier, J. M. , Jones, R. E. , and Nguyen, T. D. , 2008, “Full-Field Deformation of Bovine Cornea Under Constrained Inflation Conditions,” Biomaterials, 29(28), pp. 3896–3904. 10.1016/j.biomaterials.2008.06.011 [DOI] [PubMed] [Google Scholar]
- [14]. Coudrillier, B. , Boote, C. , Quigley, H. A. , and Nguyen, T. D. , 2013, “Scleral Anisotropy and Its Effects on the Mechanical Response of the Optic Nerve Head,” Biomech. Model Mechanobiol., 12(5), pp. 941–963. 10.1007/s10237-012-0455-y [DOI] [PMC free article] [PubMed] [Google Scholar]
- [15]. Girard, M. J. , Downs, J. C. , Bottlang, M. , Burgoyne, C. F. , and Suh, J. K. , 2009, “Peripapillary and Posterior Scleral Mechanics—Part II: Experimental and Inverse Finite Element Characterization,” ASME J. Biomech. Eng., 131(5), p. 051012. 10.1115/1.3113683 [DOI] [PMC free article] [PubMed] [Google Scholar]
- [16]. Girard, M. J. , Suh, J. K. , Bottlang, M. , Burgoyne, C. F. , and Downs, J. C. , 2009, “Scleral Biomechanics in the Aging Monkey Eye,” Invest. Ophthalmol. Vis. Sci., 50(11), pp. 5226–5237. 10.1167/iovs.08-3363 [DOI] [PMC free article] [PubMed] [Google Scholar]
- [17]. Fazio, M. A. , Grytz, R. , Morris, J. S. , Bruno, L. , Gardiner, S. K. , Girkin, C. A. , and Downs, J. C. , 2013, “Age-Related Changes in Human Peripapillary Scleral Strain,” Biomech . Model Mechanobiol, pp. 1–13. 10.1007/s10237-013-0517-9 [DOI] [PMC free article] [PubMed] [Google Scholar]
- [18]. Grytz, R. , Fazio, M. A. , Girard, M. J. , Libertiaux, V. , Bruno, L. , Gardiner, S. , Girkin, C. A. , and Crawford Downs, J. , 2013, “Material Properties of the Posterior Human Sclera,” J. Mech. Behav. Biomed. Mat., 29(1), pp. 602–617. 10.1016/j.jmbbm.2013.03.027 [DOI] [PMC free article] [PubMed] [Google Scholar]
- [19]. Yang, L. X. , and Ettemeyer, A. , 2003, “Strain Measurement by Three-Dimensional Electronic Speckle Pattern Interferometry: Potentials, Limitations, and Applications,” Opt. Eng., 42(5), pp. 1257–1266. 10.1117/1.1566781 [DOI] [Google Scholar]
- [20]. Wang, Y. , Thomas, D. , Zhang, P. , Yokota, H. , and Yang, L. , 2008, “Whole Field Strain Measurement on Complex Surfaces by Digital Speckle Pattern Interferometry,” Mater. Eval., 66(5), pp. 507–512. [PMC free article] [PubMed] [Google Scholar]
- [21]. Ruiz, P. D. , and Kaufmann, G. H. , 1998, “Evaluation of a Scale-Space Filter for Speckle Noise Reduction in Electronic Speckle Pattern Interferometry,” Opt. Eng., 37(8), pp. 2395–2401. 10.1117/1.601983 [DOI] [Google Scholar]
- [22]. Chen, H. , Su, R. , Kwan, A. , and Fok, A. , 2013, “Correction of Strain Errors Induced by Small Rigid-Body Motions in Electronic Speckle Pattern Interferometry Measurement,” HKIE Trans., 20(1), pp. 2–11. 10.1080/1023697X.2013.785073 [DOI] [Google Scholar]
- [23]. Patterson, E. A. , Hack, E. , Brailly, P. , Burguete, R. L. , Saleem, Q. , Siebert, T. , Tomlinson, R. A. , and Whelan, M. P. , 2007, “Calibration and Evaluation of Optical Systems for Full-Field Strain Measurement,” Opt. Lasers Eng., 45(5), pp. 550–564. 10.1016/j.optlaseng.2006.08.012 [DOI] [Google Scholar]
- [24]. Bingleman, L. W. , and Schajer, G. S. , 2011, “DIC-Based Surface Motion Correction for ESPI Measurements,” Experiment. Mech., 51(7), pp. 1207–1216. 10.1007/s11340-010-9405-8 [DOI] [Google Scholar]
- [25]. Ke, X. D. , Schreier, H. W. , Sutton, M. A. , and Wang, Y. Q. , 2011, “Error Assessment in Stereo-Based Deformation Measurements Part II: Experimental Validation of Uncertainty and Bias Estimates,” Experiment. Mech., 51(4), pp. 423–441. 10.1007/s11340-010-9450-3 [DOI] [Google Scholar]
- [26]. Seshaiyer, P. , and Humphrey, J. D. , 2003, “A Sub-Domain Inverse Finite Element Characterization of Hyperelastic Membranes Including soft Tissues,” ASME J. Biomech. Eng., 125(3), pp. 363–371. 10.1115/1.1574333 [DOI] [PubMed] [Google Scholar]
- [27]. Peters, W. H. , and Ranson, W. F. , 1982, “Digital Imaging Techniques in Experimental Stress-Analysis,” Opt. Eng., 21(3), pp. 427–431. 10.1117/12.7972925 [DOI] [Google Scholar]
- [28]. McCulloch, A. D. , Smaill, B. H. , and Hunter, P. J. , 1987, “Left-Ventricular Epicardial Deformation in Isolated Arrested Dog Heart,” Am. J. Physiol., 252(1), pp. H233–H241. [DOI] [PubMed] [Google Scholar]
- [29]. Sutton, M. A. , Orteu, J.-J. , and Schreier, H. W. , 2009, Image Correlation for Shape, Motion and Deformation Measurements: Basic Concepts, Theory and Applications, Springer, New York. [Google Scholar]
- [30]. Genovese, K. , Lee, Y. U. , and Humphrey, J. D. , 2011, “Novel Optical System for In Vitro Quantification of Full Surface Strain Fields in Small Arteries: I. Theory and Design,” Comput. Meth. Biomech. Biomed. Eng., 14(3), pp. 213–225. 10.1080/10255842.2010.545823 [DOI] [PubMed] [Google Scholar]
- [31]. Genovese, K. , Lee, Y. U. , and Humphrey, J. D. , 2011, “Novel Optical System for In Vitro Quantification of Full Surface Strain Fields in Small Arteries: II. Correction for Refraction and Illustrative Results,” Comput. Meth. Biomech. Biomed. Eng., 14(3), pp. 227–237. 10.1080/10255842.2010.545824 [DOI] [PubMed] [Google Scholar]
- [32]. Faugeras, O. , 1993, Three-Dimensional Computer Vision: A Geometric Viewpoint, MIT Press, Cambridge, MA. [Google Scholar]
- [33]. Bornert, M. , Bremand, F. , Doumalin, P. , Dupre, J. C. , Fazzini, M. , Grediac, M. , Hild, F. , Mistou, S. , Molimard, J. , Orteu, J. J. , Robert, L. , Surrel, Y. , Vacher, P. , and Wattrisse, B. , 2009, “Assessment of Digital Image Correlation Measurement Errors: Methodology and Results,” Experimental Mech., 49(3), pp. 353–370. 10.1007/s11340-008-9204-7 [DOI] [Google Scholar]
- [34]. Smith, B. W. , Li, X. , and Tong, W. , 1998, “Error Assessment for Strain Mapping by Digital Image Correlation,” Experimental Techniques, 22(4), pp. 19–21. 10.1111/j.1747-1567.1998.tb02332.x [DOI] [Google Scholar]
- [35]. Haddadi, H. , and Belhabib, S. , 2008, “Use of Rigid-Body Motion for the Investigation and Estimation of the Measurement Errors Related to Digital Image Correlation Technique,” Opt. Lasers Eng., 46(2), pp. 185–196. 10.1016/j.optlaseng.2007.05.008 [DOI] [Google Scholar]
- [36]. Abdel-Aziz, Y. I. , and Karara, H. M. , 1971, “Direct Linear Transformation From Comparator Coordinates Into Object-Space Coordinates in Close-Range Photogrammetry,” Symposium on Close-Range Photogrammetry. [Google Scholar]
- [37]. Humphrey, J. D. , 2002, Cardiovascular Solid Mechanics: Cells, Tissues, and Organs, Springer, New York. [Google Scholar]
- [38]. Genovese, K. , 2009, “A Video-Optical System for Time-Resolved Whole-Body Measurement on Vascular Segments,” Opt. Lasers Eng., 47(9), pp. 995–1008. 10.1016/j.optlaseng.2009.04.017 [DOI] [Google Scholar]
- [39]. Bruno, L. , 2007, “Global Approach for Fitting 2D Interferometric Data,” Opt. Express, 15(8), pp. 4835–4847. 10.1364/OE.15.004835 [DOI] [PubMed] [Google Scholar]
- [40]. Downs, J. C. , Suh, J. K. , Thomas, K. A. , Bellezza, A. J. , Hart, R. T. , and Burgoyne, C. F. , 2005, “Viscoelastic Material Properties of the Peripapillary Sclera in Normal and Early-Glaucoma Monkey eyes,” Invest. Ophthalmol. Vis. Sci., 46(2), pp. 540–546. 10.1167/iovs.04-0114 [DOI] [PubMed] [Google Scholar]
- [41]. Pijanka, J. K. , Coudrillier, B. , Ziegler, K. , Sorensen, T. , Meek, K. M. , Nguyen, T. D. , Quigley, H. A. , and Boote, C. , 2012, “Quantitative Mapping of Collagen Fiber Orientation in Non-Glaucoma and Glaucoma Posterior Human Sclerae,” Invest. Ophthalmol. Vis. Sci., 53(9), pp. 5258–5270. 10.1167/iovs.12-9705 [DOI] [PMC free article] [PubMed] [Google Scholar]
- [42]. Danford, F. L. , Yan, D. , Cahir, T. M. , Dreier, R. A. , Girkin, C. A. , and Vande Geest, J. P. , 2013, “Differences in the Region and Depth-Dependent Microstructural Organization in Normal versus Glaucomatous Human Posterior Sclerae,” Invest. Ophthalmol. Vis. Sci. 54(13), pp. 7922–7932. 10.1167/iovs.13-12262 10.1167/iovs.13-12262 [DOI] [PMC free article] [PubMed] [Google Scholar]
- [43]. Sigal, I. A. , and Ethier, C. R. , 2009, “Biomechanics of the Optic Nerve Head,” Exp, Eye Res., 88(4), pp. 799–807. 10.1016/j.exer.2009.02.003 [DOI] [PubMed] [Google Scholar]
- [44]. Yang, H. , Downs, J. C. , Girkin, C. , Sakata, L. , Bellezza, A. , Thompson, H. , and Burgoyne, C. F. , 2007, “3-D Histomorphometry of the Normal and Early Glaucomatous Monkey Optic Nerve Head: Lamina Cribrosa and Peripapillary Scleral Position and Thickness,” Invest. Ophthalmol. Vis. Sci., 48(10), pp. 4597–4607. 10.1167/iovs.07-0349 [DOI] [PMC free article] [PubMed] [Google Scholar]
- [45]. Yang, H. , Downs, J. C. , Sigal, I . A. , Roberts, M. D. , Thompson, H. , and Burgoyne, C. F. , 2009, “Deformation of the Normal Monkey Optic Nerve Head Connective Tissue After Acute IOP Elevation Within 3-D Histomorphometric Reconstructions,” Invest. Ophthalmol. Vis. Sci., 50(12), pp. 5785–5799. 10.1167/iovs.09-3410 [DOI] [PMC free article] [PubMed] [Google Scholar]
- [46]. Grytz, R. , Girkin, C. A. , Libertiaux, V. , and Downs, J. C. , 2012, “Perspectives on Biomechanical Growth and Remodeling Mechanisms in Glaucoma,” Mech. Res. Commun., 42, pp. 92–106. 10.1016/j.mechrescom.2012.01.007 [DOI] [PMC free article] [PubMed] [Google Scholar]
- [47]. Strouthidis, N. G. , Fortune, B. , Yang, H. , Sigal, I. A. , and Burgoyne, C. F. , 2011, “Longitudinal Change Detected by Spectral Domain Optical Coherence Tomography in the Optic Nerve Head and Peripapillary Retina in Experimental Glaucoma,” Invest. Ophthalmol. Vis. Sci., 52(3), pp. 1206–1219. 10.1167/iovs.10-5599 [DOI] [PMC free article] [PubMed] [Google Scholar]
- [48]. Sigal, I. A. , Flanagan, J. G. , Tertinegg, I. , and Ethier, C. R. , 2010, “3D Morphometry of the Human Optic Nerve Head,” Exp. Eye Res., 90(1), pp. 70–80. 10.1016/j.exer.2009.09.013 [DOI] [PubMed] [Google Scholar]
- [49]. Jonas, J. B. , Berenshtein, E. , and Holbach, L. , 2003, “Anatomic Relationship Between Lamina Cribrosa, Intraocular Space, and Cerebrospinal Fluid Space,” Inv. Ophthamol. Vis. Sci., 44(12), pp. 5189–5195. 10.1167/iovs.03-0174 [DOI] [PubMed] [Google Scholar]
- [50]. Morgan, W. H. , Chauhan, B. C. , Yu, D. Y. , Cringle, S. J. , Alder, V. A. , and House, P. H. , 2002, “Optic Disc Movement With Variations in Intraocular and Cerebrospinal fluid Pressure,” Inv. Ophthamol. Vis. Sci., 43(10), pp. 3236–3242. [PubMed] [Google Scholar]
- [51]. Yang, H. , Williams, G. , Downs, J. C. , Sigal, I. A. , Roberts, M. D. , Thompson, H. , and Burgoyne, C. F. , 2011, “Posterior (Outward) Migration of the Lamina Cribrosa and Early Cupping in Monkey Experimental Glaucoma,” Invest. Ophthalmol. Vis. Sci., 52(10), pp. 7109–7121. 10.1167/iovs.11-7448 [DOI] [PMC free article] [PubMed] [Google Scholar]
- [52]. Zhao, X. , Raghavan, M. L. , and Lu, J. , 2011, “Identifying Heterogeneous Anisotropic Properties in Cerebral Aneurysms: A Pointwise Approach,” Biomech. Model Mechanobiol., 10(2), pp. 177–189. 10.1007/s10237-010-0225-7 [DOI] [PMC free article] [PubMed] [Google Scholar]
- [53]. Bischoff, J. E. , Drexler, E. S. , Slifka, A. J. , and McCowan, C. N. , 2009, “Quantifying Nonlinear Anisotropic Elastic Material Properties of Biological Tissue by Use of Membrane Inflation,” Comput. Meth. Biomech. Biomed. Eng., 12(3), pp. 353–369. 10.1080/10255840802609420 [DOI] [PubMed] [Google Scholar]
- [54]. Raghupathy, R. , Witzenburg, C. , Lake, S. P. , Sander, E. A. , and Barocas, V. H. , 2011, “Identification of Regional Mechanical Anisotropy in Soft Tissue Analogs,” ASME J. Biomech. Eng., 133(9), p. 091011. 10.1115/1.4005170 [DOI] [PMC free article] [PubMed] [Google Scholar]


