

Abstract
Objective
To understand general practitioners’ (GPs) use of individual risk factors (blood pressure and cholesterol levels) versus absolute risk in cardiovascular disease (CVD) risk management decision-making.
Design
Randomised experiment. Absolute risk, systolic blood pressure (SBP), cholesterol ratio (total cholesterol/high-density lipoprotein (TC/HDL)) and age were systematically varied in hypothetical cases. High absolute risk was defined as 5-year risk of a cardiovascular event >15%, high blood pressure levels varied between SBP 147 and 179 mm Hg and high cholesterol (TC/HDL ratio) between 6.5 and 7.2 mmol/L.
Setting
4 GP conferences in Australia.
Participants
144 Australian GPs.
Outcomes
GPs indicated whether they would prescribe cholesterol and/or blood pressure lowering medication. Analyses involved logistic regression.
Results
For patients with high blood pressure: 93% (95% CI 86% to 96%) of high absolute risk patients and 83% (95% CI 76% to 88%) of lower absolute risk patients were prescribed blood pressure medication. Conversely, 30% (95% CI 25% to 36%) of lower blood pressure patients were prescribed blood pressure medication if absolute risk was high and 4% (95% CI 3% to 5%) if lower. 69% of high cholesterol/high absolute risk patients were prescribed cholesterol medication (95% CI 61% to 77%) versus 34% of high cholesterol/lower absolute risk patients (95% CI 28% to 41%). 36% of patients with lower cholesterol (95% CI 30% to 43%) were prescribed cholesterol medication if absolute risk was high versus 10% if lower (95% CI 8% to 13%).
Conclusions
GPs’ decision-making was more consistent with the management of individual risk factors than an absolute risk approach, especially when prescribing blood pressure medication. The results suggest medical treatment of lower risk patients (5-year risk of CVD event <15%) with mildly elevated blood pressure or cholesterol levels is likely to occur even when an absolute risk assessment is specifically provided. The results indicate a need for improving uptake of absolute risk guidelines and GP understanding of the rationale for using absolute risk.
Keywords: Cardiology, General Medicine (see Internal Medicine), Public Health
Strengths and limitations of this study.
This study uses a rigorous experimental design to systematically investigate how general practitioners’ (GPs) use individual risk factors (blood pressure and cholesterol) versus the absolute risk of a cardiovascular disease (CVD) event in their decision-making about CVD preventive medication. International guidelines are based on absolute risk, but are used inconsistently.
The results show that GPs’ decision-making was more consistent with management of individual risk factors than an absolute risk approach, especially when prescribing blood pressure lowering medication.
Our findings have important clinical implications, suggesting that medical treatment of lower risk patients (5-year risk of CVD event <15%) with mildly elevated blood pressure or cholesterol is likely to occur even when an absolute risk assessment is specifically provided to GPs.
The results may over-estimate the use of absolute risk in clinical practice due to: (1) a low response rate that is typical of such GP studies but may have favoured those more interested and positive about absolute risk, (2) reliance on self-reported intentions, which was necessary to enable an experimental design and (3) explicitly providing GPs with an absolute risk score for each case, since absolute risk is often not assessed in practice.
Introduction
International guidelines for cardiovascular disease (CVD) prevention encourage the use of absolute risk to guide treatment with blood pressure and cholesterol lowering medication.1–6 Several risk prediction models exist that differ in the duration over which they calculate CVD risk (typically 5 or 10 years) and the variables they base the risk on.7 8 One of the most commonly used absolute risk models is the Framingham risk equation (FRE),9 which estimates the risk of a cardiovascular event based on sex, age, smoking status, diabetes, systolic blood pressure (SBP) and cholesterol ratio. The Australian guidelines classify patients with a 5-year risk of >15% as high risk and recommend that they should be simultaneously treated with cholesterol and blood pressure lowering medication in addition to lifestyle intervention unless contraindicated or clinically inappropriate.10 11 For lower risk patients ≤ 15% without additional risk factors such as family history, lifestyle intervention is recommended as the primary management approach. Adults with very high individual risk factors (SBP ≥180 or diastolic blood pressure ≥110 mm Hg or total cholesterol >7.5 mmol/L) do not require absolute CVD risk assessment because they are already considered to be at high risk of CVD.10 11
Using absolute risk is a major shift from the traditional approach of treating high blood pressure and high cholesterol individually. An absolute risk approach is likely to achieve the best balance between preventing CVD events and avoiding unnecessary treatment with medication. It has the potential to reduce overtreatment of people who have an elevated individual risk factor (eg, blood pressure) but low or moderate overall risk of a CVD event and reducing under treatment of people with slightly elevated individual risk factors but a combined high overall risk.12 13 The first FRE was published in 197614 and New Zealand was the first country to introduce an absolute risk approach in 1993.15 More than 20 years have passed since then and the absolute risk approach has been shown to reduce short-term CVD risk without causing clinical harms.14
However, research suggests that general practitioners (GPs) often do not use absolute risk to guide their decision-making about CVD prevention.15–19 Past research includes studies exploring barriers to GPs’ use of absolute risk19–22 and studies quantifying treatment gaps using clinical databases12 16 17 23 24 but individual decision-making about absolute risk has not been comprehensively examined quantitatively. In this study we applied a method based on judgements of hypothetical patient cases to analyse GPs’ decisions about CVD risk management and their use of absolute risk. Hypothetical patient cases (also called vignettes) have been widely used to measure decision processes in a range of clinical settings,25 including GP decision-making about CVD.26–28 Indeed, three recent studies using patient cases suggest that clinicians might not base treatment decisions on absolute risk thresholds (eg, only treat patients >15% for 5-year FRE based absolute risk or >20% for 10-year risk); instead they focus on the levels of the individual risk factors blood pressure and cholesterol.26–28 However, these studies did not systematically assess different combinations of absolute risk and individual risk factor levels. Therefore, they provide limited interpretation of how GPs use absolute risk versus individual risk factors in decision-making.
In the current study we used hypothetical patient cases (from here on referred to as cases) in which the levels of absolute risk and three individual risk factors (SBP, cholesterol ratio (total cholesterol/high-density lipoprotein (TC/HDL), and age) were systematically varied in order to evaluate their respective influence on GPs’ decision-making about CVD risk management. Absolute risk levels were derived from the FRE.9
In line with the literature suggesting that GPs tend to use an individual risk factor approach, we hypothesised that:
GPs are more likely to treat lower absolute risk with medication when individual risk factors (blood pressure, cholesterol) are higher than when individual risk factors are lower; and conversely;
GPs are less likely to treat high absolute risk with medication when individual risk factors (blood pressure, cholesterol) are lower than when individual risk factors are higher.
Method
Recruitment
GPs currently practicing in Australia were recruited between May and November 2012 at four general practice conferences in New South Wales, Victoria and Queensland. All participants were asked when they became a GP and whether they were currently practicing in Australia through survey questions, and the eligibility of returned questionnaires was verified before data analysis.
Data collection and measurement
Respondents viewed a generic patient scenario (see box 1) followed by a table with the relevant values for absolute risk, SBP, TC/HDL ratio, HDL, total cholesterol and age, as well as patient gender and smoking status (ie, the cases). GPs were asked how they would manage the patient in the case: prescribe cholesterol medication, prescribe blood pressure medication and/or prescribe aspirin (yes/no for each). In addition, they were asked when they would reassess the patient (open ended). The aspirin and reassessment results are reported separately. We collected information regarding GP characteristics: gender, age, years in practice, practice size. We asked GPs two questions about their use of absolute risk as follows: ‘For the cases you just read, how often did you use the absolute risk score to inform your management decision?’ and ‘In your general practice, how often do you use absolute risk scores, calculators or charts when assessing a patient's level of cardiovascular risk?’ (5-point Likert scale; 1 never—5 always). The survey was piloted with nine GPs.
Box 1. General patient scenario.
“A regular patient of yours presents for a ‘check-up’ and has no current symptoms. He/she has been trying to improve their diet and increase their physical activity levels. You have several previous blood pressure readings at approximately the same level as observed today. A recent test of electrolytes, liver function and renal function was normal.”
BMI: 27
Medical history: nil of note
Family history: mother died of bowel cancer, nil family history of ischaemic heart disease
Social history: married, lives in own home
Ethnicity: Caucasian
Different sets of cases
We developed four sets of cases (also see table 1):
Ai. High IR (individual risk)/lower AR (absolute risk) with high individual risk factors (blood pressure only) and lower absolute risk;
Aii. High IR/lower AR with high individual risk factors (cholesterol only) and lower absolute risk;
B. High IR/high AR with high individual risk factors and high absolute risk;
C. Lower IR/high AR with lower individual risk factors and high absolute risk;
D. Lower IR/lower AR with lower individual risk factors and lower absolute risk.
Table 1.
The levels for absolute risk and individual risk factors blood pressure (SBP) and cholesterol (TC/HDL ratio) plus the relevant case numbers and number of cases (n=144 GPs)*
| Category figure 2/online supplementary appendix 1 | Absolute risk | Individual risk factors‡ |
|||
|---|---|---|---|---|---|
| SBP (mm Hg) | TC/HDL ratio (mmol/L) | N | Case numbers | ||
| Ai | Lower | High | Lower | 431 | 25–35 |
| Aii | Lower | Lower | High | 415 | 13–24 |
| B† | High | High | High | 221 | 7–12 |
| C† | High | Lower | Lower | 298 | 36–43 |
| D | Lower | Lower | Lower | 219 | 1–6 |
*See online supplementary appendix 1 for the actual values used in these cases.
†Only the sets of cases B and C were eligible for treatment with cholesterol and blood pressure lowering medication according to the Australian absolute risk guidelines10 11
GPS, general practitioners’; SBP, systolic blood pressure; TC/HDL, total cholesterol/high-density lipoprotein.
Cases were designed to be clinically plausible and relevant. Only the sets of cases B and C were eligible for treatment with cholesterol and blood pressure lowering medication according to the Australian absolute risk guidelines.10 11 In all cases except high IR/lower AR (Ai and Aii) the levels of individual risk factors were the same across blood pressure and cholesterol (ie, both lower or both high). For cases with high IR/lower AR (Ai and Aii) blood pressure was high and cholesterol was lower, or vice versa, to enable exploration of their independent effects on GP decision-making. This resulted in a core set of 25 cases with different combinations of absolute and individual risk factor levels (see online supplementary appendix 1 for the complete set of cases).
Gender and smoking status
We constructed a female and male equivalent of each core case (where possible, given the restraints of the FRE and the individual and absolute risk levels defined above). We made all high absolute risk cases smokers and all lower absolute risk cases non-smokers, and we constructed an additional set of cases to test for the potential confounding effect of smoking.
Levels of absolute risk and individual risk factor levels
The levels used to describe elevated absolute risk and the individual risk factors (see table 1) were based on the 2012 Australian absolute risk guidelines11 (using the FRE) and informed by practicing GPs (JD and PG). We defined patients with a risk of a cardiovascular event over 5 years greater than 15% as high absolute risk, for whom preventive medication is recommended. The Australian absolute risk guidelines recommend that adults with SBP ≥180 mm Hg or total cholesterol >7.5 mmol/L do not require absolute CVD risk assessment because they are already known to be at clinically determined high risk of CVD.5 11 We ensured that the individual risk factor levels remained below these thresholds and, where possible, we avoided values that were close to the cut-off. High blood pressure levels varied between SBP 147 and 179 mm Hg and high cholesterol (TC/HDL ratio) between 6.5 and 7.2 mmol/L. Lower blood pressure levels varied between SBP of 110 and 145 mm Hg and lower TC/HDL ratio between 3 and 6 mmol/L. We defined three age categories within the target population for CVD risk assessment: 47, 61 and 72 years. Previous Australian guidelines for cholesterol (2005)29 and hypertension management (2010)30 are consistent with the 2012 guidelines recommendations for the commencement of cholesterol lowering and/or blood pressure lowering drug treatment in patients with an absolute risk >15% of a CVD event in the next 5 years, or those with an absolute risk of 10–15% with the presence of additional risk factors but have now been replaced with the 2012 guidelines.
Randomisation
There were 25 core cases with systematically varied levels of absolute risk, cholesterol, blood pressure and age. Each case had between one and three versions to enable male/female and smoking/non-smoking comparisons, depending on clinical plausibility. Eleven of the core cases were randomly selected for each survey to reduce response burden, and only one version of the selected case was used (eg, only the female, non-smoking version). The 11 selected cases were presented in random order. This process generated a total of 43 clinically possible cases (see online supplementary appendix 1 for details of each case).
Analysis
GPs’ decisions on risk management for the different cases were summarised as the percentage of cases in which the GPs would prescribe cholesterol or blood pressure lowering medication. We analysed how the chances of prescribing medication changed according to the risk profiles of the cases (ie, levels of absolute and individual risk factors). This was done using generalised estimation equations (GEEs) with a logit link (logistic regression) and an exchangeable working correlation matrix to take into account the clustering of cases per GP.
The outcome was whether the GP would prescribe medication for the case, and the covariates were the levels of absolute risk and individual risk factors (ie, blood pressure and cholesterol levels) presented in the cases. More specifically, four sets of cases were compared: (A) high individual risk factors and lower absolute risk, (B) high individual risk factors and high absolute risk, (C) lower individual risk factors and high absolute risk and (D) lower individual risk factors and lower absolute risk. The 95% CIs for the percentages presented in the results section and figure 2 were obtained from the GEEs.
Figure 2.
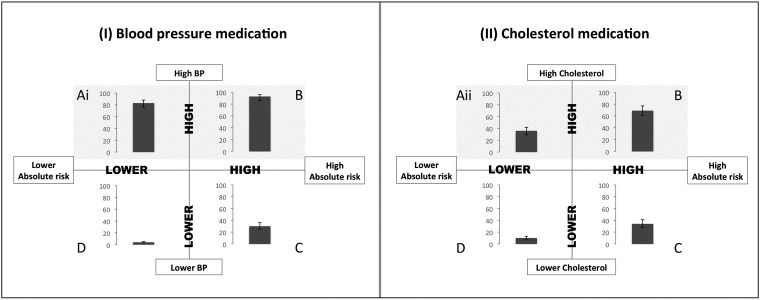
Percentages of cases in which the general practitioners would prescribe a blood pressure or cholesterol lowering drugs according to different combination of absolute (horizontal axis) and individual risk factors (vertical axis). The error bars represent the 95% CIs for the percentage of cases (controlled for clustering). (Ai) High IR/lower AR with high individual risk factors (blood pressure only) and lower absolute risk. (Aii) High IR/lower AR with high individual risk factors (cholesterol only) and lower absolute risk. (B) High IR/high AR with high individual risk factors and high absolute risk*, (C) Lower IR/high AR with lower individual risk factors and high absolute risk*, and (D) Lower IR/lower AR with lower individual risk factors and lower absolute risk.
We performed exploratory analyses to examine (1) how risk management changed according to GP characteristics (ie, age, gender, years in practice, practice size and self-reported use of absolute risk in practice and in the cases) and (2) how risk management changed according to specific characteristics of the cases presented (ie, age, gender and smoking status). This was achieved by testing the interaction between each characteristic and the four sets of cases with different risk profiles in separate GEEs (one for each characteristic). The statistical analysis was performed with the software SPSS V.21.
Missing data handling
Five participants completed only half of the survey (1 out of 2 pages). For those participants, only the completed part of the survey was included in the analysis. In addition, there was an average of five missing responses per case. In most instances the missing values occurred in questionnaires where only positive responses were marked (ie, GP only gave a response for cases where he/she would prescribe) and it was therefore assumed that the missing values were negative responses (ie, GP would not prescribe for that case). A sensitivity analysis was conducted to check this assumption by excluding the surveys with missing values. The pattern of results did not change.
Results
Response rate
Over the four general practice conferences, we had a 30% response rate for surveys that were handed out at a stall (90 surveys completed from 304 distributed at two conferences) and a 3% response rate for surveys that were inserted into GPs’ conference packs (55 surveys completed from 1803 surveys inserted into GPs’ conference packs at three conferences). One returned survey was excluded due to participant ineligibility (not currently practicing). A total of 144 GPs participated in this study.
GP characteristics
The median age of the GPs who participated in the study was 53 (IQR=47–59) and 58% were women. They had been practicing medicine for a median of 28 years (IQR=21–35) with a median practice size of five GPs (IQR=3–8). Figure 1 shows GPs’ self-reported use of absolute risk in their usual practice and the cases.
Figure 1.
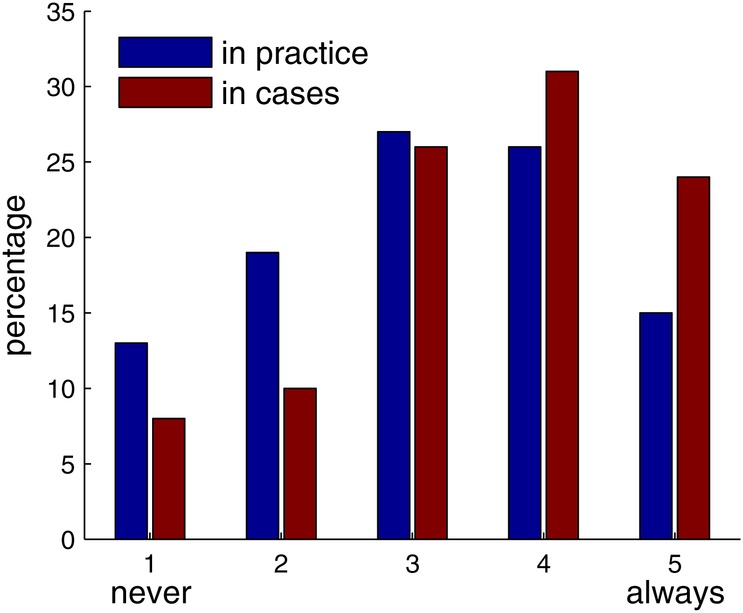
Self-reported use of absolute risk in practice and in the cases (n=144 general practitioners).
Prescription of blood pressure lowering medication
For cases in the high blood pressure group (SBP ≥147 mm Hg) GPs stated that they would prescribe blood pressure medication for 93% (95% CI 86% to 96%) of the cases with high absolute risk (5-year risk of a CVD event >15%) and 83% (95% CI 76% to 88%) of the cases with lower absolute risk (see figure 2I and online supplementary appendix 1, Ai and B). Conversely, 30% (95% CI 25% to 36%) of cases in the lower blood pressure group were prescribed blood pressure medication if absolute risk was high and 4% (95% CI 3% to 5%) of the cases if absolute risk was lower (see figure 2I and online supplementary appendix 1C and D).
Prescription of cholesterol lowering medication
GPs stated they would prescribe cholesterol medication for 69% of cases with high cholesterol (TC/HDL ratio ≥6.5) and high absolute risk (95% CI 61% to 77%; figure 2II, B). In contrast, a smaller percentage of cases with high cholesterol but lower absolute risk were prescribed cholesterol medication (34%, 95% CI 28% to 41%; figure 2II and see online supplementary appendix 1 Aii). The prescribing pattern for cholesterol medication in cases with lower cholesterol was similar to blood pressure medication. GPs indicated that they would prescribe cholesterol medication in just over a third of cases (36%, 95% CI 30% to 43%; figure 2II and see online supplementary appendix 1C) if absolute risk was high and 10% of cases if absolute risk was lower (95% CI 8% to 13%; figure 2II and see online supplementary appendix 1D).
Prescription and patients’ characteristics
There were no differences in the pattern of prescribing cholesterol medication for cases of different age groups at similar risk (p=0.331). However, 61-year-old cases were twice as likely (OR=2.00, p<0.001, 95% CI 1.52 to 2.65) to be prescribed blood pressure medication than 72-year-old cases with the same risk profile. GPs were also more likely to indicate that they would prescribe cholesterol medication (OR=1.27, p=0.025, 95% CI 1.03 to 1.56) but not blood pressure medication for male cases (OR=1.24, p=0.212, 95% CI 0.89 to 1.72). Smoking status was not associated with the prescription of cholesterol or blood pressure medication (OR=0.66, p=0.077, 95% CI 0.42 to 1.05).
Prescription and GP characteristics
Older GPs were less likely to prescribe cholesterol medication (OR=0.77, p=0.039, 95% CI 0.60 to 0.99, per 10 years of age). A similar trend was found for years of practice (OR=0.80, p=0.052, 95% CI 0.65 to 1.00, per 10 years of practice). GP age and years of practice were not associated with stated prescribing of blood pressure medication (OR=0.81, p=0.160, 95% CI 0.61 to 1.09, per 10 years of age; OR=0.84, p=0.191, 95% CI 0.65 to 1.09, per 10 years of practice).
Stated prescribing was not significantly associated with self-reported use of the absolute risk approach in practice or GP gender. However, GPs who reported using absolute risk in the cases were more likely to prescribe blood pressure and cholesterol medication for cases with high absolute risk (blood pressure medication: OR=1.29, p=0.042, 95% CI 1.01 to 1.64; cholesterol medication: OR=1.61, p=0.001, 95% CI 1.22 to 2.12). For the cases with lower absolute risk these GPs also prescribed more, but this was not statistically significant (blood pressure medication: OR=1.07, p=0.654, 95% CI 0.81 to 1.41; cholesterol medication: OR=1.22, p=0.077, 95% CI 0.98 to 1.52).
Discussion
Our analysis of the prescribing decisions for 144 GPs over a range of systematically varied cases suggests that GPs focus more on the levels of individual CVD risk factors blood pressure and cholesterol than on absolute risk, especially when prescribing blood pressure lowering medication. The results suggest that, inconsistent with the Australian guidelines,10 11 GPs are likely to prescribe blood pressure and cholesterol lowering medication to lower risk patients (5-year risk of CVD event <15%) if these risk factors are elevated, even when an absolute risk assessment is specifically provided to GPs. Conversely, GPs did not always prescribe medication to higher risk cases when blood pressure or cholesterol were not elevated. These results are in line with our hypotheses, and previous studies of patient records showing overtreatment of low-risk patients and undertreatment of high-risk patients, and that individual risk factors influence prescribing.26–28 31–33 Age appeared to be largely ignored as a risk factor, and GPs prescribed less blood pressure lowering medication for 72-year-old cases in comparison with 61-year-olds despite similar descriptions in the scenarios (a relatively healthy fit x year old). This finding is worthy of further exploration, given that age is one of the strongest risk factors for CVD, as it runs counter to the concept of absolute CVD risk and proposals based solely on an age cut-off.34 35 We acknowledge that in clinical practice GPs may have various and valid reasons for deviating from the guidelines, and strict adherence to guidelines and/or treatment thresholds may undermine the shared decision-making (SDM) approach that is now considered gold standard.36 37 SDM in the current context would entail that a GP assesses absolute CVD risk, explains this and the recommended management approach to the patient, discusses the benefits and harms of the different management options with the patient, and makes a shared decision with the patient. Our study and previous work suggests that many GPs do not base their recommendations on absolute risk, so it is unlikely that they can adequately inform their patients about the benefits and harms of CVD risk management and engage them in SDM.
Prescribing patterns were different for cholesterol and blood pressure medication. Although explanatory factors were not investigated in this study, historically, antihypertensive prescribing dates back to the late 1950s; hypertension was the first major CVD risk factor successfully treated.38 In contrast, there was controversy over the treatment of cholesterol until the large-scale trials of statins reported in the mid-1990s,39 which coincided with the emergence of ideas and methods using absolute CVD risk. This history may have influenced the language used for these risk factors; ‘hypertension’ is more commonly used than its lipid analogues such as ‘hypercholesterolaemia’.
The strengths of this study include the heterogeneity of the GPs who participated, and the systematic variation of cases, but there are also some limitations: First, the response rate was disappointing though typical for such GP studies.27 However, any bias in our sample is likely to favour GPs more interested and positive about absolute risk, although almost 15% of GPs in our study stated that they never use absolute risk in practice. Second, to keep cases simple and clear we were restrictive in the range of clinical variables and management options presented, excluding lifestyle modification although space was provided for comments. Third, we relied solely on self-reported intentions to prescribe in the different cases rather than actual prescribing behaviour. This allowed an experimental design, but the results may not reflect what is actually happening in clinical practice. However, our results are likely to be an over-estimate of the use of absolute risk in actual practice as the cases explicitly provided GPs with an absolute risk score. We know from our qualitative work that absolute risk is often not assessed in practice.19
In conclusion, GPs’ decision-making was more consistent with an individual risk factor approach than absolute risk, especially when prescribing blood pressure lowering medication. While more research to explore the cognitions behind these reported behaviours would be worthwhile, our study identifies a clear need to improve guideline recommendations about how GPs should integrate individual risk factor assessment with a management that is guided by absolute CVD risk.
Supplementary Material
Acknowledgments
The authors would like to thank the general practitioners who participated in the study, Haryana Dhillon for assistance with administration and recruitment, Kristen Pickles and Corrinne Renton for assistance with data collection, Paige Bolton from the Heart Foundation for organising survey collection at their conference stalls, and Adam McSorley for assistance with data management.
Footnotes
Contributors: All the authors included in the paper fulfill the criteria of authorship. JJ contributed to study design, analysis, interpretation, drafting and revising the manuscript. CB contributed to study design, recruitment, data collection, analysis, interpretation and revising the manuscript. SM contributed to recruitment, data collection, analysis, interpretation and revising the manuscript. LI, JD, PG, RT, AH and KM contributed to study design, interpretation and revising the manuscript. ATP contributed to analysis, interpretation and revising the manuscript. All authors approved the final version of the manuscript and all authors are guarantors.
Funding: The study was funded by the National Health and Medical Research Council (NHMRC) project grant 511217. Jesse Jansen and Kirsten McCaffery are supported by NHMRC fellowships. Carissa Bonner was supported by an Australian Postgraduate Award. Robin Turner and Armando Teixeira-Pinto were supported by NHMRC program grant 633003 to the Screening & Test Evaluation Program. Jenny Doust was supported by the NHMRC project grant 511217.
Competing interests: None.
Ethical approval: The University of Sydney human research ethics committee approved this study (No 11-2011/14379).
Provenance and peer review: Not commissioned; externally peer reviewed.
Data sharing statement: No additional data are available.
References
- 1.Ryden L, Scherer M, Syvanne M. European Guidelines on cardiovascular disease prevention in clinical practice (version 2012). Eur Heart J 2012;33:1635–701 [DOI] [PubMed] [Google Scholar]
- 2.Reiner Z, Catapano AL, De Backer G, et al. ESC/EAS Guidelines for the management of dyslipidaemias: the Task Force for the management of dyslipidaemias of the European Society of Cardiology (ESC) and the European Atherosclerosis Society (EAS). Eur Heart J 2011;32:1769–818 [DOI] [PubMed] [Google Scholar]
- 3.Stone NJ, Robinson J, Lichtenstein AH, et al. 2013 ACC/AHA Guideline on the treatment of blood cholesterol to reduce atherosclerotic cardiovascular risk in adults: a report of the American College of Cardiology/American Heart Association Task Force on Practice Guidelines. J Am Coll Cardiol 2013;S0735–1097(13)06028-2. [DOI] [PubMed] [Google Scholar]
- 4.Boon N, Boyle R, Bradbury K, et al. Joint British Societies’ consensus recommendations for the prevention of cardiovascular disease (JBS3). Heart 2014;100(Suppl 2):ii1–67 [DOI] [PubMed] [Google Scholar]
- 5.New Zealand Guidelines Group. Cardiovascular disease risk assessment (updated 2013). Wellington: New Zealand Guidelines Group, 2013 [Google Scholar]
- 6.Ferket BS, Colkesen EB, Visser JJ, et al. Systematic review of guidelines on cardiovascular risk assessment: which recommendations should clinicians follow for a cardiovascular health check? Arch Intern Med 2010;170:27–40 [DOI] [PubMed] [Google Scholar]
- 7.Siontis GC, Tzoulaki I, Siontis KC, et al. Comparisons of established risk prediction models for cardiovascular disease: systematic review. BMJ 2012;344:e3318. [DOI] [PubMed] [Google Scholar]
- 8.Allan GM, Nouri F, Korownyk C, et al. Agreement among cardiovascular disease risk calculators. Circulation 2013;127:1948–56 [DOI] [PubMed] [Google Scholar]
- 9.D'Agostino R, Ramachandran S, Vasan R, et al. General cardiovascular risk profile for use in primary care: the Framingham Heart Study. Circulation 2008;117:743–53 [DOI] [PubMed] [Google Scholar]
- 10. National Vascular Disease Prevention Alliance. Guidelines for the assessment of absolute cardiovascular disease risk. Approved by the National Health and Medical Research Council 2009.
- 11. National Vascular Disease Prevention Alliance. Guidelines for the management of absolute cardiovascular disease risk. Approved by the National Health and Medical Research Council 2012.
- 12.Doust J, Sanders S, Shaw J, et al. The prevention of cardiovascular disease: how does assessment based on absolute risk affect who is treated versus individual risk factors? Aus Fam Physician 2012;41:805–9 [PubMed] [Google Scholar]
- 13.Jackson R, Lawes CMM, Bennett DA, et al. Treatment with drugs to lower blood pressure and blood cholesterol based on an individual's absolute cardiovascular risk. Lancet 2005;365:434–41 [DOI] [PubMed] [Google Scholar]
- 14.Sheridan S, Crespo E. Does the routine use of global coronary heart disease risk scores translate into clinical benefits or harms? A systematic review of the literature. BMC Health Serv Res 2008;8:60. [DOI] [PMC free article] [PubMed] [Google Scholar]
- 15.Graham I, Stewart M, Hertog M, et al. Factors impeding the implementation of cardiovascular prevention guidelines: findings from a survey conducted by the European Society of Cardiology. Eur J Cardiovasc Prev Rehabil 2006;13:839–45 [DOI] [PubMed] [Google Scholar]
- 16.Heeley EL, Peiris DP, Patel AA, et al. Cardiovascular risk perception and evidence-practice gaps in Australian general practice (the AusHEART study). Med J Aust 2010;192:254–9 [DOI] [PubMed] [Google Scholar]
- 17.Webster RJ, Heeley EL, Peiris DP, et al. Gaps in cardiovascular disease risk management in Australian general practice. Med J Aust 2009;191:324–9 [DOI] [PubMed] [Google Scholar]
- 18.Sposito AC, Ramires JAF, Jukema JW, et al. Physicians’ attitudes and adherence to use of risk scores for primary prevention of cardiovascular disease: cross-sectional survey in three world regions. Curr Med Res Opin 2009;25:1171–8 [DOI] [PubMed] [Google Scholar]
- 19.Bonner C, Jansen J, McKinn S, et al. General practitioners’ use of different cardiovascular risk assessment strategies: a qualitative study. Med J Aust 2013;199:1–5 [DOI] [PubMed] [Google Scholar]
- 20.Hobbs FDR, Jukema JW, Da Silva PM, et al. Barriers to cardiovascular disease risk scoring and primary prevention in Europe. QJM 2010;103:727–39 [DOI] [PubMed] [Google Scholar]
- 21.van Steenkiste B, van der Weijden T, Stoffers H, et al. Barriers to implementing cardiovascular risk tables in routine practice. Scand J Pri Health Care 2004;22:32–7 [DOI] [PubMed] [Google Scholar]
- 22.Torley D, Zwar N, Comino E, et al. GPs’ views of absolute cardiovascular risk and its role in primary prevention. Aust Fam Physician 2005;34:503–04 [PubMed] [Google Scholar]
- 23.Chen L, Rogers S, Colagiuri S, et al. How do the Australian guidelines for lipid-lowering drugs perform in practice? Cardiovascular disease risk in the AusDiab Study, 1999–2000. Med J Aust 2008;189:319–22 [DOI] [PubMed] [Google Scholar]
- 24.Reiner Ž, Sonicki Z, Tedeschi-Reiner E. Physicians’ perception, knowledge and awareness of cardiovascular risk factors and adherence to prevention guidelines: the PERCRO-DOC survey. Atherosclerosis 2010;213:598–603 [DOI] [PubMed] [Google Scholar]
- 25.Peabody JW, Luck J, Glassman P, et al. Comparisons of vignettes, standardized patients, and chart abstractions. A prospective validation study of 3 measures for validating quality. JAMA 2000;283:1715–22 [DOI] [PubMed] [Google Scholar]
- 26.Mohammed MA, Marshall T, Gill P. The effect of chance variability in blood pressure readings on the decision making of general practitioners: an internet-based case vignette study. PLoS ONE 2012;7:e46556. [DOI] [PMC free article] [PubMed] [Google Scholar]
- 27.Weiner M, Wells S, Kerse N. Perspectives of general practitioners towards evaluation and treatment of cardiovascular disease among older people. J Prim Health Care 2009;1:198–206 [PubMed] [Google Scholar]
- 28.Johansen ME, Gold KJ, Sen A, et al. A national survey of the treatment of hyperlipidemia in primary prevention. JAMA Intern Med 2013;173:586–8 [DOI] [PubMed] [Google Scholar]
- 29.Tonkin A, Barter P, Best J, et al. National Heart Foundation of Australia and the Cardiac Society of Australia and New Zealand: position statement on lipid management-2005. Heart Lung Circ 2005;14:275. [DOI] [PubMed] [Google Scholar]
- 30. National Heart Foundation of Australia (National Blood Pressure and Vascular Disease Advisory Committee). Guide to management of hypertension 2008. Updated December 2010.
- 31.Mohammed MA, El Sayed C, Marshall T. Patient and other factors influencing the prescribing of cardiovascular prevention therapy in the general practice setting with and without nurse assessment. Med Decis Making 2012;32:498–506 [DOI] [PubMed] [Google Scholar]
- 32.van Staa T-P, Smeeth L, Ng ESW, et al. The efficiency of cardiovascular risk assessment: do the right patients get statin treatment? Heart 2013;99:1597–602 [DOI] [PMC free article] [PubMed] [Google Scholar]
- 33.Wu J, Zhu S, Yao GL, et al. Patient factors influencing the prescribing of lipid lowering drugs for primary prevention of cardiovascular disease in UK general practice: a national retrospective cohort study. PLoS ONE 2013;8:e67611. [DOI] [PMC free article] [PubMed] [Google Scholar]
- 34.Wald NJ, Law MR. A strategy to reduce cardiovascular disease by more than 80%. BMJ 2003;326:1419. [DOI] [PMC free article] [PubMed] [Google Scholar]
- 35.Reiner Ž. Polypill is not a ‘vaccine-like'solution for primary cardiovascular disease prevention in all parts of the world. J Epidemiol Community Health 2013;67:981–2 [DOI] [PubMed] [Google Scholar]
- 36.van der Weijden T, Pieterse AH, Koelewijn-van Loon MS, et al. How can clinical practice guidelines be adapted to facilitate shared decision making? A qualitative key-informant study. BMJ Qual Saf 2013;22:855–63 [DOI] [PubMed] [Google Scholar]
- 37.Krumholz HM. Target cardiovascular risk rather than cholesterol concentration. BMJ 2013;347:f7110. [DOI] [PubMed] [Google Scholar]
- 38.Moser M. Historical perspectives on the management of hypertension. J Clin Hypertens (Greenwich) 2006;8(8 Suppl 2):15–20 [DOI] [PMC free article] [PubMed] [Google Scholar]
- 39.LaRosa JC, He J, Vupputuri S. Effect of statins on risk of coronary disease: a meta-analysis of randomized controlled trials. JAMA 1999;282:2340–6 [DOI] [PubMed] [Google Scholar]
Associated Data
This section collects any data citations, data availability statements, or supplementary materials included in this article.