Abstract
Chronic exposure to 2,3,7,8-tetrachlorodibeno-p-dioxin (TCDD) and related polyhalogenated organic pollutants occurs as a consequence of modern life. Exploring the cellular basis for their action is anticipated to help understand the risk they pose and improve the foundation for their regulation. A basis for the striking change in human keratinocyte colony morphology due to TCDD exposure has been investigated by shotgun proteomics. Concentrating on changes in protein levels among three cell strains has revealed significant decreases in the differentiation markers filaggrin, keratin 1 and keratin 10. EGF treatment in concert with TCDD enhanced the changes in these markers and several other proteins while reducing the levels of certain other proteins. The only protein stimulated by TCDD in all three strains and reversed by EGF in them was vimentin, not previously observed to be in the Ah receptor response domain. Although TCDD is often proposed to enhance keratinocyte differentiation, proteomic analysis reveals it uncouples the differentiation program and suggests that reduced levels of differentiation marker proteins contribute to the observed excessive stratification it induces.
Keywords: Cell culture, Cross-linked envelopes, Dioxin, Epidermal growth factor, Filaggrin, Keratins, Polyhalogenated organic pollutants, Vimentin
INTRODUCTION
Polychlorinated dioxins and dibenzofurans came to public attention in the 1960’s and 1970’s as contaminants of chlorinated phenolic herbicides and polychlorinated biphenyls encountered in warfare,1 industrial accidents2 and food processing.3,4 Worrisome incidents of food contamination occur periodically in Europe5 and around the world. Polychlorinated dioxins and dibenzofurans are highly active members of the larger category of polyhalogenated organic pollutants, generated primarily from combustion of halogenated organic compounds, to which humans are chronically exposed in the diet, especially from meat and dairy products where they concentrate in lipid.6 Many of these compounds act through the aryl hydrocarbon (AH) receptor to activate gene expression, a well-studied mechanism.7 In addition to halogenated pesticides and industrial compounds, pharmaceuticals, natural products in the diet and even compounds that are endogenous in us or are produced by micro-organisms8 can act as AH receptor ligands.9 As a prototypic ligand, TCDD (2,3,7,8-tetrachlorodibenzo-p-dioxin) is a carcinogen in laboratory animals and induces numerous other toxic manifestations including perturbations of development, reproduction and immune response. Of the many tissue targets in animals, the most obvious response in humans is in the skin, potentially long lasting chloracne.10
While many direct transcriptional target genes of the Ah receptor pathway are now known, much remains to be learned about downstream effects leading to toxicity.7 Directed to filling this gap in knowledge, initial studies in cultured cells did not detect toxic effects of TCDD until application to a keratinocyte line derived from a mouse teratoma,11 leading subsequently to investigation in human keratinocytes.12 In these studies, TCDD elicited enhanced stratification in surface culture, interpreted as increased cell differentiation. Enhanced stratification was also seen in organotypic culture,13 leading to the observation that TCDD accelerates filaggrin expression in mouse embryos.14 This phenomenon is consistent with the finding that TCDD exposure for a day stimulates expression of a number of genes in the epidermal differentiation complex and accelerates, by a day, appearance of the epidermal barrier in the embryos.15
Transcriptional studies provide important information on cellular responses to chemical perturbants. The present study provides complementary information on protein level changes under conditions mimicking chronic exposure. Optimized for growth, the culture medium for human epidermal cells ordinarily is supplemented with EGF, which improves colony forming ability and delays senescence.16 This work exploits the dramatically altered appearance of colonies induced by TCDD in the absence of EGF. Previous work indicated that levels of two prominent keratins were substantially altered at the transcriptional level by this treatment in both normal epidermal cells and a spontaneously immortalized line exhibiting minimal deviation from normal in its properties.17 Present work provides a comprehensive analysis of this interaction at the protein level, suggesting the observed change in stratification is at least in part an adaptive response to reduced differentiation.
METHODS
Cell culture
Strains of normal human epidermal cells from two different donors (hEpB and hEpE, both passages 3-6) and a minimally deviated line of spontaneously immortalized human epidermal cells (SIK, passages 35-40)18 from a third donor were co-cultured with a 3T3 feeder layer.19 For maintenance of stocks, cells were grown in a 2:1 mixture of Dulbecco-Vogt Eagle’s medium, changed twice weekly, that contained 5% fetal bovine serum, 0.4 μg/ml hydrocortisone, 10 ng/ml EGF (starting at the first medium change), 5 μg/ml insulin, 5 μg/ml transferrin, 0.18 mM adenine and 20 pM triiodothyronine.20 In each experiment, 4 exposure conditions, +/− EGF and +/− TCDD (10 nM), were analyzed in parallel cultures grown at 37°C in a 5% CO2 atmosphere.
Envelope quantitation
Cultures were rinsed with phosphate-buffered saline and lysed by addition of 2% sodium dodecyl sulfate (SDS) – 1 mM EDTA - 10 mM Tris buffer (pH 8). After standing overnight, the DNA was sheared by passage of the lysate several times through a 22 gauge needle, and the cell envelopes were pelleted in a clinical centrifuge. The pellet was rinsed in 0.1% SDS and resuspended in 1 ml of this solution for measurement of light scattering (A340) as previously described.20 The values obtained, in the range of 0.35 to 1.0 for cultures treated only with TCDD, were normalized to protein content of the 2% SDS culture lysate. Addition to the lysate of dithioerythritol to 20 mM did not alter the appearance or yield of envelopes.
Digest preparation
After three weeks in culture, the cells were rinsed with 0.5 mM EDTA in phosphate buffered saline, removing residual 3T3 cells, and lysed in 0.4 ml of 2% SDS – 0.05 M Tris buffer (pH 8) – 2 mM EDTA – 25 mM dithioerythritol and pulverized by stirring with a small magnetic stirring bar. The samples were alkylated with iodoacetamide, recovered by precipitation with 1 ml of ethanol, rinsed and digested for 3 days at room temperature in fresh 0.1 M ammonium bicarbonate – 10% acetonitrile with daily additions of methylated TPCK trypsin,21 1% by weight. The digest was clarified by centrifugation and submitted for liquid chromatography tandem mass spectrometry (LC-MS/MS). Samples were prepared from each cell strain in 3 independent experiments.
Mass spectrometry
The samples (adjusted to approximately equal peptide amounts by A280) were acidified with trifluoroacetic acid and loaded onto an Agilent ZORBAX 300SB C18 reverse-phase trap cartridge which, after loading, was switched in-line with a Michrom Magic C18 AQ 200 μm x 150 mm LC column connected to a Thermo-Finnigan LTQ ion trap mass spectrometer through a Michrom Advance Plug and Play nanospray source and CTC Pal autosampler. The nano-LC column was used with a binary solvent gradient; buffer A was composed of 0.1% formic acid and buffer B composed of 100% acetonitrile. The 120 min gradient consisted of the steps increasing buffer B from 2 to 35% over 85 min, increasing buffer B from 35 to 80% over 23 min, holding at 80% Buffer B for 1 min, decreasing buffer B from 80 to 2% over 1 min, and then holding for 10 min, at a flow rate of 2 μl/min, for maximal separation of tryptic peptides. An MS survey scan was obtained for the m/z range 375-1400, and MS/MS spectra were acquired from the 10 most intense ions in the MS scan by subjecting them to automated low energy CID. An isolation mass window of 2 Da was used for the precursor ion selection, and normalized collision energy of 35% was used for the fragmentation. A two minute duration was used for the dynamic exclusion.
Protein identification
Tandem mass spectra were extracted with Xcalibur version 2.0.7. All MS/MS samples were analyzed using X! Tandem (The GPM, thegpm.org; version TORNADO (2011.05.01.1)). X! Tandem was set up to search a Uniprot human database (261004 entries) plus an equal number of reverse sequences assuming trypsin as the digestion enzyme. X! Tandem was searched with a fragment ion mass tolerance of 0.40 Da and a parent ion tolerance of 1.8 Da. Iodoacetamide derivative of cysteine was specified in X! Tandem as a fixed modification. Deamidation of asparagine and glutamine, oxidation of methionine and tryptophan, sulfone of methionine, tryptophan oxidation to formylkynurenin of tryptophan and acetylation of the N-terminus were specified in X! Tandem as variable modifications. Scaffold (Scaffold version 4.0.4, Proteome Software Inc., Portland, OR) was used to validate MS/MS based peptide and protein identifications. Peptide spectrum matches were accepted if they could be established at greater than 80% probability as specified by the Peptide Prophet algorithm (decoy false discovery rate 0.1%).22 Protein identifications were accepted if they could be established with at least 99% probability and contained at least 2 identified peptides (decoy false discovery rate 0.4%). Protein probabilities were assigned by the Protein Prophet algorithm.23 Proteins that contained similar peptides and could not be differentiated based on MS/MS analysis alone were grouped to satisfy principles of parsimony. Numbers of assigned spectra were tabulated. Assigned spectra for the samples were adjusted for shared peptides24 using a locally developed script.25
Statistical analysis
Spectral counting data were analyzed using SAS JMP Genomics software (Version 6.0; SAS Institute Inc., Cary, NC). The data were imported and log2 transformed, with shift factor as 2. After quantile normalization, significant differentially expressed proteins for different treatment conditions for each cell line were identified by ANOVA modeling. The ANOVA model included the cell line, culture treatment and the interaction of cell type and treatment as fixed effects, persons performing the experiments (two) and date of treatment as random effects. The false positive rate was used to filter outlying individual data points with large residuals from the analysis. The criteria for selection were a fold change >2 plus p-value < 0.05.
RESULTS
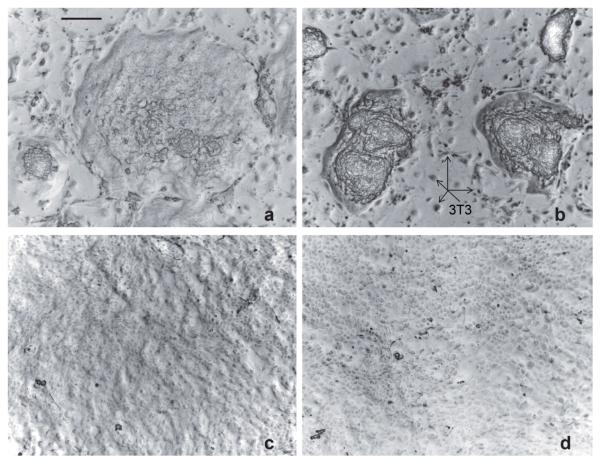
Under the usual culture conditions with EGF supplementation of the medium, adding TCDD had no microscopically obvious effect on growth or colony appearance as the cultures reached and were maintained at confluence. In the absence of EGF, however, where the growth rate is considerably slower, TCDD had a noticeable influence, illustrated in Figure 1 (compare panels a and b). After exposure to TCDD for two weeks, when the effect of treatment was maximal, colony sizes were smaller (confluence was not reached), and the degree of stratification appeared much greater. In previous work, cellular morphology was found also to be altered with the most superficial cells appearing enlarged.17
Figure 1.
Human epidermal (hEpE) cultures after treatments with (a) neither EGF nor TCDD, (b) TCDD only, (c) EGF only and (d) EGF+TCDD. The cultures show the microscopic appearance at the time of harvest, all at the same magnification (scale bar in panel a = 0.2 mm). Among the SIK colonies in (a) and (b), 3T3 feeder layer cells are visible, several of which are indicated by arrows. In (c) and (d), the 3T3 cells (none visible) are pushed off the dishes by the advancing keratinocytes (now confluent), which adhere much more tightly to the dish.
Rapidly growing human epidermal cell cultures synthesize few cross-linked protein envelopes spontaneously, and the number is reduced in cultures grown in the presence of EGF.26 The appearance of cultures grown with TCDD but without EGF raised the possibility that this condition increased envelope formation, a marker of terminal differentiation. As shown in Figure 2, TCDD increased envelope formation at least 5 fold in the absence of EGF for each cell strain. In the presence of EGF, the absolute level of envelope formation was much lower, but TCDD treatment also appeared to increase envelope formation slightly.
Figure 2.
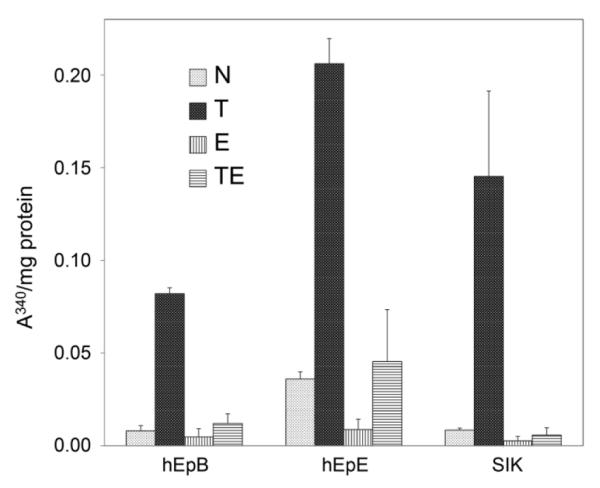
TCDD-induced increases in cross-linked envelope formation. The degree of envelope formation is indicated by light scattering (A340) normalized to protein content of cultures treated as indicated. Shown are the averages and ranges in two samples of each strain. Microscopic counting of envelopes in the samples and, in parallel cultures, total cell numbers permitted estimation of envelope formation as 10-20% in cultures treated with TCDD alone. The cultures were treated with TCDD (T), EGF (E), the combination (TE) or neither (N).
To characterize the cellular response on a more global basis, cultures were submitted to shotgun proteomic analysis. As shown in Supplementary Table S1, 408 proteins were identified by the stringent criteria employed. Among these, 171 displayed significant differences in level among the various treatment conditions by statistical analysis (Supplementary Table S2). Summarizing the numbers of protein differences in these comparisons, Table 1 shows the responsiveness of the cell strains to the various treatment conditions. Hierarchical clustering of pairwise differences among the samples (Supplementary Figure S1) revealed that the untreated cultures were most similar to each other, and the samples treated with EGF only were most similar to each other. However, SIK, hEpB and hEpE together formed a subcluster when treated with either TCDD or TCDD+EGF, indicative of the influence of cell strain. Thus, further analysis focused on changes that were consistently observed among the three cell strains. As indicated in Table 1, cultures treated with TCDD displayed the most changes in protein level compared to untreated cultures, and those treated with TCDD+EGF compared to untreated exhibited the most changes in common among the cultures.
TABLE 1.
Numbers of significant protein changes in response to treatments as judged by pairwise comparisons.
| Treatmenta |
||||||
|---|---|---|---|---|---|---|
| Cells | T vs N | E vs N | T vs E | T vs TE | E vs TE | N vs TE |
| SIK | 21 | 27 | 30 | 11 | 20 | 37 |
| hEpB | 29 | 16 | 24 | 19 | 19 | 37 |
| hEpE | 42 | 23 | 49 | 26 | 20 | 40 |
|
| ||||||
| Totalb | 92 | 66 | 103 | 56 | 59 | 114 |
| Commonc | 18 | 8 | 14 | 7 | 4 | 24 |
Treatments were with TCDD (T), EGF (E), both (TE) or neither (N).
Total significant differences for given conditions.
Number of significant differences seen in at least two of the cell strains.
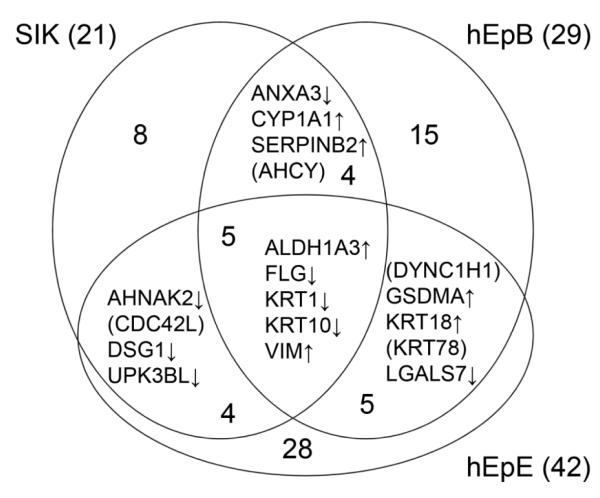
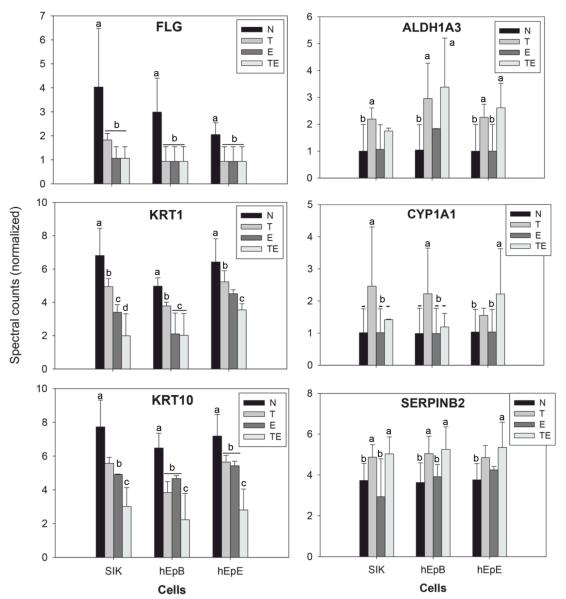
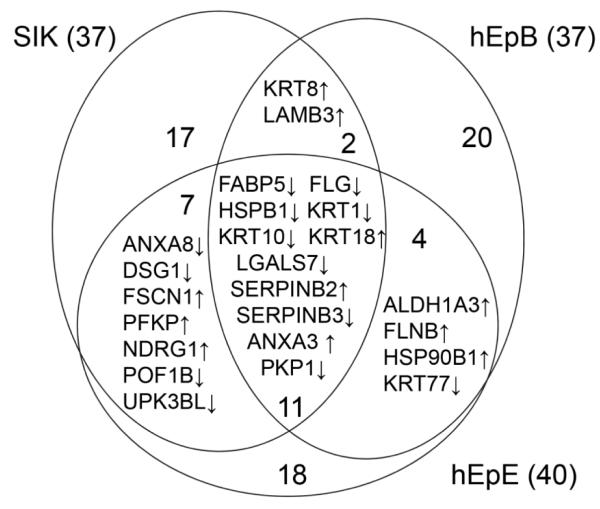
As seen in Figure 3, treatment with TCDD produced changes in 5 proteins in all three strains. Another 13 proteins were seen to change in at least two of the three strains. Among the genes encoding these proteins are several known to be induced by TCDD, including ALDH1A3, CYP1A1 and SERPINB2. Among the proteins consistently suppressed were the major differentiation markers FLG, KRT1 and KRT10. These are all illustrated in Figure 4, which shows the degree of change and its direction under the four treatment conditions for each strain. Comparison of the condition TCDD+EGF with the untreated condition (neither EGF nor TCDD) showed the most protein changes shared by the cell strains (Table 1), identified in Figure 5. Among the 11 proteins found in all three were FLG, KRT1 and KRT10. As seen in Figure 4, these were suppressed further by the combined treatment (TCDD+EGF) than with either TCDD or EGF alone. Among the proteins consistently stimulated by TCDD alone but not by the combination was VIM (Figure 6), not previously known to be stimulated by TCDD. The remaining two way comparisons, displaying a smaller proportion of common changes, are presented in Supplementary Figure S2.
Figure 3.
Common changes in protein level in pairwise comparisons of cultures treated with TCDD versus no treatment. An upward arrow indicates an increase in amount under TCDD treatment compared to no treatment, and a downward arrow shows a decrease under TCDD treatment compared to no treatment. Proteins in parentheses increased in one cell strain and decreased in another.
Figure 4.
Comparison of levels in selected proteins in the four treatment conditions. Filaggrin (FLG), keratin 1 (KRT1) and keratin 10 (KRT10) were suppressed by TCDD (T) and EGF (E). By contrast, aldehyde dehydrogenase (ALDH1A3), cytochrome P4501A1 (CYP1A1), and plasminogen activator inhibitor 2 (SERPINB2) were induced by TCDD in the absence and presence of EGF. Values illustrated are those after quantile normalization. In a given cell strain, different letters indicate significantly different spectral counts (p<0.05).
Figure 5.
Common changes in protein level in pairwise comparisons of cultures treated with TCDD+EGF vs no treatment. An upward arrow indicates an increase in amount TCDD+EGF treatment compared to no treatment, and a downward arrow shows a decrease in TCDD+EGF compared to no treatment.
Figure 6.
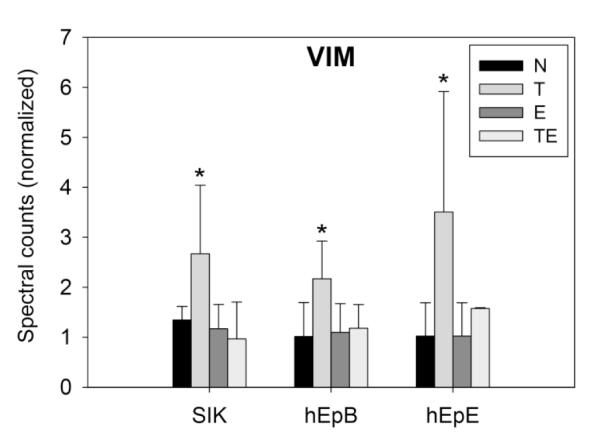
Comparison of levels in vimentin (VIM) in the four treatment conditions. Values illustrated are after quantile normalization. Asterisks indicate that vimentin (VIM) levels in each cell strain treated with TCDD (T) were significantly higher (p<0.05) than in those treated with EGF (E), TCDD+EGF (TE) or no treatment (N).
For this protein analysis, the spectral counts were adjusted for shared peptides, providing a more refined assessment of the peptide yield.24 In parallel, the statistical analysis was also conducted without this adjustment (Supplementary Table S3) to find whether it made a substantial difference in the outcome. In the latter case, changes were detected in 220 proteins in two way comparisons, of which half (109) overlapped those in the analysis adjusted for shared peptides (Figure 7). Most of the protein changes that did not overlap (80 + 4%) were seen in only one treatment condition in a single cell strain. Hierarchical clustering of the sample results was similar to that illustrated in Supplementary Figure S1. Despite the lower accuracy of the unadjusted data, the major changes observed were seen with both, consistent with a previous observation with mouse hair shaft that, for most proteins, relative amounts were not changed substantially.27
Figure 7.
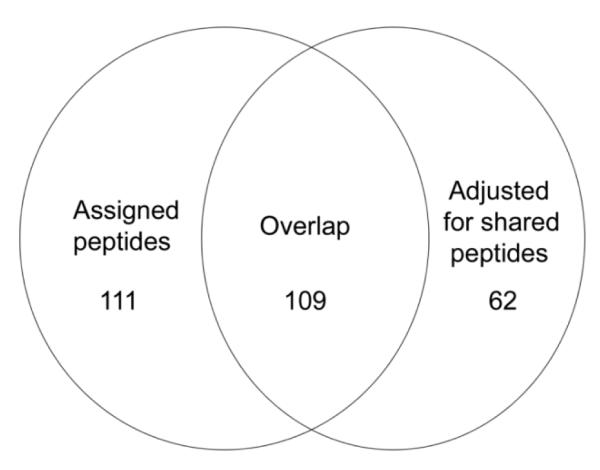
Overlap of protein changes detected with and without adjustment for shared peptides.
DISCUSSION
Transcriptomic and proteomic studies provide a wealth of information that must be carefully evaluated to find critical responses, since many may not be relevant to the phenomenon of interest. The present culture system helps in this effort by permitting study of individual epidermal samples, which display a range of responses reflecting those in the polymorphic human population. Thus, the system can highlight features that are common among a selection of tissue donors. As is generally the case for genetic disease and toxic response, individuals exhibit a range of sensitivities and severities in response to TCDD exposure, presumably due to the modifying influence of alleles of other genes. Thus the present study has permitted a focus on common responses in samples from three individuals.
The success of modeling human tissue responses using cell cultures depends upon the faithfulness with which the cells recapitulate the tissue properties. Human epidermal keratinocytes resemble the natural epithelium in major ways, including expression of differentiation markers, ability to stratify after confluence and rapidly becoming indistinguishable from normal when used as human autografts.28 The surface cultures can be maintained for several weeks where they become well stratified in the absence of EGF, although not as fully as floating organotypic cultures (which lack EGF). Thus, they are appropriate for modeling effects of treatments for extended periods.
Monitoring subjects afflicted with TCDD exposure indicates that epidermal hyperplasia and chloracne do not appear immediately but can occur after days or weeks, and the parakeratotic epidermis displays incomplete keratinization.10 The present results are consistent with such observations as well as findings that TCDD can suppress human keratinocyte differentiation, including keratin content, under certain circumstances in culture.29 They are also consistent with the observation that TCDD stimulates stratification, now seen here to include envelope formation in an estimated 10-20% of the cells in the absence of EGF. The interesting observation that TCDD treatment for one day stimulates transcription of genes, including filaggrin, in the epidermal differentiation complex15, suggests an adaptation process occurs over longer time periods.
Present findings support the observed EGF antagonism of TCDD action in the induction of CYP1A130 and certain members of the epidermal differentiation complex.15 Expression of vimentin fits that scenario, but this phenomenon was not seen in general with the proteins detected. Expression of substantial vimentin but low expression of CYP1A1, suprabasal keratins (KRT1, KRT10) and filaggrin are suggestive of conditions suppressing differentiation such as low calcium medium.31-34 Since TCDD has been reported to increase cytosolic free calcium,35 which the observed increase in cross-linked envelopes could reflect, present results likely reflect an uncoupling of differentiation marker expression, a phenomenon commonly observed as a result of toxic exposures, including in keratinocytes.36 Factors that could help rationalize the EGF reversal of TCDD-induced excessive stratification are the weakening of intercellular junctions37 and the increased motility of the cells, an important factor in EGF’s ability to sustain their growth,38 and its ability to increase epidermal cell desquamation and thus lessen stratification.39
TCDD effects are often species- and cell type-specific.7 The observed perturbation of human keratinocyte homeostasis may be explainable at several levels that are not mutually exclusive. Alteration of transcriptional cofactor level or availability,30, 40 is plausible. Second, perturbing influences could include reactive oxygen generation,41,42 since the degree of differentiation is known to depend on oxygen tension,43 or vitamin A utilization, which can affect envelope formation.44 A third level of explanation involves the response of epidermis to altered expression of certain differentiation markers themselves. The ichthyoses, characterized by defective epidermal barrier function, respond in a compensatory fashion with increased stratification.45 This phenomenon is seen in humans with filaggrin insufficiency or where the gene for KRT10 (or certain other components) has been ablated.46 Thus, an initial perturbation by TCDD of filaggrin and major keratins could lead subsequently to enhanced stratification, providing a rationale for the evident uncoupling of differentiation features.
Supplementary Material
Figure S1. Hierarchical clustering plot of significant differentially expressed proteins from ANOVA. Samples are labeled according to cell strain and treatment with E (EGF), T (TCDD), TE (TCDD+EGF) or neither (N). The color scale on the left indicates the intensity range.
Figure S2. Common changes in protein level in pairwise comparisons. Illustrated are (a) treatment with EGF alone vs no treatment, (b) TCDD alone vs EGF alone, (c) Treatment with EGF alone vs TCDD+EGF and (d) TCDD alone vs TCDD+EGF. Arrows show the direction of change in the first treatment condition compared to the second. Proteins in parentheses showed an increase in one cell strain and a decrease in another strain.
Table S1. Identified proteins - assigned spectra adjusted for shared peptides. Proteins are identified by gene name (column A) and their Uniprot accession numbers (column B).
Table S2. Significant differences in protein expression. For each of the proteins identified, the least square mean (Lsmean) and standard deviation (Std) is shown for the log transformed and normalized protein spectra for a given cell strain under the given treatment condition (yellow and orange highlights, respectively). Also given are the differences in the Lsmean values in pairwise comparisons within each strain under given treatment conditions (green highlight). The p values are given as −log10(p-value of Diff) (pink highlight), and significance of the differences is indicated by 1 (p<0.05) or 0 (p>0.05) (blue highlight). Proteins are identified by gene name (column A) and their Uniprot accession numbers (column B).
Table S3. Identified proteins - Spectra not adjusted for shared peptides. Proteins are identified by gene name (column A) and their Uniprot accession numbers (column B).
ACKNOWLEDGMENTS
We thank Dr. Marjorie A. Phillips for expert strategic advice and technical assistance and Dr. Michael S. Denison for valuable comments on the manuscript. This work was supported by the USA National Institute of Environmental Health Sciences (2P42 ES04699), the National Natural Science Foundation of China (grants 20921063 and 21177150) and the Chinese Academy of Sciences Key Program of Knowledge Innovation (KZCX2-EW-411). The funding agencies had no role in the study design, data collection and analysis, writing or decision to publish the results.
ABBREVIATIONS
- AH
aryl hydrocarbon
- ALDH1A3
aldehyde dehydrogenase 1A3
- CYP1A1
cytochrome P-450 1A1
- EGF
epidermal growth factor
- FLG
filaggrin
- hEpB
human epidermal strain B
- hEpE
human epidermal strain E
- KRT1
keratin 1
- KRT10
keratin 10
- SERPINB2
plasminogen activator inhibitor 2
- SIK
spontaneously immortalized keratinocyte line of human epidermal cells
- TCDD
2,3,7,8-tetrachlorodibenzo-p-dioxin
- VIM
vimentin
Footnotes
Author Contributions The manuscript was written through contributions of all authors. All authors have given approval to the final version of the manuscript.
Notes The authors declare no competing financial interests.
Supporting Information. This material is available free of charge via the Internet at http://pubs.acs.org.
REFERENCES
- 1.Stellman JM, Stellman SD, Christian R, Weber T, Tomasallo C. The extent and patterns of usage of Agent Orange and other herbicides in Vietnam. Natiure. 2003;422:681–687. doi: 10.1038/nature01537. [DOI] [PubMed] [Google Scholar]
- 2.Bertazzi PA, di Domenico A. Chemical, environmental, and health aspects of the Seveso, Italy, accident. In: Schecter A, editor. Dioxins and Health. Plenum Press; New York: 1994. pp. 587–632. [Google Scholar]
- 3.Masuda Y. The Yusho rice oil poisoning incident. In: Schecter A, editor. Dioxins and Health. Plenum Press; New York: 1994. pp. 633–659. [Google Scholar]
- 4.Hsu C-C, Yu M-LM, Chen Y-CJ, Guo Y-LL, Rogan WJ. The Yu-cheng rice oil poisoning incident. In: Schecter A, editor. Dioxins and Health. Plenum Press; New York: 1994. pp. 661–684. [Google Scholar]
- 5.Everts S. Europe’s dioxin scare widens. Chemical and Engineering News. 2011;89:10. [Google Scholar]
- 6.Dioxins and Dioxin-like Compounds in the Food Supply: Strategies to Decrease Exposure. National Academies Press; Washington, DC: 2003. Committee on the Implications of Dioxin in the Food Supply; pp. 110–149. [PubMed] [Google Scholar]
- 7.Denison MS, Soshilov AA, He G, DeGroot DE, Zhao B. Exactly the same but different: promiscuity and diversity in the molecular mechanisms of action of the aryl hydrocarbon (dioxin) receptor. Toxicol Sci. 2011;124:1–22. doi: 10.1093/toxsci/kfr218. [DOI] [PMC free article] [PubMed] [Google Scholar]
- 8.Magiatis P, Pappas P, Gaitanis G, Mexia N, Melliou E, Galanou M, Vlachos C, Stathopoulou K, Skaltsounis AL, Marselos M, Velegraki A, Denison MS, Bassukas ID. Malassezia yeasts produce a collection of exceptionally potent activators of the Ah (dioxin) receptor detected in diseased human skin. J Invest Dermatol. 2013;133:2023–2030. doi: 10.1038/jid.2013.92. [DOI] [PMC free article] [PubMed] [Google Scholar]
- 9.Safe S, Chadalapaka G, Jutooru I. AHR-active compounds in the human diet. In: Pohjanvirta R, editor. AH Receptor in Biology and Toxicology. John Wiley & Sons; Hoboken, NJ: 2012. pp. 331–342. [Google Scholar]
- 10.Panteleyev AA, Bickers DR. Dioxin-induced chloracne – reconstructing the cellular and molecular mechanisms of a classic environmental disease. Exp Dermatol. 2006;15:705–730. doi: 10.1111/j.1600-0625.2006.00476.x. [DOI] [PubMed] [Google Scholar]
- 11.Poland A, Knutson JC. 2,3,7,8-Tetrachlorodibeno-p-dioxin and related halogenated aromatic hydrocarbons: Examination of the mechanism of toxicity. Ann Rev Pharmacol Toxicol. 1982;22:517–554. doi: 10.1146/annurev.pa.22.040182.002505. [DOI] [PubMed] [Google Scholar]
- 12.Greenlee WF, Osborne R, Dold K,M, Hudson LG, Toscano WAJ. Toxicity of chlorinated aromatic compounds in animals and humans: in vitro approaches to toxic mechanisms and risk assessment. Environ Hlth Perspect. 1985;60:69–76. doi: 10.1289/ehp.856069. [DOI] [PMC free article] [PubMed] [Google Scholar]
- 13.Loertscher JA, Sattler CA, Allen-Hoffmann BL. 2,3,7,8-Tetrachlorodibenzo-p-dioxin alters the differentiation pattern of human keratinocytes in organotypic culture. Toxicol Appl Pharmacol. 2001;175:121–129. doi: 10.1006/taap.2001.9202. [DOI] [PubMed] [Google Scholar]
- 14.Loertscher JA, Lin TM, Peterson RE, Allen-Hoffmann BL. In utero exposure to 2,3,7,8-tetrachlorodibenzo-p-dioxin causes accelerated terminal differentiation in fetal mouse skin. Toxicol Sci. 2002;68:465–472. doi: 10.1093/toxsci/68.2.465. [DOI] [PubMed] [Google Scholar]
- 15.Sutter CH, Bodreddigari S, Campion C, Wible RS, Sutter TR. 2,3,7,8-Tetrachlorodibenzo-p-dioxin increases the expression of genes in the human epidermal differentiation complex and accelerates epidermal barrier formation. Toxicol Sci. 2011;124:128–137. doi: 10.1093/toxsci/kfr205. [DOI] [PMC free article] [PubMed] [Google Scholar]
- 16.Rheinwald JG, Green H. Epidermal growth factor and the multiplication of human epidermal keratinocytes. Nature. 1977;265:421–424. doi: 10.1038/265421a0. [DOI] [PubMed] [Google Scholar]
- 17.Rea MA, Phillips MA, deGraffenried LA, Qin Q, Rice RH. Modulation of human epidermal cell response to 2,3,7,8-tetrachlorodibenzo-p-dioxin by epidermal growth factor. Carcinogenesis. 1998;19:479–483. doi: 10.1093/carcin/19.3.479. [DOI] [PubMed] [Google Scholar]
- 18.Rice RH, Steinmann KE, deGraffenried LA, Qin Q, Taylor N, Schlegel R. Elevation of cell cycle control proteins during spontaneous immortalization of human keratinocytes. Molec Biol Cell. 1993;4:185–194. doi: 10.1091/mbc.4.2.185. [DOI] [PMC free article] [PubMed] [Google Scholar]
- 19.Rheinwald JG, Green H. Serial cultivation of strains of human epidermal keratinocytes: the formation of keratinizing colonies from single cells. Cell. 1975;6:331–344. doi: 10.1016/s0092-8674(75)80001-8. [DOI] [PubMed] [Google Scholar]
- 20.Rice RH. Assays for involucrin, transglutaminase and ionophore-inducible envelopes. In: Leigh IM, W. FM, Lane B, editors. Keratinocyte Methods. Cambridge University Press; UK: 1994. pp. 157–165. [Google Scholar]
- 21.Rice RH, Means GE, Brown WD. Stabilization of bovine trypsin by reductive methylation. Biochim Biophys Acta. 1977;492:316–321. doi: 10.1016/0005-2795(77)90082-4. [DOI] [PubMed] [Google Scholar]
- 22.Keller A, Nesvizhskii AI, Kolker E, Aebersold R. Empirical statistical model to estimate the accuracy of peptide identifications made by MS/MS and database search. Analyt Chem. 2002;74:5383–5392. doi: 10.1021/ac025747h. [DOI] [PubMed] [Google Scholar]
- 23.Nesvizhskii AI, Keller A, Kolker E, Aebersold R. A statistical model for identifying proteins by tandem mass spectrometry. Analyt Chem. 2003;75:4646–4658. doi: 10.1021/ac0341261. [DOI] [PubMed] [Google Scholar]
- 24.Zhang Y, Wen Z, Washburn MP, Florens L. Refinements to label free proteome quantitation: how to deal with peptides shared by multiple proteins. Analyt Chem. 2010;82:2272–2281. doi: 10.1021/ac9023999. [DOI] [PubMed] [Google Scholar]
- 25.Elmore JM, Liu J, Smith B, Phinney B, Coaker G. Quantitative proteomics reveals dynamic changes in the plasma membrane during Arabidopsis immune signaling. Molec Cell Proteom. 2012:11. doi: 10.1074/mcp.M111.014555. 10.1074/mcp.M111.014555. [DOI] [PMC free article] [PubMed] [Google Scholar]
- 26.Sun T-T, Green H. Differentiation of the epidermal keratinocyte in cell culture: Formation of the cornified envelope. Cell. 1976;9:511–521. doi: 10.1016/0092-8674(76)90033-7. [DOI] [PubMed] [Google Scholar]
- 27.Rice RH, Bradshaw KM, Durbin-Johnson BP, Rocke DM, Eigenheer RA, Phinney BS, Sundberg JP. Differentiating inbred mouse strains from each other and those with single gene mutations using hair proteomics. PLoS One. 2012;7(12):e51956. doi: 10.1371/journal.pone.0051956. [DOI] [PMC free article] [PubMed] [Google Scholar]
- 28.Compton CC. Cultured epithelial autografts for burn wound resurfacing: Review of observations from an 11-year biopsy study. Wounds. 1996;8:125–133. [Google Scholar]
- 29.Rice RH, Cline PR. Opposing effects of 2,3,7,8-tetrachlorodibenzo-p-dioxin and hydrocortisone on growth and differentiation of cultured malignant human keratinocytes. Carcinogenesis. 1984;5:367–371. doi: 10.1093/carcin/5.3.367. [DOI] [PubMed] [Google Scholar]
- 30.Sutter CH, Yin H, Li Y, Mammen JS, Bodreddigari S, Stevens G, Cole JA, Sutter TR. EGF receptor signaling blocks aryl hydrocarbon receptor-mediated transcription and cell differentiation in human epidermal keratinocytes. Proc Natl Acad Sci USA. 2009;106:4266–4271. doi: 10.1073/pnas.0900874106. [DOI] [PMC free article] [PubMed] [Google Scholar]
- 31.Takagi R, Yamato M, Murakami D, Sugiyama H, Okano T. Low calcium culture condition induces mesenchymal cell-like phenotype in normal human epidermal keratinocytes. Biochem Biophys Res Commun. 2011;412:226–231. doi: 10.1016/j.bbrc.2011.07.069. [DOI] [PubMed] [Google Scholar]
- 32.Yuspa SH, Kilkenny AE, Steinert PM, Roop DR. Expression of murine epidermal differentiation markers is tightly regulated by restricted extracellular calcium concentrations in vitro. J Cell Biol. 1989;109:1207–1217. doi: 10.1083/jcb.109.3.1207. [DOI] [PMC free article] [PubMed] [Google Scholar]
- 33.Bikle DD, Xie Z, Tu CL. Calcium regulation of keratinocyte differentiation. Expert Rev Endocrinol Metab. 2012;7:461–472. doi: 10.1586/eem.12.34. [DOI] [PMC free article] [PubMed] [Google Scholar]
- 34.DiGiovanni J, Gill RD, Nettikumara AN, Colby AB, Reiners JJJ. Effect of extracellular calcium concentration on the metabolism of polycyclic aromatic hydrocarbons by cultured mouse keratinocytes. Cancer Res. 1989;49:5567–5574. [PubMed] [Google Scholar]
- 35.Puga A, Hoffer A, Zhou S, M BJ, D LG, G SH. Sustained increase in intracellular free calcium and activation of cyclooxygenase-2 expression in mouse hepatoma cells treated with dioxin. Biochem Pharmacol. 1997;54:1287–1296. doi: 10.1016/s0006-2952(97)00417-6. [DOI] [PubMed] [Google Scholar]
- 36.Rice RH, Rong X, Chakravarty R. Suppression of keratinocyte differentiation in SCC-9 human squamous carcinoma cells by benzo(a)pyrene, 12-O-tetradecanoylphorbol-13-acetate and hydroxyurea. Carcinogenesis. 1988;9:1885–1890. doi: 10.1093/carcin/9.10.1885. [DOI] [PubMed] [Google Scholar]
- 37.Tran QT, Kennedy LH, Leon Carrion S, Bodreddigari S, Goodwin SB, Sutter CH, Sutter TR. EGFR regulation of epidermal barrier function. Physiol Genomics. 2012;44:455–469. doi: 10.1152/physiolgenomics.00176.2011. [DOI] [PMC free article] [PubMed] [Google Scholar]
- 38.Barrandon Y, Green H. Cell migration is essential for sustained growth of keratinocyte colonies: The roles of transforming growth factor-a and epidermal growth factor. Cell. 1987;50:1131–1137. doi: 10.1016/0092-8674(87)90179-6. [DOI] [PubMed] [Google Scholar]
- 39.Green H. Terminal differentiation of human epidermal cells. Cell. 1977;11:405–415. doi: 10.1016/0092-8674(77)90058-7. [DOI] [PubMed] [Google Scholar]
- 40.Hankinson O. Role of coactivators in transcriptional activation by the aryl hydrocarbon receptor. Arch Biochem Biophys. 2005;433:379–386. doi: 10.1016/j.abb.2004.09.031. [DOI] [PubMed] [Google Scholar]
- 41.Park JY, Shigenaga MK, Ames BN. Induction of cytochrome P4501A1 by 2,3,7,8-tetrachlorodibenzo-p-dioxin or indolo(3,2-b)carbazole is associated with oxidative DNA damage. Proc Natl Acad Sci USA. 1996;93:2322–2327. doi: 10.1073/pnas.93.6.2322. [DOI] [PMC free article] [PubMed] [Google Scholar]
- 42.Kennedy LH, Sutter CH, Leon Carrion S, Tran QT, Bodreddigari S, Kensicki E, Mohney RP, Sutter TR. 2,3,7,8-Tetrachlorodibenzo-p-dioxin-mediated production of reactive oxygen species is an essential step in the mechanism of action to accelerate human keratinocyte differentiation. Toxicol Sci. 2013;132:235–249. doi: 10.1093/toxsci/kfs325. [DOI] [PMC free article] [PubMed] [Google Scholar]
- 43.Ngo MA, Sinitsyna NN, Qin Q, Rice RH. Oxygen dependent differentiation of human keratinocytes. J Invest Dermatol. 2007;126:2507–2515. doi: 10.1038/sj.jid.5700522. [DOI] [PubMed] [Google Scholar]
- 44.Green H, Watt FM. Regulation by vitamin A of envelope cross-linking in cultured keratinocytes derived from different human epithelia. Molec Cell Biol. 1982;2:1115–1117. doi: 10.1128/mcb.2.9.1115. [DOI] [PMC free article] [PubMed] [Google Scholar]
- 45.Schmuth M, Gruber R, Elias PM, Williams ML. Ichthyosis update: towards a function-driven model of pathogenesis of the disorders of cornification and the role of corneocyte proteins in these disorders. Adv Dermatol. 2007;23:231–256. doi: 10.1016/j.yadr.2007.07.011. [DOI] [PMC free article] [PubMed] [Google Scholar]
- 46.Müller FB, Huber M, Kinaciyan T, Hausser I, Schaffrath C, Krieg T, Hohl D, Korge BP, Arin MJ. A human keratin 10 knockout causes recessive epidermolytic hyperkeratosis. Hum Molec Genet. 2006;15:1133–1141. doi: 10.1093/hmg/ddl028. [DOI] [PubMed] [Google Scholar]
Associated Data
This section collects any data citations, data availability statements, or supplementary materials included in this article.
Supplementary Materials
Figure S1. Hierarchical clustering plot of significant differentially expressed proteins from ANOVA. Samples are labeled according to cell strain and treatment with E (EGF), T (TCDD), TE (TCDD+EGF) or neither (N). The color scale on the left indicates the intensity range.
Figure S2. Common changes in protein level in pairwise comparisons. Illustrated are (a) treatment with EGF alone vs no treatment, (b) TCDD alone vs EGF alone, (c) Treatment with EGF alone vs TCDD+EGF and (d) TCDD alone vs TCDD+EGF. Arrows show the direction of change in the first treatment condition compared to the second. Proteins in parentheses showed an increase in one cell strain and a decrease in another strain.
Table S1. Identified proteins - assigned spectra adjusted for shared peptides. Proteins are identified by gene name (column A) and their Uniprot accession numbers (column B).
Table S2. Significant differences in protein expression. For each of the proteins identified, the least square mean (Lsmean) and standard deviation (Std) is shown for the log transformed and normalized protein spectra for a given cell strain under the given treatment condition (yellow and orange highlights, respectively). Also given are the differences in the Lsmean values in pairwise comparisons within each strain under given treatment conditions (green highlight). The p values are given as −log10(p-value of Diff) (pink highlight), and significance of the differences is indicated by 1 (p<0.05) or 0 (p>0.05) (blue highlight). Proteins are identified by gene name (column A) and their Uniprot accession numbers (column B).
Table S3. Identified proteins - Spectra not adjusted for shared peptides. Proteins are identified by gene name (column A) and their Uniprot accession numbers (column B).


