

Abstract
The activin type II receptor (ACVR2) contains 2 identical microsatellites in exon 3 and 10, but only the exon 10 microsatellite is frameshifted in MMR-defective colonic tumors. The reason for this selectivity is not known. We hypothesized that ACVR2 frameshifts were influenced by DNA sequences surrounding the microsatellite. We constructed plasmids in which exon 3 or 10 of ACVR2 were cloned +1bp out-of-frame of EGFP, allowing −1bp frameshift to express EGFP. Plasmids were stably-transfected into MMR-deficient cells, subsequent non-fluorescent cells sorted, cultured, and harvested for mutation analysis. We swapped DNA sequences flanking the exon 3 and 10 microsatellites to test our hypothesis. Native ACVR2 exon 3 and 10 microsatellites underwent heteroduplex formation (A7/T8) in hMLH1−/− cells, but only exon 10 microsatellites fully mutated (A7/T7) in both hMLH1−/− and hMSH6−/− backgrounds, showing selectivity for exon 10 frameshifts and inability of exon 3 heteroduplexes to fully mutate. Substituting nucleotides flanking the exon 3 microsatellite for nucleotides flanking the exon 10 microsatellite significantly reduced heteroduplex and full mutation in hMLH1−/− cells. When the exon 3 microsatellite was flanked by nucleotides normally surrounding the exon 10 microsatellite, fully-mutant exon 3 frameshifts appeared. Mutation selectivity for ACVR2 lies partly with flanking nucleotides surrounding each microsatellite.
Keywords: ACVR2, microsatellite, frameshift mutation, MMR, Microsatellite instability, colonic tumors
INTRODUCTION
Functional human DNA MMR activity requires hMutSα (a heterodimer of hMSH2 and hMSH6) and hMutSβ (a heterodimer of hMSH2 and hMSH3) to recognize and bind mispairs and/or insertion/deletion loops (IDLs) that occur at microsatellite sequences, and hMutLα (a heterodimer of hMLH1 and hPMS2) to help coordinate DNA repair (Acharya et al., 1996; Palombo et al., 1996). More specifically, hMutSα recognizes single nucleotide interstrand mispairs and IDLs containing 1 or 2 looped nucleotides, whereas hMutSβ recognizes IDLs of 2 nucleotides or more (Modrich, 2006). Subsequently, the hMutSα or hMutSβ heterodimer interacts with the hMutLα complex to coordinate excision and repair of the mispair or IDL (Modrich, 2006). Defects in DNA MMR cause microsatellite instability (MSI) due to the inability of the system to recognize or repair frameshifts at the microsatellites (Grady & Carethers, 2008). Germline mutations of hMSH2, hMLH1, hMSH6, or hPMS2 cause Lynch syndrome, which has an 80% lifetime risk for colorectal cancer (CRC), and epigenetic inactivation of hMLH1 by promoter hypermethylation is seen in 15–20% of sporadic CRC (Akiyama et al., 1997; Fishel et al., 1993; Herman et al., 1998; Nicolaides et al., 1994; Papadopoulos et al., 1994; Veigl et al., 1998). CRC from Lynch syndrome and sporadic hMLH1 defective cancer patients display the phenotype of MSI (Grady & Carethers, 2008).
Microsatellite sequences are predominantly located in the non-coding regions of the genome (Thibodeau et al., 1993). However, some microsatellites are present in the exonic coding regions of genes, with accumulation of frameshift mutation within alleles of these genes deregulating normal cellular processes and driving the pathogenesis of CRC with MSI (Jung et al., 2006; Woerner et al., 2005). An A10 microsatellite within the transforming growth factor β receptor 2 (TGFBR2) exon 3 and an A8 microsatellite within ACVR2 exon 10 become −1bp frameshift mutated at both alleles in 70–90% of CRC with MSI (Hempen et al., 2003; Jung et al., 2004; Parsons et al., 1995). These frameshift mutations of TGFBR2 and ACVR2 cause loss of protein expression and their growth suppressive effects that are mediated by intracellular SMAD signaling (Jung et al., 2006; Markowitz et al., 1995). Furthermore, we have measured the mutation rates of TGFBR2 exon 3 and ACVR2 exon 10 and shown that both accumulate frameshift mutations in hMLH1-defective and hMSH6-defective cells after forming heteroduplexes at a constant rate of formation (Chung et al., 2008).
ACVR2 shows exonic selectivity for frameshift mutation. ACVR2 contains identical octoadenine tracts in exon 3 and 10, but only its exon 10 octoadenine tract is mutated in CRC with MSI (Hempen et al., 2003; Jung et al., 2004). The cause for this selectivity is not known, although this is an important concept that potentially drives the pathogenesis of CRC and may determine which genes and coding microsatellites become mutated. The spectra of genes with coding microsatellites are broad but appear to favor tumor suppressors; however, the frequency for mutation of genes is varied in cancers, even when microsatellite lengths are identical. The two identical intragenic ACVR2 microsatellites afforded us an opportunity to accurately measure mutation rates, plus manipulate the sequences surrounding the microsatellite to test the hypothesis that the primary DNA sequence influences microsatellite mutation. In yeast models, it was reported that the 6 nucleotides surrounding mispair influence mispair recognition by MMR proteins and may alter mutation rates (Marsischky & Kolodner, 1999). To study this in a human model, we constructed EGFP plasmids in which a −1 bp frameshift mutation at the coding microsatellites of ACVR2 exon 10 and 3 could be detected by EGFP expression in MMR deficient cells. We also swapped the DNA sequences surrounding exon 10 and 3 microsatellites of ACVR2 to determine if this modifies frameshift mutation rates. Observed in real time, we demonstrate exonic selectivity of ACVR2 exon 10 for frameshift mutation over ACVR2 exon 3 with MMR deficiency, and further demonstrate that DNA sequences flanking the exon 3 and 10 microsatellites of ACVR2 alter frameshift mutation.
MATERIALS AND METHODS
Cloning of pIREShyg2-ACVR2 exon 10-EGFP and pIREShyg2-ACVR2 exon 3-EGFP plasmids
Plasmids pIREShyg2-ACVR2 exon 10-EGFP, containing portions of exon 10 of hACVR2 were constructed previously (Chung et al., 2008). Details of plasmid cloning were previously described (Chung et al., 2008) and the same cloning strategies were used to construct plasmids pIREShyg2-ACVR2 exon 3-EGFP containing portions of exon 3 of hACVR2. Briefly, portions of exon 10 or 3 of ACVR2 (Table 1) were inserted immediately after the start codon of the EGFP gene, either in-frame of EGFP (IF) or +1 bp out of frame of EGFP (OF) in pIREShyg2-EGFP. For experimental plasmids, ACVR2 sequences were cloned +1 bp OF in pIREShyg2-EGFP and thus a −1bp frameshift mutation at the coding microsatellite would allow EGFP expression. Mutation resistant (MR) counterpart plasmids were constructed by interrupting the microsatellites (A8 to A3GA4) using a Quickchange II site-directed mutagenesis kit (Stratagene, La Jolla, CA). The MR ACVR2 plasmids were placed OF (+1bp) and IF to be used as negative and positive controls for EGFP expression, respectively.
Table 1.
Sequences of exon 10 and exon 3 of ACVR2 used for cloning into pIREShyg2-EGFP plasmid.
| ACVR2 plasmids | ACVR2 sequences |
|---|---|
|
| |
| MR ACVR2 exon 10 IF | GACCTGTAGATGAATACATGTTGCCATTTGAGGAGGAAATTGGCCAGCATCCATCTCTTGAAGACATGCAGGAAGTTGTTGTGCATAAAGAAAAGAGGCCTGTTT |
| MR ACVR2 exon 10 OF | GACCTGTAGATGAATACATGTTGCCATTTGAGGAGGAAATTGGCCAGCATCCATCTCTTGAAGACATGCAGGAAGTTGTTGTGCATAAAGAAAAGAGGCCTGTTTT |
| ACVR2 exon 10 OF | GACCTGTAGATGAATACATGTTGCCATTTGAGGAGGAAATTGGCCAGCATCCATCTCTTGAAGACATGCAGGAAGTTGTTGTGCATAAAAAAAAGAGGCCTGTTTT |
| MR ACVR2 exon 3 IF | CTCTGCTTATTTATAGGACTGATTGTGTAGAAAGAAAAGACAGCCCTGAAGTATATT |
| MR ACVR2 exon 3 OF | CTCTGCTTATTTATAGGACTGATTGTGTAGAAAGAAAAGACAGCCCTGAAGTATATTT |
| ACVR2 exon 3 OF | CTCTGCTTATTTATAGGACTGATTGTGTAGAAAAAAAAGACAGCCCTGAAGTATATTT |
| MR ACVR2 exon 10-exon 3 F IF | GACCTGTAGATGAATACATGTTGCCATTTG AGGAGGAAATTGGCCAGCATCCATCTCTTGAAGACATGCAGGAAGTTGTTGTGTATAAAGAAAAGACAGCTGTTT |
| ACVR2 exon 10-exon 3 F OF | GACCTGTAGATGAATACATGTTGCCATTTG AGGAGGAAATTGGCCAGCATCCATCTCTTGAAGACATGCAGGAAGTTGTTGTGTATAAAAAAAAGACAGCTGTTTT |
| MR ACVR2 exon 3-exon 10 F OF | CTCTGCTTATTTATAGGACTGATTGTGCAGAAAGAAAAGAGGCCCCTGAAGTATATT |
| ACVR2 exon 3-exon 10 F OF | CTCTGCTTATTTATAGGACTGATTGTGCAGAAAAAAAAGAGGCCCCTGAAGTATATTT |
Various exon 10 or exon 3 of ACVR2 sequences were inserted immediately after the translation initiation codon of EGFP gene being in frame of the EGFP gene (IF) or +1 bp out of reading frame of the EGFP gene (OF) in pIRES hyg2-EGFP plasmid (Fig. S1). Mutation resistant (MR) plasmids were constructed by interrupting microsatellite sequences (A8 to A3GA4). MR IF and MR OF plasmids were used for positive and negative controls for EGFP expression, respectively. OF plasmids are the experimental plasmids. Six nucleotides (presented in italic) flanking ACVR2 exons 10 or 3 microsatellites on the 5′ and 3′ ends were replaced with the 6 nucleotides (presented in italic) flanking exons 3 or 10 microsatellites to construct ACVR2 exon 10-exon 3 F and ACVR2 exon 3-exon 10 F plasmids, respectively. The first nucleotides (T for exon 10 and G for exon 3) flanking 5′ of the exon 10 or 3 microsatellites were not substituted to avoid generation of a new in-frame stop codon which would interrupt mutation analysis by EGFP expression. With these substituted sequences, MR IF and OF plasmids were constructed. Each substituted sequence had net 4 nucleotide changes (labeled in italic and bold letters) compared to WT sequence.
Cloning of pIREShyg2-ACVR2 exon 10-exon 3 Flanking (F)-EGFP and pIREShyg2-ACVR2 exon 3-exon 10 F-EGFP plasmids
Plasmids pIREShyg2-ACVR2 exon 10-exon 3 F OF and pIREShyg2-ACVR2 exon 3-exon 10 F OF (named as substituted plasmids) were constructed in which six nucleotides flanking ACVR2 exons 10 or 3 microsatellites on the 5′ and 3′ ends were replaced with the 6 nucleotides flanking ACVR2 exons 3 or 10 microsatellites by a site-directed mutagenesis, respectively (Table 1). MR-IF plasmids for each substituted ACVR2 plasmid were constructed (Table 1).
Cell lines, transfection, and selection
The human colon cancer cell lines, HCT116 (hMLH1−/− and hMSH3−/−), DLD-1 (hMSH6−/−), and HCT116+chr3 (hMLH1 restored but hMSH3−/−) were cultured as described previously (Chung et al., 2008). Cells were transfected with the different pIREShyg2-ACVR2-EGFP plasmids (described in Table 1) by using Nucleofector kits (Amaxa, Cologne, Germany) and stable cell lines were generated by hygromycin B (Invitrogen Corp, Carlsbad, CA) selection. After selection, colonies from each cell line were initially pooled and cultured for mutation analysis. All stable cell lines were confirmed by DNA sequencing.
Mutation Analysis by flow cytometry
Details of analysis of mutant cells by flow cytometry were previously described (Chung et al., 2008). Briefly, five thousand non-fluorescent cells expressing MR ACVR2 exon 10 OF, ACVR2 exon 10 OF, ACVR2 exon 10-exon 3 F OF, MR ACVR2 exon 3 OF, ACVR2 exon 3 OF, or ACVR2 exon 3-exon 10 F OF were sorted into 24-well plates by FACS ARIA (Becton Dickinson, San Jose, CA). During the analysis period, cultures were expanded as required to keep cells in exponential growth. Cells were trypsinized, washed in PBS, and resuspended in a total volume of 200 μl of PBS/ 0.5 μg/ml of propidium iodide (PI) and 3% BSA. At specified time points, Cell suspensions from two cultures were analyzed in parallel on a FACSCalibur (Becton Dickinson). The population with dim EGFP fluorescence was designated M1, and the population with bright EGFP fluorescence was designated M2. The counts of M1 and M2 cells were expressed as percentages of total live cell number.
PCR and DNA sequencing
Total cellular DNA from stable cell lines as well as M1 and M2 cell populations were PCR-amplified by specific primers (Fig. S2) using a cloned Pfu DNA polymerase (Stratagene). The PCR products were used for DNA sequencing to identify stable cell lines and frameshift mutations at microsatellites of ACVR2 exon 10 and 3. Additionally, we subcloned PCR-amplified ACVR2 DNA fragments from the M1 and M2 cell populations by utilizing a TA cloning vector (Invitrogen Corp) as per the manufacturer’s protocol. DNA clones were then individually sequenced to determine the prevalence of mutated and WT ACVR2 microsatellite sequences.
Determination of −1 bp frameshift mutation rates of ACVR2 sequences in MMR-deficient cells
Mutation rates were calculated by the “method of the mean” developed by Luria and Delbruck (Luria & Delbruck, 1943) as described previously (Chung et al., 2008).
Statistical analysis
Mutation frequencies and rates of cell lines were compared by T-test or one-way ANOVA.
RESULTS
Selectivity for frameshift mutation of ACVR2 exon 10 over ACVR2 exon 3, and dependence on the DNA MMR background
To measure the exonic selectivity of ACVR2 for frameshift mutation, we utilized stable cell lines containing native ACVR2 exon 10 or 3 sequences within hMLH1−/−, hMSH6−/−, and hMSH3−/− backgrounds (Table S1). At 4 weeks after establishing stable cell lines, the proportion for fluorescent cells within each cell line was measured by flow cytometry. All MR ACVR2 IF cell lines showed fluorescence between 83 and 100 % (median 96%), demonstrating robust EGFP expressional selection efficiency. The hMLH1−/− ACVR2 exon 10 and ACVR2 exon 3 OF cells, and hMSH6−/− ACVR2 exon 10 OF cells revealed newly fluorescent cells ranging between 0.10% and 0.72% (median 0.13%) net fluorescence over counterpart MR ACVR2 exon 10 OF or MR ACVR2 exon 3 OF cells. The hMLH1−/− ACVR2 exon 10 OF cells showed the highest net fluorescence (0.72%) among all stable cell lines. hMSH6−/− ACVR2 exon 3 OF cells and all hMSH3−/− stable cell lines did not show any net EGFP fluorescence.
To establish mutation frequencies of the ACVR2 exon 10 and 3 coding microsatellites in cells with different MMR backgrounds (Table S1), non-fluorescent cells (i.e. cells without baseline mutation) containing either MR ACVR2 exon 10 OF, ACVR2 exon 10 OF, MR ACVR2 exon 3 OF or ACVR2 exon 3 OF were sorted and exponentially grown for 7 to 28 days. EGFP flow cytometric histograms at day 21 were shown in Fig. 1. As we observed previously (Chung et al., 2008), two distinct EGFP expressing cell populations, M1 and M2 were revealed from hMLH1−/− ACVR2 exon 10 OF cells. However, no significant proportion of the M2 population was observed in hMLH1−/− ACVR2 exon 3 OF cells. Additionally, hMSH6−/− ACVR2 exon 3 OF cells revealed only an M1 population whereas hMSH6−/− ACVR2 exon 10 OF revealed both M1 and M2 populations. These findings indicate selectivity for ACVR2 exon 10 mutation in hMLH1−/− and hMSH6−/− backgrounds, with lack of development of ACVR2 exon 3 mutation in the same MMR-deficient backgrounds.
Figure 1. Mutation analysis of cells containing native ACVR2 exon 10 or exon 3 sequences by flow cytometry.
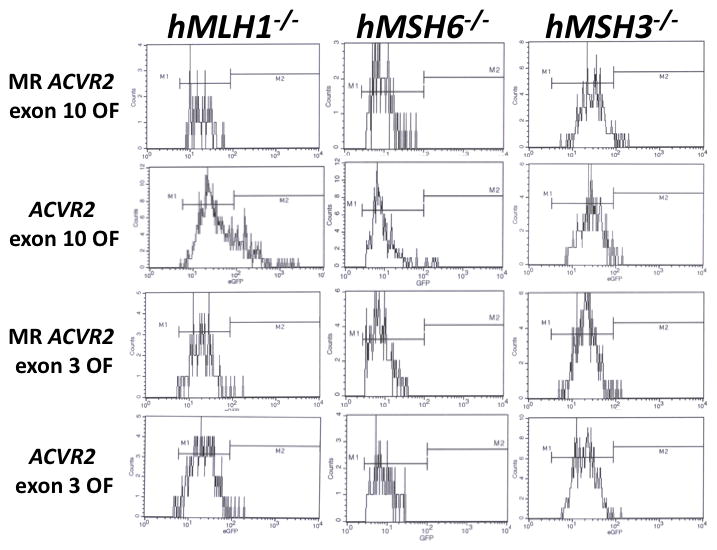
Non-fluorescent cells were sorted and exponentially grown for 7 to 28 days. At specific time points, cells were harvested, and 200,000 cells were analyzed for EGFP expression (identifying a −1bp frameshift mutation) by flow cytometry. Gated live cells were analyzed on an EGFP histogram and two distinct EGFP populations were plotted. The population with dim EGFP expression was designated M1 and the population with bright EGFP expression was designated M2. EGFP histograms of MR ACVR2 exon 10 OF, ACVR2 exon 10 OF, MR ACVR2 exon 3 OF, and ACVR2 exon 3 OF cells in different MMR deficient backgrounds at day 21 were shown as representatives of mutation analysis. Note that scaling of cell counts in each EGFP histogram is different.
We performed sequencing analysis to confirm that fluorescence from the M1 and M2 populations was driven by −1 bp frameshift mutation. At day 21 after plating non-fluorescent cells, the M1 and/or M2 cell populations of MR ACVR2 exon 10 OF, ACVR2 exon 10 OF, MR ACVR2 exon 3 OF, and ACVR2 exon 3 OF from the different MMR deficient backgrounds were sorted and expanded for sequencing analysis (Fig. 2). The M2 populations of ACVR2 exon 10 OF cell lines in hMLH1−/− and hMSH6−/− backgrounds revealed only −1 bp frameshifted microsatellite sequence (A7), indicating full mutant (A7/T7) formation that induces bright EGFP expression as observed previously (Chung et al., 2008). In comparison, the M1 populations of hMLH1−/− ACVR2 exon 10 OF and ACVR2 exon 3 OF cells revealed overlapping sequences, with WT and mutant microsatellite sequences present, highly suggestive of heteroduplex (A7/T8) formation that weakly drives EGFP expression (Chung et al., 2008). The M1 cells from hMLH1−/− ACVR2 exon 10 OF revealed a higher proportion of mutant sequence (the main peak is A7) compared to hMLH1−/− ACVR2 exon 3 OF M1 cells (the main peak is A8) (Fig. 2). These data indicate that the M1 population of hMLH1−/− ACVR2 exon 10 OF cells has a higher tendency for −1bp frameshift mutation than hMLH1−/− ACVR2 exon 3 OF cells and only hMLH1−/− ACVR2 exon 10 OF cells complete the mutation process into an M2 population. The M1 population from hMSH6−/− ACVR2 exon 10 OF cells revealed WT microsatellite sequence, although its M2 population revealed the mutant sequence, and suggests a lower tendency for heterodulpex formation in the hMSH6−/− background compared to the hMLH1−/− background.
Figure 2. Sequences demonstrating frameshift mutation of ACVR2 exon 10 and ACVR2 exon 3 in different human MMR-deficient backgrounds.
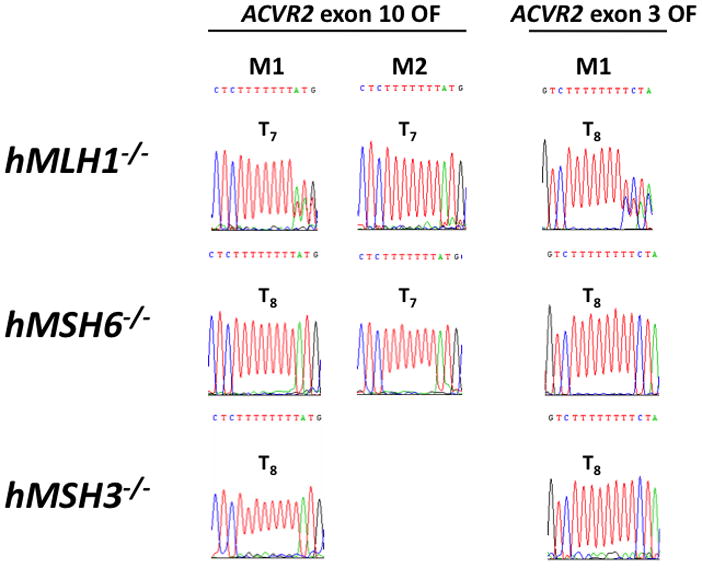
Cells from the M1 and/or M2 populations of ACVR2 exon 10 OF and ACVR2 exon 3 OF cells in different MMR deficient backgrounds (hMLH1−/−, hMSH6−/−, and hMSH3−/−) were sorted and cultured for DNA sequencing analysis. DNA from each cell line was amplified by PCR and anti-sense strand was sequenced to assess for frameshift mutation of the coding microsatellites of ACVR2 exon 10 and ACVR2 exon 3. The M1 population of hMLH1−/− ACVR2 exon 10 OF cells revealed overlapped sequences from mutant (T7) and WT microsatellites (T8) (with the mutant sequence as dominant), indicating heteroduplex formation whereas the M2 populations containing ACVR2 exon 10 OF sequence revealed only mutant microsatellite sequences in both hMLH1−/− and hMSH6−/− backgrounds, indicating full mutant formation. On the other hand, ACVR2 exon 3 OF sequence did not show a full mutant microsatellite sequence (M2 population) in any human MMR deficient backgrounds although its M1 population revealed a mixture of WT (T8) and mutant (T7) sequences (with the WT sequence as dominant) in the hMLH1 −/− background. The M1 population from all MR OF cells, hMSH6 −/− and hMSH3 −/− cells containing ACVR2 exon 10 or exon 3 OF did not show any frameshift mutation.
As we observed previously (Chung et al., 2008), The −1 bp mutation frequency of the M2 population from the ACVR2 exon 10 sequence in the hMLH1−/− background dramatically accumulated over time whereas one of its M1 population showed little change over time (Fig. 3), again indicating that M1 and M2 are distinct populations. In the M1 population, mutation frequency of hMLH1−/− ACVR2 exon 10 cells was higher than other cell lines and increased over time (highest at day 28, 12-fold change), although the increase over time was small when compared to the increase in the M2 population (Fig. 3A). There was no consistent increase in the M1 population in other cell lines. Only the ACVR2 exon 10 sequence in hMLH1−/− and hMSH6−/− backgrounds revealed any prominent M2 population. In the M2 population, ACVR2 exon 10 sequence in the hMLH1−/− background showed its highest mutation frequency over time (up to day 21, 143-fold change) as predicted by the EGFP histograms (Fig. 1) and mutation frequency of the ACVR2 exon 10 sequence in the hMSH6−/− background also increased over time showing its highest mutation frequency on day 28 (5-fold change), although this frequency is much lower than the one of ACVR2 exon 10 sequence in hMLH1−/− cells (Fig. 3B). In hMLH1−/− ACVR2 exon 3 cells, hMSH6−/− ACVR2 exon 3 cells, and all hMSH3−/− cell lines, M2 cells were extremely rare events (average 0.002%) at all time points, with no significant difference in numbers of the M2 population between MR ACVR2 OF and ACVR2 OF cells, as shown in Fig. 1. Thus, fold changes in the M2 population of these cells were 1 at all time points (Fig. 3B).
Figure 3. Mutation frequencies of ACVR2 exon 10 and ACVR2 exon 3 in different MMR backgrounds.
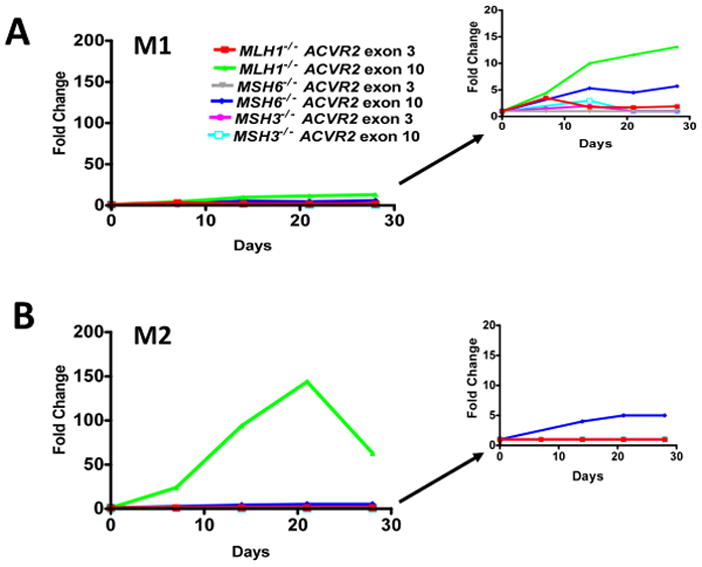
Non-fluorescent cells were analyzed for EGFP expression by flow cytometry at 7, 14, 21, and 28 days after being sorted and cultured. EGFP analysis was performed at each day as shown in Fig. 1. Mutation frequency at each time point was expressed as a fold change using the following formula: (EGFP positive cells/total live cells from ACVR2 OF cells)/(EGFP positive cells/total live cells from MR ACVR2 OF cells). Only the ACVR2 exon 10 sequence in hMLH1−/− and hMSH6−/− cells revealed the M2 (full mutant) population. ACVR2 exon 10 sequence in the hMLH1−/− background showed the highest mutation frequency for both M1 and M2 populations accumulating over time. The M1 populations of ACVR2 exon 10 sequence in the different MMR-deficient backgrounds and the ACVR2 exon 3 sequence in all MMR deficient backgrounds did not show any consistent increase in mutation frequency over time. The M2 population of ACVR2 exon 10 sequence in the hMSH6−/− background had a slight increase in mutation frequency over time, although this frequency is much lower than one of ACVR2 exon 10 sequence in the hMLH1−/− background. Cell lines showing lower mutation frequencies (less than 20-fold change) were separately plotted in the right panel using a smaller y-axis scale. Data are means from two independent experiments at each time point.
The M2 population (full mutants) was used to calculate the mutation rates. The mutation rate of ACVR2 exon 10 microsatellite in hMLH1 deficiency was 1.61 × 10⁻⁴ ± 0.49 × 10⁻⁴. The mutation rate at the microsatellite of ACVR2 exon 10 in hMSH6 deficiency (0.15 × 10⁻⁴ ± 0.02 × 10⁻⁴) is ~10 times lower than one in hMLH1 deficiency. These mutation rates are comparable to ones determined previously (Chung et al., 2008). Mutation rates from hMSH3−/− ACVR2 exon 10 cells and all cell lines containing ACVR2 exon 3 sequences were not calculated due to a lack of M2 populations.
Overall, our data indicate that MMR deficient backgrounds determine the mutation frequency and rate of the coding microsatellites of ACVR2 exon 10 and 3. hMLH1 deficiency provides the highest susceptibility for frameshift mutation at the microsatellites of both exons 10 and 3 of ACVR2 among 3 different MMR deficiencies (hMLH1−/−, hMSH6−/− and hMSH3−/−). Additionally, the microsatellite of ACVR2 exon 10 has a higher susceptibility to a −1 bp frameshift mutation than that of ACVR2 exon 3 in hMLH1 and hMSH6 deficiencies, showing exonic selectivity for a −1 bp frameshift mutation of ACVR2, which is observed in CRC with MSI.
Flanking sequences of ACVR2 microsatellites modify heteroduplex formation and frameshift mutation rates in the hMLH1 −/− background
To address the cause of the exonic selectivity for a −1bp frameshift mutation of ACVR2 in MMR deficiency, we hypothesized that the different mutation rates for each coding microsatellite of ACVR2 could be determined by DNA sequences surrounding the microsatellite. To test this, stable cell lines containing substituted ACVR2 sequences (Table 1), hMLH1−/− MR ACVR2 exon 10-exon 3 F IF, ACVR2 exon 10-exon 3 F OF, MR ACVR2 exon 3-exon 10 F IF, and ACVR2 exon 3-exon 10 F OF cells were generated. Previously generated hMLH1−/− stable cell lines containing the native ACVR2 sequences (Table S1) were used together for comparison of EGFP expression between native and substituted ACVR2 sequences.
To compare mutation frequencies and rates of cells containing native ACVR2 exon 10 and 3 sequences with ones of cells containing substituted ACVR2 exon 10 and 3 sequences in the hMLH1−/− background, non-fluorescent cells containing either MR ACVR2 exon 10 OF, ACVR2 exon 10 OF, ACVR2 exon 10-exon 3 F OF, MR ACVR2 exon 3 OF, ACVR2 exon 3 OF or ACVR2 exon 3-exon 10 F OF were sorted and exponentially grown for 14 to 35 days. EGFP histograms at day 28 were shown in Fig. 4. Consistent with earlier results, in this independent experiment hMLH1−/− ACVR2 exon 3 OF cells revealed only the M1 population whereas hMLH1−/− ACVR2 exon 10 OF cells revealed both M1 and M2 populations. The ACVR2 exon 10 microsatellite with exon 3 flanking sequences (ACVR2 exon 10-exon 3 F OF) showed a 2.6-fold less M1 and 24-fold less M2 populations compared to cells containing native ACVR2 exon 10 OF sequence. In comparison, cells containing ACVR2 exon 3-exon 10 F OF sequence had a 1.5-fold higher M1 population than the cells containing native ACVR2 exon 3 OF sequence. Furthermore, a new M2 population developed in cells containing ACVR2 exon 3-exon 10 F OF sequence that was completely absent in hMLH1−/− ACVR2 exon 3 OF cells. These data indicate that the surrounding sequences of ACVR2 microsatellite alter −1 bp frameshift mutation frequencies in the hMLH1 deficiency.
Figure 4. Mutation analysis of cells containing substituted ACVR2 exons 10 or 3 sequences by flow cytometry.
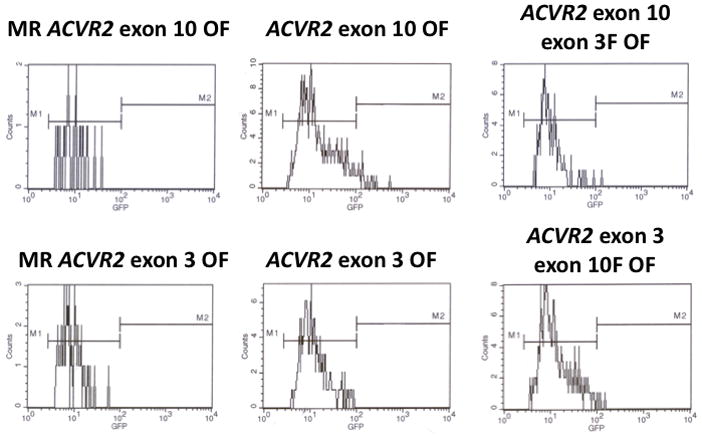
Non-fluorescent cells were sorted and exponentially grown for 14 to 35 days. At specific time points, cells were harvested, and analyzed for EGFP expression by flow cytometry as described in Fig. 1. EGFP histograms of MR ACVR2 exon 10 OF, ACVR2 exon 10 OF, ACVR2 exon 10-exon 3 F OF, MR ACVR2 exon 3 OF, ACVR2 exon 3 OF, ACVR2 exon 3-exon 10 F OF cells in the hMLH1−/− background at day 28 were shown as representatives of mutation analysis. Scaling of cell counts for each EGFP histogram is different.
The −1 bp mutation frequency at each time point was shown in Fig. 5. For the M1 population in this independent experiment, the mutation frequency for hMLH1−/− ACVR2 exon 10 OF cells was higher than other cell lines at all time points and increased up to day 21 (28-fold) and then decreased (Fig. 5). This is consistent in pattern and extent with our earlier results. The M1 population of hMLH1−/− ACVR2 exon 10-exon 3 F OF, ACVR2 exon 3-exon 10 F OF, and ACVR2 exon 3 OF cells showed ~5–20 times less mutation frequency compared to hMLH1−/− ACVR2 exon 10 OF cells, but showed steady-state stable increases in frequency over time. For the M2 population, hMLH1−/− ACVR2 exon 10 OF cells demonstrated the highest mutation frequency over time compared to other cell lines, as predicted in EGFP histograms (Fig. 4). As observed previously (Chung et al., 2008) and in our earlier results, the M2 population in this independent experiment from hMLH1−/− ACVR2 exon 10 OF cells accumulated over time. A significantly decreased mutation frequency (P<0.01) was observed in the M2 population of hMLH1−/− ACVR2 exon 10-exon 3 F OF cells at all time points compared to hMLH1−/− ACVR2 exon 10-OF cells (Fig. 5). hMLH1−/− ACVR2 exon 3 cells did not reveal an M2 population, whereas hMLH1−/− ACVR2 exon 3- exon 10 F OF cells revealed small proportions of an M2 population at day 28 (3-fold change) and day 35 (4-fold change). However, there is no significant difference between the mutation frequencies of hMLH1−/− ACVR2 exon 10-exon 3 F OF and hMLH1−/− ACVR2 exon 3-exon 10 F OF cells at all time points.
Figure 5. Mutation frequencies of native and substituted ACVR2 exons 10 and 3 sequences in the hMLH1−/− background.
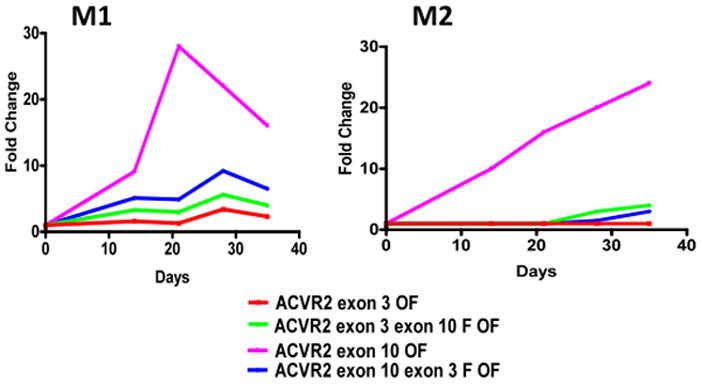
Non-fluorescent cells were analyzed for EGFP expression by flow cytometry at 14, 21, 28, and 35 days after being sorted and cultured, and EGFP analysis was performed at each day as shown in Fig. 4. Mutation frequency at each time point was determined as described in Fig. 3. In the M1 population, hMLH1−/− ACVR2 exon 10 OF cells showed the highest mutation frequency followed by hMLH1−/− ACVR2 exon 10-exon 3F OF, hMLH1−/− ACVR2 exon 3- exon 10F OF, and hMLH1−/− ACVR2 exon 3 OF cells at all time points. The M2 population of hMLH1−/− ACVR2 exon 10 OF cells revealed the highest mutation frequency over time compared to other cell lines. Significantly decreased mutation frequency was observed in the M2 population of hMLH1−/− ACVR2 exon 10-exon 3F OF cells compared to cells containing native ACVR2 exon 10 OF sequence. No full mutant M2 population was observed in hMLH1 −/− ACVR2 exon 3 cells whereas hMLH1−/− ACVR2 exon 3-exon 10 F OF cells revealed its M2 population from day 28. Data are means from two independent experiments at each time point.
To confirm that our EGFP expression experiments resulted in frameshifts, at day 21 after being plated as non-fluorescent cells, the M1 and/or M2 cell populations of hMLH1−/− MR ACVR2 exon 10 OF, ACVR2 exon 10 OF, ACVR2 exon 10-exon 3 F OF, MR ACVR2 exon 3 OF, ACVR2 exon 3 OF, or ACVR2 exon 3-exon 10 F OF cells were sorted and expanded for sequencing analysis. Single cell clones were individually sequenced to assess for frameshift mutation. As expected, nearly all DNA clones (90–100%) from the M2 population of cell lines containing ACVR2 exon 10 OF or ACVR2 exon 10-exon 3 F OF revealed −1 bp frameshifts (A7) (Table 2), indicating full mutant (A7/T7) formation. The M2 population of hMLH1−/− ACVR2 exon 3-exon 10 F OF cells did not commence until day 28 after plating, and thus sequencing analysis for the M2 population of this cell line was not performed. On the other hand, DNA clones from the M1 population of hMLH1−/− ACVR2 exon 10 OF and ACVR2 exon 10-exon 3 F OF revealed 74 and 55% of mutant microsatellite and 26 and 45% of WT microsatellite, respectively (Table 2), indicating heteroduplex (A8/T7) formation. Swapping the surrounding DNA sequences of the ACVR2 exon 10 microsatellite with ones surrounding the ACVR2 exon 3 microsatellite decreased the number of clones with mutant microsatellites from 74 to 55% for the M1 population. In comparison, DNA clones from the M1 population of hMLH1−/− ACVR2 exon 3 OF and ACVR2 exon 3-exon 10 F OF cells increased from 47 to 90% of mutant microsatellites, respectively, indicating that the exon 10 flanking sequences allow a microsatellite to be more prone to mutation with DNA MMR deficiency (Table 2). These sequencing data demonstrate that the flanking sequences of ACVR2 microsatellite alter heteroduplex formation in the hMLH1−/− background.
Table 2.
Frameshift mutation at the coding microsatellites of ACVR2 exon 10 and ACVR2 exon 3 in native and substituted ACVR2 sequences in the hMLH1 −/− background.
| Genes | EGFP intensity | A7/T7 clones | A8/T8 clones | % mutated |
|---|---|---|---|---|
| ACVR2 exon10 | M1 | 14 | 5 | 74 |
| M2 | 18 | 2 | 90 | |
| ACVR2 exon10-exon 3 F | M1 | 10 | 8 | 55 |
| M2 | 20 | 0 | 100 | |
| ACVR2 exon 3 | M1 | 8 | 9 | 47 |
| ACVR2 exon 3-exon 10 F | M1 | 18 | 2 | 90 |
Cells from the M1 and/or M2 populations of hMLH1−/− ACVR2 exon 10 OF, ACVR2 exon 10-exon 3 F OF, ACVR2 exon 3 OF, and ACVR2 exon 3-exon 10 F OF cells were sorted and cultured. DNA from each cell line was amplified by PCR, sub-cloned and all single cell clones were individually sequenced to assess for frameshift mutation at the coding microsatellite. Most DNA clones from the M2 population of hMLH1−/− ACVR2 exon 10 OF and hMLH1−/− ACVR2 exon 10-exon 3 F OF cells revealed −1 bp frameshift mutation (A7), indicating full mutant (A7/T7) formation. Note that hMLH1−/− ACVR2 exon 10-exon 3 F OF cells showed a decrease in mutant M1 clones compared to hMLH1−/− ACVR2 exon 10 OF cells, whereas hMLH1−/− ACVR2 exon 3-exon 10 F OF cells showed an increase in mutant M1 clones compared to hMLH1−/− ACVR2 exon 3 OF cells, indicating that these flanking sequences alter heteroduplex (A8/T7) formation in the hMLH1 −/− background.
As shown in Table 3, the mutation rate for hMLH1−/− ACVR2 exon 10 cells was 4.37 × 10⁻⁵ ± 0.49 × 10⁻⁵. The mutation rate for hMLH1−/− ACVR2 exon 10- exon 3 F OF cells (0.67 × 10⁻⁵ ± 0.37 × 10⁻⁵) is ~6 times lower compared to counterpart cells containing ACVR2 exon 10 OF sequence (P < 0.001) indicating that the exon 3 flanking sequences make a microsatellite less prone to mutation with DNA MMR deficiency. The mutation rate from hMLH1−/− ACVR2 exon 3 cells was 0.00 × 10⁻⁵, as no M2 population developed over 35 days of observation. However, cells containing ACVR2 exon 3-exon 10 F OF sequence revealed a new M2 population at day 28, with a mutation rate of 0.93 × 10⁻⁵ ± 0.51 × 10⁻⁵. These data indicate that the surrounding sequences of ACVR2 microstellites alter mutation rates of the two ACVR2 coding microsatellites in the hMLH1−/− background.
Table 3.
Calculated mutation rates at the coding microsatellites of ACVR2 exon 10 and ACVR2 exon 3 in native and substituted ACVR2 sequences in the hMLH1−/− background.
| Gene | Microsatellite | Flanking sequence | Rate for mutation |
|---|---|---|---|
| ACVR2 exon 10 OF | Exon 10 | Exon10 | 4.37 × 10⁻⁵ ± 0.49 × 10⁻⁵ * |
| ACVR2 exon 10-exon 3 F OF | Exon 10 | Exon 3 | 0.67 × 10⁻⁵ ± 0.37 × 10⁻⁵ |
| ACVR2 exon 3 OF | Exon 3 | Exon 3 | 0.00 × 10⁻⁵ ± 0.00 × 10⁻⁵ |
| ACVR2 exon 3-exon 10 F OF | Exon 3 | Exon 10 | 0.93 × 10⁻⁵ ± 0.51 × 10⁻⁵ |
Data from the M2 cell populations from each time point between day 21 and day 35 were used for mutation rate analysis. Single mutation rates were calculated by combining and averaging time-specific mutation rates. Data shown are mean ± SEM.
P<0.001 comparing hMLH1−/− ACVR2 exon 10 OF cells with each of hMLH1−/− ACVR2 exon 10-exon 3 F OF, hMLH1−/− ACVR2 exon 3 OF, and hMLH1−/− ACVR2 exon 3-exon 10 F OF cells.
DISCUSSION
In this study, we hypothesized that the different frameshift mutation frequencies of the coding microsatellites of ACVR2 exon 10 and 3 in CRC with MSI are determined by DNA sequences flanking the microsatellites. To test this, we utilized stable human MMR cell lines in which we transfected ACVR2 exon 10 and 3 sequences linked out of frame to EGFP (Chung et al., 2008), and these cell lines allowed us to observe mutations occurring in real time. We first show the selectivity for ACVR2 exon 10 frameshift mutation over ACVR2 exon 3 in MMR deficiency using our model. Indeed, as observed in CRC with MSI, only ACVR2 exon 10 frameshift mutation occurred, with none for ACVR2 exon 3 (M2 population) in both hMLH1−/− and hMSH6−/− cells, with neither sequence forming mutations in hMSH3−/− cells. The ACVR2 exon 10 frameshift mutation rate is highest in hMLH1−/− cells, which is 10-fold higher than the mutation rate observed for hMSH6−/− cells. Thus, our human model is consistent with the selectivity observed for CRC, and as we previously described for our observations between mutation for TGFBR2 and ACVR2 (Chung et al., 2008). Here, a clear selectivity exists for mutation of ACVR2 exon 10, whereas ACVR2 exon 3 is relatively protected from frameshift mutation even when DNA MMR function is absent. This dichotomy is remarkable between the two identical length coding microsatellites and perhaps even more remarkable when examining the microsatellites in our model out of the context of the tertiary DNA structure.
We swapped the 5′ and 3′ flanking nucleotides of the ACVR2 exon 10 microsatellite for the ones surrounding the ACVR2 exon 3 microsatellite, and visa versa. These constructs were transfected into hMLH1−/− cells, which show the highest mutation rate for the WT ACVR2 exon 10 microsatellite, and simulates sporadic MSI CRC which contain inactivated hMLH1 by promoter hypermethylation. Here, exon 3 flanking sequences that newly surround the ACVR2 exon 10 microsatellite slow the mutation rate by 6-fold (Table 3), and greatly diminish the accumulation of full mutant (M2) cells (Fig. 5). In the opposing direction, exon 10 flanking sequences that newly surround ACVR2 exon 3 microsatellite allow the new completion of full mutant cells, a feat that the WT ACVR2 exon 3 flanking sequences do not allow at the ACVR2 exon 3 microsatellite. Thus, the sequence context of the ACVR2 coding microsatellites influences their mutation rates. Why this occurs is not clear. It has been previously suggested in yeast MMR that base pairs as far away as 15–18 nucleotides could affect mispair recognition, and that footprinting studies of yeast MSH2-MSH6 indicate that these proteins interact with DNA over a region of 25 nucleotides surrounding a mispair (Harrington & Kolodner, 2007; Marsischky & Kolodner, 1999). Thus, the flanking sequences surrounding a DNA mismatch repairable target could affect the stability of the MMR protein-DNA interaction. This aspect could be tested by studying binding interactions between the human MMR proteins and DNA. Other hypotheses for affecting frameshift mutation include: strength of Watson-Crick hydrogen bonding around a mispair or IDLs, and the nature of the secondary structure of DNA. In our experiments, certainly the primary DNA structure helps dictate mutability of the ACVR2 microsatellites in the absence of DNA MMR.
The establishment of our human model allowed us to clearly observe the occurrence of pass-through heteroduplexes (the M1 population), prior to full mutants (the M2 population). However, heteroduplex formation does not necessarily mean mutation is imminent, as either repair can occur, or the flanking sequences surrounding a microsatellite may prevent full mutation, and our data bear that out. Both ACVR2 exon 10 and 3 microsatellites developed an M1 heteroduplex population in hMLH1−/− cells, but only the ACVR2 exon 10 microsatellite fully mutated. Cloned sequences from hMLH1−/− ACVR2 exon 3 cells revealed a nearly even split between A7 and A8 sequences, very indicative of heteroduplex formation, and which occurred at a slow and steady rate but did not lead to a M2 population. When the flanking sequences from ACVR2 exon 10 microsatellite were placed around the ACVR2 exon 3 microsatellite, heteroduplex formation increased, and corresponded to the new observation of a M2 population. Additionally, when the flanking sequences from ACVR2 exon 3 microsatellite were placed around the ACVR2 exon 10 microsatellite, heteroduplex formation slowed and corresponded to a reduction in the subsequent M2 population. Thus, the flanking sequences alter heteroduplex formation at microsatellite, which determines its ability to become fully frameshifted in the setting of defective MMR.
There are several genes containing coding microsatellites that potentially can be mutated in the setting of DNA MMR deficiency. However, analysis of tumors or cell lines indicates that the mutation frequencies vary widely between genes, even for coding microsatellites of the same length (Hempen et al., 2003; Jung et al., 2004). Additionally, some genes that show some degree of frameshift mutation have not been fully demonstrated that mutation has biological consequences. ACVR2, for example, has been demonstrated to be frameshift mutated, and lose protein expression and tumor suppressor capability in colorectal cancer (Jung et al., 2004; Jung et al., 2007). This study sheds a possible explanation why certain genes may become frameshift mutated in the setting of defective MMR, while others do not, although it does not address subsequent biological functional consequences.
In summary, we demonstrate frameshift mutation selectivity for the ACVR2 exon 10 over the ACVR2 exon 3 microsatellite in human colorectal cells with MMR deficiency in real time. We also demonstrate that this selectivity for frameshift mutation within ACVR2 lies in part with the flanking nucleotides surrounding each microsatellite. Our study has implication for the occurrence of frameshift mutation at other microsatellite sequences and for how MMR deficiency drives frameshift mutation.
Supplementary Material
Acknowledgments
Supported by the United States Public Health Service (DK067287 to JMC), the UCSD Digestive Diseases Research Development Center (DK080506), and the VA Research Service (Merit Review Award to JMC). We thank the support of Moores UCSD Cancer Center Flow Cytometry and DNA Sequencing Shared Resources.
Abbreviations
- TGFBR2
transforming growth factor β receptor 2
- ACVR2
activin type II receptor
- MMR
mismatch repair system
- MSI
microsatellite instability
- IDL
insertion deletion loop
- MR
mutation resistant
- IF
in frame of EGFP
- OF
+1bp out of frame of EGFP
- EGFP
enhanced green fluorescent protein
- CRC
colorectal cancer
Footnotes
Author contributions: Chung H and Carethers JM designed research; Chung H, Young DJ, Lopez CG, Lai J, Holmstrom J, and Cabrera BL, and Ream-Robinson D performed research; Chung H, Lopez CG, and Carethers JM analyzed data; and Chung H and Carethers JM wrote the paper. All authors have approved the final version of this manuscript.
CONFLICT OF INTEREST STATEMENT
The authors declare no conflict of interest.
References
- Acharya S, Wilson T, Gradia S, Kane MF, Guerrette S, Marsischky GT, et al. hMSH2 forms specific mispair-binding complexes with hMSH3 and hMSH6. Proc Natl Acad Sci U S A. 1996;93:13629–34. doi: 10.1073/pnas.93.24.13629. [DOI] [PMC free article] [PubMed] [Google Scholar]
- Akiyama Y, Sato H, Yamada T, Nagasaki H, Tsuchiya A, Abe R, et al. Germ-line mutation of the hMSH6/GTBP gene in an atypical hereditary nonpolyposis colorectal cancer kindred. Cancer Res. 1997;57:3920–3. [PubMed] [Google Scholar]
- Carethers JM, Chauhan DP, Fink D, Nebel S, Bresalier RS, Howell SB, et al. Mismatch repair proficiency and in vitro response to 5-fluorouracil. Gastroenterology. 1999;117:123–31. doi: 10.1016/s0016-5085(99)70558-5. [DOI] [PMC free article] [PubMed] [Google Scholar]
- Chung H, Young DJ, Lopez CG, Le TA, Lee JK, Ream-Robinson D, et al. Mutation rates of TGFBR2 and ACVR2 coding microsatellites in human cells with defective DNA mismatch repair. PLoS ONE. 2008;3:e3463. doi: 10.1371/journal.pone.0003463. [DOI] [PMC free article] [PubMed] [Google Scholar]
- Fishel R, Lescoe MK, Rao MR, Copeland NG, Jenkins NA, Garber J, et al. The human mutator gene homolog MSH2 and its association with hereditary nonpolyposis colon cancer. Cell. 1993;75:1027–38. doi: 10.1016/0092-8674(93)90546-3. [DOI] [PubMed] [Google Scholar]
- Grady WM, Carethers JM. Genomic and epigenetic instability in colorectal cancer pathogenesis. Gastroenterology. 2008;135:1079–99. doi: 10.1053/j.gastro.2008.07.076. [DOI] [PMC free article] [PubMed] [Google Scholar]
- Harrington JM, Kolodner RD. Saccharomyces cerevisiae Msh2-Msh3 acts in repair of base-base mispairs. Mol Cell Biol. 2007;27:6546–54. doi: 10.1128/MCB.00855-07. [DOI] [PMC free article] [PubMed] [Google Scholar]
- Hempen PM, Zhang L, Bansal RK, Iacobuzio-Donahue CA, Murphy KM, Maitra A, et al. Evidence of selection for clones having genetic inactivation of the activin A type II receptor (ACVR2) gene in gastrointestinal cancers. Cancer Res. 2003;63:994–9. [PubMed] [Google Scholar]
- Herman JG, Umar A, Polyak K, Graff JR, Ahuja N, Issa JP, et al. Incidence and functional consequences of hMLH1 promoter hypermethylation in colorectal carcinoma. Proc Natl Acad Sci U S A. 1998;95:6870–5. doi: 10.1073/pnas.95.12.6870. [DOI] [PMC free article] [PubMed] [Google Scholar]
- Jung B, Doctolero RT, Tajima A, Nguyen AK, Keku T, Sandler RS, et al. Loss of activin receptor type 2 protein expression in microsatellite unstable colon cancers. Gastroenterology. 2004;126:654–9. doi: 10.1053/j.gastro.2004.01.008. [DOI] [PubMed] [Google Scholar]
- Jung B, Smith EJ, Doctolero RT, Gervaz P, Alonso JC, Miyai K, et al. Influence of target gene mutations on survival, stage and histology in sporadic microsatellite unstable colon cancers. Int J Cancer. 2006;118:2509–13. doi: 10.1002/ijc.21710. [DOI] [PMC free article] [PubMed] [Google Scholar]
- Jung BH, Beck SE, Cabral J, Chau E, Cabrera BL, Fiorino A, et al. Activin type 2 receptor restoration in MSI-H colon cancer suppresses growth and enhances migration with activin. Gastroenterology. 2007;132:633–44. doi: 10.1053/j.gastro.2006.11.018. [DOI] [PMC free article] [PubMed] [Google Scholar]
- Luria SE, Delbruck M. Mutations of Bacteria from Virus Sensitivity to Virus Resistance. Genetics. 1943;28:491–511. doi: 10.1093/genetics/28.6.491. [DOI] [PMC free article] [PubMed] [Google Scholar]
- Markowitz S, Wang J, Myeroff L, Parsons R, Sun L, Lutterbaugh J, et al. Inactivation of the type II TGF-beta receptor in colon cancer cells with microsatellite instability. Science. 1995;268:1336–8. doi: 10.1126/science.7761852. [DOI] [PubMed] [Google Scholar]
- Marsischky GT, Kolodner RD. Biochemical characterization of the interaction between the Saccharomyces cerevisiae MSH2-MSH6 complex and mispaired bases in DNA. J Biol Chem. 1999;274:26668–82. doi: 10.1074/jbc.274.38.26668. [DOI] [PubMed] [Google Scholar]
- Modrich P. Mechanisms in eukaryotic mismatch repair. J Biol Chem. 2006;281:30305–9. doi: 10.1074/jbc.R600022200. [DOI] [PMC free article] [PubMed] [Google Scholar]
- Nicolaides NC, Papadopoulos N, Liu B, Wei YF, Carter KC, Ruben SM, et al. Mutations of two PMS homologues in hereditary nonpolyposis colon cancer. Nature. 1994;371:75–80. doi: 10.1038/371075a0. [DOI] [PubMed] [Google Scholar]
- Palombo F, Iaccarino I, Nakajima E, Ikejima M, Shimada T, Jiricny J. hMutSbeta, a heterodimer of hMSH2 and hMSH3, binds to insertion/deletion loops in DNA. Curr Biol. 1996;6:1181–4. doi: 10.1016/s0960-9822(02)70685-4. [DOI] [PubMed] [Google Scholar]
- Papadopoulos N, Nicolaides NC, Wei YF, Ruben SM, Carter KC, Rosen CA, et al. Mutation of a mutL homolog in hereditary colon cancer. Science. 1994;263:1625–9. doi: 10.1126/science.8128251. [DOI] [PubMed] [Google Scholar]
- Parsons R, Myeroff LL, Liu B, Willson JK, Markowitz SD, Kinzler KW, et al. Microsatellite instability and mutations of the transforming growth factor beta type II receptor gene in colorectal cancer. Cancer Res. 1995;55:5548–50. [PubMed] [Google Scholar]
- Thibodeau SN, Bren G, Schaid D. Microsatellite instability in cancer of the proximal colon. Science. 1993;260:816–9. doi: 10.1126/science.8484122. [DOI] [PubMed] [Google Scholar]
- Veigl ML, Kasturi L, Olechnowicz J, Ma AH, Lutterbaugh JD, Periyasamy S, et al. Biallelic inactivation of hMLH1 by epigenetic gene silencing, a novel mechanism causing human MSI cancers. Proc Natl Acad Sci U S A. 1998;95:8698–702. doi: 10.1073/pnas.95.15.8698. [DOI] [PMC free article] [PubMed] [Google Scholar]
- Woerner SM, Kloor M, Mueller A, Rueschoff J, Friedrichs N, Buettner R, et al. Microsatellite instability of selective target genes in HNPCC-associated colon adenomas. Oncogene. 2005;24:2525–35. doi: 10.1038/sj.onc.1208456. [DOI] [PubMed] [Google Scholar]
Associated Data
This section collects any data citations, data availability statements, or supplementary materials included in this article.