

Abstract
ULK1 (unc-51 like kinase 1) is a serine/threonine protein kinase that plays a key role in regulating the induction of autophagy. Recent studies using autophagy-defective mouse models, such as atg5- or atg7-deficient mice, revealed an important function of autophagy in adipocyte differentiation. Suppression of adipogenesis in autophagy-defective conditions has made it difficult to study the roles of autophagy in metabolism of differentiated adipocytes. In this study, we established autophagy defective-differentiated 3T3-L1 adipocytes, and investigated the roles of Ulk1 and its close homolog Ulk2 in lipid and glucose metabolism using the established adipocytes. Through knockdown approaches, we determined that Ulk1 and Ulk2 are important for basal and MTORC1 inhibition-induced autophagy, basal lipolysis, and mitochondrial respiration. However, unlike other autophagy genes (Atg5, Atg13, Rb1cc1/Fip200, and Becn1) Ulk1 was dispensable for adipogenesis without affecting the expression of CCAAT/enhancer binding protein α (CEBPA) and peroxisome proliferation-activated receptor gamma (PPARG). Ulk1 knockdown reduced fatty acid oxidation and enhanced fatty acid uptake, the metabolic changes that could contribute to adipogenesis, whereas Ulk2 knockdown had opposing effects. We also found that the expression levels of insulin receptor (INSR), insulin receptor substrate 1 (IRS1), and glucose transporter 4 (SLC2A4/GLUT4) were increased in Ulk1-silenced adipocytes, which was accompanied by upregulation of insulin-stimulated glucose uptake. These results suggest that ULK1, albeit its important autophagic role, regulates lipid metabolism and glucose uptake in adipocytes distinctly from other autophagy proteins.
Keywords: ULK1, ULK2, mTORC1, adipogenesis, adipocytes, lipid metabolism
Introduction
Adipocytes play an important role in maintaining energy homeostasis of our body by storing and releasing lipids in response to nutritional state or energy demand. The function of adipocytes to maintain energy homeostasis is often compromised in obesity and insulin resistance.1,2 Recent studies have shown that autophagy is upregulated in adipocytes from diabetic mice or obese patients.3-8 Adipose-specific deletion of a key autophagy gene, such as atg5 or atg7, led to lean mice and improved insulin sensitivity and glucose homeostasis in the whole body of mice.6,7,9 One of the key features with the mouse models was a reduction in the white adipose tissue (WAT) mass, and an increase in the brown adipose tissue (BAT) mass. Since the higher mass of BAT relative to WAT can improve glucose homeostasis in the body,10-12 the metabolic benefit in those mouse models might be related to the differential switch favoring BAT over WAT during the tissue development. A recent study identified Atg5- and Atg7-independent but Ulk1-dependent macroautophagy.13 This led us to ask whether the phenotypes observed with atg5- or atg7-deficient mice are due to autophagy inhibition or rather due to specific events caused by atg5 or atg7 deficiency. Because of the phenotypic switch of WAT to BAT during the tissue development,6,7,9 it has been difficult to establish autophagy defective-differentiated adipocytes for studying the roles of autophagy in metabolism of differentiated adipocytes.
ULK1 is an evolutionarily conserved serine/threonine protein kinase that plays a key role in the regulation of autophagy,14-19 and is responsible for Atg5- and Atg7-independent macroautophagy.13 ULK1 is phosphorylated by MTORC1 (mechanistic target of rapamcyin complex 1) and AMPK (5′ AMP-activated protein kinase), and is acetylated by a histone acetyltransferase KAT5/TIP60.14-18,20-22 Ulk1 has been shown to be important for macroautophagy and mitophagy in various cell types including reticulocytes, hepatocytes, and fibroblasts.14-18,20-23 ULK1 participates in forming the early membrane structure of autophagosomes.24-27 ULK1 is dispersed in the cytoplasm under nutrient-enriched conditions. In starvation, ULK1 is redistributed to initiate the formation of autophagosomes on the endoplasmic reticulum (ER).25 ULK1 also regulates ATG9 trafficking and thereby facilitates the autophagic membrane elongation.28,29
The human genome has five ULK1 homologs: ULK1, ULK2, ULK3, ULK4, and STK36 (Ser/Thr kinase 36). Among them, only ULK1 and ULK2 are currently known to regulate autophagy.15-19 ULK1 and ULK2 have 52% of identity in the amino acid sequences,30 and they share their binding partners such as ATG13, RB1CC1/FIP200 (focal adhesion kinase family interacting protein of 200 kDa), and C12orf44/ATG101 (whose mouse ortholog is termed 9430023L20RIK).15-17,19,30-33 Mice lacking either ulk1 or ulk2 in the whole body were viable without any significant defect in autophagy or apparent developmental defect.34 Mice lacking both ulk1 and ulk2 died within 24 h of birth,35,36 implying that they appear to compensate for the loss of each other. Although these studies indicate that ULK1 and ULK2 might have some shared functions in the autophagy pathway, their specific roles in autophagy and nonautophagic cellular processes have yet to be elucidated.
In this study, we sought to determine if Ulk1 and Ulk2 have any specific function in regulating lipid and glucose metabolism in adipocytes. Through knockdown approaches, we found that both kinases are important for autophagy, lipolysis, mitochondrial respiration, and protection of adipocytes against oxidative stress. Interestingly, however, unlike ULK2 and other autophagy proteins, ULK1 was dispensable for adipogenesis in 3T3-L1 cells. We found that ULK1 has a positive effect on fatty acid oxidation and a negative effect on fatty acid uptake. Ulk1 knockdown enhanced the expression levels of INSR, IRS1 and SLC2A4/GLUT4, and upregulated insulin-stimulated glucose uptake in 3T3-L1 adipocytes. Ulk2 knockdown had opposing effects on many of the metabolic changes caused by Ulk1 knockdown. These findings demonstrate that Ulk1 and Ulk2, despite their shared functions in autophagy, play distinct roles in the regulation of lipid metabolism and insulin-responsive glucose uptake in adipocytes.
Results
Ulk1 is dispensable for adipogenesis in 3T3-L1 cells
Knockdown of Atg13, Ulk2, Rb1cc1, Atg5, and Becn1 inhibited the accumulation of lipid droplets in 3T3-L1 cells that were induced to be differentiated by insulin, methylisobutylxanthine, and dexamethasone (Fig. 1A).37 The contents of triglycerides were reduced by more than 2-fold in the knockdown cells at day 8 after induction of differentiation (Fig. 1B). This result is consistent with the previous reports showing that Atg5 and Atg7 are important for adipogenesis.6,7,9 Interestingly, however, Ulk1 knockdown did not inhibit adipogenesis and even moderately increased adipogenesis at day 8 (Fig. 1C; Fig. S1A). We confirmed the result using 2 different shRNAs targeting Ulk1 to exclude any off-target effect of shRNA (Fig. S1B and S1C). Consistent with the result above, the expression levels of PPARG and CEBPA, which are positive regulators of adipogenesis,38 were drastically reduced in cells with knockdown of Ulk2 or Atg5 (Fig. 1D and E). We could not observe such reductions in Ulk1-silenced cells (Fig. 1D and E; Fig. S1D). We considered a possibility that no inhibitory effect of Ulk1 knockdown on adipogenesis might be due to lack of Ulk1 expression in adipocytes. This was not the case, since we detected the expression of Ulk1 in 3T3-L1 adipocytes (Fig. 1E) and in adipocytes isolated from mice (Fig. S1E).

Figure 1.Ulk1 is not required for adipogenesis in 3T3-L1 cells. (A) Knockdown of autophagy genes, except Ulk1, suppresses adipogenesis. 3T3-L1 cells were transduced by shRNAs specific to each autophagy gene. As a control, 3T3-L1 cells were transduced by scrambled (SC) shRNA. The shRNA-transduced cells were induced to be differentiated into adipocytes in medium containing methylisobutylxanthine, dexamethasone, and insulin as described previously.37 At day 8, cells were stained with Oil Red O. (B) Quantitative analysis of intracellular triglyceride content at day 8. Triglycerides were extracted from Oil Red O-stained cells with isopropanol, and the contents were analyzed by measuring the optical density at 490 nm. Values were normalized by protein concentration and presented as mean ± SD *P < 0.01 relative to shRNA-SC cells. (C) Quantitative analysis of intracellular triglyceride content over the period of differentiation. Mean ± SD from 3 independent experiments. *P < 0.01 relative to scrambled control cells. (D) western blot analysis of CEBPA and the gene knockdown in shRNA-transduced cells. (E) ULK1 and ULK2 reciprocally regulate their expression in adipocytes. The expression levels of ULK1, ULK2, and ATG5 in shRNA-transduced adipocytes at day 8 were analyzed by western blotting and quantitative real time RT-PCR. (F) Knockdown of both Ulk1 and Ulk2 suppresses adipogenesis to a similar extent as knockdown of Ulk2 alone. (G) Quantitative analysis of intracellular triglyceride content over the period of differentiation. Values are mean ± SD from 5 independent experiments. *P < 0.01 relative to control cells. (H) western blot analysis of the effects of knocking down both Ulk1 and Ulk2 on the expression of PPARG and CEBPA.
A noteworthy change in Ulk1-silenced adipocytes was upregulation of Ulk2 mRNA level (Fig. 1E). Reciprocally, knockdown of Ulk2 increased ULK1 protein level in 3T3-L1 adipocytes (Fig. 1E). Knockdown of both Ulk1 and Ulk2 suppressed adipogenesis along with reduction in the expression levels of PPARG and CEBPA to similar extents as Ulk2 knockdown alone (Fig. 1F–H). This result suggests that the upregulation of ULK1 in Ulk2-silenced cells did not contribute to adipogenesis in 3T3-L1 cells, whereas it is possible that the upregulation of ULK2 in Ulk1-silenced cells might have contributed to adipogenesis. To further clarify the effects of Ulk1 and Ulk2 on adipogenesis, we attempted to generate 3T3-L1 cells that stably express ULK1 or ULK2. 3T3-L1 cells stably transduced to express exogenous ULK1 or ULK2 could not survive after several passages during selection. This might be because of toxic effects by exogenous ULK1 or ULK2 expressed at nonphysiological levels in 3T3-L1 cells. Knockdown of both Ulk1 and Atg5 in 3T3-L1 cells suppressed adipogenesis to a similar extent as Atg5 knockdown alone (Fig. S1F and S1G). This indicates that Atg5 is important for adipogenesis in Ulk1-silenced 3T3-L1 cells and that Ulk1 knockdown may not disturb the functions of Atg5 that are critical for adipogenesis.
ULK1, ULK2, and MAP1LC3-II are upregulated during 3T3-L1 differentiation
To clarify whether the distinct effect of Ulk1 knockdown on adipogenesis is related to autophagy, we analyzed the molecular changes in the autophagy proteins MAP1LC3/LC3, ULK1, and ULK2 and MTORC1 activity in differentiating 3T3-L1 cells. Interestingly, MAP1LC3-II level was increased along with the day of differentiation, suggesting that basal autophagy might be upregulated during differentiation of 3T3-L1 cells. The levels of ULK1 and ULK2 were largely increased in vehicle-treated 3T3-L1 cells at day 4 and 6 after differentiation. This implies that ULK1 and ULK2 might have important functions in differentiating or differentiated adipocytes. MTORC1 activity, which is reflected by RPS6KB1/S6K1 phosphorylation, was also increased in vehicle-treated cells during differentiation (Fig. 2A). When 3T3-L1 cell differentiation was induced in the presence of rapamycin, an MTORC1 inhibitor that induces autophagy, the level of MAP1LC3-II was much largely increased (Fig. 2A). Rapamycin almost completely suppressed 3T3-L1 differentiation as already shown by other studies (Fig. S2A).39 Rapamycin also suppressed the increases of ULK1 and ULK2 induced during differentiation (Fig. 2A), implying that their expression or stability might be regulated by an MTORC1-dependent process during differentiation. This result is consistent with the positive roles of MTORC1 and basal autophagy in differentiation of 3T3-L1 cells, whereas MTORC1 inhibition-induced autophagy might not be necessary for adipogenesis.

Figure 2.Ulk1 and Ulk2 are important for basal and rapamycin-induced autophagy in adipocytes. (A) The levels of MAP1LC3-II, ULK1 and ULK2, and MTORC1 activity were increased during differentiation of 3T3-L1 cells. Rapamycin induced a large increase in MAP1LC3-II level but suppressed the increases of ULK1, ULK2, CEBPA and P-RPS6KB1 during differentiation. 3T3-L1 cells were differentiated in the presence or absence of rapamycin (50 nM) as described in Materials and Methods. (B) Knockdown of Ulk1, Ulk2, or Atg5 suppressed rapamycin-induced autophagy in 3T3-L1 preadipocytes. 3T3-L1 cells stably transduced by shRNA were treated with rapamycin (50 nM) or DMSO (vehicle) for 4 h in the presence or absence of HCQ (10 μM). (C) Knockdown of Ulk1, Ulk2, or Atg5 suppressed basal and rapamycin-induced autophagy in 3T3-L1 adipocytes. The shRNA-transduced 3T3-L1 cells were fully differentiated in the presence of troglitazone as described in Materials and Methods. At day 8, cells were treated with rapamycin (100 nM) for 5 h, and the proteins were analyzed by western blotting. (D) Knockdown of Ulk1, Ulk2 or Atg5 inhibited the formation of autophagosome in adipocytes. The shRNA-transduced adipocytes were treated with rapamycin for 5 h in the presence of pepstatin A and E-64 (10 μg/ml each), the inhibitors of lysosomal proteases. Autophagosomes were analyzed by electron microscopy (EM) and immunostaining of endogenous MAP1LC3. Representative EM images and MAP1LC3-positive autophagosomes are shown. Red arrows point to autophagosome. Nucleus was stained by DAPI (blue). (E) Quantitative analysis of the number of autophagosome per cell from EM images. Horizontal bars are mean ± SD.
Ulk1 and Ulk2 are important for MTORC1 inhibition-induced autophagy in preadipocytes
In order to understand how Ulk1 and Ulk2 affect basal and rapamycin-induced autophagy in 3T3-L1 cells, we analyzed the effect of the autophagy gene knockdown on MAP1LC3 levels in 3T3-L1 preadipocytes. Knockdown of Ulk1, Ulk2, or Atg5 suppressed rapamycin-induced accumulation of MAP1LC3-II in the presence of a lysosomal inhibitor hydroxychloroquine (HCQ) (Fig. 2B). This implies that Ulk1, Ulk2, and Atg5 might be important for MTORC1 inhibition-induced autophagy flux in 3T3-L1 preadipocytes. We were not able to detect MAP1LC3-II levels in 3T3-L1 preadipocytes treated with vehicle, suggesting that the basal level of autophagy might be relatively low in preadipocytes. Since MTORC1 negatively regulates ULK1,40-42 we considered the possibility that rapamycin might inhibit adipogenesis via ULK1 activation. Rapamycin could still suppress adipogenesis in Ulk1-silenced 3T3-L1 cells (Fig. S2B and S2C), suggesting that MTORC1 inhibition suppresses adipogenesis not through ULK1 activation. The result also suggests that MTORC1 activity is important for adipogenesis even in Ulk1-silenced cells. From these results, we conclude that MTORC1 inhibition-induced autophagy depends on Ulk1, Ulk2, and Atg5 in preadipocytes. Since Ulk1 knockdown suppressed MTORC1 inhibition-induced autophagy but not adipogenesis, the result suggests that MTORC1 inhibition-induced autophagy might not be important for adipogenesis.
Ulk1 and Ulk2 are important for basal and MTORC1 inhibition-induced autophagy in adipocytes
The suppression of adipogenesis in autophagy-defective 3T3-L1 cells had not allowed us to study the functions of the autophagy genes in differentiated adipocytes. To overcome this difficulty, we treated cells with troglitazone, an agonist of PPARs, that is used to enforce adipogenesis.39,43-46 When troglitazone was added during the first two days of differentiation, all the shRNA-transduced cells accumulated lipid droplets to similar extents as control cells (Fig. S2D and S2E). Using the troglitazone-treated cells, we assessed the effects of knockdown on autophagy in fully differentiated adipocytes, minimizing the effects on autophagy due to differentiation. In the fully differentiated adipocytes, most of MAP1LC3 existed as MAP1LC3-II in the control shRNA-transduced adipocytes (Fig. 2C, lane 1). The increase of MAP1LC3-II was largely suppressed by knockdown of Ulk1, Ulk2, or Atg5 (Fig. 2C), suggesting that Ulk1, Ulk2, and Atg5 might be important for basal autophagy in differentiated adipocytes. The finding that the autophagy gene-silenced cells were fully differentiated in the presence of troglitazone implies that PPARG activation might overcome the inhibitory effects of defective autophagy on adipogenesis. Supporting the involvement of PPARG in autophagy-dependent adipogenesis, knockdown of Ulk2 or Atg5 suppressed the expression of PPARG in troglitazone-untreated 3T3-L1 cells (Fig. 1E). On the other hand, Ulk1 knockdown did not suppress the expression of PPARG, suggesting that the distinct effect of Ulk1 knockdown on adipogenesis might be related to its nonsuppressive effects on the PPARG pathway.
Knockdown of Ulk1 or Atg5 also suppressed the rapamycin-induced increase of MAP1LC3-II level (Fig. 2C). Rapamycin reduced the level of SQSTM1/p62, a protein that is degraded through autophagy, in control cells but not in the autophagy gene knockdown cells. Knockdown of Ulk2 suppressed the rapamycin-induced increase of MAP1LC3-II to a less extent compared with Ulk1 knockdown (Fig. 2C), implying that Ulk2 might be less important than Ulk1 for rapamycin-induced autophagy in 3T3-L1 adipocytes. Electron microscopy and immunostaining analysis revealed that knockdown of Ulk1, Ulk2, or Atg5 reduced the number of autophagosomes in 3T3-L1 adipocytes (Fig. 2D and E; Fig. S3). Knockdown of the autophagy genes did not completely suppress the formation of MAP1LC3-II and autophagosomes (Fig. 2D and E; Fig. S3). This might imply the existence of distinct types of autophagy that are differently regulated by Ulk1, Ulk2, and Atg5 (Fig. 2D; Fig. S3). Ulk1 might be dispensible for a certain type of autophagy that is regulated by Ulk2 and Atg5 and is critical for PPARG activation and adipogenesis. Further investigation is necessary to clarify whether Ulk1 and Ulk2 regulate distinct types of autophagy that have different effects on adipogenesis.
Ulk1 and Ulk2 negatively regulate MTORC1 signaling in adipocytes
Using the autophagy-defective adipocytes that we established above, we were able to study the roles of autophagy in metabolism of differentiated adipocytes. We first investigated whether knockdown of the autophagy genes affects the activity of the insulin/insulin-like growth factor 1-AKT-MTORC1 pathway that is important for adipogenesis and adipocyte metabolism.39,47 In previous studies, Ulk1 and Ulk2 were shown to negatively regulate MTORC1 activity in multiple cell types.40-42 Consistent with the previous studies, we found that knockdown of either Ulk1 or Ulk2 in 3T3-L1 adipocytes enhanced the effect of insulin to stimulate the phosphorylation of RPS6KB1 at Thr389 (Fig. 3A and B). The increase of insulin-stimulated phosphorylation of RPS6KB1 was also observed in Atg5-silenced adipocytes (Fig. 3B), suggesting that insulin signaling to MTORC1 might be upregulated in the autophagy-defective adipocytes. Insulin increased the phosphorylation of AKT at Ser473 to similar extents between the shRNA-transduced cells at earlier time points, whereas a prolonged incubation with insulin over 120 min reduced the AKT phosphorylation in all the shRNA-transduced adipocytes except Ulk1 shRNA-transduced adipocytes (Fig. 3A and B). Ulk1 knockdown also suppressed the reduction of RPS6KB1 phosphorylation at the prolonged insulin treatment. Given the important role of insulin-AKT-MTORC1 signaling in adipogenesis, this result supports a possibility that the distinct effect of Ulk1 knockdown on adipogenesis might be related to the sustained activation of AKT and MTORC1 in Ulk1-silenced cells during the prolonged insulin treatment.
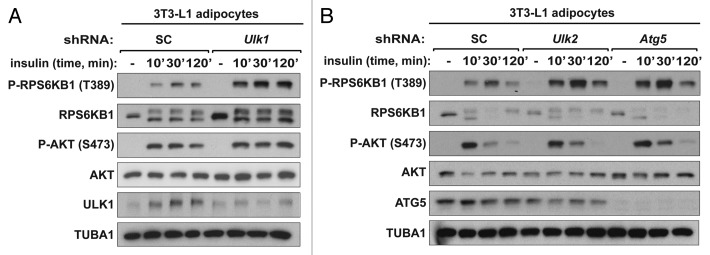
Figure 3.Ulk1 and Ulk2 negatively regulate MTORC1 in 3T3-L1 adipocytes. (A) Knockdown of Ulk1 enhanced the MTORC1 activity and showed a sustained phosphorylation of RPS6KB1 and AKT in 3T3-L1 adipocytes. At day 8 of differentiation, shRNA-transduced cells were starved of serum overnight and incubated with insulin (10 nM) for the indicated period of minutes. (B) Knockdown of Ulk2 or Atg5 enhanced MTORC1 activity, but did not show a sustained phosphorylation of RPS6KB1 and AKT. The shRNA-transduced adipocytes were prepared as in (A).
Ulk1 and Ulk2 are important for mitochondrial respiration, ATP production, and protection of adipocytes from oxidative stress
Using the autophagy-defective adipocytes established above, we analyzed a variety of other metabolic changes that can affect adipogenesis. Previous studies have shown that autophagy inhibition in adipocytes induces a large accumulation of mitochondria.6,7,9 Since mitochondria are the major cellular place where fatty acid oxidation occurs, we considered a possibility that Ulk1 and Ulk2 might regulate the mitochondrial content and thereby affect lipid metabolism. Consistent with this possibility, we found that knockdown of Ulk1, Ulk2, or Atg5 drastically increased the mitochondrial DNA content in adipocytes (Fig. 4A). Despite the increases in mitochondrial content, a significant decrease was observed with the oxygen consumption rate and ATP turnover rate (Fig. 4B and C). This indicates that the majority of the accumulated mitochondria might be defective or inefficient in producing ATP.

Figure 4.Ulk1 and Ulk2 are important for mitochondrial respiration and ATP production. (A) Knockdown of Ulk1, Ulk2, or Atg5 (day 8) enhanced mitochondrial DNA (mtDNA) content. The detailed procedure to analyze the mtDNA content is described in Supplemental Information. (B) Knockdown of Ulk1, Ulk2, or Atg5 in adipocytes reduced the mitochondrial oxygen consumption rate. The oxygen consumption rate was measured using a XF24 extracellular flux analyzer following the manufecturer’s protocol. (C) Knockdown of Ulk1, Ulk2, or Atg5 reduced the ATP turnover rate, which was also measured using a XF24 flux analyzer. (D) Intracellular ROS levels were measured using CM-H2DCFDA, a cell permeable nonfluorescent precursor. The y-axis represents fluorescence value per μg of protein amount. (E) The level of matrix superoxides in isolated mitochondria was measured using MitoSOX red (Invitrogen). The y-axis represents the product of OH-TPP-E+ per g/ml of mitochondrial protein. (F) Knockdown of Ulk1, Ulk2, or Atg5 increased protein carbonylation. Carbonylation was assayed using EZ-link Biotin Hydrazide. (G) Quantitative analysis of protein carbonylation. The values were obtained from the band intensities of carbonylated proteins labeled with * in (F). The y-axis represents values relative to the intensities in scrambled shRNA cells. All values in this figure are presented as mean ± SD *P < 0.05; **P < 0.01 relative to control cells. Detailed procedures for the experiments in this figure are described in the Materials and Methods section.
The mitochondria with the reduced functionality can be the major source of the reactive oxygen species (ROS) and oxidative stress.48 Indeed, we found that knockdown of Ulk1, Ulk2 , or Atg5 in 3T3-L1 adipocytes increased the intracellular ROS level by 2–3 fold (Fig. 4D). We isolated mitochondria from the shRNA-transduced adipocytes and confirmed that the increases of the ROS production occurred with mitochondria (Fig. 4E). Oxidative stress can influence many cellular events in adipocytes including the stress-responsive signal transduction pathway involving MAPK14.49,50 Consistent with the upregulation of oxidative stress, knockdown of Ulk1, Ulk2, or Atg5 increased the phosphorylation of MAPK14 at Thr180/Tyr182 (Fig. S4). The increase in the ROS level was also accompanied by 3- to 7-fold increases in the carbonylation of cellular proteins (Fig. 4F and G). Carbonylation of mitochondrial proteins could disrupt the electron transport chain and thereby cause mitochondrial dysfunction reducing the ATP production.44 This result suggests that Ulk1, Ulk2, and Atg5 are important for protecting adipocytes from oxidative stress and the loss of the mitochondrial functionality.
Ulk1 regulates lipid breakdown positively and lipid accumulation negatively in adipocytes, whereas Ulk2 has opposing effects
Knowing the changes in the mitochondrial content and functionality induced by the autophagy gene knockdown, we investigated whether the autophagy genes regulate the mitochondrial capacity to oxidize free fatty acids. Consistent with the reduction in the mitochondrial respiration, knockdown of Ulk1 suppressed the β-oxidation of oleic acids (Fig. 5A). By contrast, knockdown of Ulk2 or Atg5 increased the β-oxidation of oleic acids by about 20–25%. This result is consistent with previous studies showing that atg7 deficiency increased fatty acid oxidation in adipocytes.6,7 We wondered how Ulk2, Atg5, and Atg7 negatively regulate the β-oxidation of oleic acids, despite their important roles in the mitochondrial respiration. The mitochondrial respiration in adipocytes may depend on the availability of intracellular free fatty acids from lipolysis of triglycerides. We found that knockdown of Ulk1, Ulk2, or Atg5 significantly reduced basal lipolysis in 3T3-L1 adipocytes (Fig. 5B). This reduction of lipolysis might be due to a reduced autophagic clearance of lipid droplets as shown in a previous study with atg7-deficient hepatocytes,51 rather than the hormone-sensitive, lipase-mediated lipolysis (Fig. S5). The mitochondrial respiration might be reduced due to the reduction in basal lipolysis and the subsequential reduction in the intracellular free fatty acids as well as the accumulated, dysfunctional mitochondria (Fig. 4). Distinctly, the β-oxidation in our assay reflects the oxidation of the isotope-labeled oleic acids added to cells rather than free fatty acids derived from lipolysis. The higher content of mitochondria or increased levels of enzymes involved in the fatty acid oxidation might have positively contributed to oleic acid oxidation in Ulk2- or Atg5-silenced adipocytes, although the oxidation might be compromised to some extent by the accumulated, dysfunctional mitochondria.
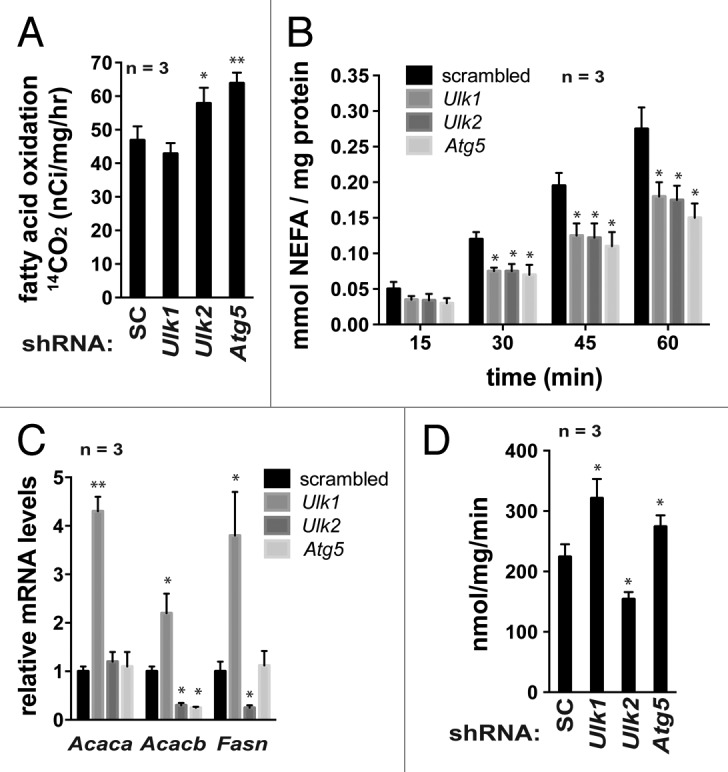
Figure 5.Ulk1 regulates lipid breakdown positively and lipid accumulation negatively in adipocytes, whereas Ulk2 has opposing effects. (A) Ulk1 and Ulk2 have opposing effects on fatty acid β-oxidation in adipocytes. Fatty acid oxidation in 3T3-L1 adipocytes (day 8) was assayed by incubating cells with [1-14C]-oleic acids. (B) Knockdown of Ulk1, Ulk2 or Atg5 reduced basal lipolysis in adipocytes The content of non-esterified fatty acids was analyzed at the indicated period of time. (C) Expression of ACACA, ACACB, and FASN is differently affected by Ulk1 and Ulk2. The mRNA levels were analyzed by quantitative real-time RT-PCR. (D) Ulk1 and Ulk2 have opposing effects on fatty acid uptake. The update of oleic acids was analyzed using 3T3-L1 adipocytes at day 8. All the values in this figure are presented as mean ± SD *P < 0.05; **P < 0.01 relative to control cells. Detailed procedures for the experiments in this figure are described in the Materials and Methods section.
Other metabolic activities that can affect the accumulation of triglyceride are fatty acid synthesis and uptake. Ulk1 knockdown significantly increased the expression levels of acetyl CoA carboxylase 1 (ACACA/ACC1), ACACB/ACC2 and fatty acid synthase (FASN), the key enzymes involved in fatty acid synthesis, whereas Ulk2 knockdown reduced the expression levels of ACACB and FASN (Fig. 5C). This result suggests that Ulk1 might play a negative role in the regulation of fatty acid synthesis. We also analyzed fatty acid uptake by measuring the cellular influx of 3H-labeled oleic acids. The oleic acid uptake was increased about 33% by Ulk1 knockdown and reduced about 28% by Ulk2 knockdown (Fig. 5D). This result suggests that Ulk1 and Ulk2 have opposing effects on fatty acid uptake by adipocytes. Atg5 knockdown increased fatty acid uptake, indicating that Ulk2 and Atg5 have opposing functions in the regulation of fatty acid uptake. Collectively, these results suggest that Ulk1 knockdown might make 3T3-L1 cells to accumulate triglycerides by increasing fatty acid synthesis and uptake and decreasing fatty acid oxidation and lipolysis.
Ulk1 and Ulk2 have opposing effects on insulin-stimulated glucose uptake
Another key factor that can contribute to adipogenesis is a change in glucose metabolism. Adipocytes have a capacity to uptake glucose and convert it into triglycerides for energy storage. By monitoring the cellular uptake of isotope-labeled 2-deoxyglucoe (2-DG), an analog of glucose, we analyzed how Ulk1 and Ulk2 affect glucose uptake. We found that knockdown of Ulk1, Ulk2, or Atg5 enhanced the basal rate of 2-DG uptake (Fig. 6A). The increase was accompanied by upregulation of glucose transporter 1 (SLC2A1/GLUT1) expression, which is responsible for basal glucose uptake (Fig. 6B). There was no significant difference in the 2-DG uptake rates between the shRNA-transduced adipocytes, suggesting that all of Ulk1, Ulk2, and Atg5 might have a negative effect on glucose uptake at basal state in 3T3-L1 adipocytes. On the other hand, insulin-stimulated 2-DG uptake was increased 40% in Ulk1-silenced adipocytes but reduced 28% and 40% in Ulk2 and Atg5-silenced adipocytes, respectively, compared with control cells (Fig. 6C). Ulk1 knockdown increased the expression level of SLC2A4, the glucose transporter responsible for insulin-stimulated glucose uptake, as well as INSR and IRS1 that are the critical factors for activation of AKT (Fig. 6B). Such increases were not observed in Ulk2- or Atg5-silenced adipocytes. AKT activation is a key event for insulin-stimulated glucose uptake.52-54 As shown in Figure 3, AKT activity was sustained highly during a long-term insulin treatment in Ulk1-silenced adipocytes. This result is consistent with a negative role of Ulk1 in the regulation of the insulin-AKT-SLC2A4 pathway. Thus, the increase of the insulin-responsive glucose uptake via insulin-AKT signaling and the subsequent conversion of glucose into triglycerides might have positively contributed to adipogenesis in Ulk1-silenced 3T3-L1 cells.

Figure 6.Ulk1 and Ulk2 have opposing effects on insulin-stimulated glucose uptake. (A) Knockdown of Ulk1, Ulk2, and Atg5 in 3T3-L1 adipocytes (day 8) enhanced basal glucose uptake. Values are mean ± SD from 3 independent experiments. (B) Western blot analysis of protein expression in cells from (A). (C) Knockdown of Ulk1 in 3T3-L1 adipocytes (day 8) enhanced insulin-stimulated glucose uptake, whereas knockdown of Ulk2 or Atg5 showed opposing effects. Glucose uptake rate was indirectly measured using 2-DG, an analog of glucose. Values are mean ± SD **P < 0.01 relative to control cells. (D) Dual functional model for ULK1 in the regulation of metabolism in adipocytes.
Discussion
In this study, we identified that Ulk1 regulates lipid and glucose metabolism in adipocytes distinctly from other autophagy genes. We found that all the tested autophagy genes, including Ulk2, Atg5, Becn1, Atg13, and Rb1cc1, except Ulk1 are important for adipogenesis in 3T3-L1 cells (Fig. 1). Since Ulk1 knockdown could still suppress basal and MTORC1 inhibition-induced autophagy in 3T3-L1 adipocytes (Fig. 2), the distinct effect of Ulk1 knockdown on adipogenesis might not be due to autophagy inhibition. However, we do not rule out the possibility that an Ulk1-independent autophagy might exist and play a role in adipogenesis. Supporting this possibility, we could still observe autophagosomes and a moderate increase in MAP1LC3 flux in Ulk1-silenced adipocytes (Fig. 2). This observation is consistent with a recent study showing that MAP1LC3-II and autophagosome formation could still occur in ulk1-deficient cells.55 Furthermore, knockdown of both Ulk1 and Atg5 suppressed adipogenesis to a similar extent as Atg5 knockdown alone (Fig. S1), suggesting that Atg5-dependent autophagy, but not Ulk1-dependent autophagy, might be critical for adipogenesis.
Alternatively, the distinct effect of Ulk1 knockdown might be due to a dual function for Ulk1 in the regulation of adipogenesis in adipocytes (Fig. 6D). ULK1 may positively contribute to adipogenesis via autophagy as played by other autophagy proteins, whereas ULK1 may negatively contribute to adipogenesis in a manner dependent upon IRS1 and AKT or metabolic enzymes. Such a negative function of ULK1 might be beneficial for rapid metabolic adjustment that would not be possible through autophagy regulation. The dual functional model is supported by the finding that the autophagy-defective 3T3-L1 cells could be fully differentiated in the presence of troglitazone. This implies that adipogenesis could occur in autophagy-defective 3T3-L1 cells if PPARG is activated. Knockdown of Ulk2 or Atg5 suppressed PPARG expression, suggesting that Atg5 and Ulk2 are critical factors in the PPARG pathway. On the other hand, Ulk1 knockdown did not reduce PPARG level, suggesting that ULK1 might not function in the PPARG pathway.
The dual functional model for ULK1 is also supported by our analysis of fatty acid metabolism. We found that Ulk1 knockdown has opposing effects on fatty acid oxidation from Ulk2 or Atg5 knockdown (Fig. 5). The opposing effects in fatty acid oxidation occurred despite the similar accumulation of dysfunctional mitochondria and the autophagy inhibition induced by knockdown of Ulk1, Ulk2, or Atg5 (Fig. 4). The dual functional model could be explained by a compensatory effect by ULK2 that is upregulated in Ulk1-silenced adipocytes. This possibility is supported by the finding that knocking down both Ulk1 and Ulk2 suppressed adipogenesis to a similar extent as Ulk2 knockdown alone (Fig. 1D–H). However, since autophagy was suppressed in Ulk1-silenced cells, Ulk2 does not appear to have fully compensated Ulk1 functions.
The reduction in the mitochondrial oxygen consumption, despite the high capacity for fatty acid oxidation in Ulk2- or Atg5-silenced adipocytes, might be in large part related to the reduction of lipolysis in those cells (Fig. 5B). The fatty acid oxidation was measured by adding isotope-labeled oleic acids to medium and analyzing the production of CO2 from the oleic acid oxidation specifically. The increase in the mitochondrial content and a subsequent increase in the mitochondrial enzymes involved in fatty acid oxidation might have contributed to the cellular capacity to oxidize free fatty acids in Ulk2- or Atg5-deficient adipocytes. On the other hand, the oxygen consumption rate was measured at basal state without adding free fatty acids, which may mostly depend on intracellular free fatty acids that become available from lipolysis of trigylcerides. Knockdown of Ulk2 or Atg5 significantly reduced lipolysis thereby decreasing free fatty acids available intracellularly for mitochondrial oxidation (Fig. 5B). Fatty acid oxidation could also be affected by fatty acid uptake. In Atg5-silenced adipocytes, the increased oxidation of oleic acids might be at least in part attributed to upregulation of fatty acid uptake (Fig. 5A and D).
Ulk1 knockdown led to a sustained activation of insulin-stimulated phosphorylation of AKT (Fig. 3A), the protein kinase playing an important role in SLC2A4 translocation to plasma membrane.52-54 Such a sustained upregulation of AKT phosphorylation was accompanied by an increase in the insulin-responsive glucose uptake by Ulk1-silenced adipocytes (Fig. 5B and C). Since glucose can be converted into triglycerides in adipocytes, the sustained activation of AKT and the accompanied increase in the insulin-responsive glucose uptake could contribute to adipogenesis in Ulk1-silenced adipocytes. Glucose uptake in adipocytes is also regulated by other factors, such as osmotic stress in adipocytes.56,57 One of the key regulators of the osmotic stress-responsive glucose uptake is PTK2/FAK (protein tyrosine kinase 2).56 PTK2 interacts with RB1CC1, a binding protein of ULK1 and ULK2.33 This implies a potential, interesting link between the ULK complexes and the insulin-responsive glucose uptake via RB1CC1.
Our study suggests that Ulk1 inhibition might have both beneficial and harmful effects on insulin-responsive metabolism in 3T3-L1 adipocytes. For the beneficial side, Ulk1 inhibition would increase insulin-responsive glucose uptake and lipid accumulation in adipocytes. For the harmful side, Ulk1 inhibition would increase oxidative stress that can contribute to insulin resistance development in adipocytes. The harmful effect might be shared with other autophagy proteins. If we understand more clearly how Ulk1 inhibition could contribute to the beneficial metabolic outcomes, the knowledge might contribute to better understanding of energy metabolism in adipocytes and designing a better therapeutic strategy for diabetes and obesity. Defining more clearly the distinct functions of Ulk1 and ULK2 in cellular metabolism might provide important insight into how the protein kinases have evolved to acquire their specific cellular functions in the autophagy and non-autophagy pathways.
Materials and Methods
Antibodies
Primary antibodies were from the following sources: anti-MAP1LC3 (5F10) from Nanotools; anti- SQSTM1/p62 (610832) from BD Biosciences; anti-INSR (3025), anti-IRS1 (2382), anti-AKT (9272), anti-phospho-AKT (9271), RPS6KB1/S6K1 (9202), anti-phospho-RPS6KB1/S6K1 (9205), and anti-MAPK14 (9212) from Cell Signaling Technology; anti-CEBPA (sc-61), anti-PPARG (sc-7196), anti-GAPDH (sc-25778), and anti-TUBA1 (sc-12462) from Santa Cruz Biotechnology; anti-ATG5 antibody (110-53818) and anti-MAP1LC3 (100-2220) from Novus Biologicals; anti-ULK1 (A7481) from Sigma-Aldrich; anti-ACTB (612657) from BD Biosciences; anti-SLC2A4/GLUT4 (AB1346) from Millipore; anti-SLC2A1/GLUT1 antibody from Dr Xiaoli Chen (University of Minnesota).
Chemicals
Chemicals were purchased from the following sources: rapamycin (EMD Chemicals, 553210); hydroxychloroquine (HCQ) (H0915), insulin (I6634), methylisobutylxanthine (I5879), dexamethasone (D4902), troglitazone (T2573), Oil Red O (0625), pepstatin A (P5318), cytochalasin B (C6762), puromycin (82595), forskolin (F3917), and E-64 (E3132) from Sigma-Aldrich; DAPI (D1306), chloromethyl 2′,7′-dichlorodihydrofluorescein diacetate (CM-H2DCFDA) (C6827), TRIzol reagent (15596-018), and APO-BrdU Terminal deoxynucleotidyl transferase dUTP nick end labeling (TUNEL) assay kit (A35125 and A35126) from Invitrogen; EZ-link Biotin Hydrazide (21339) from Pierce; NEFA-HR (999-34691, 995-34791, 991-34891, and 993-35191) from Wako Diagnostics; RNase free DNase I (Ambion, AM2222), iScript cDNA Synthesis Kit (170-8891) and iQ SYBR Green Supermix (170-8880) from Bio-Rad; glutaraldehyde, sodium cacodylate, osmium tetroxide, tannic acid, 2:1 ethanol: Embed 812 resin, and 20-mm gelatin capsules from Electron Microscopy Sciences; mouse TNF/TNFα (5178) from Cell Signaling Tech.
Lentiviral preparation, viral infection, and stable cell line generation
pLKO.1 clones for GFP, scrambled sequence, Ulk1, Ulk2, and Atg5 shRNAs were obtained from Open Biosystems. The shRNA sequences are listed in Table S1. Stable transduction of 3T3-L1 preadipocytes with lentiviral shRNA was performed as described previously.17
Adipocyte differentiation, lipid staining, and triglyceride measurements
3T3-L1 preadipocytes were differentiated into adipocytes as described previously.37 In brief, 3T3-L1 cells were treated with methylisobutylxanthine (0.5 mM), dexamethasone (0.25 μM), and insulin (170 μM) 2 d after cells were confluent. Two days after the treatment, the medium was replaced by medium containing only insulin. Insulin was removed after 2 more days. Differentiated adipocytes were maintained in DMEM with 10% fetal bovine serum. For experiments requiring full differentiation, we added 5 μM troglitazone to the differentiation-inducing medium during the first two days following the procedure described previously.39,43-46 To quantitatively assess the extent of differentiation, cells were stained with Oil Red O. Oil Red O was extracted from cells with isopropanol. Optical density was measured at a wavelength of 490 nm. Triglyceride levels were normalized by protein concentration.
Autophagy assay
shRNA-transduced preadipocytes were plated on glass coverslips and differentiated into adipocytes. Autophagy was induced by 100 nM rapamycin in the presence or absence of pepstatin A and E-64 (10 μg/ml each). After 5 h, cells were fixed with formaldehyde, permeabilized using 1% Triton X-100, and stained with anti-MAP1LC3 antibody (Novus Biological). Cells were visualized under an Olympus Fluoview 1000 IX2 inverted confocal microscope (Olympus) or a Deltavision Personnel DV microscope (Applied Precision). Multiple fields were randomly collected. Cell lysates were also obtained from the shRNA-transduced adipocytes and the levels of MAP1LC3-I, MAP1LC3-II and SQSTM1/p62 were analyzed by western blotting.
Lipolysis assay
3T3-L1 adipocytes were washed with phosphate-buffered saline (PBS) and incubated at 37 °C in Krebs–Ringer’s HEPES (KRH, 130 mM NaCl, 5 mM KCl, 1.3 mM CaCl2, 1.3 mM MgSO4, and 25 mM HEPES pH 7.4) supplemented with 2% fatty acid-free BSA and 5 mM glucose with or without 40 μM forskolin. The culture medium was collected after 1 h of incubation. The content of non-esterifed fatty acids was determined using the NEFA-HR assay kit according to the manufacturer’s instruction.
Fatty acid β-oxidation
shRNA-transduced adipocytes were starved of serum for 2 h, and subsequently incubated in DMEM containing 5.4 mM glucose, 4 mM glutamine, 1% fatty acid-free BSA, and 0.25 mM oleate. β-oxidation was initiated upon addition of 0.2 mM [1-14C]-oleic acid (0.8 μCi/ml) buffered with 1% fatty acid-free BSA and incubated for 90 min at 37 °C and 5% CO2.46 Each well was covered immediately by a piece of Whatman paper. After incubation, 150 μl of 3 M NaOH was dropped on the paper, and 70% perchloric acid was added to each well. CO2 trapped on filter membrane from each well was analyzed by liquid scintillation and 14CO2 content was measured by a scintillation counter (Beckman).
Analysis of fatty acid uptake
Fatty acud uptake measurement was conducted following the procedured described previously.46 shRNA-transduced adipocytes were preincubated for 3 h in KRH buffer supplemented with 5 mM glucose. Fatty acid uptake was initiated by incubating cells with 50 μM [3H]-oleic acid bound to fatty acid-free BSA in a ratio adjusted to generate a free fatty acid concentraiton of 5 nM. The ratio of FA/BSA was calculated based on long-chain fatty acid binding constants for BSA as described previously.58 After 5 min, cells were washed 3 times in ice-cold KRH containing 0.1% BSA and 200 uM phloretin. Cells were then incubated at RT in 0.5% SDS for 30 min, and the radioactive fatty acids incorporated into cells were determined by liquid scintillation counting.
2-deoxyglucose uptake assay
Adipocytes were serum-starved overnight in KRH buffer supplemented with 0.5% BSA and 2 mM sodium pyruvate and incubated either with or without 100 nM insulin for 1 h at 37 °C. Glucose uptake was initiated by adding [3H]-2-deoxy-D-glucose (PerkinElmer Life and Analytical Sciences) to a final concentration of 100 μM at 37 °C. After 5 min, 2-deoxyglucose uptake was terminated by washing with ice-cold KRH buffer 3 times. Cells were solubilized with 0.8 ml of KRH buffer containing 1% Triton X-100. The incorporated radioactivity was determined by scintillation counting. Nonspecific 2-deoxyglucose uptake was measured in the presence of 20 μM cytochalasin B (Sigma-Aldrich) and subtracted from the total glucose uptake rate.
Other experimental procedures
Measurements of mitochondrial respiration, ATP production rate, intracellular ROS, matrix superoxide from isolated mitochondria, protein carbonylation, and mitochondrial DNA content, real-time RT-PCR, and electron microscopy experiments are described in detail in the Supplemental Information.
Statistical analysis
Data are presented as means ± SD (standard deviation). Statistical significance was determined using the 2-tailed Student t test assuming unequal variances using the Prism 6 (GraphPad Software Inc.).
Supplementary Material
Acknowledgments
We thank J Curtis, R Foncea, S Lobo, AJ Lange, and Kim lab members for helpful discussion; C Gename at the Minnesota Obesity Center for lentivirus preparation; the University Image Center for confocal microscope; the Ultrastructural Pathology Service Core for EM images. This study was supported by Korea Food Research Institute E0121102 (to CHJ and TYH), P30-DK050456, R01AG20866 (to EA), DK084669 (to DAB), ADA 7-07-CD-08 and 7-12-BS-093, DK072004, GM097057 and AG039758 (to DHK).
Glossary
Abbreviations:
- ACACA
acetyl-CoA carboxylase alpha
- ACACB
acetyl-CoA carboxylase beta
- AMPK
AMP-activated protein kinase
- ATG5
autophagy-related 5
- ATG7
autophagy-related 7
- ATG13
autophagy-related 13
- BAT
brown adipose tissue
- BECN1
Beclin 1, autophagy related
- BNIP3
BCL2/adenovirus E1B 19 kDa interacting protein 3
- BSA
bovine serum albumin
- CEBPA
CCAAT/enhancer binding protein (C/EBP), alpha
- EM
electron microscopy
- FA
fatty acids
- FASN
fatty acid synthase
- HCQ
hydroxychloroquine
- INSR
insulin receptor
- IRS1
insulin receptor substrate 1
- KLH
Krebs–Ringer’s HEPES
- MAPK14
mitogen-activated protein kinase 14
- MAP1LC3
microtubule-associated protein 1 light chain 3
- mt-Co2
mitochondrially encoded cytochrome c oxidase II
- mtDNA
mitochondrial DNA
- MTOR
mechanistic target of rapamycin
- MTORC1
MTOR complex 1
- PPARG
peroxisome proliferation-activated receptor gamma
- PTK2
protein tyrosine kinase 2
- Rb1cc1
Rb1-inducible coiled-coil 1
- ROS
reactive oxygen species
- RPS6KB1
ribosomal protein S6 kinase, 70 kDa, polypeptide 1
- RT-PCR
reverse transcription polymerase chain reaction
- SLC2A1
solute carrier family 2 (facilitated glucose transporter) member 1
- SLC2A4
solute carrier family 2 (facilitated glucose transporter) member 4
- shRNA
small hairpin RNA
- SQSTM1
sequestosome 1
- 2-DG
2-deoxy-D-glucose
- ULK1
unc-51 like autophagy activating kinase 1
- ULK2
unc-51 like autophagy activating kinase 2
- WAT
white adipose tissue
Disclosure of Potential Conflicts of Interest
No potential conflicts of interest were disclosed.
Supplemental Materials
Supplemental materials may be found here: www.landesbioscience.com/journals/autophagy/article/26563
Footnotes
Previously published online: www.landesbioscience.com/journals/autophagy/article/26563
References
- 1.Guilherme AVJ, Virbasius JV, Puri V, Czech MP. Adipocyte dysfunctions linking obesity to insulin resistance and type 2 diabetes. Nat Rev Mol Cell Biol. 2008;9:367–77. doi: 10.1038/nrm2391. [DOI] [PMC free article] [PubMed] [Google Scholar]
- 2.DeClercq V, Taylor C, Zahradka P. Adipose tissue: the link between obesity and cardiovascular disease. Cardiovasc Hematol Disord Drug Targets. 2008;8:228–37. doi: 10.2174/187152908785849080. [DOI] [PubMed] [Google Scholar]
- 3.Goldman S, Zhang Y, Jin S. Autophagy and adipogenesis: implications in obesity and type II diabetes. Autophagy. 2010;6:179–81. doi: 10.4161/auto.6.1.10814. [DOI] [PMC free article] [PubMed] [Google Scholar]
- 4.Kovsan J, Blüher M, Tarnovscki T, Klöting N, Kirshtein B, Madar L, Shai I, Golan R, Harman-Boehm I, Schön MR, et al. Altered autophagy in human adipose tissues in obesity. J Clin Endocrinol Metab. 2011;96:E268–77. doi: 10.1210/jc.2010-1681. [DOI] [PubMed] [Google Scholar]
- 5.Ost A, Svensson K, Ruishalme I, Brännmark C, Franck N, Krook H, Sandström P, Kjolhede P, Strålfors P. Attenuated mTOR signaling and enhanced autophagy in adipocytes from obese patients with type 2 diabetes. Mol Med. 2010;16:235–46. doi: 10.2119/molmed.2010.00023. [DOI] [PMC free article] [PubMed] [Google Scholar]
- 6.Singh R, Xiang Y, Wang Y, Baikati K, Cuervo AM, Luu YK, Tang Y, Pessin JE, Schwartz GJ, Czaja MJ. Autophagy regulates adipose mass and differentiation in mice. J Clin Invest. 2009;119:3329–39. doi: 10.1172/JCI39228. [DOI] [PMC free article] [PubMed] [Google Scholar]
- 7.Zhang YGS, Goldman S, Baerga R, Zhao Y, Komatsu M, Jin S. Adipose-specific deletion of autophagy-related gene 7 (atg7) in mice reveals a role in adipogenesis. Proc Natl Acad Sci U S A. 2009;106:19860–5. doi: 10.1073/pnas.0906048106. [DOI] [PMC free article] [PubMed] [Google Scholar]
- 8.Zhou L, Zhang J, Fang Q, Liu M, Liu X, Jia W, Dong LQ, Liu F. Autophagy-mediated insulin receptor down-regulation contributes to endoplasmic reticulum stress-induced insulin resistance. Mol Pharmacol. 2009;76:596–603. doi: 10.1124/mol.109.057067. [DOI] [PMC free article] [PubMed] [Google Scholar]
- 9.Baerga R, Zhang Y, Chen PH, Goldman S, Jin S. Targeted deletion of autophagy-related 5 (atg5) impairs adipogenesis in a cellular model and in mice. Autophagy. 2009;5:1118–30. doi: 10.4161/auto.5.8.9991. [DOI] [PMC free article] [PubMed] [Google Scholar]
- 10.Seale P, Conroe HM, Estall J, Kajimura S, Frontini A, Ishibashi J, Cohen P, Cinti S, Spiegelman BM. Prdm16 determines the thermogenic program of subcutaneous white adipose tissue in mice. J Clin Invest. 2011;121:96–105. doi: 10.1172/JCI44271. [DOI] [PMC free article] [PubMed] [Google Scholar]
- 11.Ohno H, Shinoda K, Spiegelman BM, Kajimura S. PPARγ agonists induce a white-to-brown fat conversion through stabilization of PRDM16 protein. Cell Metab. 2012;15:395–404. doi: 10.1016/j.cmet.2012.01.019. [DOI] [PMC free article] [PubMed] [Google Scholar]
- 12.Boström P, Wu J, Jedrychowski MP, Korde A, Ye L, Lo JC, Rasbach KA, Boström EA, Choi JH, Long JZ, et al. A PGC1-α-dependent myokine that drives brown-fat-like development of white fat and thermogenesis. Nature. 2012;481:463–8. doi: 10.1038/nature10777. [DOI] [PMC free article] [PubMed] [Google Scholar]
- 13.Nishida Y, Arakawa S, Fujitani K, Yamaguchi H, Mizuta T, Kanaseki T, Komatsu M, Otsu K, Tsujimoto Y, Shimizu S. Discovery of Atg5/Atg7-independent alternative macroautophagy. Nature. 2009;461:654–8. doi: 10.1038/nature08455. [DOI] [PubMed] [Google Scholar]
- 14.Chang YY, Neufeld TP. An Atg1/Atg13 complex with multiple roles in TOR-mediated autophagy regulation. Mol Biol Cell. 2009;20:2004–14. doi: 10.1091/mbc.E08-12-1250. [DOI] [PMC free article] [PubMed] [Google Scholar]
- 15.Ganley IG, Lam H, Wang J, Ding X, Chen S, Jiang X. ULK1.ATG13.FIP200 complex mediates mTOR signaling and is essential for autophagy. J Biol Chem. 2009;284:12297–305. doi: 10.1074/jbc.M900573200. [DOI] [PMC free article] [PubMed] [Google Scholar]
- 16.Hosokawa N, Hara T, Kaizuka T, Kishi C, Takamura A, Miura Y, Iemura S, Natsume T, Takehana K, Yamada N, et al. Nutrient-dependent mTORC1 association with the ULK1-Atg13-FIP200 complex required for autophagy. Mol Biol Cell. 2009;20:1981–91. doi: 10.1091/mbc.E08-12-1248. [DOI] [PMC free article] [PubMed] [Google Scholar]
- 17.Jung CH, Jun CB, Ro SH, Kim YM, Otto NM, Cao J, Kundu M, Kim DH. ULK-Atg13-FIP200 complexes mediate mTOR signaling to the autophagy machinery. Mol Biol Cell. 2009;20:1992–2003. doi: 10.1091/mbc.E08-12-1249. [DOI] [PMC free article] [PubMed] [Google Scholar]
- 18.Kim J, Kundu M, Viollet B, Guan KL. AMPK and mTOR regulate autophagy through direct phosphorylation of Ulk1. Nat Cell Biol. 2011;13:132–41. doi: 10.1038/ncb2152. [DOI] [PMC free article] [PubMed] [Google Scholar]
- 19.Chan EY, Kir S, Tooze SA. siRNA screening of the kinome identifies ULK1 as a multidomain modulator of autophagy. J Biol Chem. 2007;282:25464–74. doi: 10.1074/jbc.M703663200. [DOI] [PubMed] [Google Scholar]
- 20.Lee JW, Park S, Takahashi Y, Wang HG. The association of AMPK with ULK1 regulates autophagy. PLoS One. 2010;5:e15394. doi: 10.1371/journal.pone.0015394. [DOI] [PMC free article] [PubMed] [Google Scholar]
- 21.Egan DF, Shackelford DB, Mihaylova MM, Gelino S, Kohnz RA, Mair W, Vasquez DS, Joshi A, Gwinn DM, Taylor R, et al. Phosphorylation of ULK1 (hATG1) by AMP-activated protein kinase connects energy sensing to mitophagy. Science. 2011;331:456–61. doi: 10.1126/science.1196371. [DOI] [PMC free article] [PubMed] [Google Scholar]
- 22.Lin SY, Li TY, Liu Q, Zhang C, Li X, Chen Y, Zhang SM, Lian G, Liu Q, Ruan K, et al. GSK3-TIP60-ULK1 signaling pathway links growth factor deprivation to autophagy. Science. 2012;336:477–81. doi: 10.1126/science.1217032. [DOI] [PubMed] [Google Scholar]
- 23.Kundu MLT, Lindsten T, Yang CY, Wu J, Zhao F, Zhang J, Selak MA, Ney PA, Thompson CB. Ulk1 plays a critical role in the autophagic clearance of mitochondria and ribosomes during reticulocyte maturation. Blood. 2008;112:1493–502. doi: 10.1182/blood-2008-02-137398. [DOI] [PMC free article] [PubMed] [Google Scholar]
- 24.Fujita N, Itoh T, Omori H, Fukuda M, Noda T, Yoshimori T. The Atg16L complex specifies the site of LC3 lipidation for membrane biogenesis in autophagy. Mol Biol Cell. 2008;19:2092–100. doi: 10.1091/mbc.E07-12-1257. [DOI] [PMC free article] [PubMed] [Google Scholar]
- 25.Itakura E, Mizushima N. Characterization of autophagosome formation site by a hierarchical analysis of mammalian Atg proteins. Autophagy. 2010;6:764–76. doi: 10.4161/auto.6.6.12709. [DOI] [PMC free article] [PubMed] [Google Scholar]
- 26.Matsunaga K, Morita E, Saitoh T, Akira S, Ktistakis NT, Izumi T, Noda T, Yoshimori T. Autophagy requires endoplasmic reticulum targeting of the PI3-kinase complex via Atg14L. J Cell Biol. 2010;190:511–21. doi: 10.1083/jcb.200911141. [DOI] [PMC free article] [PubMed] [Google Scholar]
- 27.Polson HE, de Lartigue J, Rigden DJ, Reedijk M, Urbé S, Clague MJ, Tooze SA. Mammalian Atg18 (WIPI2) localizes to omegasome-anchored phagophores and positively regulates LC3 lipidation. Autophagy. 2010;6:506–22. doi: 10.4161/auto.6.4.11863. [DOI] [PubMed] [Google Scholar]
- 28.Young AR, Chan EY, Hu XW, Köchl R, Crawshaw SG, High S, Hailey DW, Lippincott-Schwartz J, Tooze SA. Starvation and ULK1-dependent cycling of mammalian Atg9 between the TGN and endosomes. J Cell Sci. 2006;119:3888–900. doi: 10.1242/jcs.03172. [DOI] [PubMed] [Google Scholar]
- 29.Webber JL, Tooze SA. Coordinated regulation of autophagy by p38alpha MAPK through mAtg9 and p38IP. EMBO J. 2010;29:27–40. doi: 10.1038/emboj.2009.321. [DOI] [PMC free article] [PubMed] [Google Scholar]
- 30.Jung CHRS, Ro SH, Cao J, Otto NM, Kim DH. mTOR regulation of autophagy. FEBS Lett. 2010;584:1287–95. doi: 10.1016/j.febslet.2010.01.017. [DOI] [PMC free article] [PubMed] [Google Scholar]
- 31.Mercer CAKA, Kaliappan A, Dennis PB. A novel, human Atg13 binding protein, Atg101, interacts with ULK1 and is essential for macroautophagy. Autophagy. 2009;5:649–62. doi: 10.4161/auto.5.5.8249. [DOI] [PubMed] [Google Scholar]
- 32.Hosokawa N, Sasaki T, Iemura S, Natsume T, Hara T, Mizushima N. Atg101, a novel mammalian autophagy protein interacting with Atg13. Autophagy. 2009;5:973–9. doi: 10.4161/auto.5.7.9296. [DOI] [PubMed] [Google Scholar]
- 33.Hara T, Takamura A, Kishi C, Iemura S, Natsume T, Guan JL, Mizushima N. FIP200, a ULK-interacting protein, is required for autophagosome formation in mammalian cells. J Cell Biol. 2008;181:497–510. doi: 10.1083/jcb.200712064. [DOI] [PMC free article] [PubMed] [Google Scholar]
- 34.Kundu M, Lindsten T, Yang CY, Wu J, Zhao F, Zhang J, Selak MA, Ney PA, Thompson CB. Ulk1 plays a critical role in the autophagic clearance of mitochondria and ribosomes during reticulocyte maturation. Blood. 2008;112:1493–502. doi: 10.1182/blood-2008-02-137398. [DOI] [PMC free article] [PubMed] [Google Scholar]
- 35.Lee EJ, Tournier C. The requirement of uncoordinated 51-like kinase 1 (ULK1) and ULK2 in the regulation of autophagy. Autophagy. 2011;7:689–95. doi: 10.4161/auto.7.7.15450. [DOI] [PMC free article] [PubMed] [Google Scholar]
- 36.Cheong H, Lindsten T, Wu J, Lu C, Thompson CB. Ammonia-induced autophagy is independent of ULK1/ULK2 kinases. Proc Natl Acad Sci U S A. 2011;108:11121–6. doi: 10.1073/pnas.1107969108. [DOI] [PMC free article] [PubMed] [Google Scholar]
- 37.Student AK, Hsu RY, Lane MD. Induction of fatty acid synthetase synthesis in differentiating 3T3-L1 preadipocytes. J Biol Chem. 1980;255:4745–50. [PubMed] [Google Scholar]
- 38.Tontonoz P, Spiegelman BM. Fat and beyond: the diverse biology of PPARgamma. Annu Rev Biochem. 2008;77:289–312. doi: 10.1146/annurev.biochem.77.061307.091829. [DOI] [PubMed] [Google Scholar]
- 39.Kim JE, Chen J. regulation of peroxisome proliferator-activated receptor-gamma activity by mammalian target of rapamycin and amino acids in adipogenesis. Diabetes. 2004;53:2748–56. doi: 10.2337/diabetes.53.11.2748. [DOI] [PubMed] [Google Scholar]
- 40.Dunlop EA, Hunt DK, Acosta-Jaquez HA, Fingar DC, Tee AR. ULK1 inhibits mTORC1 signaling, promotes multisite Raptor phosphorylation and hinders substrate binding. Autophagy. 2011;7:737–47. doi: 10.4161/auto.7.7.15491. [DOI] [PMC free article] [PubMed] [Google Scholar]
- 41.Jung CH, Seo M, Otto NM, Kim D-H. ULK1 inhibits the kinase activity of mTORC1 and cell proliferation. Autophagy. 2011;7:1212–21. doi: 10.4161/auto.7.10.16660. [DOI] [PMC free article] [PubMed] [Google Scholar]
- 42.Lee SB, Kim S, Lee J, Park J, Lee G, Kim Y, Kim JM, Chung J. ATG1, an autophagy regulator, inhibits cell growth by negatively regulating S6 kinase. EMBO Rep. 2007;8:360–5. doi: 10.1038/sj.embor.7400917. [DOI] [PMC free article] [PubMed] [Google Scholar]
- 43.Tontonoz P, Hu E, Spiegelman BM. Stimulation of adipogenesis in fibroblasts by PPAR gamma 2, a lipid-activated transcription factor. Cell. 1994;79:1147–56. doi: 10.1016/0092-8674(94)90006-X. [DOI] [PubMed] [Google Scholar]
- 44.Curtis JM, Grimsrud PA, Wright WS, Xu X, Foncea RE, Graham DW, Brestoff JR, Wiczer BM, Ilkayeva O, Cianflone K, et al. Downregulation of adipose glutathione S-transferase A4 leads to increased protein carbonylation, oxidative stress, and mitochondrial dysfunction. Diabetes. 2010;59:1132–42. doi: 10.2337/db09-1105. [DOI] [PMC free article] [PubMed] [Google Scholar]
- 45.Tafuri SR. Troglitazone enhances differentiation, basal glucose uptake, and Glut1 protein levels in 3T3-L1 adipocytes. Endocrinology. 1996;137:4706–12. doi: 10.1210/en.137.11.4706. [DOI] [PubMed] [Google Scholar]
- 46.Lobo S, Wiczer BM, Smith AJ, Hall AM, Bernlohr DA. Fatty acid metabolism in adipocytes: functional analysis of fatty acid transport proteins 1 and 4. J Lipid Res. 2007;48:609–20. doi: 10.1194/jlr.M600441-JLR200. [DOI] [PubMed] [Google Scholar]
- 47.Zhang HH, Huang J, Düvel K, Boback B, Wu S, Squillace RM, Wu CL, Manning BD. Insulin stimulates adipogenesis through the Akt-TSC2-mTORC1 pathway. PLoS One. 2009;4:e6189. doi: 10.1371/journal.pone.0006189. [DOI] [PMC free article] [PubMed] [Google Scholar]
- 48.Kim JAWY, Wei Y, Sowers JR. Role of mitochondrial dysfunction in insulin resistance. Circ Res. 2008;102:401–14. doi: 10.1161/CIRCRESAHA.107.165472. [DOI] [PMC free article] [PubMed] [Google Scholar]
- 49.Carlson CJ, Koterski S, Sciotti RJ, Poccard GB, Rondinone CM. Enhanced basal activation of mitogen-activated protein kinases in adipocytes from type 2 diabetes: potential role of p38 in the downregulation of GLUT4 expression. Diabetes. 2003;52:634–41. doi: 10.2337/diabetes.52.3.634. [DOI] [PubMed] [Google Scholar]
- 50.Carlson CJ, Rondinone CM. Pharmacological inhibition of p38 MAP kinase results in improved glucose uptake in insulin-resistant 3T3-L1 adipocytes. Metabolism. 2005;54:895–901. doi: 10.1016/j.metabol.2005.02.003. [DOI] [PubMed] [Google Scholar]
- 51.Singh R, Kaushik S, Wang Y, Xiang Y, Novak I, Komatsu M, Tanaka K, Cuervo AM, Czaja MJ. Autophagy regulates lipid metabolism. Nature. 2009;458:1131–5. doi: 10.1038/nature07976. [DOI] [PMC free article] [PubMed] [Google Scholar]
- 52.Cong LN, Chen H, Li Y, Zhou L, McGibbon MA, Taylor SI, Quon MJ. Physiological role of Akt in insulin-stimulated translocation of GLUT4 in transfected rat adipose cells. Mol Endocrinol. 1997;11:1881–90. doi: 10.1210/me.11.13.1881. [DOI] [PubMed] [Google Scholar]
- 53.Kohn AD, Summers SA, Birnbaum MJ, Roth RA. Expression of a constitutively active Akt Ser/Thr kinase in 3T3-L1 adipocytes stimulates glucose uptake and glucose transporter 4 translocation. J Biol Chem. 1996;271:31372–8. doi: 10.1074/jbc.271.49.31372. [DOI] [PubMed] [Google Scholar]
- 54.Tanti JF, Grillo S, Grémeaux T, Coffer PJ, Van Obberghen E, Le Marchand-Brustel Y. Potential role of protein kinase B in glucose transporter 4 translocation in adipocytes. Endocrinology. 1997;138:2005–10. doi: 10.1210/en.138.5.2005. [DOI] [PubMed] [Google Scholar]
- 55.Alers S, Löffler AS, Paasch F, Dieterle AM, Keppeler H, Lauber K, Campbell DG, Fehrenbacher B, Schaller M, Wesselborg S, et al. Atg13 and FIP200 act independently of Ulk1 and Ulk2 in autophagy induction. Autophagy. 2011;7:1423–33. doi: 10.4161/auto.7.12.18027. [DOI] [PMC free article] [PubMed] [Google Scholar]
- 56.Chen D, Elmendorf JS, Olson AL, Li X, Earp HS, Pessin JE. Osmotic shock stimulates GLUT4 translocation in 3T3L1 adipocytes by a novel tyrosine kinase pathway. J Biol Chem. 1997;272:27401–10. doi: 10.1074/jbc.272.43.27401. [DOI] [PubMed] [Google Scholar]
- 57.Ueno E, Haruta T, Uno T, Usui I, Iwata M, Takano A, Kawahara J, Sasaoka T, Ishibashi O, Kobayashi M. Potential role of Gab1 and phospholipase C-gamma in osmotic shock-induced glucose uptake in 3T3-L1 adipocytes. Horm Metab Res. 2001;33:402–6. doi: 10.1055/s-2001-16227. [DOI] [PubMed] [Google Scholar]
- 58.Richieri GV, Anel A, Kleinfeld AM. Interactions of long-chain fatty acids and albumin: determination of free fatty acid levels using the fluorescent probe ADIFAB. Biochemistry. 1993;32:7574–80. doi: 10.1021/bi00080a032. [DOI] [PubMed] [Google Scholar]
Associated Data
This section collects any data citations, data availability statements, or supplementary materials included in this article.